Remaking the Apartheid City* Presentation of Data: Durban, Draft, May 2007
|
|
|
- Edith Houston
- 5 years ago
- Views:
Transcription
1 Remaking the Apartheid City* Presentation of Data: Durban, Draft, May 2007 Daniel Schensul, Lead Investigator Ph.D. Candidate Department of Sociology Patrick Heller, Principal Investigator Associate Professor Department of Sociology Brown University Providence, Rhode Island USA Please do not circulate or quote this report without permission. *This research project is funded by a grant from the United States National Science Foundation Human and Social Dynamics Program.
2 Project Description: Post-apartheid South Africa represents the most ambitious and most challenging attempt at planned transformation ever undertaken in a democratic society. This research project addresses a central question: if the apartheid city was planned for segregation, can the post-apartheid city be planned for integration? This project will use state-of-the-art GIS techniques and spatial analysis methods in conjunction with extensive qualitative field research to examine integration and exclusion in South Africa s three megacities: Johannesburg, Cape Town, and Durban. The remaking of the apartheid city poses in stark form a central question of social change: can purposive public interventions reverse ingrained inequalities of the past? The project addresses this question by drawing on expertise from sociology, planning, geography, economics, environmental management and engineering. Following the transition to democratic rule in 1994, the African National Congress (ANC) government set out to reverse the spatial legacies of planned apartheid cities. Over the past decade, the national ANC and municipal governments have implemented a range of policies designed to promote integrated development. The combination of high-capacity local governments and the political will to plan for integration provides what amounts to a natural experiment in social transformation. Careful evaluation will shed light not only on the transformation of the apartheid city, but more broadly on how determined states can transform social and physical environments. We propose to assess the extent to which planned infrastructural development has impacted the economic and racial profile of cities, and examine the degree to which macro mechanisms - globalization, elite power, governance regimes and historical legacies - act as countervailing forces to the remaking of the apartheid city. The existing (mostly qualitative) literature and previous research by team members (Heller, 2003; Hindson and O Leary, 2000; Pieterse, 2003) indicate that the post-apartheid city has experienced significant reconfiguration, but that the aggregate trend has been one of economic polarization. The overall picture is however highly uneven, marked by areas of dynamic integration as well as new pockets of exclusion. A fuller understanding of these complex phenomena calls for an interdisciplinary frame of analysis that combines concepts and techniques from the social, physical and spatial sciences. This project examines the question of transformation as the encounter of market forces, social structures, political actors and institutional capacities of the state. We specifically draw from an emergent, interdisciplinary framework that calls for comparative, configurational and spatial frames of analysis (Evans, 2002; Hart, 2002; Heller, 2001). In this configurational approach, the state, market, politics and social structure are treated as inter-determined, marked by mutually reinforcing as well as contradictory logics, that can only be grasped through close examination of spatial interconnections. In the post-apartheid city it is possible to discern new forms of integration and new forms of exclusion that are intricately linked. The case of the postapartheid city, with its stark inherited inequalities and its transformative commitments, provides a unique opportunity to explore the dynamics of transformation. 2
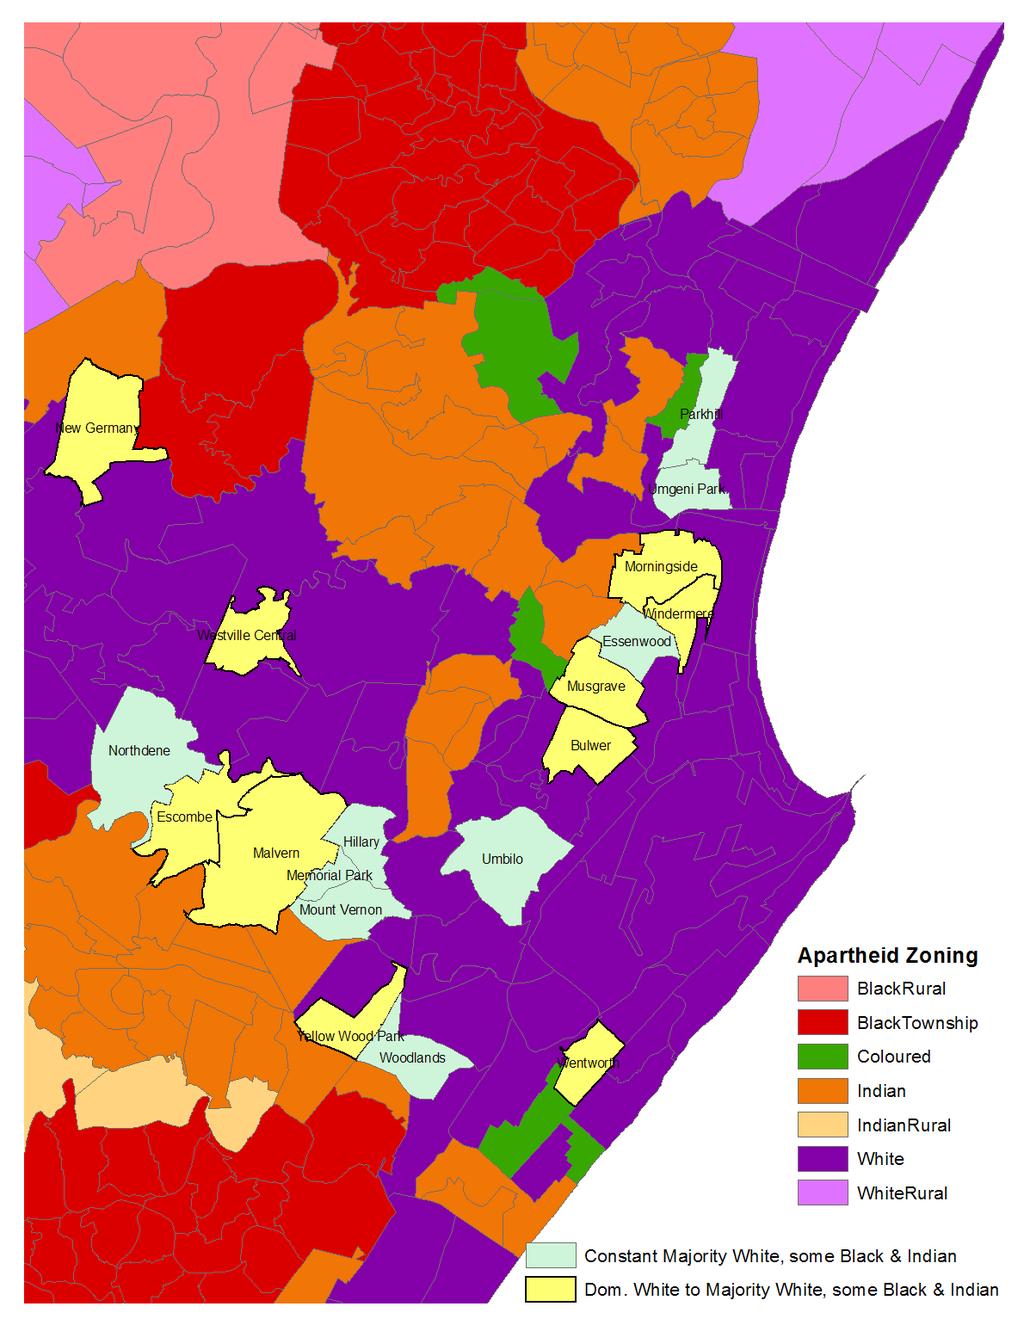
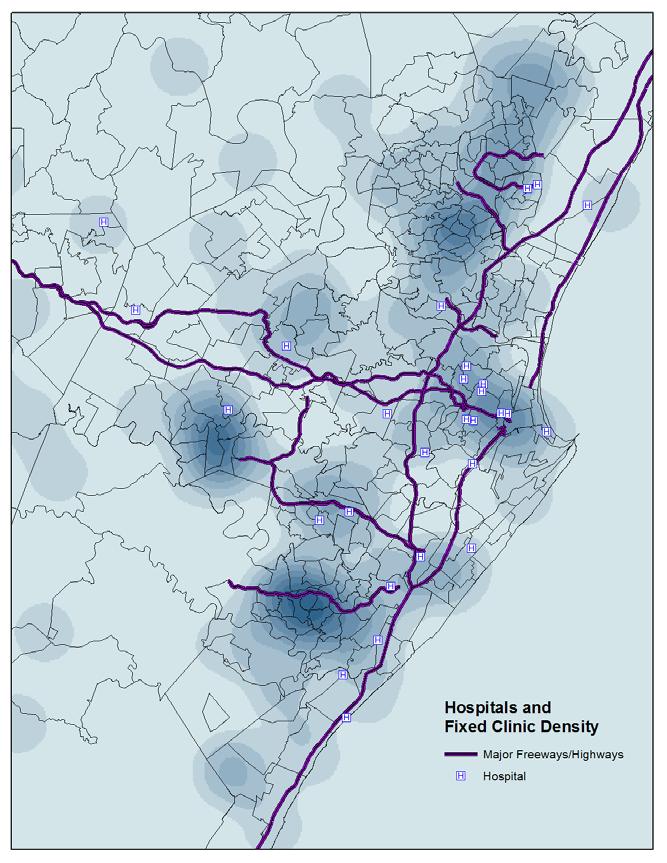
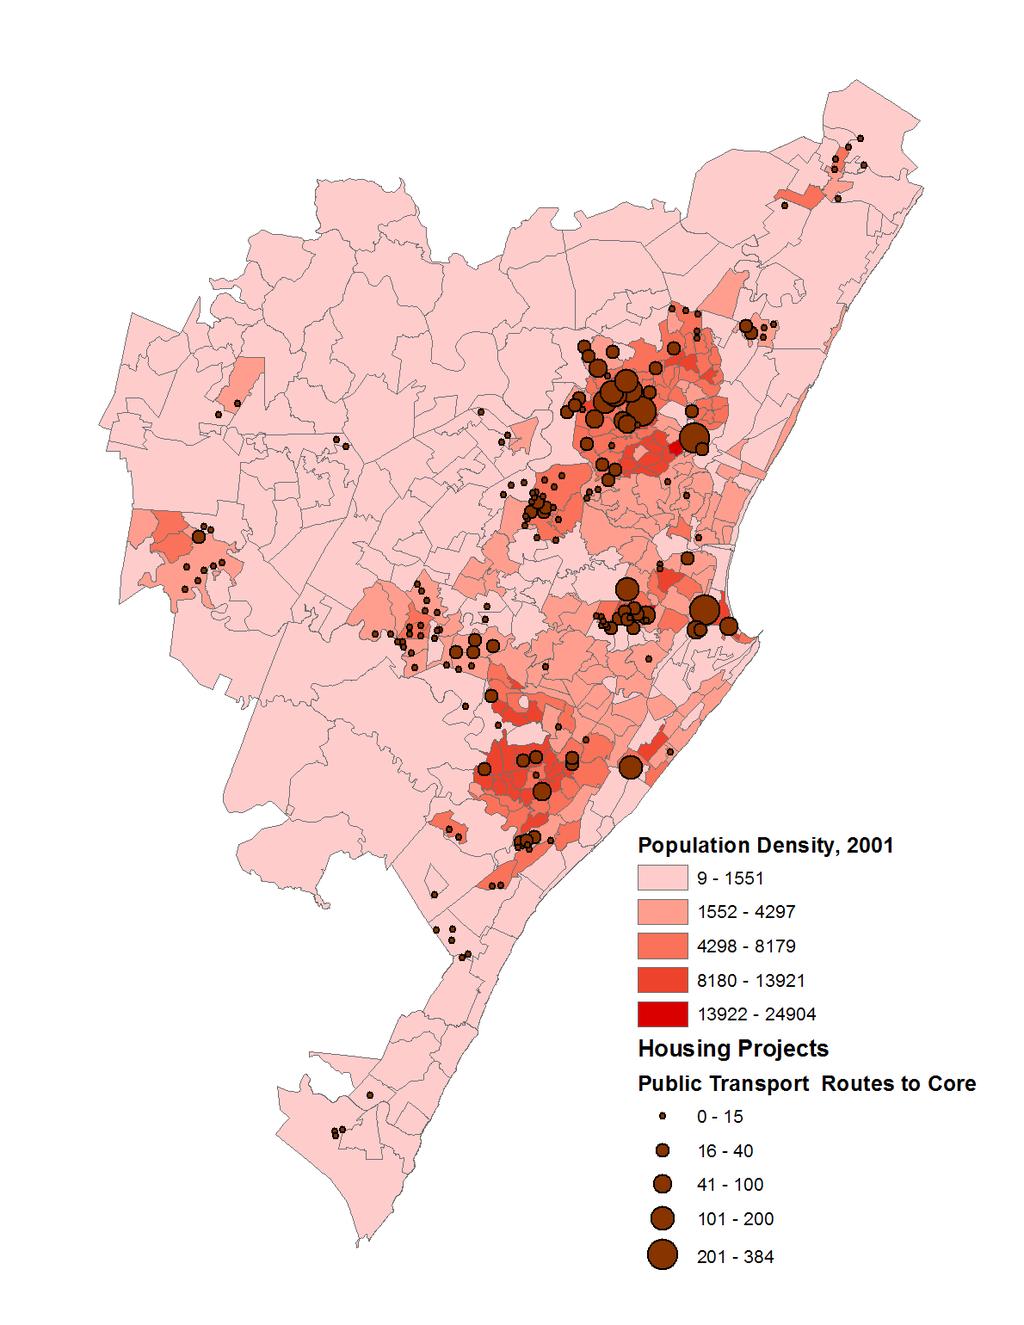
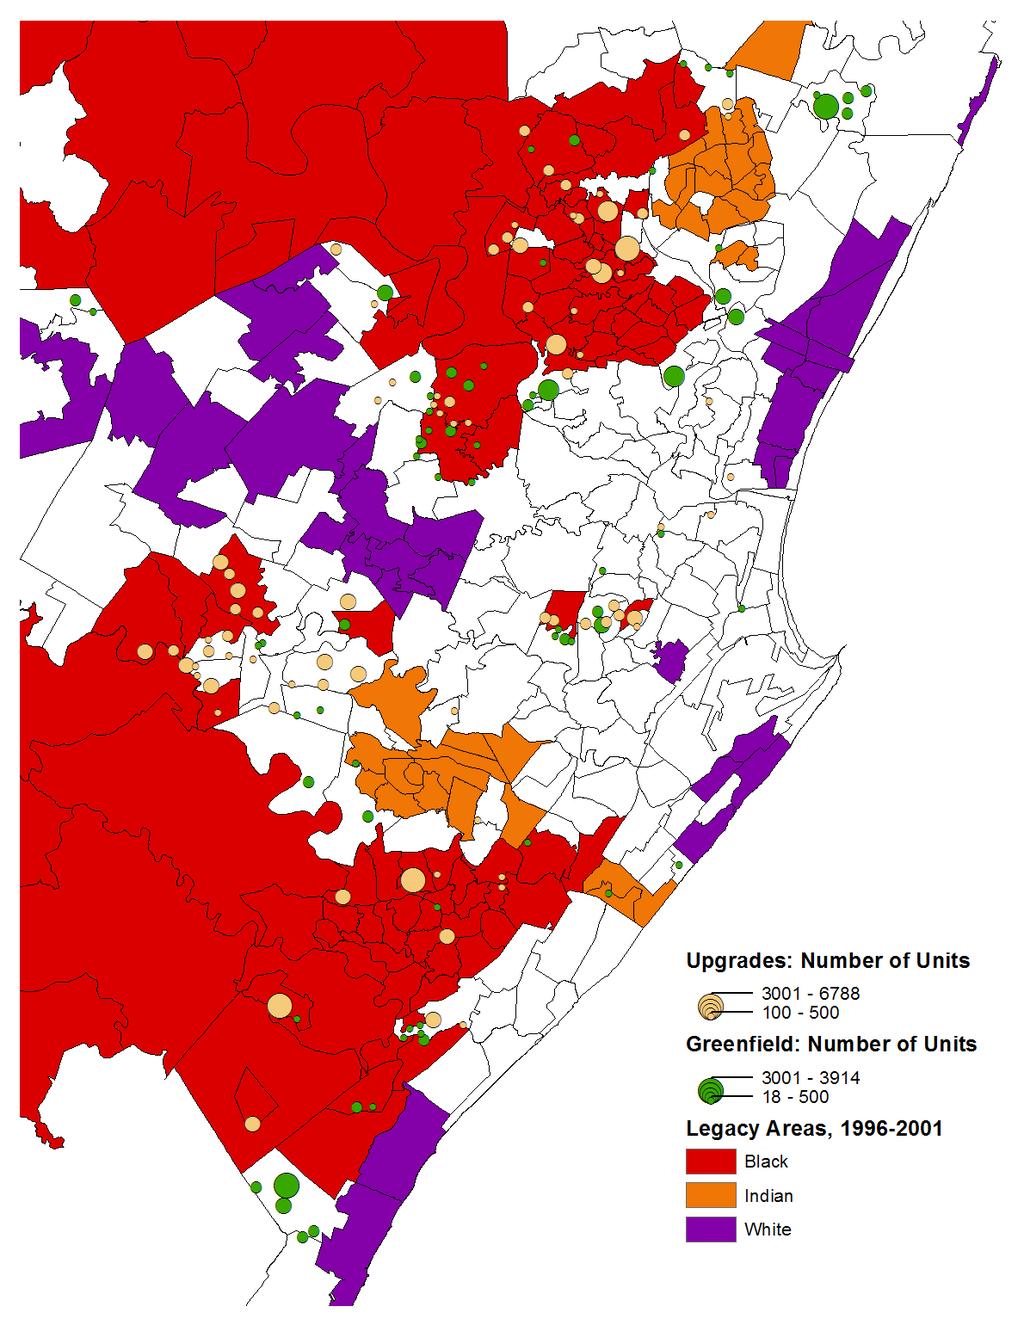
3 Project Update: We are nearing the midpoint of this four year project. We have mostly completed data collection, and have made substantial progress on data analysis, in particular for Durban. We are beginning to disseminate results while replicating analyses for Cape Town and Johannesburg. The next two years will focus on further analysis and dissemination, including working with key informants in each city to understand the results and how they might inform planning and development processes. Purpose of this Report: This draft report displays data on changes to Durban during the post-apartheid period, using census data from 1996 and 2001 as well as a variety of data from city departments on housing, roads, public transportation, schools, health facilities, and libraries. These data were analyzed and organized in this report with the explicit purpose of eliciting reactions, feedback, and analysis from Durban based experts. Acknowledgements: Thanks to all in Durban who helped provide access to the data, and to those who will be involved in the process of analyzing the initial findings presented here. This report also builds on other analyses of Durban, and particularly on Doug Hindson and Brian O Leary s work examining residential change to Durban over time. The data presented in this report are preliminary and intended only for those to whom the data is being presented. Outline of the report: 1. Introduction: Aggregate Change Statistics 2. A Guide to Categories and Measures Used in this Report 3. Tables and Charts: Population Change 4. Maps: Apartheid Zoning; Black, Indian, and White Proportion Change 5. Maps: Legacy Communities; Areas of Desegregation, Resegregation, and Constant Mixing; Desegregation and Population Density 6. Table: Population Change by Race Legacy Communities and areas of Desegregation, Resegregation, and Constant Mixing 7. Map and Table: Dominant White to Majority White, Some Indian and Black 8. Map and Table: Dominant Indian to Majority Indian, Some Black 9. Tables: Community service and infrastructure characteristics, by type of change 10. Maps: Infrastructure Distribution a. Libraries b. Housing c. Clinics d. Public Transportation Access e. Linkages to Racial Composition Change 3
4 Introduction: Aggregate Change Statistics The index of dissimilarity is a commonly used measure of racial segregation. It ranges from 0 to 1, and is calculated for a pair of race groups. It can be interpreted as the percentage of either group that would need to move to different areas such that all communities would evenly reflect the citywide proportions of the pair. Index of Dissimilarity, DMA Dissimilarity Black/White Black/Indian Indian/White Across the full extent of the DMA, the index of dissimilarity is extremely high in 1996, and goes down slightly across all three pairs in However, much of this citywide measure is driven by black townships, where most of the black population lives, and where prospects of residential integration are extremely low. How segregated are the parts of the city that are not black townships or black rural areas? Taking those communities out of the calculation, we are left with 226 communities, encompassing about half the population of Durban (see specific population totals on the next page), with the following levels of segregation: Index of dissimilarity, DMA, Excluding black townships and black rural areas. Dissimilarity Black/White Black/Indian Indian/White Here we see much larger overall change, particularly in the black/white and black/indian calculations. This change represents a huge decrease for a five year period. In international perspective, the figures for 2001 are much more in line with similarly sized cities around the globe, including American cities. However, single figures for the whole of the city, or even parts of it, are limited in what they tell us. These statistics tell us that there has been significant changes in the pattern of residential segregation outside of townships, but tell us little about the actual patterns driving this change and the dynamics at work. The remainder of this report disaggregates the patterns at the community level, providing the data for a preliminary examination of how these patterns of racial residential change are tied to economic and infrastructural factors. 4
5 A Guide to Categories and Measures Used in this Report Community Change Categories: Legacy Communities composed only (or almost entirely) of one race group in 1996 that remained the same in Desegregated Communities that from 1996 to 2001 experienced one or more of the following: 1) A new race group arrived that was not significantly present there previously 2) A shift from a race group over 50% of the population to no race group over 50% 3) A significant narrowing of the gap between proportions of two or more groups. Resegregated Communities that from 1996 to 2001 experienced the inverse of one or more of the three changes listed in the desegregation category. Mixed Static Communities that were mixed in any particular configuration of more than one race group in 1996, and remained in roughly that same configuration in Race Group Representation Categories: Dominant Representation A race group that is so high a proportion of a community that it is the only group with any real representation in that community. (We sometimes use the shorthand notation of a single capital letter to refer to a community of this type: W for white, B for black, I for Indian.) Majority Representation A race group at or above 50% of the population of a community but below the point at which it becomes dominant. (Shorthand notation is a capital letter coupled with a lowercase letter representing some : biw would therefore mean majority white, some black and Indian.) Some Representation A race group below 50 percent of the population, but not so low as to be unrepresented. (Shorthand notation is a lowercase letter together with other lower or upper case letter: biw would mean black, Indian, and white all represented but each below 50%.) 5
6 Statistical Measures: Population Density Number of people per square kilometer. Highway Distance Distance in meters between the center of a community and the nearest freeway or highway. Income Rank Rank of average household income of communities, from 1, the highest, to 406, the lowest. Rank is used rather than actual value because of comparability problems between census questions in 1996 and Public Transportation Count Number of public transportation routes that go through the community or housing project directly to the central city. Reported figures are weighted by population. Informal Housing Percentage of households that live in informal dwellings. Unemployment Number of unemployed but looking for work, divided by number of unemployed but looking for work plus number employed. Clinic Density Average number of fixed clinics within two kilometers of any given spot within a community. Toilet Access Percentage of households with in home flush or chemical toilets. Water in Dwelling Percent of households with water piped into the dwelling. All reports of these statistics are weighted so that their values are not skewed disproportionately by the rural and sparsely populated areas of the Durban Metropolitan Area. Population density, highway distance, public transportation count, clinic density, and unemployment are weighted by population; income rank, toilet access and water in dwelling are weighted by number of households. Finally, when examining maps, please take careful note of the legends, as we present data using symbols that are as consistent as possible but still sometimes differ across maps. If you have further questions regarding any of the terms or maps in this report, please do not hesitate to contact us by . 6
7 Population Change, entire DMA Year Black Pop Black % Indian Pop Indian % White Pop White% Total ,738,988 64% 599,296 22% 316,281 12% 2,727, ,107,599 68% 614,675 20% 277,479 9% 3,086,283 3,500,000 3,000, Population Change, Entire DMA 2,500,000 2,000,000 1,500,000 1,000, ,000 0 Black Pop Indian Pop White Pop Total Population Change, DMA excluding black townships and black rural areas. Year Black Pop Black % Indian Pop Indian % White Pop White % Total ,144 27% 593,629 44% 315,800 23% 1,351, ,943 36% 605,381 40% 275,989 18% 1,512,461 1,600,000 1,400,000 1,200, Population Change, DMA Excluding Black Zoned Areas 1,000, , , , ,000 0 Black Pop Indian Pop White Pop Total 7
8 8
9 9
10 10
11 11
12 12
13 13
14 Type No. Total Black Indian White Total (change, 96-01) Black (change) Indian (change) White (change) Desegregated , , , , ,975 (+3.1%) 207,843 (+24%) 179,773 (-3.1%) 97,955 (-21%) Mixed Static ,711 96,278 71,672 42, ,129 (+16%) 133,127 (+38%) 84,760 (+18%) 40,691 (-3.7%) Resegregated ,233 44,622 20,542 17, ,236 (+60%) 91,852 (+206%) 24,172 (+18%) 15,159 (-16%) Legacy 210 1,875,620 1,424, , ,900 2,045,133 (+9%) 1,612,894 (+13%) 304,811 (-2.9%) 117,663 (-10%) Citywide 406 2,727,988 1,738, , ,281 3,086,283 (+13%) 2,107,599 (+21%) 614,675 (+2.5%) 277,479 (-12%) 34 communities are not included: 28 Greenfields, and six that experienced change not reducible to desegregation or resegregation. Desegregated 40,773 Legacy, 187,938 Mixed Static, 36,849 Resegregated 47,230 Black Population Increases,
15 15
16 Dominant White to Majority White, Some Indian and Black (W to biw) Community Apartheid Zone Total Pop Black Indian White Total Pop Black Indian White Malvern White % 11% 79% % 28% 58% Bulwer White % 6% 75% % 10% 57% Morningside White % 10% 74% % 26% 54% Musgrave White % 6% 75% % 17% 63% New Germany White % 3% 79% % 6% 56% Escombe White % 13% 77% % 27% 59% Windermere White % 6% 80% % 13% 63% Yellow Wood Park White % 6% 80% % 20% 52% Westville Central White % 5% 79% % 7% 65% Wentworth White % 5% 78% % 11% 61% Total Population Total Percentage 14% 8% 77% 21% 18% 58% W to biw Continued Population Change, Community Apartheid Zone Total Pop Black Indian White Malvern White ,347-3,619 Bulwer White , ,050 Morningside White +1, ,101-1,213 Musgrave White -1, ,142-2,651 New Germany White +2,246 +2, Escombe White +1, , Windermere White -1, ,128 Yellow Wood Park White ,727 Westville Central White Wentworth White -1, ,538 Total Population -1,982 +6,016 +8,636-17,708 Total Percentage -2% +50% +128% -26% 16
17 17
18 Dominant Indian to Majority Indian, Some Black (I to bi) Population Change Community Apartheid Zone Total Pop Black Indian Total Pop Black Indian Black Indian Crossmoor Indian % 99% % 56% +6,419-2,732 Lotus Park Indian % 93% % 82% +1, Bayview Indian % 93% % 87% ,527 Westham Indian % 96% % 81% +1, Tongaat Central Indian % 90% % 82% Greenbury a Indian % 92% % 87% Redfern Indian % 97% % 87% Clayfield Indian % 98% % 81% ,753 Verulam Central Indian % 94% % 85% ,192 Rockford Indian % 91% % 75% Mobeni Heights Indian % 91% % 65% +1,022-1,178 Parlock a Indian % 90% % 85% Bulbul b IndianRural 403 2% 96% % 71% ,229 Duffs Road c Indian % 92% % 82% Total Population ,691-13,040 Percent of Total 5% 94% 21% 78% +324% -14% a. Parlock and Greenbury experienced a small proportional change, though enough to cross a threshold. b. Bulbul has a very small population in 1996 which expands significantly in c. Duffs Road has very small population and is a transportation hub. Parlock, Bulbul, and Duffs Road are excluded from summary statistic of this group of communities (Greenbury, with larger population change, will remain). 18
19 Community Service, Infrastructure, and Economic Characteristics Full City Population Density Income Rank Highway Distance 1867m Public Transportation Count 32 Clinic Density.088 Unemployment Rate 40.7% 54.6% Informal Housing 4.4% 9.2% Toilet Access 87.0% 85.3% Water in Dwelling 76.8% 55.9% Desegregating Communities Population Density Income Rank Highway Distance 1202m Public Transportation Count 55 Clinic Density.094 Unemployment Rate 13.3% 24.7% Informal Housing 0.6% 3.7% Toilet Access 99.1% 95.4% Water in Dwelling 97.5% 80.2% Mixed Static Communities Population Density Income Rank Highway Distance 1504m Public Transportation Count 60 Clinic Density.092 Unemployment Rate 15.3% 33.2% Informal Housing 5.8% 7.7% Toilet Access 94.9% 90.0% Water in Dwelling 93.2% 78.5% All figures weighted by population or households, as necessary. Undated figures use 2001 weight. 19
20 Legacy: Black (N=141) Population Density Income Rank Highway Distance 2097m Public Transportation Count 26 Clinic Density.081 Unemployment Rate 48.8% 59.6% Informal Housing 33.9% 25.0% Toilet Access 39.5% 58.9% Water in Dwelling 28.8% 15.2% Legacy: Indian (N=35) Population Density Income Rank Highway Distance 1026m Public Transportation Count 27 Clinic Density.116 Unemployment Rate 15.2% 21.7% Informal Housing 0.4% 1.1% Toilet Access 99.5% 98.6% Water in Dwelling 98.8% 88.6% Legacy: White (N=34) Population Density Income Rank Highway Distance 724m Public Transportation Count 34 Clinic Density.043 Unemployment Rate 3.8% 7.8% Informal Housing 0.6% 0.7% Toilet Access 99.4% 98.7% Water in Dwelling 98.6% 89.5% All figures weighted by population or households, as necessary. Undated figures use 2001 weight. 20
21 Medians, by Community Type Population Density-1996 (per sqk) Population Density-2001 (per sqk) Income Rank 1996 Income Rank 2001 Distance to Highway/ Freeway Public Transport Routes Fixed Clinic Density N Legacy W m W to biw m biw, m Medians by N Informal Housing Toilet Access Water in Home Unemployment Community Type Legacy W % 0.7% 99.4% 98.7% 98.6% 89.5% 3.8% 7.8% W to Wbi % 1.2% 99.6% 98.2% 98.7% 90.1% 4.4% 7.6% biw, % 0.8% 99.5% 98.9% 98.3% 91.7% 6.2% 11.9% Medians, by Community Type Population Density 1996 Population Density 2001 HH Income Rank 1996 HH Income Rank 2001 Distance to Highway/ Freeway Public Transport Routes Fixed Clinic Density N Legacy I m I to bi m bi, m Medians by Informal Housing Toilet Access Water in Home Unemployment Community Type N Legacy I % 1.1% 99.5% 98.6% 98.8% 88.6% 15.2% 21.7% I to bi % 3.7% 99.5% 95.4% 99.1% 82.8% 16.9% 25.8% bi, % 8.0% 92.3% 89.8% 92.9% 76.7% 13.6% 21.7% All statistics weighted by households or population, as needed. 21
22 22
23 23
24 24
25 25
26 26
27 27
28 28
Institute for Public Policy and Economic Analysis
 Institute for Public Policy and Economic Analysis The Institute for Public Policy and Economic Analysis at Eastern Washington University will convey university expertise and sponsor research in social,
Community Well-Being and the Great Recession
 Pathways Spring 2013 3 Community Well-Being and the Great Recession by Ann Owens and Robert J. Sampson The effects of the Great Recession on individuals and workers are well studied. Many reports document
Population Vitality Overview
 8 Population Vitality Overview Population Vitality Overview The Population Vitality section covers information on total population, migration, age, household size, and race. In particular, the Population
Sleepwalking towards Johannesburg? Local measures of ethnic segregation between London s secondary schools, /9.
 Sleepwalking towards Johannesburg? Local measures of ethnic segregation between London s secondary schools, 2003 2008/9. Richard Harris A Headline Headteacher expresses alarm over racial segregation in
Title: People, Places and Infrastructure: Is violence means to spatial justice and results from spatial transformation in Cato Manor?
 Title: People, Places and Infrastructure: Is violence means to spatial justice and results from spatial transformation in Cato Manor? Thando Manzi Introduction. Cato Manor is a working class area located
Metro Vancouver Backgrounder Metro 2040 Residential Growth Projections
 Metro Vancouver 2040 - Backgrounder Metro 2040 Residential Growth Projections Purpose Metro Vancouver 2040 Shaping our Future, Metro s draft regional growth strategy, was released for public review in
Segregation in Motion: Dynamic and Static Views of Segregation among Recent Movers. Victoria Pevarnik. John Hipp
 Segregation in Motion: Dynamic and Static Views of Segregation among Recent Movers Victoria Pevarnik John Hipp March 31, 2012 SEGREGATION IN MOTION 1 ABSTRACT This study utilizes a novel approach to study
RESEARCH BRIEF: The State of Black Workers before the Great Recession By Sylvia Allegretto and Steven Pitts 1
 July 23, 2010 Introduction RESEARCH BRIEF: The State of Black Workers before the Great Recession By Sylvia Allegretto and Steven Pitts 1 When first inaugurated, President Barack Obama worked to end the
John Parman Introduction. Trevon Logan. William & Mary. Ohio State University. Measuring Historical Residential Segregation. Trevon Logan.
 Ohio State University William & Mary Across Over and its NAACP March for Open Housing, Detroit, 1963 Motivation There is a long history of racial discrimination in the United States Tied in with this is
Ethnic Diversity, Mixing and Segregation in England and Wales,
 Ethnic Diversity, Mixing and Segregation in England and Wales, 1991-2011 Gemma Catney Department of Geography and Planning, School of Environmental Sciences Email g.catney@liverpool.ac.uk Twitter @gemmacatney
Was the Late 19th Century a Golden Age of Racial Integration?
 Was the Late 19th Century a Golden Age of Racial Integration? David M. Frankel (Iowa State University) January 23, 24 Abstract Cutler, Glaeser, and Vigdor (JPE 1999) find evidence that the late 19th century
Private Sector Commission
 Private Sector Commission Technical Information Bulletin No. 4 Labour Force and Employment in the Guyana Economy Private Sector Commission 157 Waterloo Street North Cummingsburg Georgetown Labour Force
South Salt Lake: Fair Housing Equity Assessment
 South Salt Lake: Fair Housing Equity Assessment Prepared by Bureau of Economic and Business Research David Eccles School of Business University of Utah James Wood John Downen DJ Benway Darius Li April
The geography of exclusion
 DEC 2013 The geography of exclusion RACE, SEGREGATION & CONCENTRATED POVERTY Dr. Domenico "Mimmo" Parisi Professor of Sociology Mississippi State University Rural Poverty Research Symposium Atlanta, GA
Provincial Review 2016: Western Cape
 Provincial Review 2016: Western Cape The Western Cape s real economy is dominated by manufacturing and commercial agriculture. As a result, while it did not benefit directly from the commodity boom, it
Compare Your Area User Guide
 Compare Your Area User Guide October 2016 Contents 1. Introduction 2. Data - Police recorded crime data - Population data 3. How to interpret the charts - Similar Local Area Bar Chart - Within Force Bar
Chapter 2: Population Size and Composition
 HH SIZE / Map 2-21 Average Household Size in 28 The average household size is a measure of the number of persons per household. It is important in the planning process because many people are found in
Internal Migration to the Gauteng Province
 Internal Migration to the Gauteng Province DPRU Policy Brief Series Development Policy Research Unit University of Cape Town Upper Campus February 2005 ISBN 1-920055-06-1 Copyright University of Cape Town
Southern Africa Labour and Development Research Unit
 Southern Africa Labour and Development Research Unit Drivers of Inequality in South Africa by Janina Hundenborn, Murray Leibbrandt and Ingrid Woolard SALDRU Working Paper Number 194 NIDS Discussion Paper
STRENGTHENING RURAL CANADA: Fewer & Older: Population and Demographic Crossroads in Rural Saskatchewan. An Executive Summary
 STRENGTHENING RURAL CANADA: Fewer & Older: Population and Demographic Crossroads in Rural Saskatchewan An Executive Summary This paper has been prepared for the Strengthening Rural Canada initiative by:
Part 1: Focus on Income. Inequality. EMBARGOED until 5/28/14. indicator definitions and Rankings
 Part 1: Focus on Income indicator definitions and Rankings Inequality STATE OF NEW YORK CITY S HOUSING & NEIGHBORHOODS IN 2013 7 Focus on Income Inequality New York City has seen rising levels of income
New Germany. Decreases. Property Value. Integration. Newbury road where 25 flats /white house were build
 New Germany Property Value Decreases Integration Newbury road where 25 flats /white house were build Increases Berkshire road signaling the beginning of Buffer Strip The World Integration 1 Regarding the
Racial Segregation in Iowa s Metro Areas, Policy Report. January 2017
 Policy Report January 2017 Racial Segregation in Iowa s Metro Areas, 1990-2010 Emily Seiple Ashley Zitzner Jerry Anthony Ryan Dusil Kirk Lehman Gabriel Martin School of Urban & Regional Planning, University
The Poor in the Indian Labour Force in the 1990s. Working Paper No. 128
 CDE September, 2004 The Poor in the Indian Labour Force in the 1990s K. SUNDARAM Email: sundaram@econdse.org SURESH D. TENDULKAR Email: suresh@econdse.org Delhi School of Economics Working Paper No. 128
Revisiting Residential Segregation by Income: A Monte Carlo Test
 International Journal of Business and Economics, 2003, Vol. 2, No. 1, 27-37 Revisiting Residential Segregation by Income: A Monte Carlo Test Junfu Zhang * Research Fellow, Public Policy Institute of California,
Social and Demographic Trends in Burnaby and Neighbouring Communities 1981 to 2006
 Social and Demographic Trends in and Neighbouring Communities 1981 to 2006 October 2009 Table of Contents October 2009 1 Introduction... 2 2 Population... 3 Population Growth... 3 Age Structure... 4 3
Midvale: Fair Housing Equity Assessment
 Midvale: Fair Housing Equity Assessment Prepared by Bureau of Economic and Business Research David Eccles School of Business University of Utah James Wood John Downen DJ Benway Darius Li April 2013 [DRAFT]
HOUSEHOLD TYPE, ECONOMIC DISADVANTAGE, AND RESIDENTIAL SEGREGATION: EMPIRICAL PATTERNS AND FINDINGS FROM SIMULATION ANALYSIS.
 HOUSEHOLD TYPE, ECONOMIC DISADVANTAGE, AND RESIDENTIAL SEGREGATION: EMPIRICAL PATTERNS AND FINDINGS FROM SIMULATION ANALYSIS A Thesis by LINDSAY MICHELLE HOWDEN Submitted to the Office of Graduate Studies
The meaning and measure of inclusive growth in South Africa: In search of genuine economic transformation
 The meaning and measure of inclusive growth in South Africa: In search of genuine economic transformation Applying the Rockefeller `Inclusive Economies framework Justin Visagie and Ivan Turok Some comments
SUMMARY ANALYSIS OF KEY INDICATORS
 SUMMARY ANALYSIS OF KEY INDICATORS from the FSM 2010 Census of Population and Housing DIVISION OF STATISTICS FSM Office of Statistics, Budget, Overseas Development Assistance and Compact Management (S.B.O.C)
Black access to suburban housing in America s most racially segregated metropolitan area: Detroit
 Black access to suburban housing in America s most racially segregated metropolitan area: Detroit Joe T. Darden Michigan State University Department of Geography 314 Natural Science Building East Lansing,
Poverty profile and social protection strategy for the mountainous regions of Western Nepal
 October 2014 Karnali Employment Programme Technical Assistance Poverty profile and social protection strategy for the mountainous regions of Western Nepal Policy Note Introduction This policy note presents
The Rise and Decline of the American Ghetto
 David M. Cutler, Edward L. Glaeser, Jacob L. Vigdor September 11, 2009 Outline Introduction Measuring Segregation Past Century Birth (through 1940) Expansion (1940-1970) Decline (since 1970) Across Cities
IV. Residential Segregation 1
 IV. Residential Segregation 1 Any thorough study of impediments to fair housing choice must include an analysis of where different types of people live. While the description of past and present patterns
Changing Cities: What s Next for Charlotte?
 Changing Cities: What s Next for Charlotte? Santiago Pinto Senior Policy Economist The views expressed in this presentation are those of the speaker and do not necessarily represent the views of the Federal
Urban Demography. Nan Astone, PhD Johns Hopkins University
 This work is licensed under a Creative Commons Attribution-NonCommercial-ShareAlike License. Your use of this material constitutes acceptance of that license and the conditions of use of materials on this
Chapter 5. Residential Mobility in the United States and the Great Recession: A Shift to Local Moves
 Chapter 5 Residential Mobility in the United States and the Great Recession: A Shift to Local Moves Michael A. Stoll A mericans are very mobile. Over the last three decades, the share of Americans who
Background Paper Series. Background Paper 2003: 3. Demographics of South African Households 1995
 Background Paper Series Background Paper 2003: 3 Demographics of South African Households 1995 Elsenburg September 2003 Overview The Provincial Decision-Making Enabling (PROVIDE) Project aims to facilitate
NATIONAL HOUSEHOLD SURVEY: LABOUR FORCE, EMPLOYMENT, AND INCOME
 Clause No. 15 in Report No. 1 of was adopted, without amendment, by the Council of The Regional Municipality of York at its meeting held on January 23, 2014. 15 2011 NATIONAL HOUSEHOLD SURVEY: LABOUR FORCE,
Extended Abstract. The Demographic Components of Growth and Diversity in New Hispanic Destinations
 Extended Abstract The Demographic Components of Growth and Diversity in New Hispanic Destinations Daniel T. Lichter Departments of Policy Analysis & Management and Sociology Cornell University Kenneth
Inequality in the Labor Market for Native American Women and the Great Recession
 Inequality in the Labor Market for Native American Women and the Great Recession Jeffrey D. Burnette Assistant Professor of Economics, Department of Sociology and Anthropology Co-Director, Native American
MARKET SNAPSHOT New York DMA
 MARKET SNAPSHOT New York DMA The New York Designated Market Area (DMA) is the most populous and densely populated area in the U.S. with a total 2016 population of 21,438,229 and a population density of
Comment Income segregation in cities: A reflection on the gap between concept and measurement
 Comment Income segregation in cities: A reflection on the gap between concept and measurement Comment on Standards of living and segregation in twelve French metropolises by Jean Michel Floch Ana I. Moreno
Demographic Data. Comprehensive Plan
 Comprehensive Plan 2010-2030 4 Demographic Data Population and demographics have changed over the past several decades in the City of Elwood. It is important to incorporate these shifts into the planning
Statistics Update For County Cavan
 Social Inclusion Unit November 2013 Key Figures for Cavan Population 73,183 Population change 14.3% Statistics Update For County Cavan Census 2011 Shows How Cavan is Changing Population living in 70% rural
% of Total Population
 12 2. SOCIO-ECONOMIC ANALYSIS 2.1 POPULATION The Water Services Development Plan: Demographic Report (October December 2000, WSDP) provides a detailed breakdown of population per settlement area for the
Social Impact Assessment of the Proposed N2 Wild Coast Toll Highway. HIV/AIDS prevalence rate of 33.5% the highest in the country.
 HIV/AIDS prevalence rate of 33.5% the highest in the country. The KwaZulu-Natal Government s Industrial Strategy document of March 2004 offered a somewhat more positive perspective on provincial economic
DEMOGRAPHIC PROFILE Skagit County, Washington. Prepared by: Skagit Council of Governments 204 West Montgomery Street, Mount Vernon, WA 98273
 DEMOGRAPHIC PROFILE 2013 Skagit County, Washington Prepared by: Skagit Council of Governments 204 West Montgomery Street, Mount Vernon, WA 98273 CONTENTS TABLE OF CONTENTS Introduction... 1 Persons and
Rural Wiltshire An overview
 Rural Wiltshire An overview March 2010 Report prepared by: Jackie Guinness Senior Researcher Policy, Research & Communications Wiltshire Council Telephone: 01225 713023 Email: Jackie.guinness@wiltshire.gov.uk
Understanding Racial Inequity in Alachua County
 Understanding Racial Inequity in Alachua County (January, 2018) Hector H. Sandoval (BEBR) Department of Economics College of Liberal Arts and Sciences University of Florida Understanding Racial Inequity
City of Hammond Indiana DRAFT Fair Housing Assessment 07. Disparities in Access to Opportunity
 ANALYSIS EDUCATIONAL OPPORTUNITIES i. Describe any disparities in access to proficient schools based on race/ethnicity, national origin, and family status. ii. iii. Describe the relationship between the
Patterns of Housing Voucher Use Revisited: Segregation and Section 8 Using Updated Data and More Precise Comparison Groups, 2013
 Patterns of Housing Voucher Use Revisited: Segregation and Section 8 Using Updated Data and More Precise Comparison Groups, 2013 Molly W. Metzger, Assistant Professor, Washington University in St. Louis
For each of the 50 states, we ask a
 state of states 30 head Spatial Segregation The Stanford Center on Poverty and Inequality By Daniel T. Lichter, Domenico Parisi, and Michael C. Taquino Key findings There is extreme racial segregation
Non Financial Census of Municipalities
 Non Financial Census of Municipalities Pali Lehohla Statistician-General Statistics South Africa Cape Town 22 October 2014 1 Outline of Presentation Oversight Role of the Portfolio Committee Using Stats
Dominicans in New York City
 Center for Latin American, Caribbean & Latino Studies Graduate Center City University of New York 365 Fifth Avenue Room 5419 New York, New York 10016 212-817-8438 clacls@gc.cuny.edu http://web.gc.cuny.edu/lastudies
Racial Disparities in Youth Commitments and Arrests
 Racial Disparities in Youth Commitments and Arrests Between 2003 and 2013 (the most recent data available), the rate of youth committed to juvenile facilities after an adjudication of delinquency fell
Neighborhood Diversity Characteristics in Iowa and their Implications for Home Loans and Business Investment
 Economics Technical Reports and White Papers Economics 9-2008 Neighborhood Diversity Characteristics in Iowa and their Implications for Home Loans and Business Investment Liesl Eathington Iowa State University,
The State of. Working Wisconsin. Update September Center on Wisconsin Strategy
 The State of Working Wisconsin Update 2005 September 2005 Center on Wisconsin Strategy About COWS The Center on Wisconsin Strategy (COWS), based at the University of Wisconsin-Madison, is a research center
STRENGTHENING RURAL CANADA: Fewer & Older: The Coming Population and Demographic Challenges in Rural Newfoundland & Labrador
 STRENGTHENING RURAL CANADA: Fewer & Older: The Coming Population and Demographic Challenges in Rural Newfoundland & Labrador An Executive Summary 1 This paper has been prepared for the Strengthening Rural
STRENGTHENING RURAL CANADA: Fewer & Older: Population and Demographic Challenges Across Rural Canada A Pan-Canadian Report
 STRENGTHENING RURAL CANADA: Fewer & Older: Population and Demographic Challenges Across Rural Canada A Pan-Canadian Report This paper has been prepared for the Strengthening Rural Canada initiative by:
Immigrant Communities of Philadelphia: Spatial Patterns and Revitalization
 University of Pennsylvania ScholarlyCommons Reports Social Science Studio 1-1-2015 Immigrant Communities of Philadelphia: Spatial Patterns and Revitalization Jake Riley University of Pennsylvania, rjake@sas.upenn.edu
SECTION TWO: REGIONAL POVERTY TRENDS
 SECTION TWO: REGIONAL POVERTY TRENDS Metropolitan Council Choice, Place and Opportunity: An Equity Assessment of the Twin Cities Region Section 2 The changing face of poverty Ebbs and flows in the performance
Item No Halifax Regional Council July 19, 2016
 P.O. Box 1749 Halifax, Nova Scotia B3J 3A5 Canada Item No. 14.4.1 Halifax Regional Council July 19, 2016 TO: SUBMITTED BY: Mayor Savage and Members of Halifax Regional Council Original Signed Councillor
THE FORGOTTEN HISTORY OF HOW GOVERNMENT SEGREGATED
 TEXAS HOUSERS texashousers.net 2/13/19 THE FORGOTTEN HISTORY OF HOW GOVERNMENT SEGREGATED & HOUSTON HOW THIS IS MAINTAINED TODAY 3Segregated Houston FOR MORE INFORMATION The information shown here is
Far From the Commonwealth: A Report on Low- Income Asian Americans in Massachusetts
 University of Massachusetts Boston ScholarWorks at UMass Boston Institute for Asian American Studies Publications Institute for Asian American Studies 1-1-2007 Far From the Commonwealth: A Report on Low-
Unequal Recovery, Labor Market Polarization, Race, and 2016 U.S. Presidential Election. Maoyong Fan and Anita Alves Pena 1
 Unequal Recovery, Labor Market Polarization, Race, and 2016 U.S. Presidential Election Maoyong Fan and Anita Alves Pena 1 Abstract: Growing income inequality and labor market polarization and increasing
The Planning & Development Department recommends that Council receive this report for information.
 CORPORATE REPORT NO: R237 COUNCIL DATE: November 19, 2018 REGULAR COUNCIL TO: Mayor & Council DATE: November 15, 2018 FROM: General Manager, Planning & Development FILE: 6600-01 SUBJECT: Surrey Community
Patterns of Housing Voucher Use Revisited: Segregation and Section 8 Using Updated Data and More Precise Comparison Groups, 2013
 Patterns of Housing Voucher Use Revisited: Segregation and Section 8 Using Updated Data and More Precise Comparison Groups, 2013 Molly W. Metzger Center for Social Development Danilo Pelletiere U.S. Department
The Changing Racial and Ethnic Makeup of New York City Neighborhoods
 The Changing Racial and Ethnic Makeup of New York City Neighborhoods State of the New York City s Property Tax New York City has an extraordinarily diverse population. It is one of the few cities in the
Heading in the Wrong Direction: Growing School Segregation on Long Island
 Heading in the Wrong Direction: Growing School Segregation on Long Island January 2015 Heading in the Wrong Direction: Growing School Segregation on Long Island MAIN FINDINGS Based on 2000 and 2010 Census
JULY Esri Diversity Index
 JULY 2018 Esri Diversity Index Copyright 2018 Esri All rights reserved. Printed in the United States of America. The information contained in this document is the exclusive property of Esri. This work
We know that the Latinx community still faces many challenges, in particular the unresolved immigration status of so many in our community.
 1 Ten years ago United Way issued a groundbreaking report on the state of the growing Latinx Community in Dane County. At that time Latinos were the fastest growing racial/ethnic group not only in Dane
COUNTY PROFILE. The State of Exclusion. Jones County, N.C. An In-depth Analysis of the Legacy of Segregated Communities.
 COUNTY PROFILE The State of Exclusion Jones County, N.C. An In-depth Analysis of the Legacy of Segregated Communities www.uncinclusionproject.org 1 The State of Exclusion Jones County Near the coast of
2017/2022 Esri Diversity Index
 2017/2022 Esri Diversity Index By Kyle Reese Cassal Demographer, Data Development Team An Esri White Paper June 2017 Copyright 2017 Esri All rights reserved. Printed in the United States of America. The
Labour Market Reform, Rural Migration and Income Inequality in China -- A Dynamic General Equilibrium Analysis
 Labour Market Reform, Rural Migration and Income Inequality in China -- A Dynamic General Equilibrium Analysis Yinhua Mai And Xiujian Peng Centre of Policy Studies Monash University Australia April 2011
REGENERATION AND INEQUALITY IN AMERICA S LEGACY CITIES
 REGENERATION AND INEQUALITY IN AMERICA S LEGACY CITIES Alan Mallach, Senior Fellow Center for Community Progress Washington, DC amallach@communityprogress.net Setting the stage A dramatic reversal of long-term
RACIAL-ETHNIC DIVERSITY AND SOCIOECONOMIC PROSPERITY IN U.S. COUNTIES
 RACIAL-ETHNIC DIVERSITY AND SOCIOECONOMIC PROSPERITY IN U.S. COUNTIES Luke T. Rogers, Andrew Schaefer and Justin R. Young * University of New Hampshire EXTENDED ABSTRACT Submitted to the Population Association
Minority Suburbanization and Racial Change
 University of Minnesota Law School Scholarship Repository Studies Institute on Metropolitan Opportunity 2006 Minority Suburbanization and Racial Change Institute on Metropolitan Opportunity University
COMPARATIVE ANALYSIS OF METROPOLITAN CONTEXTS: ANNIE E. CASEY FOUNDATION CITIES
 ANNIE E. CASEY FOUNDATION MAKING CONNECTIONS INITIATIVE COMPARATIVE ANALYSIS OF METROPOLITAN CONTEXTS: ANNIE E. CASEY FOUNDATION CITIES G. Thomas Kingsley and Kathryn L.S. Pettit December 3 THE URBAN INSTITUTE
2. The study offers unique contributions to understanding social capital in Singapore.
 A STUDY ON SOCIAL CAPITAL IN SINGAPORE By the Institute of Policy Studies, National University of Singapore Supported by the Ministry of Culture, Community and Youth Research by Associate Professor Vincent
Patrick Adler and Chris Tilly Institute for Research on Labor and Employment, UCLA. Ben Zipperer University of Massachusetts, Amherst
 THE STATE OF THE UNIONS IN 2013 A PROFILE OF UNION MEMBERSHIP IN LOS ANGELES, CALIFORNIA AND THE NATION 1 Patrick Adler and Chris Tilly Institute for Research on Labor and Employment, UCLA Ben Zipperer
Traffic Density and Ethnic Composition in Massachusetts: An Exploratory Study. Rana Charafeddine Boston University School of Public Health
 Traffic Density and Ethnic Composition in Massachusetts: An Exploratory Study Rana Charafeddine Boston University School of Public Health Outline 1. Introduction 2. Research Question 3. Methods 4. Results
Cook County Health Strategic Planning Landscape
 Cook County Health Strategic Planning Landscape Terry Mason, MD COO Cook County Department of Public Health December 21, 2018 1 Cook County Population Change 2000-2010* U.S. Census 2000 population 2010
Rural Manitoba Profile:
 Rural Manitoba Profile: A Ten-year Census Analysis (1991 2001) Prepared by Jennifer de Peuter, MA and Marianne Sorensen, PhD of Tandem Social Research Consulting with contributions by Ray Bollman, Jean
Ethnicity, Political Violence and Internal Migration in Guatemala, : A Multilevel Backward Recurrence Time Model.
 Ethnicity, Political Violence and Internal Migration in Guatemala, 1975-1994: A Multilevel Backward Recurrence Time Model. David P. Lindstrom* Manuel Angel Castillo + Afra Chowdhury* *Population Studies
APPENDIX G DEMOGRAPHICS
 APPENDIX G DEMOGRAPHICS Analyzing current and past demographic data is an important step in defining future transportation needs for individuals living and working in the PPUATS Metropolitan Planning Area.
Downloads from this web forum are for private, non commercial use only. Consult the copyright and media usage guidelines on
 Econ 3x3 www.econ3x3.org A web forum for accessible policy relevant research and expert commentaries on unemployment and employment, income distribution and inclusive growth in South Africa Downloads from
Understanding the magnitude and spatial extent of crime in South Africa. Gregory Breetzke, PhD
 Understanding the magnitude and spatial extent of crime in South Africa Gregory Breetzke, PhD Institute for Security Studies (ISS) Seminar, Pretoria, South Africa, 28 March 2013 My background University
3.1 HISTORIC AND FORECASTED POPULATION FIGURES
 SECTION 3: COMMUNITY PROFILE This section contains an overview of demographic characteristics which are applicable to the analysis of Vaughan s parks, recreation, and library facilities. Identifying who
GDP per capita was lowest in the Czech Republic and the Republic of Korea. For more details, see page 3.
 International Comparisons of GDP per Capita and per Hour, 1960 9 Division of International Labor Comparisons October 21, 2010 Table of Contents Introduction.2 Charts...3 Tables...9 Technical Notes.. 18
Communities in Context: The Health Context for Official Language Minority Communities February 27, 2017
 Communities in Context: The Health Context for Official Language Minority Communities February 27, 2017 Research Team Official Languages Branch Canadian Heritage Overview Health Context Indicators Proportion
Area based community profile : Kabul, Afghanistan December 2017
 Area based community profile : Kabul, Afghanistan December 207 Funded by In collaboration with Implemented by Overview This area-based city profile details the main results and findings from an assessment
Racial Inequities in Montgomery County
 W A S H I N G T O N A R E A R E S E A R C H I N I T I A T I V E Racial Inequities in Montgomery County Leah Hendey and Lily Posey December 2017 Montgomery County, Maryland, faces a challenge in overcoming
Internal migration determinants in South Africa: Recent evidence from Census RESEP Policy Brief
 Department of Economics, University of Stellenbosch Internal migration determinants in South Africa: Recent evidence from Census 2011 Eldridge Moses* RESEP Policy Brief february 2 017 This policy brief
HOUSEHOLD LEVEL WELFARE IMPACTS
 CHAPTER 4 HOUSEHOLD LEVEL WELFARE IMPACTS The household level analysis of Cambodia uses the national household dataset, the Cambodia Socio Economic Survey (CSES) 1 of 2004. The CSES 2004 survey covers
The State of Working Wisconsin 2017
 The State of Working Wisconsin 2017 Facts & Figures Facts & Figures Laura Dresser and Joel Rogers INTRODUCTION For more than two decades now, annually, on Labor Day, COWS reports on how working people
The problem of growing inequality in Canadian. Divisions and Disparities: Socio-Spatial Income Polarization in Greater Vancouver,
 Divisions and Disparities: Socio-Spatial Income Polarization in Greater Vancouver, 1970-2005 By David F. Ley and Nicholas A. Lynch Department of Geography, University of British Columbia The problem of
Working women have won enormous progress in breaking through long-standing educational and
 THE CURRENT JOB OUTLOOK REGIONAL LABOR REVIEW, Fall 2008 The Gender Pay Gap in New York City and Long Island: 1986 2006 by Bhaswati Sengupta Working women have won enormous progress in breaking through
Neighbourhood Inequality in Canadian Cities
 Neighbourhood Inequality in Canadian Cities by J. Myles*, G. Picot** and W. Pyper*** No. 160 11F0019MPE No. 160 ISSN: 1200-5223 ISBN: 0-660-18353-6 Price: $5.00 per issue, $25.00 annually Business and
Racial Inequities in Fairfax County
 W A S H I N G T O N A R E A R E S E A R C H I N I T I A T I V E Racial Inequities in Fairfax County Leah Hendey and Lily Posey December 2017 Fairfax County, Virginia, is an affluent jurisdiction, with