3.1 HISTORIC AND FORECASTED POPULATION FIGURES
|
|
|
- Derrick Gilbert
- 5 years ago
- Views:
Transcription
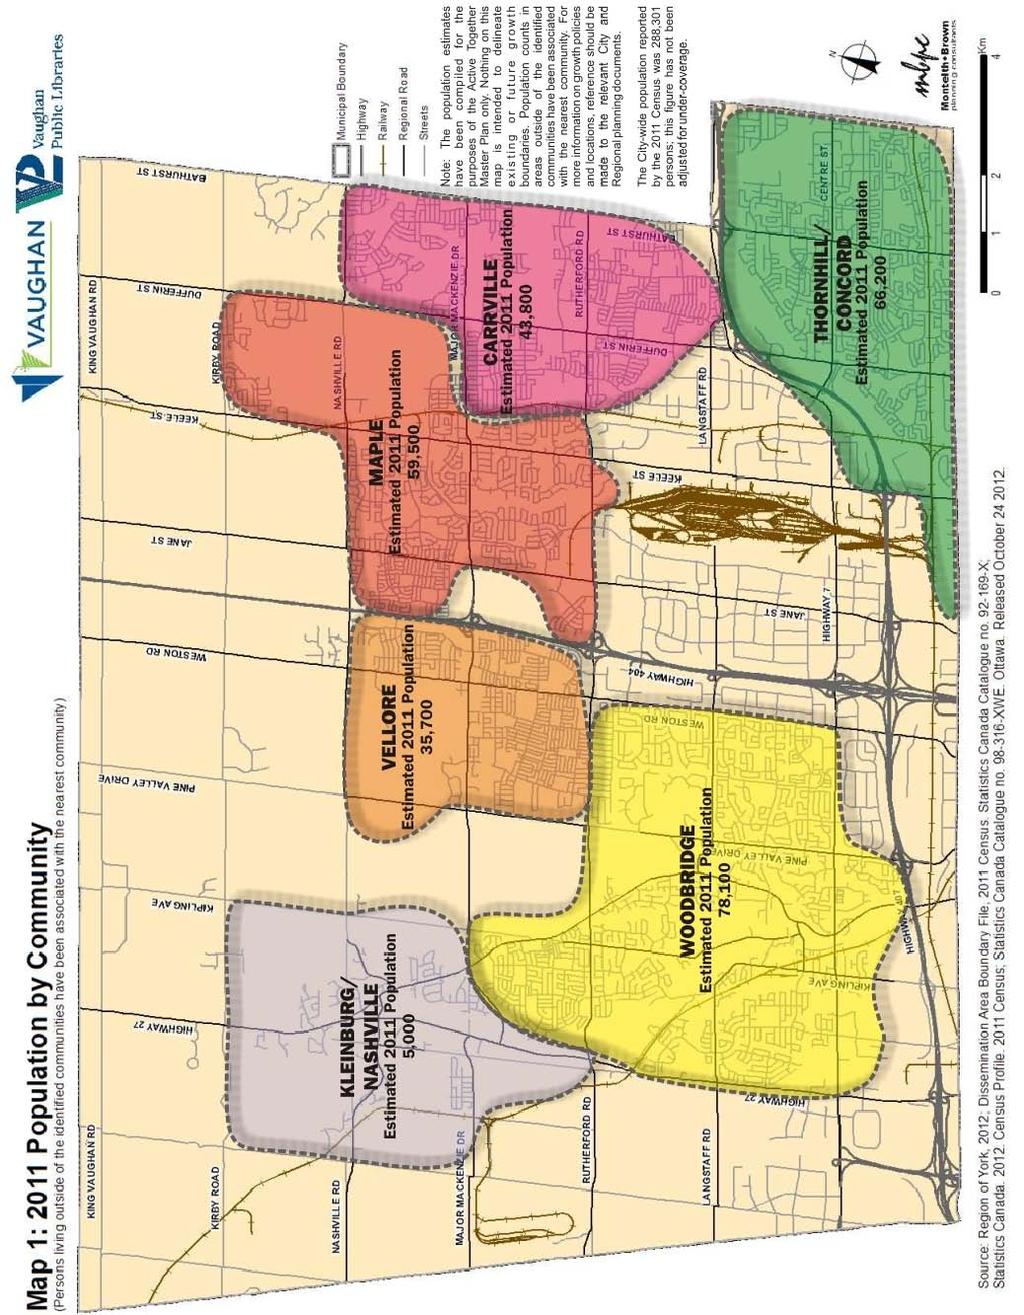
1 SECTION 3: COMMUNITY PROFILE This section contains an overview of demographic characteristics which are applicable to the analysis of Vaughan s parks, recreation, and library facilities. Identifying who lives in Vaughan and how this community profile will differ in the future is essential to understanding and responding to local needs. Note: While the 2011 Census collected information regarding population and household composition, changes made to the census taking, combined with the timing of data releases, means that data on income, education, ethnicity, or place of work is not currently available. In these cases, 2006 Census data has been referenced. 3.1 HISTORIC AND FORECASTED POPULATION FIGURES The City has seen rapid growth in the last thirty years, growing ten fold between 1981 and The following figure illustrates that Vaughan has consistently experienced rapid growth since 1981 and it is anticipated that this level of growth will continue to 2031 (albeit at a somewhat slower rate), reaching a population of 416,600 according to the 2010 Vaughan Official Plan. At present, the forecasts only extend to 2031, making longer term planning difficult. As of December 31, 2012, the Region of York estimates the City of Vaughan s population to be approximately 311,200. Figure 3: City of Vaughan Historic and Forecasted Population Growth ( ) 450, , , ,000 Historic Forecasted 288, , , , , , , , , ,000 50, ,674 65, , , , Sources: 1981 to 2011 Statistics Canada Census Data; 2016 to 2026 York Region (2012); 2031 City of Vaughan Official Plan For the purposes of the 2013 ATMP, Vaughan has been divided into six communities, as seen on Map 1 on the following page; note: this map is not intended to depict current or future growth boundaries. 10
2 11
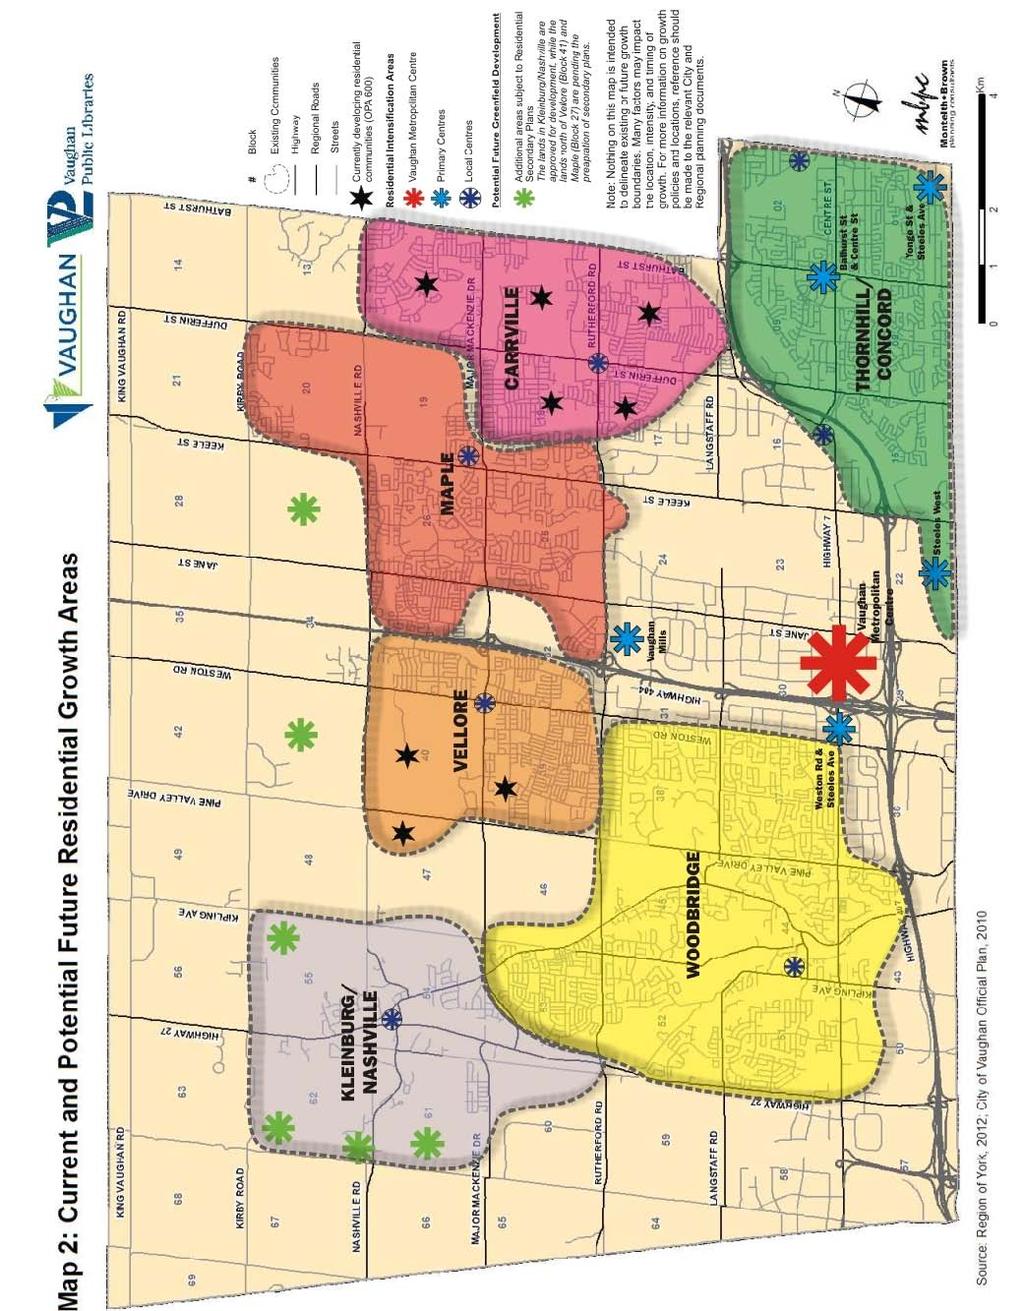
3 Current forecasts suggest that Vaughan is expected to grow by 105,400 persons between 2013 and To one degree or another, this growth will be accommodated in all areas of the City, both through greenfield development and infill/intensification. Increases in compact dwelling types (e.g., apartments) and overall densities are expected. Vaughan s Official Plan (2010) has identified a number of corridors and mixed use centres that will accommodate a 45% intensification target. This increase in compact dwelling types will have implications on the provision of municipal parks, recreation, and library facilities. Vaughan will continue to experience facility pressures, particularly in areas of intensification, coupled with the limited passive and active pursuits as higher densities are achieved, while recognizing that residents may have more access to private communal facilities in intensification areas. The matter of when and where growth will occur is a complex issue. The City s Official Plan 3 (2010) provides considerable direction in this regard; however, the precise details of development will be determined through secondary plans and site specific applications over time. To date, several secondary plans have been completed (e.g., Vaughan Metropolitan Centre), while others are currently being prepared and some are yet to be initiated. Map 2 on the following page illustrates the general location of Vaughan s existing communities, along with current and potential future residential growth areas (note: nothing on this map is intended to delineate existing or future growth boundaries). This information has been compiled from the 2010 Official Plan and information provided by the City s Policy Planning Department. The purpose of this map is to illustrate at a high level the general areas where future growth may occur, so that future needs can be identified through this Active Together Master Plan. Specifically, Map 2 identifies areas of current growth, potential future greenfield development, and residential intensification areas. Additional residential growth may occur outside of the areas identified on the map; however, this growth is likely to be of a lower magnitude. Note that areas of predominantly employment growth are not shown on the map. Much of the City s ongoing development was approved under OPA 600 or a pre existing secondary plan, and is made up of primarily residential development organized around local centres. These include: Carrville Blocks 10, 11, 12, 17, and 18 Vellore Blocks 33 West, 39, 40, and 47 Kleinburg Block 61 (Nashville Heights) Vaughan s New Community Areas i.e., areas of future residential growth as defined in the Vaughan Official Plan (2010) are located in the following areas and will be the subject of secondary plans. They are to be planned as complete communities. Block 27 North of the existing Maple community Block 41 North of the Vellore community 3 The City of Vaughan Official Plan was adopted by Council in September 2010, modified and endorsed by Regional Council in June 2012, and subsequently appealed to the Ontario Municipal Board. 12
4 13
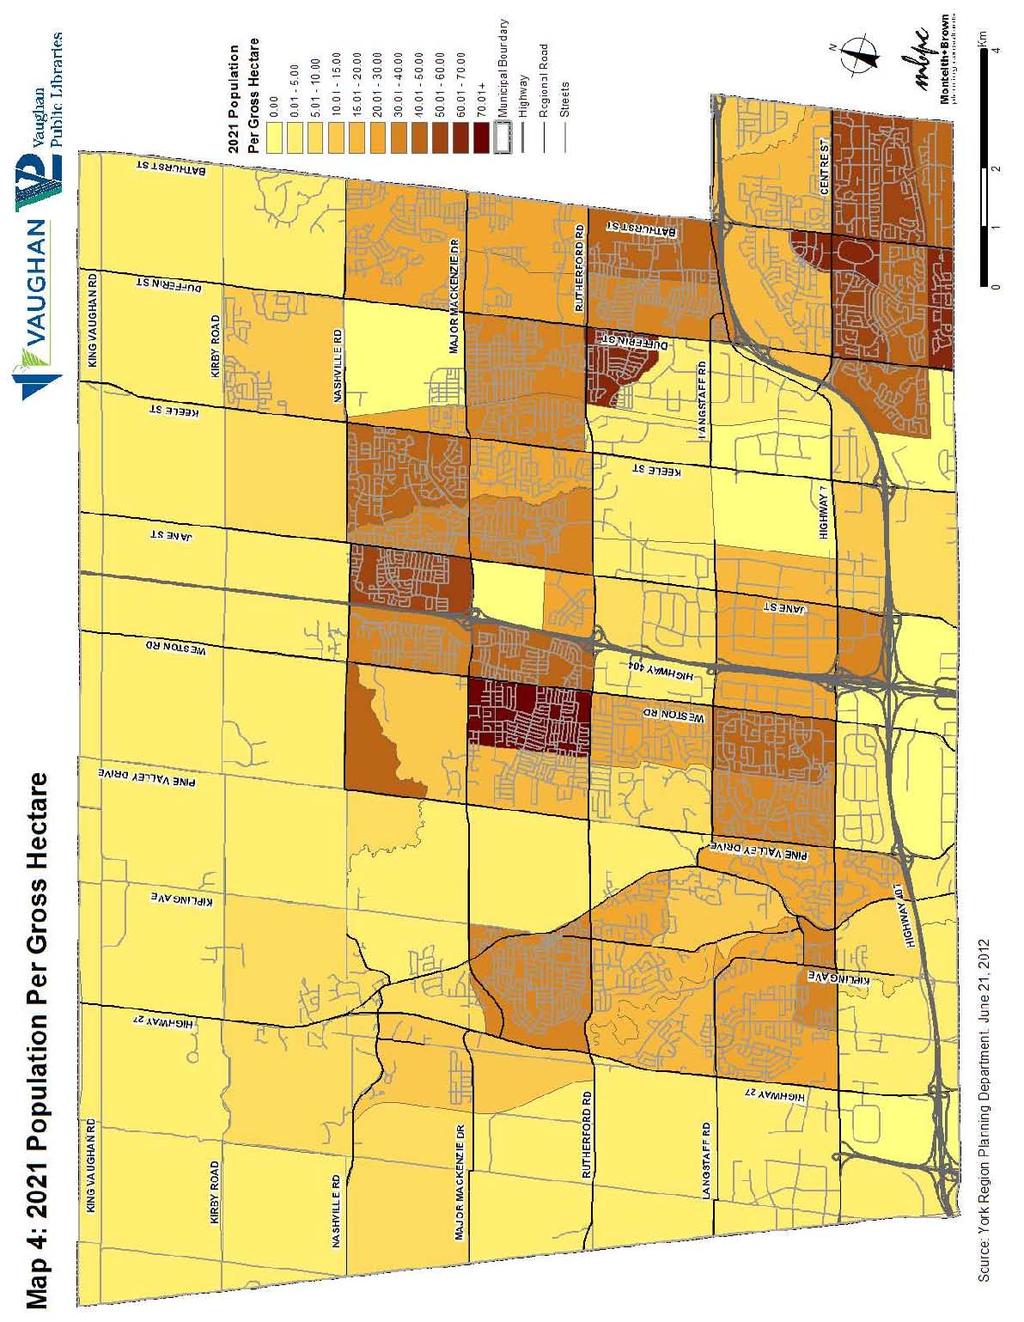
5 The Vaughan Official Plan (2010) also provides for a new secondary plan, which will take residential development to the northern boundaries of the original Kleinburg Nashville Community Plan. This will permit the development of parts of Blocks 62 (Nashville Village and the Huntington Road Community) and Block 55 (the Kipling Avenue Community). This plan, the North Kleinburg Nashville Secondary Plan, was adopted by Vaughan Council in September 2010 and has been approved by the Ontario Municipal Board. Intensification areas will be the primary locations for the accommodation of Vaughan s 45% intensification target. They consist of a hierarchy of mixed use centres, including: The Vaughan Metropolitan Centre (VMC), which will accommodate a wide range of residential, office, retail, cultural and civic uses and become the City s downtown. The VMC will be the location of the tallest buildings and most intense concentration of development. The VMC Secondary Plan was adopted by Council in September 2010 and has been appealed to the Ontario Municipal Board (OMB). Primary Centres will be locations for predominantly mixed use high and mid rise buildings that will be built as compact, pedestrian friendly, transit supportive and complete communities. Primary Centres that include residential development are as follows: o Yonge St. Steeles Ave. Intersection: Currently subject to the Yonge Steeles Corridor Secondary Plan, adopted by Council in September Currently appealed to the OMB. o Vaughan Mills Centre: The Vaughan Mills Centre Secondary Plan study is currently being o prepared. Weston Road and Highway 7 (west of Highway No. 400): The preparation of a secondary plan for this area is planned. o Steeles West: Approved under Official Plan Amendment No o Bathurst St. and Centre St. (Promenade): Subject to a future secondary plan study. Local Centres will provide the mixed use focus for their respective communities at a lower scale and more limited range of uses. There is at least one such centre in each Vaughan community. Similarly, the map identifies a number of areas that may be subject to site specific plans for residential development. Additional mixed use residential and/or employment intensification will also be examined along Primary Intensification Corridors (not shown on Map 2), including Regional Corridors (e.g., Highway 7/Centre Street and Yonge Street) and local corridors (e.g., Jane Street and Major Mackenzie Drive). Two examples currently underway are the Centre Street Study in Thornhill and the Maple GO Secondary Plan study on the north side of Major Mackenzie Drive in Maple. To help quantify when and where growth may occur, population forecasts generated by the Region of York have been examined. These forecasts were created for the benefit of the Region s Official Plan (2010) and represent one possible growth scenario. While they are aligned (at a regional level) to the Growth Plan for the Greater Golden Horseshoe, they have not been adjusted to account for 2011 Census data. These forecasts will be used in concert with other demand factors, such as geographic distribution and participation trends, to assist in the identification of long term infrastructure requirements within the context of this Plan. The unique characteristics of the centres (i.e., VMC, Primary Centres, and Local Centres) will also need to be taken into consideration, such as total population, density and demographics in arriving at the appropriate mix of services. Maps 3, 4, and 5 illustrate population by gross density based on the Region of York s traffic zone forecasts for 2011, 2021, and
6 15
7 16
8 17
9 The community specific population projections used in this Plan are based on the most recent traffic zone forecasts provided by the Region of York; they have been updated from the dataset contained in the 2008 ATMP. While these forecasts are consistent with Vaughan s citywide targets to the year 2031, the location and timing of growth is more uncertain and will be impacted by a variety of factors including market conditions, availability of services, the outcomes of a number of secondary plans, ongoing appeals to the Ontario Municipal Board, and future development applications. Although a detailed assessment of growth patterns is beyond the scope of this project, these areaspecific forecasts were reviewed against the City s Where and How to Grow report (June 2009); this report was used as background for the new Vaughan Official Plan and subsequent secondary plans, and thus provides a filter through which to evaluate the Region of York traffic zone forecasts. In comparing the various datasets, as well as major development applications approved since the growth forecasts were derived, it is apparent that the population target for the Thornhill/Concord area is underestimated and that a higher figure is warranted. Continued monitoring of planning and development approvals and other influencing factors will be necessary to properly plan for parks, recreation, and library infrastructure. The following table illustrates the 2011 Census population for each community, as well as their 2021 and 2031 forecasted populations. Table 1: Population Forecasts by Community, Population Population (Census) % of Citywide Pop. Population (Forecast) % of Citywide Pop. Population (Forecast) % of Citywide Pop. Change ( ) Carrville 43,800 15% 59,700 17% 65,800 16% 22,000 Kleinburg/Nashville 5,000 2% 20,500 6% 24,900 6% 19,900 Maple (see Note 1 below) 59,500 21% 61,700 17% 75,300 18% 15,800 Thornhill/Concord (see Note 2 below) 66,200 23% 73,800 20% 84,700 20% 18,500 Vaughan Metropolitan Centre 17,800 5% 28,100 7% 28,100 Vellore (see Note 3 below) 35,700 12% 47,400 13% 58,700 14% 23,000 Woodbridge 78,100 27% 79,600 22% 79,100 19% 1,000 Total 288, % 360, % 416, % 128,300 Sources: 2011 data Statistics Canada (Census Profile Census. Statistics Canada Catalogue no XWE. Ottawa. Released October ); 2021 and 2031 data York Region (2012) Notes: 1. For the purpose of this study, Maple includes the Block 27 New Community Area. 2. Should residential intensification targets be realized in Thornhill/Concord, this area could experience additional growth over and above the forecasts in the following table. 3. For the purpose of this study, Vellore includes the Block 41 New Community Area. 4. These population estimates have been compiled for the purposes of this Active Together Master Plan only. Population counts in areas outside of the identified communities have been associated with the nearest community; as such, no rural or employment area population has been recorded. These figures have not been adjusted for under coverage. Totals may not add due to rounding. 18
10 All communities are expected to grow by Most notably, the Vaughan Metropolitan Centre is forecasted to grow by approximately 28,100 people (note: the population target established in the VMC secondary plan is 25,000 residents). Vellore (23,000), Carrville (22,000), Kleinburg/Nashville (19,900), Thornhill/Concord (18,500+), and Maple (15,800) are also expected to accommodate considerable population growth. Woodbridge is forecasted for more modest growth (1,000 persons). Brief Profiles of Vaughan s Communities While each of the City s new residential communities and intensification areas may have particular parks, recreation, and/or library requirements, grouping them into larger communities allows for their needs to be evaluated from a broader perspective, with more detailed and area specific analyses to be undertaken at the appropriate time, such as when preparing secondary plans or at the time of the 5 year Official Plan Review. Based on Census data and information presented in this section, a brief profile of each of the six communities has been developed. Carrville Carrville is a new residential development area that currently had a 2011 estimated population of 43,800. This is one of the youngest communities in Vaughan given that it is popular among young families. As of 2011, approximately 63% of the population was under the age of 39. Generally speaking, residents of Carrville have higher incomes and are well educated. This community also has a notable visible minority population, particularly residents of South Asian descent. This area includes ongoing residential development in Blocks 10, 11, 12, 17 and 18, as well as future growth in the Carrville Local Centre. The 2031 forecast estimates a population of 65,800. Kleinburg/Nashville Note: Kleinburg has been combined with the newly developing residential area of Nashville (Block 61) for the purposes of this plan. The Village of Kleinburg is one of the oldest communities in Vaughan and has a proud heritage. Kleinburg is a generally small residential area (estimated 2011 population of 5,000) that is bordered by rural areas and somewhat isolated, but is seeing modest growth in some surrounding areas, including Nashville Heights to the south. The area contains a mix of a high proportion of households with larger families as well as older residents, many of whom are either single or two person households. Residents in this area are also characterized as having higher levels of income and education. The York Catholic District School Board is proposing a new elementary school (2015) in this area due to growth. Past research has indicated that outdoor recreation activities and trails are highly valued by Kleinburg residents; in fact, building on this is one of the goals of the Kleinburg Economic Development Strategy (2011). This area includes future residential development in Blocks 55, 61, and 62, as well as the Historic Kleinburg Village Local Centre. The 2031 forecast estimates a population of 24,
11 Maple The community of Maple (2011 estimated population of 59,500) has experienced rapid growth over the last decade with residential expansion, which has attracted many young families to the community. As a result, Maple is one of Vaughan s younger communities but is beginning to mature. As of 2011, approximately 55% of the population was under the age of 39. Like the Carrville area, Maple residents generally have higher levels of income and are well educated. Maple is also becoming more ethnically diverse, with South Asian descent representing the largest minority group, followed by Black and Southeast Asian. This area includes future residential development in the Vaughan Mills Primary Centre and Historic Maple Village Local Centre, as well as Block 27 (subject to secondary plan approval). The 2031 forecast estimates a population of 75,300. Thornhill/Concord Note: Thornhill has been combined with the largely industrial and commercial area of Concord for the purposes of this plan. Thornhill/Concord (2011 estimated population of 66,200) is the City s most densely populated area accounting for almost 23% of the City s inhabitants. Thornhill/Concord is the oldest community in Vaughan and its population is aging. As of 2011, 54% of the population was over the age of 40. Due to this maturing population, the York Catholic District School Board indicates that Thornhill is experiencing declining student enrolment. Residents in Thornhill/Concord generally have higher levels of income and are highly educated. Thornhill/Concord is also one of the most ethnically diverse communities in Vaughan, largely represented by Chinese, South Asian, and Filipino descent. This area includes future residential development in the Bathurst St. & Centre St., Yonge St. & Steeles Ave., and Steeles West Primary Centres, as well as the Concord and Historic Thornhill Village Local Centres. The 2031 forecast estimates a population of 84,700. As mentioned earlier, potential mid and high rise residential intensification could adjust this target significantly upward. Vaughan Metropolitan Centre (VMC) From the Vaughan Official Plan: The Vaughan Metropolitan Centre will become the City s downtown. It will be a place of regional importance centred on the planned subway station at Highway 7 and Millway Avenue. The Vaughan Metropolitan Centre is a strategic location for the concentration of the highest densities and widest mix of uses in the City, allowing it to become a multi faceted and dynamic place to live, work, shop and play, attracting activity throughout the day. This area includes future residential development in portions of Blocks 22, 23, 29, and 30 (Highway 7, east of Highway 400). The VMC has only a nominal population at present and is forecasted to grow to 28,100 persons by 2031 according to the Region s projections. The VMC Secondary Plan indicates that the area The VMC boundary area is intended to accommodate a minimum of 12,000 residential units (approximately 25,000 people) by
12 Vellore In 2011, the Vellore area had an estimated population of 35,700 and continues to experience significant growth. Vellore is one of Vaughan s youngest communities. It is estimated that approximately 64% of Vellore s residents are under the age of 39. Similar to the communities of Carrville and Maple, Vellore is popular among young families. As a result, the York Catholic District School Board is proposing to develop two new schools (2013 and 2014) in this area to accommodate future demand. Vellore residents generally have higher incomes and are well educated. This area can also be characterized as having a high visible minority population, including residents of South Asian descent. This area includes ongoing residential development in Blocks 33 West, 39, 40, and 47, as well as future residential development in the Vellore Local Centre and Block 41 (subject to secondary plan approval). The 2031 forecast estimates a population of 58,700. Woodbridge Woodbridge is Vaughan s largest community with an estimated 2011 population of 78,100. This community is generally aging. The estimated 2011 population suggests that approximately 52% of the population is over the age of 40, and it is anticipated that this aging trend will continue. Due to this maturing population, some schools in the southern portion of this community are experiencing declining enrolment. Similar to other communities in Vaughan, residents in Woodbridge are generally well educated with higher levels of income. This community also has a large Italian population, but like other areas of Vaughan, it is quickly becoming more culturally diverse, with a large visible minority group of South Asian descent, particularly in new residential areas. This area includes future residential development in the Weston Rd. & Highway 7 Primary Centre (Highway 7, west of Highway 400) and Historic Woodbridge Village Local Centre. The 2031 forecast estimates a population of 79, AGE COMPOSITION The age composition of a community can be a useful indicator of the types of services that will be demanded in that community. For example, communities with a higher proportion of children and youth typically have a higher demand for more active forms of recreation such as soccer or waterplay, while communities with a higher proportion of older adults often have a higher demand for more passive activities such as low impact fitness and lifelong learning opportunities. According to the 2011 Census, Vaughan s median age is 37.9 years, which is slightly younger than the Region s median age of 39.3 and the Provincial median age of Despite its younger profile, Vaughan s population is aging as a whole, with the median age increasing by two years since the 2006 Census (35.9 years). 21
13 Figure 4: Vaughan Population Pyramids; 2011 and Population Age Profile (Census) Population Age Profile (Region Forecast for Vaughan) 20,000 10, ,000 20,000 Source: Statistics Canada (2011); York Region (2012) 20,000 10, ,000 20,000 The following table identifies the City s 2011 age breakdown by major age category, along with projections for 2021 and For 2011, Census data was used while the Region s forecasts were used for 2021 and It bears noting that the Census data is under counted (the current population estimate is 311,200) and that the Region s forecasts were created without the benefit of 2011 Census data, which may affect the population modelling. Table 2: Population Forecasts by Age Group, 2011 to Growth Age Group Census % Forecast % Forecast % ( ) 0 to 19 79,100 27% 84,300 23% 90,200 22% 11,100 14% 20 to 34 53,000 18% 72,100 20% 76,200 18% 23,200 44% 35 to 49 70,900 25% 78,600 22% 89,300 21% 18,300 26% 50 to 59 38,100 13% 52,000 14% 54,400 13% 16,300 43% ,100 16% 73,400 20% 106,400 26% 59, % Total 288, % 360, % 416, % 128,300 44% Sources: Statistics Canada (2011 Census); York Region (2012) Totals may not add due to rounding This data suggests that all age cohorts will see positive growth to the year Continued population growth will result in increased pressures and demands across all age groups, particularly in areas of intensification and where young families are attracted to live. The 2011 age profile for Vaughan illustrates 70% of the City s population is currently under the age of 50. However, as the baby boomer generation (now age 49 to 67) ages, the median age in the City is expected to rise. To illustrate this, the number of older adults (age 60+) in Vaughan is forecasted to more than double by 2031, growing from 47,100 persons in 2011 (representing 16% of the population) to 106,400 persons in 2031 (representing 26% of the population). Nevertheless, although the City s 22

 is forecasted for the 0 to 19 age group. As a proportion of the population, the 0 to 19 age group is anticipated to decline from 28% to 22% between 2011 and 2031.")
14 population profile is changing over the next twenty years, all age groups are anticipated to experience growth. The greying of the population is a common demographic trend that is being observed across Canada, and Vaughan s population can be expected to continue to age throughout the foreseeable future. As a result, Vaughan may experience slightly greater demand and pressures for facilities, programs, and services for older adults and seniors. Conversely, slower growth (14%) is forecasted for the 0 to 19 age group. As a proportion of the population, the 0 to 19 age group is anticipated to decline from 28% to 22% between 2011 and However, there is evidence that growth in younger cohorts may be stronger than what is currently forecasted 2011 Census data indicates that the number of children ages 0 to 4 across Canada increased by 11% since 2006, which is the most significant growth in this category since the baby boom following the Second World War. This is due to an increase in fertility rates and the baby boom echo being of prime child bearing age. Continued monitoring of population forecasts is recommended. 3.3 HOUSEHOLD INCOME Income can also influence participation in parks, recreation and library activities. Research indicates that, generally speaking, high levels of income tend to correlate with higher levels of participation in leisure activities. The City offers a RecAssist program, which provides financial assistance subsidies to those living under the Low Income Cut Off (LICO). As illustrated in the following graphic, the 2006 Census reported that the median income in Vaughan was $84,312 for all census families, considerably higher compared to the province, but lower compared to the Region. Individual household earnings in Vaughan were generally on par with the Region, and again higher than the Province. Based solely on income alone, this could indirectly infer that general participation rates in Vaughan are higher compared to the Province, but marginally lower compared to the Region of York as a whole. Figure 5: Median income in 2005 $100,000 $84,312 $88,872 $69,156 $50,000 $33,673 $32,505 $29,335 $ Families Individuals ( 15 Years and Older) Vaughan York Region Ontario Source: Statistics Canada (2006 Census) The cost of living is also higher in Vaughan. According to York Region, in 2010, the average price of a new and resale detached dwelling in Vaughan for is $621,175 and $551,881, respectively, considerably higher than the regional average of $566,110 and $551,811, respectively. 4 The average monthly rent for 4 York Region. Living in York Region: Our community check up. Context indicators workbook
 compared to the Region (13%) and the Province (14%).")

15 an apartment in Vaughan in 2010 was $1,144, $76 and $164 more than the regional and provincial averages, respectively. 5 Despite these challenges, Vaughan has a lower proportion of lower income residents (11%) compared to the Region (13%) and the Province (14%). Furthermore, York Region s Vital Signs suggest that the increasing gap between the rich and the poor is impacting individuals and community prosperity, which in turn, can negatively affect residents level of participation in parks, recreation, and library pursuits. Affordable parks, recreation, and library opportunities is a critical consideration in order to engage households with financial barriers through the provision of low to no fee activities and programs. 3.4 EDUCATION The level of education can also impact participation rates, with many studies correlating higher participation levels with higher degrees of education (e.g., generally, the greater the level of educational attainment, the more likely they are to participate in recreational and library activities). Among those age 15 years or older, Vaughan generally shares the same level of education as the province, but lower than the Region (2006 Census data). Vaughan has a higher proportion of university educated residents (29%) compared to the Province (24%), but lower than the Region (32%). Solely based on education attainment alone, it can be expected that residents of the broader Region of York are more likely to participate in parks, recreation and library activities compared to Vaughan residents. Figure 6: Educational Attainment, City of Vaughan (Population 15 years and older) University certificate, diploma or degree 20% 24% 26% University certificate or diploma below the bachelor level College, CEGEP or other non university certificate diploma Apprenticeship or trades certificate or diploma High school certificate or equivalent No certificate, diploma or degree Source: Statistics Canada (2006 Census) 5% 6% 4% 7% 6% 8% 16% Vaughan 17% 18% York Region Ontario 24% 19% 27% 22% 19% 22% 5 Ibid 24
16 3.5 IMMIGRATION, ETHNICITY AND LANGUAGE According to the 2006 Census, nearly 45% of Vaughan s population is represented by immigrants, many of whom are of Italian, Jewish, and Eastern European descent. This figure is growing research undertaken for the Vaughan Public Libraries Strategic Plan suggests the foreign born population may now account for 53% of Vaughan residents and could increase to 60% by Based on estimates from the 2011 National Household Survey 6, the City (46%) has a higher percentage of immigrants than the Region (45%) and considerably more than the Province (29%). Approximately 51% of immigrants arrived before 1991, 26% arrived between 1991 and 2000, and 23% arrived between 2001 and Estimates from the 2011 National Household Survey 7 indicate that 31% of Vaughan s population are also visible minorities, lower than the regional average (43%), but greater than the provincial average (26%). This visible minority population is largely represented by residents of South Asian descent (31%), followed by Chinese (15%). Based on the immigration trends observed throughout the GTA, it is anticipated that the proportion of immigrants will continue to increase, particularly from countries such as Russia, India, and Ukraine 8, given that immigrants are attracted to areas with established ethnic communities, families, and social ties. This strong level of ethnic diversity influences demand for nontraditional programs, services, and activities, encouraging an integrated social support system immigrant groups typically seek. Recently released data from the 2011 Census indicates that 46% of residents reported that their mother tongue is English. Approximately 54% of residents mother tongue is a non official language. These proportions are similar to the reporting from the 2006 Census. The most common non official mother tongue is Italian (28%), followed by Russian (13%), and Chinese/Cantonese (6%). The 2011 Census also reported that English is the most common language spoken at home (66%), while 26% speak a nonofficial language. The most common non official language spoken at home is Italian (19%), followed by Russian (17%), and Chinese/Cantonese (8%) As a result, the increasing diversity among languages will continue to drive the need for a variety of multi lingual services, staff, and materials. 3.6 PLACE OF WORK AND MODE OF TRANSPORTATION The 2006 Census reported that 126,365 residents (15 years or older) were employed, representing over 53% of the 2006 population. This proportion is shared with the Region and is slightly higher than the provincial average (51%). Despite being a significant employment centre in its own right, the City of Vaughan has a large commuter population, with 54% of the employment base working in other communities in York Region, throughout the GTA, and the province. Nearly 29% of the workforce work in Vaughan, and the remaining 17% work at home, have no fixed work address, or work outside of Canada. Conversely, many non residents are also employed within Vaughan, which may impact local facilities and parks. This large commuter base has a noteworthy impact on the provision of parks, recreation, and library facilities, 6 The National Household Survey was a voluntary, self administered survey conducted for the first time in 2011 as a replacement for the long census questionnaire. Due to the survey methodology, the City of Vaughan data has a non response rate of 23.2%, which may affect data quality. 7 Ibid. 8 Public Interest Strategy & Communications. Vaughan Profiles. Toronto: Public Interest Strategy & Communications
17 particularly with respect to greater demands for prime time activities as well as those that can be selfscheduled depending on one s availability. Given that over half of employed residents work in surrounding communities, Vaughan is an autooriented community where nearly 88% of the workforce travels by private vehicle to work as a driver or passenger. As of 2006, less than 10% of the workforce travelled by public transportation and the remaining 2% travelled on foot, bicycle, or other mode of transportation. The provision of high quality infrastructure such as sidewalks and cycle lanes is key to encouraging non motorized alternatives to transportation to reduce traffic congestion and promote a healthy, active lifestyle. According to York Region s Context indicators (2011), 42% of Vaughan s streets have sidewalks, slightly lower than the Regional average (46%). At the time, Vaughan was also recognized to have a total of 36 kilometres of cycle lanes, of which 28 kilometres were located in urban areas. The City continues to work to expand its trails and active transportation systems through implementation of pedestrian and bicycle network strategies and the updated Transportation Master Plan. 26
Greater Golden Horseshoe Transportation Plan
 Greater Golden Horseshoe Transportation Plan Socio-Economic Profile Executive Summary October 2017 PREPARED BY Urban Strategies Inc. and HDR for the Ministry of Transportation SOCIO-ECONOMIC PROFILE -
Town of Niagara-on-the-Lake Official Plan Review Growth Analysis Technical Background Report
 Town of Niagara-on-the-Lake Official Plan Review Growth Analysis Technical Background Report In association with: October 16, 2015 Contents Page Executive Summary... (i) 1. Introduction... 1 2. Population,
The Planning & Development Department recommends that Council receive this report for information.
 CORPORATE REPORT NO: R237 COUNCIL DATE: November 19, 2018 REGULAR COUNCIL TO: Mayor & Council DATE: November 15, 2018 FROM: General Manager, Planning & Development FILE: 6600-01 SUBJECT: Surrey Community
Social and Demographic Trends in Burnaby and Neighbouring Communities 1981 to 2006
 Social and Demographic Trends in and Neighbouring Communities 1981 to 2006 October 2009 Table of Contents October 2009 1 Introduction... 2 2 Population... 3 Population Growth... 3 Age Structure... 4 3
Chapter One: people & demographics
 Chapter One: people & demographics The composition of Alberta s population is the foundation for its post-secondary enrolment growth. The population s demographic profile determines the pressure points
Fanshawe Neighbourhood Profile
 Fanshawe Profile For further information contact: John-Paul Sousa Planning Research Analyst Direct: (519) 661-2500 ext. 5989 I email: jpsousa@london.ca Page 1 Page 2 Population Characteristics & Age Distribution
Community Social Profile Cambridge and North Dumfries
 Community Trends for 2013 in Cambridge, North Dumfries, Wellesley, Wilmot and Woolwich Community Social Profile - Cambridge and North Dumfries Published December 2014 Community Social Profile Cambridge
Metro Vancouver Backgrounder Metro 2040 Residential Growth Projections
 Metro Vancouver 2040 - Backgrounder Metro 2040 Residential Growth Projections Purpose Metro Vancouver 2040 Shaping our Future, Metro s draft regional growth strategy, was released for public review in
Bostwick Neighbourhood Profile
 Bostwick Profile For further information contact: John-Paul Sousa Planning Research Analyst Direct: (519) 661-2500 ext. 5989 I email: jpsousa@london.ca Page 1 Page 2 Population Characteristics & Age Distribution
Release of 2006 Census results Labour Force, Education, Place of Work and Mode of Transportation
 Backgrounder Release of 2006 Census results Labour Force, Education, Place of Work and Mode of Transportation On March 4, 2008 Statistics Canada released further results from the 2006 census focusing on
Immigrant. coquitlam, B.C Coquitlam Immigrant Demographics I
 Immigrant demographics coquitlam, B.C. - 2018 Immigrant Demographics I Page 1 coquitlam IMMIGRANT DEMOGRAPHICS Your quick and easy look at facts and figures around immigration. Newcomers are an important
AVERAGE HOUSEHOLD INCOME $103,177 ($93,586) RENTERS 21% (29%) UNEMPLOYMENT RATE 5% (7%) TAKE TRANSIT TO WORK 6% (15%)
 RENTERS 21% (29%) UNEMPLOYMENT RATE 5% (7%) TAKE TRANSIT TO WORK 6% (15%)") CITY OF COMMUNITY PROFILES 2016 Census Data City of Surrey Statistics WHALLEY CITY CENTRE GUILDFORD FLEETWOOD NEWTON AREA 4,917 ha (32,621 ha) AVERAGE HOUSEHOLD INCOME $103,177 ($93,586) SOUTH POPULATION
CITY OF COMMUNITY PROFILES 2016 Census Data City of Surrey Statistics WHALLEY CITY CENTRE GUILDFORD FLEETWOOD NEWTON AREA 4,917 ha (32,621 ha) AVERAGE HOUSEHOLD INCOME $103,177 ($93,586) SOUTH POPULATION
CENSUS RESULTS NATIONAL HOUSEHOLD SURVEY
 2011 CENSUS RESULTS NATIONAL HOUSEHOLD SURVEY INTRODUCTION The inaugural National Household Survey (NHS) was a voluntary survey which replaced the mandatory long-form census questionnaire. The NHS was
TOWNSHIP OF LANGLEY, B.C Township of Langley Immigrant Demographics I
 Immigrant demographics TOWNSHIP OF LANGLEY, B.C. - 2018 Township of Langley Immigrant Demographics I Page 1 TOWNSHIP OF LANGLEY IMMIGRANT DEMOGRAPHICS Your quick and easy look at facts and figures around
Immigrant DELTA, B.C Delta Immigrant Demographics I
 Immigrant demographics DELTA, B.C. - 2018 Immigrant Demographics I Page 1 DELTA IMMIGRANT DEMOGRAPHICS Your quick and easy look at facts and figures around immigration. Newcomers are an important and growing
Immigrant PORT COQUITLAM, B.C Port Coquitlam Immigrant Demographics I
 Immigrant demographics PORT COQUITLAM, B.C. - 2018 Immigrant Demographics I Page 1 PORT COQUITLAM IMMIGRANT DEMOGRAPHICS Your quick and easy look at facts and figures around immigration. Newcomers are
COMMUNITY PROFILE COQUITLAM. Coquitlam Immigrant Demographics I Page 1
 COMMUNITY PROFILE COQUITLAM Coquitlam Demographics I Page 1 COQUITLAM IMMIGRANT DEMOGRAPHICS Your quick and easy look at facts and figures around immigration. Newcomers are an important and growing part
AVERAGE HOUSEHOLD INCOME $97,637 ($93,586) RENTERS 22% (29%) UNEMPLOYMENT RATE 7% (7%) TAKE TRANSIT TO WORK 15% (15%)
 RENTERS 22% (29%) UNEMPLOYMENT RATE 7% (7%) TAKE TRANSIT TO WORK 15% (15%)") CITY OF COMMUNITY PROFILES 2016 Census Data City of Surrey Statistics WHALLEY CITY CENTRE GUILDFORD NEWTON CLOVERDALE AREA 1,809 ha (32,621 ha) AVERAGE HOUSEHOLD INCOME $97,637 ($93,586) SOUTH POPULATION
CITY OF COMMUNITY PROFILES 2016 Census Data City of Surrey Statistics WHALLEY CITY CENTRE GUILDFORD NEWTON CLOVERDALE AREA 1,809 ha (32,621 ha) AVERAGE HOUSEHOLD INCOME $97,637 ($93,586) SOUTH POPULATION
Tracking Trends in Kingston
 Tracking Trends in Photo: 22, Courtesy of City Hall Total Population: 152,358 Population Changes for CMAs, 21 to 26 25 19.2 2 15 1 11.6 9.2 8.9 8.2 6.6 59 5.9 55 5.5 54 5.4 51 5.1 51 5.1 5 5. 46 4.6 3.8
NATIONAL HOUSEHOLD SURVEY: LABOUR FORCE, EMPLOYMENT, AND INCOME
 Clause No. 15 in Report No. 1 of was adopted, without amendment, by the Council of The Regional Municipality of York at its meeting held on January 23, 2014. 15 2011 NATIONAL HOUSEHOLD SURVEY: LABOUR FORCE,
OF ALL RESIDENTIAL UNIT STARTS. in York Region were in centres and corridors. of new office space was started in centres and corridors
 Program Results Bulletin May 2016 York Region s Centres and Corridors Program is about city-building. Centres and Corridors is the term that is used to describe the foundation of York Region s planned
Demographics. Chapter 2 - Table of contents. Environmental Scan 2008
 Environmental Scan 2008 2 Ontario s population, and consequently its labour force, is aging rapidly. The province faces many challenges related to a falling birth rate, an aging population and a large
STRENGTHENING RURAL CANADA: Fewer & Older: The Coming Demographic Crisis in Rural Ontario
 STRENGTHENING RURAL CANADA: Fewer & Older: The Coming Demographic Crisis in Rural Ontario An Executive Summary 1 This paper has been prepared for the Strengthening Rural Canada initiative by: Dr. Bakhtiar
COMMUNITY PROFILE TOWNSHIP OF LANGLEY. Township of Langley Immigrant Demographics I Page 1
 COMMUNITY PROFILE TOWNSHIP OF LANGLEY Township of Langley Demographics I Page 1 TOWNSHIP OF LANGLEY IMMIGRANT DEMOGRAPHICS Your quick and easy look at facts and figures around immigration. Newcomers are
Population Aging, Immigration and Future Labor Shortage : Myths and Virtual Reality
 Population Aging, Immigration and Future Labor Shortage : Myths and Virtual Reality Alain Bélanger Speakers Series of the Social Statistics Program McGill University, Montreal, January 23, 2013 Montréal,
What is the Census? Why is it important?
 1 What is the Census? Every five years, Statistics Canada conducts a Census providing a detailed account of the Canadian population. The Census is intended to provide snapshot of the demographic, social
Assessment of Demographic & Community Data Updates & Revisions
 Assessment of Demographic & Community Data Updates & Revisions Scott Langen, Director of Operations McNair Business Development Inc. P: 306-790-1894 F: 306-789-7630 E: slangen@mcnair.ca October 30, 2013
What Lies Ahead: Population, Household and Employment Forecasts to 2040 April Metropolitan Council Forecasts to 2040
 The Metropolitan Council forecasts population, households and employment for the sevencounty Minneapolis-St. Paul region with a 30-year time horizon. The Council will allocate this regional forecast to
And whereas, Council has also considered the Supplemental Presentation made by staff to Council on July 21, 2016;
 Resolution 2016-662: Whereas Regional Council has considered the report of the Commissioners of Public Works and Corporate Services, titled Bolton Residential Expansion Regional Official Plan Amendment
new westminster, B.C New Westminster Immigrant Demographics I
 Immigrant demographics new westminster, B.C. - 2018 Immigrant Demographics I Page 1 new westminster IMMIGRANT DEMOGRAPHICS Your quick and easy look at facts and figures around immigration. Newcomers are
Demographic Change: The Changing Character of Toronto s Inner City, 1961 to 2001
 Demographic Change: The Changing Character of Toronto s Inner City, 1961 to 2001 SERIES 2 Maps based on the Canadian Census, using Census Tract level data The CURA Study Area: Bathurst St, Bloor St., Roncesvales
PLANNING JUSTIFICATION REPORT
 PLANNING JUSTIFICATION REPORT SILVERCREEK JUNCTION 35 AND 40 SILVERCREEK PARKWAY, GUELPH Silvercreek Guelph Developments Ltd. Official Plan Amendment OP1201 Zoning Amendment Application ZC1204 May 7, 2012
Introduction... i. Population Family Structure Education Mobility Status... 7
 Table of Contents Introduction... i Population... 2 Family Structure... 5 Education... 6 Mobility Status... 7 ward two Ethnicity, Language, Immigrants and Visible Minority... 9 Labour Force Characteristics...13
Aboriginal Youth, Education, and Labour Market Outcomes 1
 13 Aboriginal Youth, Education, and Labour Market Outcomes 1 Jeremy Hull Introduction Recently, there have been many concerns raised in Canada about labour market shortages and the aging of the labour
$58,761 ($93,586) 57% (29%) 8% (7%) 36% (15%)
 57% (29%) 8% (7%) 36% (15%)") CITY OF COMMUNITY PROFILES 2016 Census Data City of Surrey Statistics CITY WHALLEY GUILDFORD FLEETWOOD NEWTON CLOVERDALE AREA 548 ha (32,621 ha) AVERAGE HOUSEHOLD INCOME $58,761 ($93,586) SOUTH POPULATION
CITY OF COMMUNITY PROFILES 2016 Census Data City of Surrey Statistics CITY WHALLEY GUILDFORD FLEETWOOD NEWTON CLOVERDALE AREA 548 ha (32,621 ha) AVERAGE HOUSEHOLD INCOME $58,761 ($93,586) SOUTH POPULATION
Post-Secondary Education, Training and Labour September Profile of the New Brunswick Labour Force
 Post-Secondary Education, Training and Labour September 2018 Profile of the New Brunswick Labour Force Contents Population Trends... 2 Key Labour Force Statistics... 5 New Brunswick Overview... 5 Sub-Regional
CENSUS RESULTS WARD 3 PROFILE
 2011 CENSUS RESULTS WARD 3 PROFILE Town of Halton Hills City of Brampton Hwy. 407 Finch Ave. Town of Milton Hwy. 407 ETR Ninth Line 10 Derry Rd. Winston Churchill Blvd. 9 Erin Mills Pkwy. Mississauga Rd.
STRENGTHENING RURAL CANADA: Fewer & Older: Population and Demographic Crossroads in Rural Saskatchewan. An Executive Summary
 STRENGTHENING RURAL CANADA: Fewer & Older: Population and Demographic Crossroads in Rural Saskatchewan An Executive Summary This paper has been prepared for the Strengthening Rural Canada initiative by:
This document contains a draft ROPA based on Option 6 and the Triangle Lands.
 The December 8, 2016 Council Report on staff recommendation to expand the Bolton Rural Service Centre and a draft ROPA based on Option 4/5 can be downloaded from the Council Agenda webpage. It is acknowledged
Population and Dwelling Counts
 Release 1 Population and Dwelling Counts Population Counts Quick Facts In 2016, Conception Bay South had a population of 26,199, representing a percentage change of 5.4% from 2011. This compares to the
Greater Golden Horseshoe
 Greater Golden Horseshoe 2017 REGIONAL MARKET ACTIVITY (AS AT Q3 2016) TORONTO - OVERVIEW The Toronto Census Metropolitan Area ( CMA ) is comprised of the City of Toronto, which is the capital of the province
If this information is required in an accessible format, please contact ext. 2564
 If this information is required in an accessible format, please contact 1-800-372-1102 ext. 2564 From: Report: Date: Commissioner of Planning and Economic Development #2018-INFO-53 April 13, 2018 Subject:
WHY IS TORONTO DRAWING NEW WARD BOUNDARIES? Ward Population Background Brief. Revised, July 2015
 WHY IS TORONTO DRAWING NEW WARD BOUNDARIES? Ward Population Background Brief Revised, July 2015 CONTENTS Why is Toronto Drawing New Ward Boundaries?... 2 Alignment with Federal and Provincial Electoral
Changing Times, Changing Enrollments: How Recent Demographic Trends are Affecting Enrollments in Portland Public Schools
 Portland State University PDXScholar School District Enrollment Forecast Reports Population Research Center 7-1-2000 Changing Times, Changing Enrollments: How Recent Demographic Trends are Affecting Enrollments
SELECTED DEMOGRAPHIC TRENDS IN THE REGINA METROPOLITAN AREA
 SELECTED DEMOGRAPHIC TRENDS IN THE REGINA METROPOLITAN AREA Prepared for the: Regina Public Library Staff Development Day November 20, 2015 Doug Elliott Sask Trends Monitor 444 19th Avenue Regina, Saskatchewan
STRENGTHENING RURAL CANADA: Fewer & Older: The Coming Population and Demographic Challenges in Rural Newfoundland & Labrador
 STRENGTHENING RURAL CANADA: Fewer & Older: The Coming Population and Demographic Challenges in Rural Newfoundland & Labrador An Executive Summary 1 This paper has been prepared for the Strengthening Rural
Corporate. Report COUNCIL DATE: April 28, 2008 NO: R071 REGULAR COUNCIL. TO: Mayor & Council DATE: April 28, 2008
 Corporate NO: R071 Report COUNCIL DATE: April 28, 2008 REGULAR COUNCIL TO: Mayor & Council DATE: April 28, 2008 FROM: General Manager, Planning and Development FILE: 6600-01 SUBJECT: 2006 Census Information
COMMUNITY PROFILE BURNABY
 COMMUNITY PROFILE BURNABY Burnaby Demographics I Page 1 BURNABY IMMIGRANT DEMOGRAPHICS Your quick and easy look at facts and figures around immigration. Newcomers are an important and growing part of your
Profile of the New Brunswick Labour Force
 Profile of the New Brunswick Labour Force October 213 213 Profile of the New Brunswick Labour Force Province of New Brunswick PO 6, Fredericton NB E3B 5H1 www.gnb.ca 213.11 ISBN 978-1-465-247-1 (Print
Item No Halifax Regional Council July 19, 2016
 P.O. Box 1749 Halifax, Nova Scotia B3J 3A5 Canada Item No. 14.4.1 Halifax Regional Council July 19, 2016 TO: SUBMITTED BY: Mayor Savage and Members of Halifax Regional Council Original Signed Councillor
Ward 4 Etobicoke Centre City of Toronto Ward Profiles 2016 Census
 Bar Chart showing the rate of population growth between the years 2006 and 2016 for the Ward compared to the City of based on the 2006 and data. For more information, please contact Michael Wright at 416-392-7558
A Profile of CANADiAN WoMeN. NorTHerN CoMMuNiTieS
 A Profile of CANADiAN WoMeN in rural, remote AND NorTHerN CoMMuNiTieS DeMogrAPHiC Profile in 2006, the last census year for which data are currently available, approximately 2.8 million women resided in
Introduction... i. Population Family Structure Education Mobility Status... 7
 ward ten Table of Contents Introduction... i Population... 2 Family Structure... 5 Education... 6 Mobility Status... 7 ward ten Ethnicity, Language, Immigrants and Visible Minority... 9 Labour Force Characteristics...13
Refusal Report Official Plan and Zoning By-law Amendment Applications 1121 Leslie Street north of Eglinton Avenue East
 STAFF REPORT ACTION REQUIRED Refusal Report Official Plan and Zoning By-law Amendment Applications 1121 Leslie Street north of Eglinton Avenue East Date: December 22, 2006 To: From: Wards: Reference Number:
AVERAGE HOUSEHOLD INCOME $83,026 ($93,586) RENTERS 37% (29%) UNEMPLOYMENT RATE 7% (7%) TAKE TRANSIT TO WORK 20% (15%)
 RENTERS 37% (29%) UNEMPLOYMENT RATE 7% (7%) TAKE TRANSIT TO WORK 20% (15%)") CITY OF COMMUNITY PROFILES 2016 Census Data City of Surrey Statistics CITY CENTRE GUILDFORD FLEETWOOD NEWTON CLOVERDALE AREA 3,131 ha (32,621 ha) AVERAGE HOUSEHOLD INCOME $83,026 ($93,586) SOUTH POPULATION
CITY OF COMMUNITY PROFILES 2016 Census Data City of Surrey Statistics CITY CENTRE GUILDFORD FLEETWOOD NEWTON CLOVERDALE AREA 3,131 ha (32,621 ha) AVERAGE HOUSEHOLD INCOME $83,026 ($93,586) SOUTH POPULATION
Introduction... i. Population Family Structure Education Mobility Status... 7
 Table of Contents Introduction... i Population... 2 Family Structure... 5 Education... 6 Mobility Status... 7 Ethnicity, Language, Immigrants and Visible Minority... 9 ward three Labour Force Characteristics...13
North York City of Toronto Community Council Area Profiles 2016 Census
 Bar Chart showing the rate of population growth between the years 2006 and 2016 for the Ward compared to the City of based on the 2006 and data. For more information, please contact Michael Wright at 416-392-7558
CENSUS RESULTS WARD 10 PROFILE
 2011 CENSUS RESULTS WARD 10 PROFILE Town of Halton Hills City of Brampton Hwy. 407 Finch Ave. Town of Milton Hwy. 407 ETR Ninth Line 10 Derry Rd. Winston Churchill Blvd. 9 Erin Mills Pkwy. Mississauga
CENSUS RESULTS WARD 7 PROFILE
 2011 CENSUS RESULTS WARD 7 PROFILE Town of Halton Hills City of Brampton Hwy. 407 Finch Ave. Town of Milton Hwy. 407 ETR Ninth Line 10 Derry Rd. Winston Churchill Blvd. 9 Erin Mills Pkwy. Mississauga Rd.
people/hectare Ward Toronto
 Bar Chart showing the rate of population growth between the years 2006 and 2016 for the Ward compared to the City of based on the 2006 and data. For more information, please contact Michael Wright at 416-392-7558
Spryfield Highlights. Household Living Arrangements. The following are highlights from the 2016 Census.
 Highlights The following are highlights from the 2016 Census., as defined for United Way's Action for Neighbourhood Change, had a Census population of 11,700 in 2016. The outline shown to the right, and
CENSUS RESULTS WARD 9 PROFILE
 2011 CENSUS RESULTS WARD 9 PROFILE Town of Halton Hills City of Brampton Hwy. 407 Finch Ave. Town of Milton Hwy. 407 ETR Ninth Line 10 Derry Rd. Winston Churchill Blvd. 9 Erin Mills Pkwy. Mississauga Rd.
Demographic Shifts: Introduction and key findings
 HAMILTON'S SOCIAL LANDSCAPE BULLETIN (Issue 7) Demographic Shifts: Introduction and key findings September 2016 Introduction The City of Hamilton s recent decision to modify its vision to become The best
Regina City Priority Population Study Study #1 - Aboriginal People. August 2011 EXECUTIVE SUMMARY
 Regina City Priority Population Study Study #1 - Aboriginal People August 2011 EXECUTIVE SUMMARY Executive Summary The City of Regina has commissioned four background studies to help inform the development
Appendix A: Economic Development and Culture Trends in Toronto Data Analysis
 Appendix A: Economic Development and Culture Trends in Toronto Data Analysis Introduction The proposed lenses presented in the EDC Divisional Strategy Conversation Guide are based in part on a data review.
Aboriginal Communities in Profile: Quinte, Kingston, Rideau Building healthy and vibrant communities
 Aboriginal Communities in Profile: Quinte, Kingston, Rideau Building healthy and vibrant communities The Ontario Trillium Foundation is an agency of the Government of Ontario. Métis Elder photo courtesy
Vaughan Community Health Centre Community Profiles
 Vaughan Community Health Centre Community Profiles Prepared by Public Interest Strategy and Communications May 2009 Table of Contents Vaughan Stories to Tell...3 Concord Neighbourhood Profile...19 Kleinburg
CENSUS RESULTS WARD 6 PROFILE
 2011 CENSUS RESULTS WARD 6 PROFILE Town of Halton Hills City of Brampton Hwy. 407 Finch Ave. Town of Milton Hwy. 407 ETR Ninth Line 10 Derry Rd. Winston Churchill Blvd. 9 Erin Mills Pkwy. Mississauga Rd.
Verdun borough HIGHLIGHTS. In 1996, the Verdun borough had a population of 59,714. LOCATION
 Socio-economic profile borough February 2002 HIGHLIGHTS In 1996, the borough had a population of 59,714. LOCATION Between 1991 and 1996, the population of the borough declined by 2.6%. One-person households
Ward 17 Davenport City of Toronto Ward Profiles 2016 Census
 Bar Chart showing the rate of population growth between the years 2006 and 2016 for the Ward compared to the City of based on the 2006 and data. For more information, please contact Michael Wright at 416-392-7558
COMMUNITY PROFILE: Fort St. John, British Columbia Census Subdivision (CSD) PHASE 1 Winter 2018
 PHASE 1 Winter 2018") COMMUNITY PROFILE: Fort St. John, British Columbia Census Subdivision (CSD) PHASE 1 Winter 2018 About the Community Development Institute Established in 2004, the Community Development Institute (CDI)
COMMUNITY PROFILE: Fort St. John, British Columbia Census Subdivision (CSD) PHASE 1 Winter 2018 About the Community Development Institute Established in 2004, the Community Development Institute (CDI)
Regina City Priority Population Study Study #2 - Immigrants. August 2011 EXECUTIVE SUMMARY
 Regina City Priority Population Study Study #2 - Immigrants August 2011 EXECUTIVE SUMMARY Executive Summary The City of Regina has commissioned four background studies to help inform the development of
Ward 16 River. City of Ottawa Ward Profiles 2011 Census and National Household Survey POPULATION* 45, ,390. Total City of Ottawa Population
 POPULATION* Total Ward Population 45,795 +2.0% 2006-2011 Total City of Ottawa Population 883,390 +8.8% 2006-2011 Population by Age Group Ward 16 City of Ottawa 2006 2011 06-11 2006 2011 06-11 Age Group
Scarborough City of Toronto Community Council Area Profiles 2016 Census
 Bar Chart showing the rate of population growth between the years 2006 and 2016 for the Ward compared to the City of based on the 2006 and data. For more information, please contact Michael Wright at 416-392-7558
Planning Study Area 1 Burnaby Heights
 Neighbourhood Profiles 2006 Census Planning Study Area 1 Heights is bounded by Burrard Inlet to the north, Willingdon Avenue to the east, Hastings Street to the south and Boundary Road to the west. PLANNING
Changing Faces Profile of Burlington Newcomers. November 2010
 Changing Faces Profile of Burlington Newcomers November 2010 2010 Community Development Halton, all rights reserved. Copies of this document may be reproduced non-commercially for the purpose of community
(Note: These are inititial neighbourhood estimates and are subject to change.) C P R. NEI Score. Female 52%
 C P R. NEI Score. Female 52%") 0-4 5-9 10-14 15-19 20-24 25-29 30-34 JANE ST 35-39 40-44 45-49 50-54 55-59 60-64 65-69 70-74 75-79 80-84 85-89 90-94 95-99 100+ 2011 Neighbourhood Demographic Estimates EGLINTON AVE W JANE ST WESTON RD
0-4 5-9 10-14 15-19 20-24 25-29 30-34 JANE ST 35-39 40-44 45-49 50-54 55-59 60-64 65-69 70-74 75-79 80-84 85-89 90-94 95-99 100+ 2011 Neighbourhood Demographic Estimates EGLINTON AVE W JANE ST WESTON RD
STRENGTHENING RURAL CANADA: Fewer & Older: Population and Demographic Challenges Across Rural Canada A Pan-Canadian Report
 STRENGTHENING RURAL CANADA: Fewer & Older: Population and Demographic Challenges Across Rural Canada A Pan-Canadian Report This paper has been prepared for the Strengthening Rural Canada initiative by:
Oshawa Community Needs Assessment. Prepared in Support of the Smart Cities Challenge Applications
 Oshawa Community Needs Assessment Prepared in Support of the Smart Cities Challenge Applications April 2018 Table of Contents INTRODUCTION... 3 INFRASTRUCTURE CANADA S SMART CITIES CHALLENGE... 3 COMMUNITY
WHY IS TORONTO DRAWING NEW WARD BOUNDARIES? Ward Population Background Brief. November 2014
 WHY IS TORONTO DRAWING NEW WARD BOUNDARIES? Ward Population Background Brief November 2014 TORONTO WARD BOUNDARY REVIEW DRAW THE LINES Why is Toronto Drawing New Ward Boundaries? Toronto has been managed
SELECTED DEMOGRAPHIC TRENDS IN SASKATCHEWAN
 SELECTED DEMOGRAPHIC TRENDS IN SASKATCHEWAN Prepared for the: Saskatchewan Libraries Conference May 8, 2015 Doug Elliott Sask Trends Monitor 444 19th Avenue Regina, Saskatchewan S4N 1H1 306-522-5515 sasktrends@sasktel.net
Ward 14 Parkdale-High Park City of Toronto Ward Profiles 2016 Census
 Bar Chart showing the rate of population growth between the years 2006 and 2016 for the Ward compared to the City of based on the 2006 and data. For more information, please contact Michael Wright at 416-392-7558
Chairman and Members of the Planning and Development Committee. Thomas S. Mokrzycki, Commissioner of Planning and Building
 CD.15.DAT DATE: TO: FROM: SUBJECT: Chairman and Members of the Planning and Development Committee Thomas S. Mokrzycki, Commissioner of Planning and Building Mississauga: A City of Many Cultures MEETING
2011 National Household Survey Profile on the Town of Richmond Hill: 1st Release
 2011 National Household Survey Profile on the Town of Richmond Hill: 1st Release Every five years the Government of Canada through Statistics Canada undertakes a nationwide Census. The purpose of the Census
Part I The PREAMBLE, which does not constitute part of the Official Plan;
 PA RT I PREAMBLE INTRODUCTION This document comprises the 2008, consolidated to January 2017. The Plan repeals and replaces the as adopted by Town Council in 1982. ORGANIZATION OF THE PLAN This document
MARRIAGE & PARENTHOOD
 CONTENTS OVERVIEW 3 KEY INDICATORS 4 OVERALL POPULATION 5 AGEING 8 MARRIAGE & PARENTHOOD 10 IMMIGRATION & CITIZENS BY DESCENT 14 1 ANNEX Overall Population Table 1: Total population 16 Table 2: Singapore
CENSUS RESULTS WARD 8 PROFILE
 2011 CENSUS RESULTS WARD 8 PROFILE Town of Halton Hills City of Brampton Hwy. 407 Finch Ave. Town of Milton Hwy. 407 ETR Ninth Line 10 Derry Rd. Winston Churchill Blvd. 9 Erin Mills Pkwy. Mississauga Rd.
Background. Response Rate and Age Profile of Respondents. Community Facilities and Amenities. Transport Issues. Employment and Employment Land Issues
 Background Response Rate and Age Profile of Respondents Community Facilities and Amenities Transport Issues Employment and Employment Land Issues Housing and Housing Land Issues Telecommunications Tourism
Population Dynamics in the Greater Golden Horseshoe Millennials vs. Baby Boomers
 Population Dynamics in the Greater Golden Horseshoe Millennials vs. Baby Boomers November 19, 2015 Population Dynamics in the Greater Golden Horseshoe Millennials vs. Baby Boomers Campus Location The opinions
Metro 2040 Performance Monitoring Update
 5.2 Metro 2040 Performance Monitoring Update SECTION G AMENDMENT Lauren Klose REGIONAL PLANNER Regional Planning Committee March 10, 2016 Background 2 55 15 Performance Measures Key Summary Measures Complete
Chapter 8 Ontario: Multiculturalism at Work
 Chapter 8 Ontario: Multiculturalism at Work Ontario is Canada's largest province, home to almost 40 percent of its population (over 13 million people). It has been hit hard by by economic restructuring
Employment, Education and Income
 This is one in a series of fact sheets that provide a profile of immigrants in. Understanding the makeup of our community is important for planning programs and services. Between 2006 and 2011, 15,465
» fast facts NEIGHBOURHOOD MARKET PROFILE Hastings-North.
 Figure 1 FRANKLIN ST. HASTINGS ST. PENDER ST. KAMLOOPS ST. NANAIMO ST. HASTINGS ST. FRANKLIN ST. PENDER ST. POWELL ST.» fast facts BIA size: 21 city blocks; residential area size: 1,155 sq. km. 42,000
Situational Analysis: Peterborough & the Kawarthas
 Canadian Centre for Economic Analysis Toronto Situational Analysis: February 2018 Geospatial Data Analysis Group ISBN: 978-1-989077-03-0 c 2018 Canadian Centre for Economic Analysis The Canadian Centre
STATE GOAL INTRODUCTION
 STATE GOAL There is no specific state goal that addresses population; however, all other goals depend on an understanding of population and demographic data for the municipality and region. INTRODUCTION
Public Service Representation Depends on the Benchmark
 Public Service Representation Depends on the Benchmark One of the hallmarks of a successful multicultural society is the degree to which national institutions, both public and private, reflect the various
(Note: These are inititial neighbourhood estimates and are subject to change.) C P R. NEI Score. 600 Female 51%
 C P R. NEI Score. 600 Female 51%") 0-4 5-9 10-14 15-19 20-24 25-29 30-34 35-39 40-44 45-49 50-54 55-59 60-64 65-69 70-74 75-79 80-84 85-89 90-94 95-99 100+ 2011 Neighbourhood Demographic Estimates STEELES AVE W FENMAR DR C P R GARYRAY DR
0-4 5-9 10-14 15-19 20-24 25-29 30-34 35-39 40-44 45-49 50-54 55-59 60-64 65-69 70-74 75-79 80-84 85-89 90-94 95-99 100+ 2011 Neighbourhood Demographic Estimates STEELES AVE W FENMAR DR C P R GARYRAY DR
OBSERVATION. TD Economics A DEMOGRAPHIC OVERVIEW OF ABORIGINAL PEOPLES IN CANADA
 OBSERVATION TD Economics May 1, 213 A DEMOGRAPHIC OVERVIEW OF ABORIGINAL PEOPLES IN CANADA Highlights New data from the National Household Survey (NHS) show that just over 1.4 million people identified
Survey Results Summary
 Survey Results Summary January 28, 2014 FINAL Introduction As part of the Public Outreach Task for VTrans 2040, an online survey was designed and administered to residents of the Commonwealth. The purpose
PRESENT TRENDS IN POPULATION DISTRIBUTION
 PRESENT TRENDS IN POPULATION DISTRIBUTION Conrad Taeuber Associate Director, Bureau of the Census U.S. Department of Commerce Our population has recently crossed the 200 million mark, and we are currently