Fanshawe Neighbourhood Profile
|
|
|
- Jack Morris
- 6 years ago
- Views:
Transcription


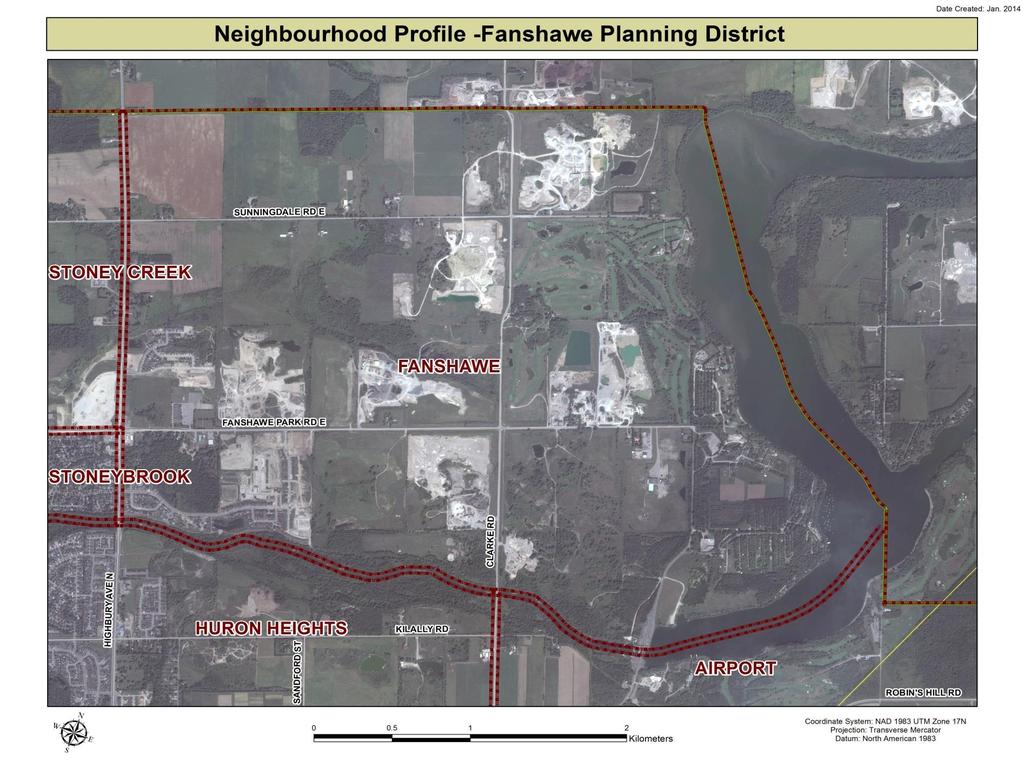
1 Fanshawe Profile For further information contact: John-Paul Sousa Planning Research Analyst Direct: (519) ext I jpsousa@london.ca Page 1
2 Page 2
3 Population Characteristics & Age Distribution Fanshawe Total Population % Female N.A. N.A % Male N.A. N.A % Age Structure 0-19 N.A. N.A % 32% 0 to 4 N.A. N.A. N.A % 5 to 9 N.A. N.A. N.A. 60 9% 10 to 14 N.A. N.A. N.A. 45 7% 15 to 19 N.A. N.A. N.A. 45 7% N.A. N.A ,275% 40% N.A. N.A % 22% 65+ N.A. N.A % 7% Median Age N.A. N.A. N.A Page 3
4 2011 Census Male Female Total Age Cohort Breakout 0 to % 5 to % 10 to % 15 to % 20 to % 25 to % 30 to % 35 to % 40 to % 45 to % 50 to % 55 to % 60 to % 65 to % 70 to % 75 to % 80 to <1% <1% Total to 4 5 to 9 10 to to to to to to to to to to to to to to to Page 4
5 Marital Status Single N.A. N.A % Married N.A. N.A % Common-Law N.A. N.A % Divorced N.A. N.A % Separated N.A. N.A % Widowed N.A. N.A % Citizenship, Immigration & Ethnic Identity Citizenship Canadian Citizens N.A. N.A % Non-Canadian Citizens Immigration Status Canadian Born Population Foreign Born Population Visible Minority Population Aboriginal Identity Population N.A. N.A % N.A. N.A % N.A. N.A % N.A. N.A % N.A. N.A % Page 5
6 Family Composition Number of Census Families N.A. N.A Family Size - 2 Persons N.A. N.A % Family Size - 3 Persons N.A. N.A % Family Size - 4 Persons N.A. N.A % Family Size - 5 Persons Census Family - Average Size N.A. N.A % Family Composition Family Size 5 Persons 18% Family Size 2 Persons 36% Family Size 4 Persons 31% Family Size 3 Persons 15% Page 6
7 Family Structure & Number of Children Married Couples N.A. N.A Without Children N.A. N.A With Children N.A. N.A Common-Law N.A. N.A. N.A. 20 Without Children N.A. N.A. N.A. N.A. With Children N.A. N.A. N.A. N.A. Lone Parent Families N.A. N.A. N.A. 10 Female Headed N.A. N.A. N.A. N.A. 1 Child N.A. N.A. N.A. N.A. 2 Children N.A. N.A. N.A. N.A. 3 Children N.A. N.A. N.A. N.A. Male Headed N.A. N.A. N.A. N.A. 1 Child N.A. N.A. N.A. N.A. 2 Children N.A. N.A. N.A. N.A. 3 Children N.A. N.A. N.A. N.A. Page 7
8 Educational Attainment by Credential No Certificate, Diploma or Degree High School Diploma or Equivalent Apprenticeship, or Trade Certificate College Certificate or Diploma University Certificate or Diploma University -Bachelor's Degree University Degree above bachelor level (M.A. or PhD) N.A. N.A % N.A. N.A % N.A. N.A % N.A. N.A % N.A. N.A % N.A. N.A % N.A. N.A % Educational Attainment by Highest Credential University Degree above Bachelors 9% No Certificate, Diploma or Degree 14% University -Bachelor's Degree 16% College Certificate or Diploma 17% High School Diploma 12% Apprenticeship/Trade 3% Page 8
9 Housing by Structure Type & Tenure Total Occupied Dwellings Single-Detached N.A. N.A % Semi-Detached N.A. N.A. N.A. 0 Row House N.A. N.A. N.A. 0 Duplex N.A. N.A. N.A. 0 Apartment < 5 Storeys N.A. N.A. N.A. 0 Apartment 5 Storeys N.A. N.A. N.A. 0 Number of Owned Dwellings N.A. N.A. N.A. 200 Owned as a % of Total N.A. N.A. N.A. 100% Number of Rented Dwellings Rented as a % of Total N.A. N.A. N.A. 0 N.A. N.A. N.A. 0% Average # of Rooms N.A. N.A. N.A. 7.3 Average # of Bedrooms N.A. N.A. N.A. N.A. Average Gross Rent N.A. N.A. N.A. N.A. Average Value of Dwelling N.A. N.A. N.A. $381, Page 9
10 Labour Market Indicators Total Labour Force 15 years N.A. N.A Female N.A. N.A % Male N.A. N.A % Unemployment Rate N.A. N.A. 14% N.A. Female N.A. N.A. N.A. N.A. Male N.A. N.A. N.A. N.A. Employment Rate N.A. N.A. N.A. N.A. Participation Rate N.A. N.A. 90% 69% Female N.A. N.A. 78% 70% Male N.A. N.A. 93% 70% Labour Force by Sector Primary (Agriculture & Resources) Secondary (Construction & Manufacturing N.A. N.A N.A. N.A % Tertiary Services N.A. N.A % 0% Page 10
11 Income Characteristics of Economically Active Population Individual Income Average Income N.A. N.A. N.A. $51, Median Income N.A. N.A. N.A. $44, Income by Gender Average Income Male N.A. N.A. N.A. $65, Average Income - Female N.A. N.A. N.A. $36, Median Income Male N.A. N.A. N.A. $57, Median Income - Female Household Income Average Household Income Median Household Income Family Income N.A. N.A. N.A. $35, N.A. N.A. N.A. $118, N.A. N.A. N.A. $119, Average Family Income N.A. N.A. N.A. $124, Median Family Income N.A. N.A. N.A. $121, Lone-Parent Families Average Family Income N.A. N.A. N.A. N.A. Median Family Income N.A. N.A. N.A. N.A. Data Note: Income figures based on previous reporting year and reflect gross earnings (1995, 2000, 2005 & 2010). Page 11
12 Labour Force by National Occupational Classification Labour Force Management N.A. N.A. N.A % Business, Finance and Administration N.A. N.A. N.A % Natural and Applied Science Fields N.A. N.A. N.A % Health Care N.A. N.A. N.A. 25 7% Education, Government, Social & Community Services Art, Culture, recreation and Sport Sales and Service Sector Trades, Transport and Equipment Operators Natural Resources and Agriculture Manufacturing and Utilities N.A. N.A. N.A % N.A. N.A. N.A % N.A. N.A. N.A. 25 7% N.A. N.A. N.A. 25 7% Page 12
13 Class of Worker As a % Employee N.A. N.A % Female N.A. N.A Male N.A. N.A Self-Employed N.A. N.A % Female N.A. N.A. 0 0 Male N.A. N.A. 0 0 Employment Status Worked Full-Time in 2010 Worked Part-Time in 2010 Active Labour Force N.A. N.A. N.A. 290 N.A. 85% N.A. N.A. N.A. 50 N.A. 15% Employment Status, 2010 Reference Period Worked Part- Time 15% Worked Full-Time 85% Page 13
14 Mode of Transport to Work Automobile -As a Driver N.A. N.A % Car-Pool N.A. N.A. 0 0 Public Transportation N.A. N.A. 0 0 Walked or Bicycled N.A. N.A. 0 0 Other Modes N.A. N.A. 0 0 Median Commuting Duration N.A. N.A. N.A. 16 min. Place of Work Worked at Home N.A. N.A % Worked at a Fixed Address No Fixed Workplace Address Worked within Municipality Work in a different Municipality N.A. N.A % N.A. N.A % N.A. N.A. 80 N.A. N.A. N.A. 0 N.A. Worked outside Canada N.A. N.A. 0 0 Page 14
15 Mobility/Migration Status Lived at the same address 5 years ago Moved sometime with the last 5 years N.A. N.A % N.A. N.A % Internal Migrants N.A. N.A % - Intra-provincial N.A. N.A Inter-provincial N.A. N.A External Migrants N.A. N.A % Lived at the same address 1 years ago Moved sometime with the last year N.A. N.A % N.A. N.A % Internal Migrants N.A. N.A % - Intra-provincial N.A. N.A Inter-provincial N.A. N.A. 0 0 External Migrants N.A. N.A % Page 15
16 Place of Birth Total Immigrant Population N.A. N.A. N.A % Place of Birth by Continent North America (US only) Africa N.A. N.A. N.A. 10 1% Asia N.A. N.A. N.A. 65 9% Caribbean Central and South America Europe N.A. N.A. N.A % Recent Immigration by Continent, Recent Immigrants North America (US only) N.A. N.A. N.A. 0 Africa N.A. N.A. N.A. 0 Asia N.A. N.A. N.A. 0 Caribbean N.A. N.A. N.A. 0 Central and South America N.A. N.A. N.A. 0 Europe N.A. N.A. N.A. 0 Page 16
17 Immigration by Place of Birth 1. N.A. N.A. N.A. N.A. N.A. 2. N.A. N.A. N.A. 3. N.A. N.A. N.A. 4. United States of America N.A. N.A. N.A. 5. N.A. N.A. N.A. 6. N.A. N.A. N.A. 7. N.A. N.A. N.A. 8. N.A. N.A. N.A. 9. N.A. N.A. N.A. 10. N.A. N.A. N.A. Page 17
18 Period of Immigration Before to to 1990 N.A. N.A. N.A % 1991 to 2000 N.A. N.A. N.A % 2001 to 2011 N.A. N.A. N.A % Foreign Born Population by Period of Immigration 2001 to to to to 1980 Before Page 18
19 Language Knowledge of Official Languages English Only N.A. N.A % French Only N.A. N.A. N.A. 5 1% English and French N.A. N.A. N.A. 50 7% Neither English or French N.A. N.A. N.A. 15 2% Language Spoken Most Often at Home English N.A. N.A % French N.A. N.A. N.A. 5 1% Non-Official Language N.A. N.A. N.A % Mother Tongue * English N.A. N.A % French N.A. N.A. N.A. 10 1% Non-Official Language N.A. N.A. N.A % * Statistics Canada defines 'mother tongue' as the first language learned in childhood and still understood by the individual at the time of census reporting. Page 19
20 Non-Official Languages Spoken Top 10 Reported N.A. N.A. N.A. N.A. N.A. N.A. N.A. N.A. N.A. N.A. N.A. N.A. N.A. N.A. N.A. N.A. N.A. N.A. N.A. N.A. N.A. N.A. N.A. N.A. N.A. N.A. N.A. N.A. N.A. Chinese* N.A. N.A. N.A. Page 20
21 Buddhist Christian Hindu Religious Identification Anglican Baptist Catholic Orthodox Lutheran Pentecostal Presbyterian United Church Other Christian Jewish Muslim Sikh Aboriginal Spirituality N.A. N.A. N.A % N.A. N.A. N.A. 30 4% N.A. N.A. N.A % N.A. N.A. N.A. 55 8% N.A. N.A. N.A % N.A. N.A. N.A. 45 7% N.A. N.A. N.A. 20 3% Page 21
22 Notes: (1) Source Data Statistics Canada Census Data, Customized Profiles. Ottawa, Canada (2) Data also derived from Statistics Canada s National Household Survey (NHS) (3) Customized Community and Profiles tabulated and compiled by the City of London s Planning Division Policy Planning and Research Section. Page 22
Bostwick Neighbourhood Profile
 Bostwick Profile For further information contact: John-Paul Sousa Planning Research Analyst Direct: (519) 661-2500 ext. 5989 I email: jpsousa@london.ca Page 1 Page 2 Population Characteristics & Age Distribution
CITY OF MISSISSAUGA. Overview 2-1. A. Demographic and Cultural Characteristics
 Portraits of Peel Overview 2-1 A. Demographic and Cultural Characteristics Population: Size, Age and Growth 2-2 Immigrants 2-3 Visible Minorities 2-4 Language 2-5 Religion 2-6 Mobility Status 2-7 B. Household
Study Area Maps. Profile Tables. W Broadway & Cambie St, Vancouver, BC Pitney Bowes 2016 Estimates and Projections. W Broadway & Cambie St
 Powered by PCensus Page 1 Study Area Maps Profile Tables 2016 Demographic Snapshot Population Trends Household Trends Population by Age and Sex Comparison Population by Age and Sex Household Maintainers
Ward 16 River. City of Ottawa Ward Profiles 2011 Census and National Household Survey POPULATION* 45, ,390. Total City of Ottawa Population
 POPULATION* Total Ward Population 45,795 +2.0% 2006-2011 Total City of Ottawa Population 883,390 +8.8% 2006-2011 Population by Age Group Ward 16 City of Ottawa 2006 2011 06-11 2006 2011 06-11 Age Group
BRAMALEA. Overview A. Demographic and Cultural Characteristics
 The Social Planning Council of Peel Portraits of Peel BRAMALEA Overview 13-1 A. Demographic and Cultural Characteristics Population: Size, Age and Growth 13-2 Immigrants 13-3 Visible Minorities 13-4 Language
City Windsor 1981 Canada Census WARD 1
 City Windsor 1981 Canada Census March 2, 2012 Table of Contents... 3 POPULATION BY AGE... 4 LANGUAGE/RELIGION... 5 ETHNICITY/MOBILITY... 6 BIRTHPLACE / IMMIGRATION... 7 EDUCATION / LABOUR FORCE... 8 INDUSTRY
CENSUS RESULTS WARD 3 PROFILE
 2011 CENSUS RESULTS WARD 3 PROFILE Town of Halton Hills City of Brampton Hwy. 407 Finch Ave. Town of Milton Hwy. 407 ETR Ninth Line 10 Derry Rd. Winston Churchill Blvd. 9 Erin Mills Pkwy. Mississauga Rd.
CENSUS RESULTS WARD 9 PROFILE
 2011 CENSUS RESULTS WARD 9 PROFILE Town of Halton Hills City of Brampton Hwy. 407 Finch Ave. Town of Milton Hwy. 407 ETR Ninth Line 10 Derry Rd. Winston Churchill Blvd. 9 Erin Mills Pkwy. Mississauga Rd.
CENSUS RESULTS NATIONAL HOUSEHOLD SURVEY
 2011 CENSUS RESULTS NATIONAL HOUSEHOLD SURVEY INTRODUCTION The inaugural National Household Survey (NHS) was a voluntary survey which replaced the mandatory long-form census questionnaire. The NHS was
CENSUS RESULTS WARD 10 PROFILE
 2011 CENSUS RESULTS WARD 10 PROFILE Town of Halton Hills City of Brampton Hwy. 407 Finch Ave. Town of Milton Hwy. 407 ETR Ninth Line 10 Derry Rd. Winston Churchill Blvd. 9 Erin Mills Pkwy. Mississauga
Verdun borough HIGHLIGHTS. In 1996, the Verdun borough had a population of 59,714. LOCATION
 Socio-economic profile borough February 2002 HIGHLIGHTS In 1996, the borough had a population of 59,714. LOCATION Between 1991 and 1996, the population of the borough declined by 2.6%. One-person households
Corporate. Report COUNCIL DATE: April 28, 2008 NO: R071 REGULAR COUNCIL. TO: Mayor & Council DATE: April 28, 2008
 Corporate NO: R071 Report COUNCIL DATE: April 28, 2008 REGULAR COUNCIL TO: Mayor & Council DATE: April 28, 2008 FROM: General Manager, Planning and Development FILE: 6600-01 SUBJECT: 2006 Census Information
Alberta Provincial Electoral Divisions
 Alberta Provincial Electoral Divisions Edmonton-Decore Compiled from the 2011 Census of Canada and National Household Survey Introduction This report presents the statistical profile for the Provincial
CENSUS RESULTS WARD 6 PROFILE
 2011 CENSUS RESULTS WARD 6 PROFILE Town of Halton Hills City of Brampton Hwy. 407 Finch Ave. Town of Milton Hwy. 407 ETR Ninth Line 10 Derry Rd. Winston Churchill Blvd. 9 Erin Mills Pkwy. Mississauga Rd.
Alberta Provincial Electoral Divisions. Calgary-McCall. Compiled from the 2016 Census of Canada
 Alberta Provincial Electoral Divisions Calgary-McCall Compiled from the 2016 Census of Canada July 2018 Introduction The following report produced by the Office of Statistics and Information presents a
CENSUS RESULTS WARD 7 PROFILE
 2011 CENSUS RESULTS WARD 7 PROFILE Town of Halton Hills City of Brampton Hwy. 407 Finch Ave. Town of Milton Hwy. 407 ETR Ninth Line 10 Derry Rd. Winston Churchill Blvd. 9 Erin Mills Pkwy. Mississauga Rd.
CENSUS RESULTS WARD 8 PROFILE
 2011 CENSUS RESULTS WARD 8 PROFILE Town of Halton Hills City of Brampton Hwy. 407 Finch Ave. Town of Milton Hwy. 407 ETR Ninth Line 10 Derry Rd. Winston Churchill Blvd. 9 Erin Mills Pkwy. Mississauga Rd.
Introduction... i. Population Family Structure Education Mobility Status... 7
 Table of Contents Introduction... i Population... 2 Family Structure... 5 Education... 6 Mobility Status... 7 ward two Ethnicity, Language, Immigrants and Visible Minority... 9 Labour Force Characteristics...13
Alberta Provincial Electoral Divisions. Lacombe- Ponoka. Compiled from the 2016 Census of Canada
 Alberta Provincial Electoral Divisions Lacombe- Ponoka Compiled from the 2016 Census of Canada July 2018 Introduction The following report produced by the Office of Statistics and Information presents
Population and Dwelling Counts
 Release 1 Population and Dwelling Counts Population Counts Quick Facts In 2016, Conception Bay South had a population of 26,199, representing a percentage change of 5.4% from 2011. This compares to the
Alberta Provincial Electoral Divisions
 Alberta Provincial Electoral Divisions Calgary-Foothills Compiled from the 2011 Census of Canada and National Household Survey Introduction This report presents the statistical profile for the Provincial
Alberta Provincial Electoral Divisions. Calgary-Shaw. Compiled from the 2016 Census of Canada
 Alberta Provincial Electoral Divisions Calgary-Shaw Compiled from the 2016 Census of Canada July 2018 Introduction The following report produced by the Office of Statistics and Information presents a statistical
North York City of Toronto Community Council Area Profiles 2016 Census
 Bar Chart showing the rate of population growth between the years 2006 and 2016 for the Ward compared to the City of based on the 2006 and data. For more information, please contact Michael Wright at 416-392-7558
Alberta Provincial Electoral Divisions
 Alberta Provincial Electoral Divisions Calgary-Mackay-Nose Hill Compiled from the 2011 Census of Canada and National Household Survey Introduction This report presents the statistical profile for the Provincial
people/hectare Ward Toronto
 Bar Chart showing the rate of population growth between the years 2006 and 2016 for the Ward compared to the City of based on the 2006 and data. For more information, please contact Michael Wright at 416-392-7558
Introduction... i. Population Family Structure Education Mobility Status... 7
 Table of Contents Introduction... i Population... 2 Family Structure... 5 Education... 6 Mobility Status... 7 Ethnicity, Language, Immigrants and Visible Minority... 9 ward three Labour Force Characteristics...13
Ward 17 Davenport City of Toronto Ward Profiles 2016 Census
 Bar Chart showing the rate of population growth between the years 2006 and 2016 for the Ward compared to the City of based on the 2006 and data. For more information, please contact Michael Wright at 416-392-7558
Scarborough City of Toronto Community Council Area Profiles 2016 Census
 Bar Chart showing the rate of population growth between the years 2006 and 2016 for the Ward compared to the City of based on the 2006 and data. For more information, please contact Michael Wright at 416-392-7558
Ward 4 Etobicoke Centre City of Toronto Ward Profiles 2016 Census
 Bar Chart showing the rate of population growth between the years 2006 and 2016 for the Ward compared to the City of based on the 2006 and data. For more information, please contact Michael Wright at 416-392-7558
Introduction... i. Population Family Structure Education Mobility Status... 7
 ward ten Table of Contents Introduction... i Population... 2 Family Structure... 5 Education... 6 Mobility Status... 7 ward ten Ethnicity, Language, Immigrants and Visible Minority... 9 Labour Force Characteristics...13
Pembina. Table of Contents. A Community Profile
 Table of Contents Population Population by Age and Gender 2 Population by Single Year of Age 6 Single Year of Age by Gender 8 Religious Denomination 9 Citizenship 11 Marital Status Marital Status 13 Lone
Alberta Provincial Electoral Divisions
 Alberta Provincial Electoral Divisions Innisfail-Sylvan Lake Compiled from the 2011 Census of Canada and National Household Survey Introduction This report presents the statistical profile for the Provincial
Klarvatten. Table of Contents. A Community Profile
 Table of Contents Population Population by Age and Gender 2 Population by Single Year of Age 1 Single Year of Age by Gender 14 Religious Denomination 15 Citizenship 17 Marital Status Marital Status 21
Ward 14 Parkdale-High Park City of Toronto Ward Profiles 2016 Census
 Bar Chart showing the rate of population growth between the years 2006 and 2016 for the Ward compared to the City of based on the 2006 and data. For more information, please contact Michael Wright at 416-392-7558
2011 CENSUS & NATIONAL HOUSEHOLD SURVEY CITY OF BRAMPTON - WARD 1 PROFILE
 CENSUS & NATIONAL HOUSEHOLD SURVEY CITY OF BRAMPTON WARD 1 PROFILE WARD HIGHLIGHTS Population 53,130 Population 51.0% Females Population by Age Group 9% 20% 014 10.14% of total population 36 Median Age
2011 CENSUS & NATIONAL HOUSEHOLD SURVEY CITY OF BRAMPTON - WARD 3 PROFILE
 2011 CENSUS & NATIONAL HOUSEHOLD SURVEY CITY OF BRAMPTON WARD 3 PROFILE WARD HIGHLIGHTS Population 47,500 2011 Population 50.7% Females 2011 Population by Age Group 13% 18% 014 9.07% of total population
2011 CENSUS & NATIONAL HOUSEHOLD SURVEY CITY OF BRAMPTON - WARD 4 PROFILE
 2011 CENSUS & NATIONAL HOUSEHOLD SURVEY CITY OF BRAMPTON WARD 4 PROFILE WARD HIGHLIGHTS Population 9.51% of total population 49,850 2011 Population 34 Median Age 50.5% Females 49.5% Males 2011 Population
2011 CENSUS & NATIONAL HOUSEHOLD SURVEY CITY OF BRAMPTON - WARD 10 PROFILE
 2011 CENSUS & NATIONAL HOUSEHOLD SURVEY CITY OF BRAMPTON WARD 10 PROFILE WARD HIGHLIGHTS Population 10.72% of total population 56,185 2011 Population 33 Median Age 50.1% Females 49.9% Males 2011 Population
Introduction... i. Population Family Structure Education Mobility Status... 7
 Table of Contents Introduction... i Population... 2 Family Structure... 5 Education... 6 Mobility Status... 7 Ethnicity, Language, Immigrants and Visible Minority... 9 Labour Force Characteristics...13
Tracking Trends in Kingston
 Tracking Trends in Photo: 22, Courtesy of City Hall Total Population: 152,358 Population Changes for CMAs, 21 to 26 25 19.2 2 15 1 11.6 9.2 8.9 8.2 6.6 59 5.9 55 5.5 54 5.4 51 5.1 51 5.1 5 5. 46 4.6 3.8
Bearspaw. Table of Contents. A Community Profile
 Table of Contents Population Population by Age and Gender 2 Population by Single Year of Age 14 Single Year of Age by Gender 18 Religious Denomination 19 Citizenship 22 Marital Status Marital Status 28
Michaels Park. Table of Contents. A Community Profile
 Table of Contents Population Population by Age and Gender 2 Population by Single Year of Age 14 Single Year of Age by Gender 18 Religious Denomination 19 Citizenship 22 Marital Status Marital Status 28
Cromdale. Table of Contents. A Community Profile
 Table of Contents Population Population by Age and Gender 2 Population by Single Year of Age 14 Single Year of Age by Gender 18 Religious Denomination 19 Citizenship 22 Marital Status Marital Status 28
Prince Charles. Table of Contents. A Community Profile
 Table of Contents Population Population by Age and Gender 2 Population by Single Year of Age 14 Single Year of Age by Gender 18 Religious Denomination 19 Citizenship 22 Marital Status Marital Status 28
Patricia Heights. Table of Contents. A Community Profile
 Table of Contents Population Population by Age and Gender 2 Population by Single Year of Age 14 Single Year of Age by Gender 18 Religious Denomination 19 Citizenship 22 Marital Status Marital Status 28
Mayfield. Table of Contents. A Community Profile
 Table of Contents Population Population by Age and Gender 2 Population by Single Year of Age 14 Single Year of Age by Gender 18 Religious Denomination 19 Citizenship 22 Marital Status Marital Status 28
Capilano. Table of Contents. A Community Profile
 Table of Contents Population Population by Age and Gender 2 Population by Single Year of Age 14 Single Year of Age by Gender 18 Religious Denomination 19 Citizenship 22 Marital Status Marital Status 28
Strathearn. Table of Contents. A Community Profile
 Table of Contents Population Population by Age and Gender 2 Population by Single Year of Age 14 Single Year of Age by Gender 18 Religious Denomination 19 Citizenship 22 Marital Status Marital Status 28
Grandview Heights. Table of Contents. A Community Profile
 Table of Contents Population Population by Age and Gender 2 Population by Single Year of Age 14 Single Year of Age by Gender 18 Religious Denomination 19 Citizenship 22 Marital Status Marital Status 28
Malmo Plains. Table of Contents. A Community Profile
 Table of Contents Population Population by Age and Gender 2 Population by Single Year of Age 14 Single Year of Age by Gender 18 Religious Denomination 19 Citizenship 22 Marital Status Marital Status 28
Ritchie. Table of Contents. A Community Profile
 Table of Contents Population Population by Age and Gender 2 Population by Single Year of Age 14 Single Year of Age by Gender 18 Religious Denomination 19 Citizenship 22 Marital Status Marital Status 28
Social and Demographic Trends in Burnaby and Neighbouring Communities 1981 to 2006
 Social and Demographic Trends in and Neighbouring Communities 1981 to 2006 October 2009 Table of Contents October 2009 1 Introduction... 2 2 Population... 3 Population Growth... 3 Age Structure... 4 3
Aspen Gardens. Table of Contents. A Community Profile
 Table of Contents Population Population by Age and Gender 2 Population by Single Year of Age 14 Single Year of Age by Gender 18 Religious Denomination 19 Citizenship 22 Marital Status Marital Status 28
Empire Park. Table of Contents. A Community Profile
 Table of Contents Population Population by Age and Gender 2 Population by Single Year of Age 14 Single Year of Age by Gender 18 Religious Denomination 19 Citizenship 22 Marital Status Marital Status 28
Strathcona. Table of Contents. A Community Profile
 Table of Contents Population Population by Age and Gender 2 Population by Single Year of Age 14 Single Year of Age by Gender 18 Religious Denomination 19 Citizenship 22 Marital Status Marital Status 28
Spruce Avenue. Table of Contents. A Community Profile
 Table of Contents Population Population by Age and Gender 2 Population by Single Year of Age 14 Single Year of Age by Gender 18 Religious Denomination 19 Citizenship 22 Marital Status Marital Status 28
Lago Lindo. Table of Contents. A Community Profile
 Table of Contents Population Population by Age and Gender 2 Population by Single Year of Age 14 Single Year of Age by Gender 18 Religious Denomination 19 Citizenship 22 Marital Status Marital Status 28
City of Montréal HIGHLIGHTS. En 1996, the ville de Montréal had a population of 1,775,788.
 Socio-economic profile City of Montréal February 2002 HIGHLIGHTS En 1996, the ville de Montréal had a population of 1,775,788. Between 1991 and 1996, the population of Montréal increased by 0.01%. One-person
Hazeldean. Table of Contents. A Community Profile
 Table of Contents Population Population by Age and Gender 2 Population by Single Year of Age 14 Single Year of Age by Gender 18 Religious Denomination 19 Citizenship 22 Marital Status Marital Status 28
Montrose. Table of Contents. A Community Profile
 Table of Contents Population Population by Age and Gender 2 Population by Single Year of Age 14 Single Year of Age by Gender 18 Religious Denomination 19 Citizenship 22 Marital Status Marital Status 28
Royal Gardens. Table of Contents. A Community Profile
 Table of Contents Population Population by Age and Gender 2 Population by Single Year of Age 14 Single Year of Age by Gender 18 Religious Denomination 19 Citizenship 22 Marital Status Marital Status 28
(Note: These are inititial neighbourhood estimates and are subject to change.) 1,000 Female 54%
 1,000 Female 54%") LAWRENCE AVE E 0-4 5-9 10-14 15-19 20-24 25-29 30-34 35-39 40-44 45-49 50-54 55-59 60-64 65-69 70-74 75-79 80-84 85-89 90-94 95-99 100+ 2011 Neighbourhood Demographic Estimates RAILSIDE RD C P R DON RIVER
LAWRENCE AVE E 0-4 5-9 10-14 15-19 20-24 25-29 30-34 35-39 40-44 45-49 50-54 55-59 60-64 65-69 70-74 75-79 80-84 85-89 90-94 95-99 100+ 2011 Neighbourhood Demographic Estimates RAILSIDE RD C P R DON RIVER
Edmonton. Table of Contents. A Community Profile
 Table of Contents Population Population by Age and Gender 2 Population by Single Year of Age 14 Single Year of Age by Gender 18 Religious Denomination 19 Citizenship 22 Marital Status Marital Status 28
COMMUNITY PROFILE BURNABY
 COMMUNITY PROFILE BURNABY Burnaby Demographics I Page 1 BURNABY IMMIGRANT DEMOGRAPHICS Your quick and easy look at facts and figures around immigration. Newcomers are an important and growing part of your
Alberta Provincial Electoral Divisions
 Alberta Provincial Electoral Divisions Strathmore-Brooks Compiled from the 2011 Census of Canada and National Household Survey Introduction This report presents the statistical profile for the Provincial
COMMUNITY PROFILE COQUITLAM. Coquitlam Immigrant Demographics I Page 1
 COMMUNITY PROFILE COQUITLAM Coquitlam Demographics I Page 1 COQUITLAM IMMIGRANT DEMOGRAPHICS Your quick and easy look at facts and figures around immigration. Newcomers are an important and growing part
If this information is required in an accessible format, please contact ext. 2564
 If this information is required in an accessible format, please contact 1-800-372-1102 ext. 2564 From: Report: Date: Commissioner of Planning and Economic Development #2018-INFO-53 April 13, 2018 Subject:
GENDER AND ETHNO-RACIAL INEQUALITIES IN LABOR MARKET OUTCOMES AMONG THE SECOND GENERATION IN TORONTO
 GENDER AND ETHNO-RACIAL INEQUALITIES IN LABOR MARKET OUTCOMES AMONG THE SECOND GENERATION IN TORONTO Brian Ray, University of Ottawa Valerie Preston, York University We gratefully acknowledge funding from
(Note: These are inititial neighbourhood estimates and are subject to change.) NEI Score. 1,000 Female 52%
 NEI Score. 1,000 Female 52%") 0-4 5-9 10-14 15-19 20-24 25-29 30-34 35-39 40-44 45-49 50-54 55-59 60-64 65-69 70-74 75-79 80-84 85-89 90-94 95-99 100+ 2011 Neighbourhood Demographic Estimates EGLINTON AVE E C P R DON VALLEY PARKWAY
0-4 5-9 10-14 15-19 20-24 25-29 30-34 35-39 40-44 45-49 50-54 55-59 60-64 65-69 70-74 75-79 80-84 85-89 90-94 95-99 100+ 2011 Neighbourhood Demographic Estimates EGLINTON AVE E C P R DON VALLEY PARKWAY
Keelesdale-Eglinton West
 BLACK CREEK DR 0-4 5-9 10-14 15-19 20-24 25-29 30-34 KEELE ST 35-39 40-44 45-49 50-54 -59 KANE AVE 60-64 65-69 70-74 75-79 80-84 85-89 90-94 95-99 100+ 2011 Neighbourhood Demographic Estimates EGLINTON
(Note: These are inititial neighbourhood estimates and are subject to change.) C P R. NEI Score. Female 52%
 C P R. NEI Score. Female 52%") 0-4 5-9 10-14 15-19 20-24 25-29 30-34 JANE ST 35-39 40-44 45-49 50-54 55-59 60-64 65-69 70-74 75-79 80-84 85-89 90-94 95-99 100+ 2011 Neighbourhood Demographic Estimates EGLINTON AVE W JANE ST WESTON RD
0-4 5-9 10-14 15-19 20-24 25-29 30-34 JANE ST 35-39 40-44 45-49 50-54 55-59 60-64 65-69 70-74 75-79 80-84 85-89 90-94 95-99 100+ 2011 Neighbourhood Demographic Estimates EGLINTON AVE W JANE ST WESTON RD
(Note: These are inititial neighbourhood estimates and are subject to change.) SCARBOROUGH SHORELINE. NEI Score. 1,500 Female 53%
 SCARBOROUGH SHORELINE. NEI Score. 1,500 Female 53%") 0-4 5-9 10-14 15-19 20-24 25-29 30-34 35-39 40-44 45-49 50-54 55-59 60-64 65-69 70-74 75-79 80-84 85-89 90-94 95-99 100+ 2011 Neighbourhood Demographic Estimates HIGHLAND CREEK WEST HIGHLAND CREEK KINGSTON
0-4 5-9 10-14 15-19 20-24 25-29 30-34 35-39 40-44 45-49 50-54 55-59 60-64 65-69 70-74 75-79 80-84 85-89 90-94 95-99 100+ 2011 Neighbourhood Demographic Estimates HIGHLAND CREEK WEST HIGHLAND CREEK KINGSTON
COMMUNITY PROFILE TOWNSHIP OF LANGLEY. Township of Langley Immigrant Demographics I Page 1
 COMMUNITY PROFILE TOWNSHIP OF LANGLEY Township of Langley Demographics I Page 1 TOWNSHIP OF LANGLEY IMMIGRANT DEMOGRAPHICS Your quick and easy look at facts and figures around immigration. Newcomers are
HIGHLIGHTS. 62% with postsecondary 58% $1,081 average monthly rent. $1,026 average monthly rent. China #1 immigrant. China #1 immigrant place of birth
 HIGHLIGHTS Ward Toronto 2010 Household Income 62% with postsecondary certificate, diploma or degree 58% with postsecondary certificate, diploma or degree 30% 25% 20% 15% 10% 5% $1,081 average monthly rent
$ $1,026. HIGHLIGHTS Ward Toronto. 52% with postsecondary 58% $978 average monthly rent. China #1 immigrant place of birth
 HIGHLIGHTS Ward Toronto 2010 Household Income 52% with postsecondary certificate, diploma or degree 58% with postsecondary certificate, diploma or degree 35% 30% 25% 20% 15% 10% 5% $978 average monthly
Community Social Profile Cambridge and North Dumfries
 Community Trends for 2013 in Cambridge, North Dumfries, Wellesley, Wilmot and Woolwich Community Social Profile - Cambridge and North Dumfries Published December 2014 Community Social Profile Cambridge
2011 National Household Survey Profile on the Town of Richmond Hill: 1st Release
 2011 National Household Survey Profile on the Town of Richmond Hill: 1st Release Every five years the Government of Canada through Statistics Canada undertakes a nationwide Census. The purpose of the Census
(Note: These are inititial neighbourhood estimates and are subject to change.) C P R. NEI Score. 600 Female 51%
 C P R. NEI Score. 600 Female 51%") 0-4 5-9 10-14 15-19 20-24 25-29 30-34 35-39 40-44 45-49 50-54 55-59 60-64 65-69 70-74 75-79 80-84 85-89 90-94 95-99 100+ 2011 Neighbourhood Demographic Estimates STEELES AVE W FENMAR DR C P R GARYRAY DR
0-4 5-9 10-14 15-19 20-24 25-29 30-34 35-39 40-44 45-49 50-54 55-59 60-64 65-69 70-74 75-79 80-84 85-89 90-94 95-99 100+ 2011 Neighbourhood Demographic Estimates STEELES AVE W FENMAR DR C P R GARYRAY DR
What is the Census? Why is it important?
 1 What is the Census? Every five years, Statistics Canada conducts a Census providing a detailed account of the Canadian population. The Census is intended to provide snapshot of the demographic, social
(Note: These are inititial neighbourhood estimates and are subject to change.) C N R. NEI Score. Female 54%
 C N R. NEI Score. Female 54%") 0-4 5-9 10-14 15-19 20-24 25-29 30-34 35-39 40-44 45-49 50-54 55-59 60-64 65-69 70-74 75-79 80-84 85-89 90-94 95-99 100+ 2011 Neighbourhood Demographic Estimates STANSBURY CRES MIDLAND AVE CITADEL DR WEST
0-4 5-9 10-14 15-19 20-24 25-29 30-34 35-39 40-44 45-49 50-54 55-59 60-64 65-69 70-74 75-79 80-84 85-89 90-94 95-99 100+ 2011 Neighbourhood Demographic Estimates STANSBURY CRES MIDLAND AVE CITADEL DR WEST
AVERAGE HOUSEHOLD INCOME $97,637 ($93,586) RENTERS 22% (29%) UNEMPLOYMENT RATE 7% (7%) TAKE TRANSIT TO WORK 15% (15%)
 RENTERS 22% (29%) UNEMPLOYMENT RATE 7% (7%) TAKE TRANSIT TO WORK 15% (15%)") CITY OF COMMUNITY PROFILES 2016 Census Data City of Surrey Statistics WHALLEY CITY CENTRE GUILDFORD NEWTON CLOVERDALE AREA 1,809 ha (32,621 ha) AVERAGE HOUSEHOLD INCOME $97,637 ($93,586) SOUTH POPULATION
CITY OF COMMUNITY PROFILES 2016 Census Data City of Surrey Statistics WHALLEY CITY CENTRE GUILDFORD NEWTON CLOVERDALE AREA 1,809 ha (32,621 ha) AVERAGE HOUSEHOLD INCOME $97,637 ($93,586) SOUTH POPULATION
HIGHLIGHTS Ward Toronto. 67% with postsecondary 58% $1,040 average monthly rent. $ $1,026 average monthly rent. China #1 immigrant place of birth
 HIGHLIGHTS Ward Toronto 2010 Household Income 67% with postsecondary certificate, diploma or degree 58% with postsecondary certificate, diploma or degree 30% 25% 20% 15% 10% 5% $1,040 average monthly rent
Census 2016 Summary Results Part 1
 Census 2016 Summary Results Part 1 Press conference, Government Buildings 6 th April 2017 Reminder Census Day : Sunday April 24 th 2016 Just over 2 million dwellings visited by 5,000 staff Preliminary
$58,761 ($93,586) 57% (29%) 8% (7%) 36% (15%)
 57% (29%) 8% (7%) 36% (15%)") CITY OF COMMUNITY PROFILES 2016 Census Data City of Surrey Statistics CITY WHALLEY GUILDFORD FLEETWOOD NEWTON CLOVERDALE AREA 548 ha (32,621 ha) AVERAGE HOUSEHOLD INCOME $58,761 ($93,586) SOUTH POPULATION
CITY OF COMMUNITY PROFILES 2016 Census Data City of Surrey Statistics CITY WHALLEY GUILDFORD FLEETWOOD NEWTON CLOVERDALE AREA 548 ha (32,621 ha) AVERAGE HOUSEHOLD INCOME $58,761 ($93,586) SOUTH POPULATION
MULTICULTURALISM IN CANADA
 MULTICULTURALISM IN CANADA Evidence and Anecdote ANDREW GRIFFITH Purpose Provide integrated view of multiculturalism Demographic, economic, social, political Latest data available Set out issues and implications
NATIONAL HOUSEHOLD SURVEY: LABOUR FORCE, EMPLOYMENT, AND INCOME
 Clause No. 15 in Report No. 1 of was adopted, without amendment, by the Council of The Regional Municipality of York at its meeting held on January 23, 2014. 15 2011 NATIONAL HOUSEHOLD SURVEY: LABOUR FORCE,
AVERAGE HOUSEHOLD INCOME $83,026 ($93,586) RENTERS 37% (29%) UNEMPLOYMENT RATE 7% (7%) TAKE TRANSIT TO WORK 20% (15%)
 RENTERS 37% (29%) UNEMPLOYMENT RATE 7% (7%) TAKE TRANSIT TO WORK 20% (15%)") CITY OF COMMUNITY PROFILES 2016 Census Data City of Surrey Statistics CITY CENTRE GUILDFORD FLEETWOOD NEWTON CLOVERDALE AREA 3,131 ha (32,621 ha) AVERAGE HOUSEHOLD INCOME $83,026 ($93,586) SOUTH POPULATION
CITY OF COMMUNITY PROFILES 2016 Census Data City of Surrey Statistics CITY CENTRE GUILDFORD FLEETWOOD NEWTON CLOVERDALE AREA 3,131 ha (32,621 ha) AVERAGE HOUSEHOLD INCOME $83,026 ($93,586) SOUTH POPULATION
Statistical Profiles: East York and Chapleau Sarah Gram, Barry Wellman and Julie Amoroso
 Statistical Profiles: East York 1981-2005 and Chapleau 2001 Sarah Gram, Barry Wellman and Julie Amoroso NetLab, University of Toronto April 2009 Table of Contents Introduction 2 1. East York 2001-2005
Release of 2006 Census results Labour Force, Education, Place of Work and Mode of Transportation
 Backgrounder Release of 2006 Census results Labour Force, Education, Place of Work and Mode of Transportation On March 4, 2008 Statistics Canada released further results from the 2006 census focusing on
AVERAGE HOUSEHOLD INCOME $103,177 ($93,586) RENTERS 21% (29%) UNEMPLOYMENT RATE 5% (7%) TAKE TRANSIT TO WORK 6% (15%)
 RENTERS 21% (29%) UNEMPLOYMENT RATE 5% (7%) TAKE TRANSIT TO WORK 6% (15%)") CITY OF COMMUNITY PROFILES 2016 Census Data City of Surrey Statistics WHALLEY CITY CENTRE GUILDFORD FLEETWOOD NEWTON AREA 4,917 ha (32,621 ha) AVERAGE HOUSEHOLD INCOME $103,177 ($93,586) SOUTH POPULATION
CITY OF COMMUNITY PROFILES 2016 Census Data City of Surrey Statistics WHALLEY CITY CENTRE GUILDFORD FLEETWOOD NEWTON AREA 4,917 ha (32,621 ha) AVERAGE HOUSEHOLD INCOME $103,177 ($93,586) SOUTH POPULATION
Employment, Education and Income
 This is one in a series of fact sheets that provide a profile of immigrants in. Understanding the makeup of our community is important for planning programs and services. Between 2006 and 2011, 15,465
Strathcona A Regional District in British Columbia
 Produced by Stats for Population Total Immigrants Change in Change in Immigrants Population Number Percent Population Number Percent 1991 - - - 1991 to 1996 - - - 1996 - - - 1996 to 1 - - - 1 - - - 1 to
The population universe (target population) of the 2011 Census includes the following groups:
 of the 2011 Census includes the following groups:") Glossary DEMOGRAPHICS Population The population universe includes variables that provide information about individuals, covering demographic characteristics and language. See Figure 16 for a list of these
Glossary DEMOGRAPHICS Population The population universe includes variables that provide information about individuals, covering demographic characteristics and language. See Figure 16 for a list of these
Socio-Economic Profile
 LOCAL HEALTH AREA 7 - Socio-Economic Profile Powell River Comox Cumberland Denman Island Hornby Island Qualicum CENSUS POPULATION LAND AREA POPULATION DENSITY Number % of Region Sq. Km. % of Region Persons
City of Surrey. Labour Force Fact Sheet. Preface
 City of Preface Every five years, Statistics Canada conducts a Census of Population in order to develop a statistical portrait of Canada and its people. The most recent Census was conducted in May 2011.
COMMUNITY PROFILE: Fort St. John, British Columbia Census Subdivision (CSD) PHASE 1 Winter 2018
 PHASE 1 Winter 2018") COMMUNITY PROFILE: Fort St. John, British Columbia Census Subdivision (CSD) PHASE 1 Winter 2018 About the Community Development Institute Established in 2004, the Community Development Institute (CDI)
COMMUNITY PROFILE: Fort St. John, British Columbia Census Subdivision (CSD) PHASE 1 Winter 2018 About the Community Development Institute Established in 2004, the Community Development Institute (CDI)
Victoria A City in Capital Regional District
 Produced by Stats for Global Non-Response Rate: 24.6 Population Total Immigrants Change in Change in Immigrants Population Number Percent Population Number Percent 1991 71,228 14,665 20.6 1991 to 1996
North Okanagan A Regional District in British Columbia
 Population Total Immigrants Change in Change in Immigrants Population Number Percent Population Number Percent 1991 61,744 7,855 12.7 1991 to 1996 9,863 685 8.7 1996 71,67 8,54 11.9 1996 to 1 1,6-28 -
Interministerial Women s Secretariat
 Women in PEI: A Statistical Review Interministerial Women s Secretariat Table of Contents Executive Summary 1 1 The Female Population of PEI 8 Chapter Summary 8 Population by Age 9 Mother Tongue 11 Languages
Planning Study Area 1 Burnaby Heights
 Neighbourhood Profiles 2006 Census Planning Study Area 1 Heights is bounded by Burrard Inlet to the north, Willingdon Avenue to the east, Hastings Street to the south and Boundary Road to the west. PLANNING