Refrain or Reality: A United States Rural Policy?
|
|
|
- Sharleen Arnold
- 5 years ago
- Views:
Transcription
1 Refrain or Reality: A United States Rural Policy? Presented to The Kansas Hospital Association 2003 Rural Health Symposium Wichita, Kansas March 11, 2003 Charles W. Fluharty, Director Rural Policy Research Institute
2 Five Considerations: I. The case for a rural policy tipping point The Farm Bill process and outcome A growing understanding of the true rural economy The new Census and its public policy implications Rethinking rural governance II. Building a constituency for a community-based rural policy: New political realities The policy context Alternatives for consideration III. The rural / urban dialectic IV. Linking policy and community practice: Bring in the bridge builders! V. Implications for Rural Health
3 I. The case for a rural policy tipping point The Farm Bill process and outcome A growing understanding of the true rural economy The new Census and its public policy implications Redistricting, and the next two electoral cycles
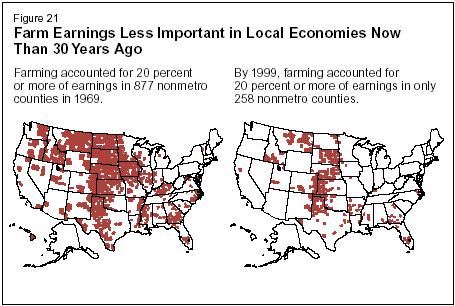
4 Rural is much more than agriculture; and the future success of our nation s family farms is critically linked to the economies of rural communities. Only 6.3% of rural Americans live on farms. Farming accounts for only 7.6% of rural employment. 90% of rural workers have non-farm jobs. In 1999, 90% of all farm operator s household income came from off-farm sources.
5 Only 0.39% of the US population is engaged in farming as a primary occupation; and Only 1.78% of the US rural population is engaged in farming as a primary occupation. But... In ag dependent counties, or rural areas where agriculture is the dominant sector, as in most of the Great Plains, we are literally in crisis!
6
7 ERS Farm Typology Number of Households Avg. HH Income Avg. Off- Farm Income Avg. earned off-farm income Percent of HH income from earned off-farm sources Percent of HH income from total offfarm sources Small Family Farms Limited Resource 126,920 $9,534 $13,114 $5, % 137.5% Retirement 297,566 $40,643 $41,991 $11, % 103.3% Residential / lifestyle 931,561 $83,788 $87,796 $79, % 104.8% Farming-occupation low sales 480,441 $39,764 $39,892 $22, % 100.3% Farming-occupation high sales 175,370 $53,322 $26,621 $19, % 49.9% Large Family Farms 77,314 $85,685 $34,598 $24, % 40.4% Very Large Family Farms 58,403 $201,206 $35,572 $23, % 17.7% Source: ERS, February 2001
8 Farm / Farm Policy Structure: 2 million farms 2% produce 50% of food / fiber 36% of farms participate in support programs (30% of total farm acreage) Between 1996 and 1998: $22.9 billion in farm subsidies 144,000 participants received 61% of money (7.2% of America s farmers received $13.97 billion) The more farm dependant an area is, the more its economic growth lags the rest of America.
9 I. The case for a rural policy tipping point The Farm Bill process and outcome A growing understanding of the true rural economy The new Census and its public policy implications Redistricting, and the next two electoral cycles
10 The rural economy has strengthened and is slowly growing, but remains fragile and uneven: Over 2 million more rural Americans are employed today than at the start of the last decade. Until this downturn, rural unemployment had continued to decline -- lowest level since 1990 recession. Rural earnings, after a decade of decline, were rising at rates similar to urban, as was per capita income.
11 But... Rural employment is still dominated by low wage industries: In 1996, 23% of rural workers in the service sector Rural workers are nearly twice as likely to earn the minimum wage (12% - rural, 7%- urban) Rural workers remain more likely to be underemployed and are less likely to improve their employment circumstances over time. (40% less likely to move out of low wage jobs than central city residents) In 1999, 27% of rural workers over age 25 received wages that if earned full time, full year, would not lift a family of four above the official poverty line (5 million workers).
12 Distribution of Nonmetro Employment, 1969 Government 17% Extractive 17% Construction 5% Services 15% FIRE 4% Manufacturing 21% Trade 17% TCPU 4%
13 Distribution of Nonmetro Employment, 1979 Government 16% Extractive 15% Construction 5% Services 17% Manufacturing 20% FIRE 5% Trade 18% TCPU 4%
14 Distribution of Nonmetro Employment, 1989 Government 17% Extractive 12% Construction 5% Services 20% Manufacturing 18% FIRE 5% Trade 19% TCPU 4%
15 Distribution of Nonmetro Employment, 1999 Government 16% Extractive 10% Construction 6% Manufacturing 15% Services 24% TCPU 4% FIRE 5% Trade 20%
16 The Changing U.S. Economy: Percent Employment in Goods and Services Industries, % 80.0% 70.0% 60.0% 50.0% 40.0% 30.0% 20.0% 10.0% 0.0% Percent in Goods Producing Percent in Services Producing Source: RUPRI Analysis of BLS Data

17 From: Creating Vibrant Communities & Economies in Rural America, Lionel J. Beaulieu, Southern Rural Development Center
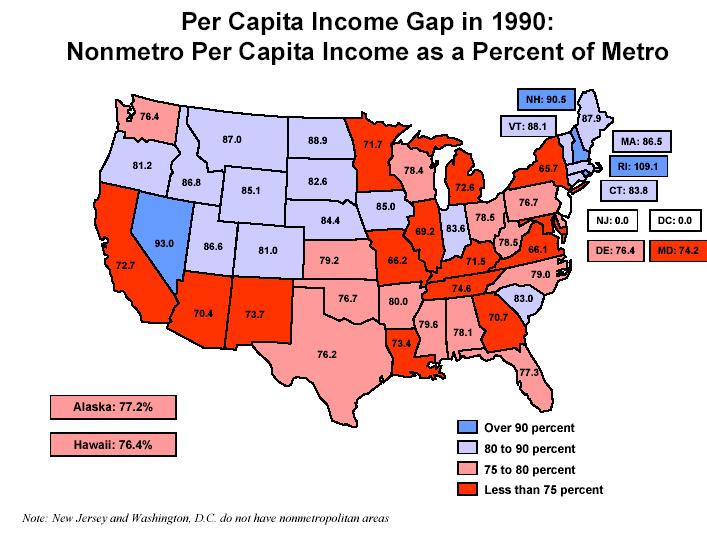
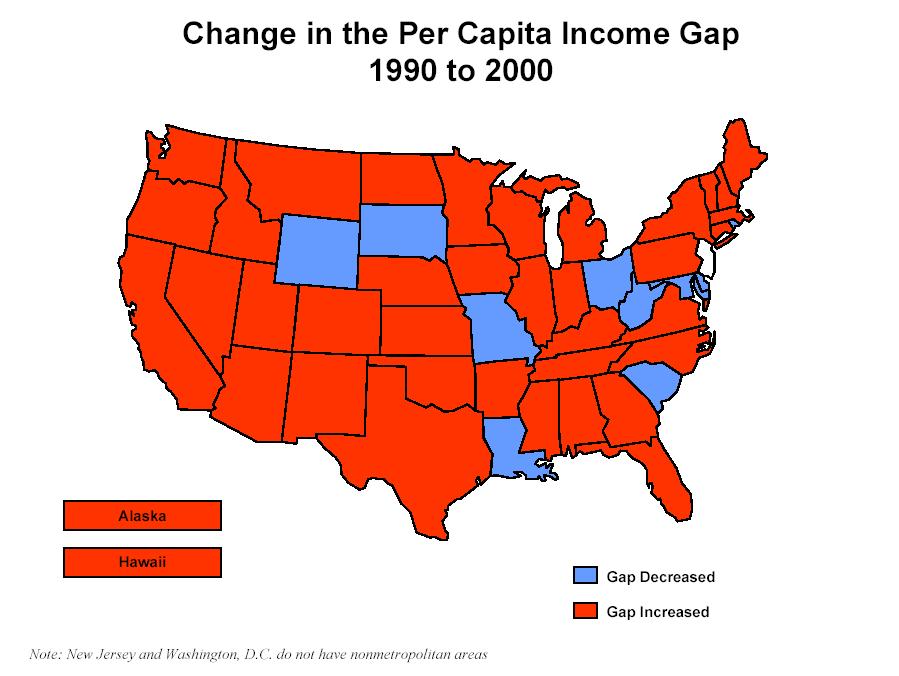
18 Between there was a gain of 2,756,000 jobs in rural America an increase of 11.3%. However, between there was only a negligible change in non-metropolitan job earnings remaining more or less around $22,493 per year per job. (1996) In fact, the rural/urban earnings gap persisted and widened in the 1990s (from 73.8 to 70 percent).
19 Therefore: Rural incomes remain lower than urban (1997 median: $30K+ - Rural, 39K+ - Urban) Rural poor families are more likely to be employed and still poor. (In 1998, 2/3 of poor families had at least one member working at some time during the year; 16% had two or more members working; 29% had one or more full time, full year workers -- a 9% rise since 1996).
20 35,000 Per Capita Income in the U.S. and in Metro and Nonmetro Areas (all figures adjusted to 2000 dollars) 30,000 25,000 20,000 15,000 10,000 5,000 U.S. Metro Nonmetro
21 % 12.0% 10.0% 8.0% 6.0% 4.0% 2.0% 0.0% Farm Income as a Percent of Total Income in Nonmetro Areas
22 Per Capita Income Gap in the U.S. Nonmetro Income as apercent of Metro Income 80.0% 78.0% 76.0% 74.0% 72.0% 70.0% 68.0% 66.0% 64.0% Source: RUPRI Analysis of BEA Data
23
24
25

26 From: Creating Vibrant Communities & Economies in Rural America, Lionel J. Beaulieu, Southern Rural Development Center
27
28
29 I. The case for a rural policy tipping point The Farm Bill process and outcome A growing understanding of the true rural economy The new Census and its public policy implications Rethinking rural governance
30 While the economy of rural America, in general, has improved, persistent pockets of intractable rural poverty remain: In general, poverty rates are higher in rural than urban areas. (15.7% rural and 12.6% urban, 1997) While the rural poverty rate declined by 1 ½% between 1997 and 1998 still 14.3% [urban 12.3%]. 7.5 million rural residents live in poverty; an additional 11% live close to poverty (between % of poverty) [urban 8%]. Rural poverty is working poverty -- 2/3 of rural poor live in a family with at least one member working. Child poverty is higher in rural areas. (22.7% rural and 19.2% urban, 1997) Over half of rural children in female-headed households are in poverty. (3.2 million rural children, 1996.)
31 Persistent Poverty as of 1999 Poverty Rates of 20% or Higher in 1959, 1969, 1979, 1989 and 1999 Metro (19) Nonmetro Adjacent (134) Nonmetro Nonadjacent (229) Source: U.S. Census Bureau and Economic Research Service, USDA Map Prepared by RUPRI
32 Persistent Poverty : Change from 1989 to1999 Metro Persistently Poor (19) Nonmetro Persistently Poor (363) Metro No Longer Poor (17) Nonmetro No Longer Poor (172) Source: U.S. Census Bureau and Economic Research Service, USDA Map Prepared by RUPRI
33 The Census population shifts were very significant: The 1990 s saw a rural population rebound; which totally reversed the outmigration of the 1980 s. 70% of rural counties grew in population from 1990 to But, this growth is largely concentrated in only 40% of rural counties. 7/8 of these growing counties derived some or all of their increase from in-migration of metro residents. 61% of rural counties experienced net in-migration between 1990 and In fact, between 1990 and 1999, 2.2 million more Americans moved from the city to the country, than the reverse.
34 However, rural population increases have steadily dropped since momentarily exceeding urban levels in And, all rural counties have turned downward in growth rate since 1995, except commuter counties: Mining and farming dependent counties had the greatest relative fall-off in pace of growth. In , the rural population growth rate was less than half of urban. And, the number of rural counties with decreasing population rose from 600 in to 855 in Significant rural population declines continue in the Great Plains, and other disadvantaged rural areas. And, numerous growth counties are experiencing expanding diversity in ethnic / racial composition, with attendant challenges.
35 Rural Population Growth Population Growth million people + 7.6% increase from April 1990 to July Compared to Population Growth million people + 2.7% increase This entire 1990 s increase is a product of migration: During 1980 s annual rural outmovement of 269,000 During 1990 s average annual inmovement of 242,000 The fastest growth and migration rates occurred in the South and the West.
36 Percent Change in Population, County Population Change Population Decline Increase less than 25% Increase 25% or more Source: U.S. Census Bureau Map Prepared by RUPRI
37 Nonmetro net migration, Source: Prepared by Economic Research Service, USDA, using data from the Bureau of the Census. Net inmigration over 3.2% (1036 cos.) Net inmigration up to 3.2% (377 cos.) Net outmigration (892) Metro The US average for this period was 3.2 percent. The Nonmetro average for this period was 4.4 percent.
38 Figure 1 Annual population growth rates for metro counties, nonmetro counties, and the Nation, The pace of nonmertro population growth in continues the slowdown that began after Percent Nonmetro Metro.4 U.S. total
39 Total Population, 1990 Nonmetro 23% Metro, inside central cities 31% Metro, outside central cities 46% Source: U.S. Census Bureau
40 Total Population, 2000 Nonmetro 20% Metro, inside central cities 30% Metro, outside central cities 50% Source: U.S. Census Bureau
41 Total Hispanic Population, 1990 Nonmetro 10% Metro, inside central cities 51% Metro, outside central cities 39% Source: U.S. Census Bureau
42 Total Hispanic Population, 2000 Nonmetro 9% Metro, inside central cities 46% Metro, outside central cities 45% Source: U.S. Census Bureau
43 Total Population, 1990 and ,000, ,000, ,000, ,000,000 80,000,000 60,000,000 40,000,000 20,000,000 - Metro inside central cities Metro outside central cities Nonmetro Source: U.S. Census Bureau
44 Total Hispanic Population, 1990 and ,000,000 16,000,000 14,000, ,000,000 10,000,000 8,000,000 6,000,000 4,000,000 2,000,000 - Metro inside central cities Metro outside central cities Nonmetro Source: U.S. Census Bureau
45 Percent Change Total Population Percent Change Hispanic Population U.S. Total 13.2% 57.9% Metropolitan Total 17.3% 59.2% Metro inside central cities 9.7% 42.9% Metro outside central cities 22.4% 80.8% Nonmetro -1.0% 45.7% Source: U.S. Census Bureau
46 Counties with Increase in Hispanic Population of 100 Percent or More, Source: U.S. Census Bureau Map Prepared by RUPRI Nonmetro (1,176 Counties) Metro (402 Counties)
47 Change in Rural & Urban Generations, % 9.6% Urban Counties Rural Counties 2.4% 0.1% Gen X Baby Boomers Born Between Born Between U.S. Census Bureau
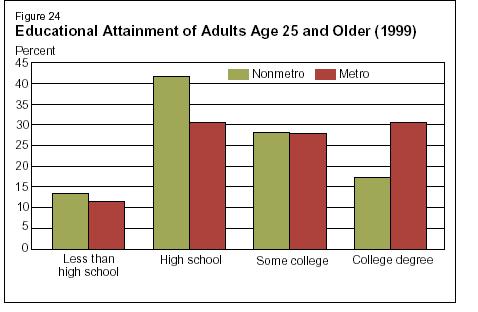
48 Human and Social Capital Considerations: Education: Recent rural high school graduation rates match or exceed urban rates. Rural dropout rates have fallen sharply in recent years, But -- Rural out-migration remains largely our youngest and most highly educated: Rural America s most important export remains our best and our brightest. So, fewer young adults in rural areas seek post secondary education; have college degrees; and more have no high school diplomas (23.5% rural and 17.4% urban, 1997). Yet, -- Rural schools represented 22% of all public schools in 1997, but: Only received 12.5% of federal funding 14% of all state funding 11% of all local funding
49
50 Health: 22 million rural residents live in federally-designed Health Professions Shortage Areas, or Medically Underserved Areas, and Rural residents tend to have poorer health care access; lower health insurance coverage, and little or no managed care availability. Welfare Reform: In 1996, 21% of our nation s welfare population was rural. 15 states had more than 50% of their welfare population living in rural areas. Caseloads have declined, but: Working age poverty hasn t ( ): Central cities 7% decline 22 to 20% Suburbs 10% decline 10 to 9% Rural Unchanged 17%
51 I. The case for a rural policy tipping point The Farm Bill process and outcome A growing understanding of the true rural economy The new Census and its public policy implications Rethinking rural governance
52 The relationship between federal, state, and local governments and government revenue streams have a major impact on rural areas: 2,305 of our nation s 3,043 counties are rural (76% of counties, 83% of our nation s land, and 25% of our nation s population is rural). Rural economies are significantly dependent upon federal government transfer payments -- 20% of total personal income in rural America comes from federal transfers to rural community citizens.
53 Rural Governance: The Challenge for Citizen Servants 72% of county governments serve fewer than 50,000 persons. 700 of the 3,043 serve fewer than 10, % of the 36,001 sub-county general purpose governmental units serve less than 10, % have populations under 5, % serve less than 1,000.
54 II. Building a constituency for a community based rural policy: New political realities The policy context Alternatives for consideration
55 The New Political Realities Suburbanization of the American public policy arena 1990 Census 1992 Presidential Election The 25/25/50 rule 2000 Census The Congressional reality Devolution: To the states, or through the states? Current downturn has changed much, but states have cut taxes since 1996 Since 1990, state and local government expenditures up 15%, in real terms Nearly $50 billion in current state budget deficits Federal workforce reduced by 345,000 since 1990 State and local government workforce expanded by nearly 2 million in same period
56 The Rural Congressional Snapshot 1966 Rural Majority in 181 House Districts (42%) 1993 Rural Majority in 77 House Districts (18%) Congressional Quarterly (60%) 57 Districts (13%) Today, only thirteen states have a rural majority. These states represent 59 electoral votes. (Only 5 more than California, which is only 3% rural.) 1993 CRS study (1990 Census data): No rural district in top 100 family median income districts. Only two rural districts in top 200 family median income districts. Most rural districts were in the bottom 100.
57 The Challenge of a National Rural Policy: Believable problem articulation National voice Coalition consensus Sustained, integrative implementation strategy Visionary leadership - AARP!
58 Why a National Rural Policy is So Difficult to Achieve Rural remains synonymous with agriculture A constituency has not been organized Many sector-level constituencies Congressional and Administration programs remain fragmented. No one Congressional Committee or Administrative Department with overall responsibility for rural policy and rural program integration
59 The Policy Component of Rural Policy What? Integrative national rural policy Global examples National sector-level rural policy Department initiatives Congressional initiatives Integrative state rural policy Governor s initiatives Legislative initiatives Public / private sector initiatives
60 The Policy Component of Rural Policy Who? Potential change agents for a new rural policy? President Congress Colleges / Universities Governors State Legislatures Philanthropic community Private sector Building a constituency for action
61 Hopeful Developments of Possible Consequence: Congressional Rural Caucus Presidential Letter National Rural Network: New rural mission areas in many NGOs Farm Bill Rural Development Title HHS Secretary s Rural Initiative State-level policy efforts Emergent, new rural leadership: Expanding leadership role for women Kansas City Fed Center for the Study of Rural America Expanding philanthropic interest in rural portfolio Rural new governance : public / private / philanthropic collaborations State Rural Development Councils
62 III. The Rural / Urban Dialectic
63 Dialectic: n. Any systematic reasoning, exposition, or argument that juxtaposes opposed or contradictory ideas and usually seeks to resolve their conflict. -Webster s Ninth New Collegiate Dictionary
64 The Policy Differential
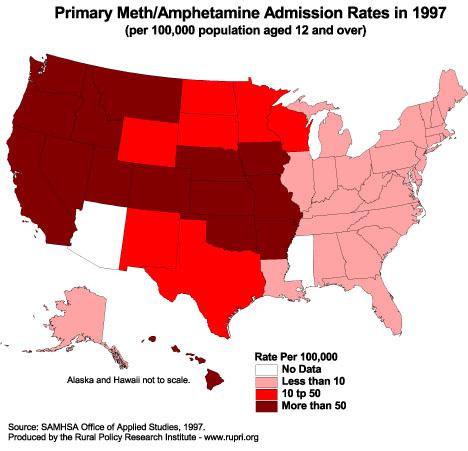
65 Four Considerations of this Rural Differential: Rural Housing Poverty Rates in Female-Headed Households Rural Youth Substance Abuse PROWRA
66 Housing Conditions: Rural vs. Urban Nonpoor Rural Nonpoor Urban Poor Rural Poor Urban Crowded Inadequate Source: ERS, USDA
67 Poverty Rates among Female-Headed Families with Children Nonmetro Metro
68 Rural Youth / Substance Abuse In 1999: Rural eighth graders were 32% more likely to have used marijuana in the past month than those in large metro areas. Rural eighth graders were 52% more likely to have used cocaine in the past year than those in large metro areas. Rural eighth graders were 75% more likely to have used crack cocaine in the past year than those in large metro areas. Rural eighth graders were 104% more likely to have used amphetamines, including methamphetamines, in the past month than those in large metro areas. Rural eighth graders were 29% more likely to have used alcohol in the past month than those in large metro areas. Rural eighth graders were twice as likely to have smoked cigarettes in the past month than those in large metro areas. The National Center on Addiction and Substance Abuse at Columbia University (CASA) No Place to Hide: Substance Abuse in Mid-Size Cities and Rural America. JAN 2000, Columbia University. New York, NY: Columbia University.
69
70
71
72
73 PRWORA s Labor Market Assumptions: The labor market can absorb workers transitioning from welfare (Match between workers and jobs) Workers can earn enough to sustain their families
74 Selected Economic Characteristics of Metro and Nonmetro Areas Metro Nonmetro Unemployment Rate, 1999 Employment Change, Average weekly earnings, Poverty Rate,
75 Average Weekly Earnings, 1999 (dollars) Metro Nonmetro Nonmetro Less than High School 213 Nonmetro LTHS Women Calculated by ERS using data from the Current Population Survey
76 Between 1992 and 1998, single mothers in central cities and remote rural areas had: lower earnings growth, more persistent poverty, and more persistent welfare receipt Preliminary findings from a forthcoming study supported by Brookings Center on Urban and Metropolitan Policy and Rural Policy Research Institute
77 The percent of single mothers with earnings increased across the urban-rural continuum Figure 13. Single Mothers Reporting Earnings, by Residence: 1992 and Percent (%) reporting earnings central city balance of metro nonmetro adjacent counties Place of residence nonmetro nonadjacent counties
78 But single mother median earnings did not increase in central cities and remote rural counties Figure 14. Median Earnings of Single Mothers, by Residence: 1992 and Annual Earnings (US$) central city balance of metro nonmetro adjacent counties Place of residence nonmetro nonadjacent counties
79 And single mother poverty rates went down least in central cities and remote rural counties Figure 15. Poverty Among Single Mother Families, by Residence: 1992 and Percent (%) below low-income level central city balance of metro nonmetro adjacent counties nonmetro nonadjacent counties Place of residence
80 Poverty is most persistent in central counties and remote rural counties Figure 11. Poverty Duration, Single Mothers by Residence: 1993 to to 2 years 3 to 4 years 5 years 20 Percent (%) poor central metro counties fringe metro counties other metro counties nonmetro adjacent counties nonmetro nonadjacent counties Place of residence
81 Welfare receipt is most persistent in central counties and remote rural counties Figure 10. Public Assistance Duration, Single Mothers by Residence: 1993 to 1998 Percent (%) reporting public assistance receipt to 2 years 3 to 4 years 5 years 0 central metro counties fringe metro counties other metro counties nonmetro adjacent counties nonmetro nonadjacent counties Place of residence
82 IV. Linking policy and community practice: Bring in the bridge builders!
83 Building a new rural pragmatism or.... So, if we all care so much about rural America, Why is she in such bad shape?
84 Three Questions, for your Consideration: Given our suburban policy context and the public s misperception of our current rural realities, where do rural constituencies turn for support? Is the historic rural / ag family fight really helpful to either sibling? Is it possible that central city and rural residents may have more uniting them than dividing them?
85 Would you tell me please, which way I ought to go from here? said Alice. That depends a good deal on where you want to get, said the cat. I don t much care where, said Alice. Then it doesn t matter much which way you go, said the cat. - Lewis Carroll Alice in Wonderland
86 Community Policy and Constituency Convergence: Toward a Place-Based Policy: Why Cities Matter... The Brookings Institution Community Connections Doug Nelson, President The Annie E. Casey Foundation
87 No snowflake in an avalanche ever feels responsible! - Stanislaus Lezcynski
88 The poet is the joiner, he sees how they join. - Walt Whitman, 1855
89 The OECD Framework: Sector to Place Subsidy to Regional Competitiveness A Governance Structure to Accomplish Both
90 V. Implications for Rural Health Care
91 Challenges Facing All Rural Regions Today Technological Change Globalization Localization New Governance Changing Industrial Structure & Employment Changing Demographics Changing Lifestyles and Settlement Patterns Changing Political Economy
92 The New Institutional Framework for Rural Regional Advancement Regional Collaborations Jurisdictional Realignments A Cross-Sectoral Framework Optimizing the Public / Private Moment An Entrepreneurial Awakening The Critical Role of Intermediaries
93 The Critical Importance of Building Rural Public and Private Entrepreneurship
94 Metro and Nonmetro Counties in Kansas, 1999 Metro Nonmetro Source: U.S. Census Bureau Map prepared by RUPRI
95 Percent Change in Population, U.S. = 13.1% Kansas = 8.5% Population decline Growth less than 13.1% Growth over 13.1% Source: U.S. Census Bureau Map prepared by RUPRI
96 Per Capita Income in Kansas, 2000 U.S. = $29,469 Kansas = $27,374 Less than $20,000 $20,000 to $29,469 Greater than $29,470 Source: Bureau of Economic Analysis Map prepared by RUPRI
97 Percent of Persons in Poverty, 1999 U.S. = 12.4 % Kansas = 9.9 % Greater than 12.4% 9.9% % Less than 9.9% Source: U.S. Census Bureau Map prepared by RUPRI
98 Educational Attainment: Percent of Persons 25 and over with a B.S. Degree or Higher U.S. = 24.4% Kansas = 25.8 % Less than 24.4% 24.4 to 40.0% Greater than 40.0% Source: U.S. Census Bureau Map prepared by RUPRI
99 Five Critical Rural Health Developments HHS Secretary s Rural Initiative Recession / State Funding Challenges Workforce / WIA Reauthorization Welfare Reform Reauthorization Medicaid / Medicare Reform
100 HHS Rural Task Force This internal HHS Rural Task Force will examine how existing program serve rural communities; will consider the impact of the HHS funding on rural economies; and will make recommendations to improve health care and social services to rural America... Federal Register; August 29, 2001
101 Redefining the Public Metaphor and Rhetoric for Rural America
102 Why not go out on a limb? That s where the fruit is. Will Rogers
103 The question is not what you look at, but what you see. -Henry David Thoreau
Rural America At A Glance
 Rural America At A Glance 7 Edition Between July 5 and July 6, the population of nonmetro America grew.6 percent. Net domestic migration from metro areas accounted for nearly half of this growth. Gains
STRENGTHENING RURAL CANADA: Fewer & Older: Population and Demographic Crossroads in Rural Saskatchewan. An Executive Summary
 STRENGTHENING RURAL CANADA: Fewer & Older: Population and Demographic Crossroads in Rural Saskatchewan An Executive Summary This paper has been prepared for the Strengthening Rural Canada initiative by:
8AMBER WAVES VOLUME 2 ISSUE 3
 8AMBER WAVES VOLUME 2 ISSUE 3 F E A T U R E William Kandel, USDA/ERS ECONOMIC RESEARCH SERVICE/USDA Rural s Employment and Residential Trends William Kandel wkandel@ers.usda.gov Constance Newman cnewman@ers.usda.gov
Low-Skill Jobs A Shrinking Share of the Rural Economy
 Low-Skill Jobs A Shrinking Share of the Rural Economy 38 Robert Gibbs rgibbs@ers.usda.gov Lorin Kusmin lkusmin@ers.usda.gov John Cromartie jbc@ers.usda.gov A signature feature of the 20th-century U.S.
STRENGTHENING RURAL CANADA: Fewer & Older: The Coming Demographic Crisis in Rural Ontario
 STRENGTHENING RURAL CANADA: Fewer & Older: The Coming Demographic Crisis in Rural Ontario An Executive Summary 1 This paper has been prepared for the Strengthening Rural Canada initiative by: Dr. Bakhtiar
FISCAL POLICY INSTITUTE
 FISCAL POLICY INSTITUTE Learning from the 90s How poor public choices contributed to income erosion in New York City, and what we can do to chart an effective course out of the current downturn Labor Day,
STRENGTHENING RURAL CANADA: Fewer & Older: The Coming Population and Demographic Challenges in Rural Newfoundland & Labrador
 STRENGTHENING RURAL CANADA: Fewer & Older: The Coming Population and Demographic Challenges in Rural Newfoundland & Labrador An Executive Summary 1 This paper has been prepared for the Strengthening Rural
Le Sueur County Demographic & Economic Profile Prepared on 7/12/2018
 Le Sueur County Demographic & Economic Profile Prepared on 7/12/2018 Prepared by: Mark Schultz Regional Labor Market Analyst Southeast and South Central Minnesota Minnesota Department of Employment and
Rural Welfare Reform. Lessons Learned. Leslie A.Whitener, Robert Gibbs, Lorin Kusmin,
 VOLUME 1 ISSUE 3 38 Rural Welfare Reform Lessons Learned Leslie A.Whitener, whitener@ers.usda.gov Robert Gibbs, rgibbs@ers.usda.gov Lorin Kusmin, lkusmin@ers.usda.gov JUNE 2003 39 EyeWire Welfare reform
Rural Life Today. by Robin Kimbrough-Melton
 Institute on Family & Neighborhood Life Rural Life Today by Robin Kimbrough-Melton Fact Sheet FAMILY TRENDS Family life in rural America is often associated with the traditional, two-parent family. Although
Pulling Open the Sticky Door
 Pulling Open the Sticky Door Social Mobility among Latinos in Nebraska Lissette Aliaga-Linares Social Demographer Office of Latino/Latin American Studies (OLLAS) University of Nebraska at Omaha Overview
An Equity Assessment of the. St. Louis Region
 An Equity Assessment of the A Snapshot of the Greater St. Louis 15 counties 2.8 million population 19th largest metropolitan region 1.1 million households 1.4 million workforce $132.07 billion economy
In class, we have framed poverty in four different ways: poverty in terms of
 Sandra Yu In class, we have framed poverty in four different ways: poverty in terms of deviance, dependence, economic growth and capability, and political disenfranchisement. In this paper, I will focus
STATE OF WORKING FLORIDA
 STATE OF WORKING FLORIDA 2017 The State of Working Florida 2017 analyzes the period from 2005 through 2016 and finds that while Florida s economic and employment levels have recovered from the Great Recession
Demographic Data. Comprehensive Plan
 Comprehensive Plan 2010-2030 4 Demographic Data Population and demographics have changed over the past several decades in the City of Elwood. It is important to incorporate these shifts into the planning
Center for Demography and Ecology
 Center for Demography and Ecology University of Wisconsin-Madison Recent Trends in Nonmetropolitan Migration: Toward a New Turnaround? Glenn V. Fuguitt and Calvin L. Beale CDE Working Paper No. 95-07 RECENT
 www.actrochester.org Monroe County General Overview Monroe County is the region s urban center and reflects the highs and lows, and stark disparities, of the Finger Lakes region. It has the most educated
LABOR AND TRAINING NEEDS OF RURAL AMERICA
 LABOR AND TRAINING NEEDS OF RURAL AMERICA Daniel W. Sturt, Director Rural Manpower Service, Manpower Administration U.S. Department of Labor I would like to discuss some of the human dimensions involved
CURRENT ANALYSIS. Growth in our own backyard... March 2014
 93619 CURRENT ANALYSIS March 14 Composition of the Canadian population % of total adult population 15+ 8 6 4 2 14.1.9 14.9 42.5 * Labour Force Participation Rate % of Population in the Labour Force 69
Post-Secondary Education, Training and Labour September Profile of the New Brunswick Labour Force
 Post-Secondary Education, Training and Labour September 2018 Profile of the New Brunswick Labour Force Contents Population Trends... 2 Key Labour Force Statistics... 5 New Brunswick Overview... 5 Sub-Regional
The State of Rural Minnesota, 2019
 P.O. Box 3185 Mankato, MN 56002-3185 (507)934-7700 www.ruralmn.org The State of Rural Minnesota, 2019 January 2019 By Kelly Asche, Research Associate Each year, the Center for Rural Policy and Development
Dane County Trends. Dane County Trends
 Dane County Trends Dane County Trends Economic, Growth and Labor Economic, Growth and Labor Presented by: Phyllis Wilhelm Director of Economic Development your community energy company Definition of E.D.
Where Does the North Country Symposium Go From Here? A Global and National Perspective on Rural Policy and Practice
 Where Does the North Country Symposium Go From Here? A Global and National Perspective on Rural Policy and Practice Presented to the 6 th Annual North Country Symposium St. Lawrence University Canton,
Government data show that since 2000 all of the net gain in the number of working-age (16 to 65) people
 people") CENTER FOR IMMIGRATION STUDIES June All Employment Growth Since Went to Immigrants of U.S.-born not working grew by 17 million By Steven A. Camarota and Karen Zeigler Government data show that since all
CENTER FOR IMMIGRATION STUDIES June All Employment Growth Since Went to Immigrants of U.S.-born not working grew by 17 million By Steven A. Camarota and Karen Zeigler Government data show that since all
Women, Work and the Iowa Economy
 Women, Work and the Iowa Economy The State of Working Iowa 2008 Part II Beth Pearson Colin Gordon September 2008 The Iowa Policy Project 318 2nd Avenue N Mount Vernon, IA 52314 Iowa City Office: 20 E.
The Dynamics of Low Wage Work in Metropolitan America. October 10, For Discussion only
 The Dynamics of Low Wage Work in Metropolitan America October 10, 2008 For Discussion only Joseph Pereira, CUNY Data Service Peter Frase, Center for Urban Research John Mollenkopf, Center for Urban Research
LEFT BEHIND: WORKERS AND THEIR FAMILIES IN A CHANGING LOS ANGELES. Revised September 27, A Publication of the California Budget Project
 S P E C I A L R E P O R T LEFT BEHIND: WORKERS AND THEIR FAMILIES IN A CHANGING LOS ANGELES Revised September 27, 2006 A Publication of the Budget Project Acknowledgments Alissa Anderson Garcia prepared
ECONOMY MICROCLIMATES IN THE PORTLAND-VANCOUVER REGIONAL ECONOMY
 MICROCLIMATES IN THE PORTLAND-VANCOUVER REGIONAL by Sheila Martin, Director of the Institute of Portland Metropolitan Studies, Portland State University 1 Introduction The Regional Labor Market Portland-Vancouver
Baby Boom Migration Tilts Toward Rural America
 Baby Boom Migration Tilts Toward Rural America VOLUME 7 ISSUE 3 John Cromartie jbc@ers.usda.gov Peter Nelson Middlebury College 16 AMBER WAVES The size and direction of migration patterns vary considerably
Income. If the 24 southwest border counties were a 51 st state, how would they compare to the other 50 states? Population
 Executive Summary At the Cross Roads: US / Mexico Border Counties in Transition If the 24 southwest border counties were a 51 st state, how would they compare to the other 50 states? In 1998, former Texas
Regional Data Snapshot
 Regional Data Snapshot Population, Economy & Education Features SET Civic Forum Glacial Lakes Region, South Dakota Table of Contents 01 Overview 03 Human Capital 02 Demography 04 Labor Force 01 overview
The Brookings Institution Metropolitan Policy Program Bruce Katz, Director
 The Brookings Institution Metropolitan Policy Program Bruce Katz, Director State of the World s Cities: The American Experience Delivering Sustainable Communities Summit February 1st, 2005 State of the
Meanwhile, the foreign-born population accounted for the remaining 39 percent of the decline in household growth in
 3 Demographic Drivers Since the Great Recession, fewer young adults are forming new households and fewer immigrants are coming to the United States. As a result, the pace of household growth is unusually
Regional Data Snapshot
 Regional Data Snapshot Population, Economy & Education Features SET Civic Forum East Central NM, New Mexico Table of Contents 01 Overview 03 Human Capital 02 Demography 04 Labor Force 01 overview East
An Equity Profile of the Southeast Florida Region. Summary. Foreword
 An Equity Profile of the Southeast Florida Region PolicyLink and PERE An Equity Profile of the Southeast Florida Region Summary Communities of color are driving Southeast Florida s population growth, and
Places in Need: The Geography of Poverty and the American Safety Net
 Places in Need: The Geography of Poverty and the American Safety Net Scott W. Allard Professor, Evans School of Public Affairs University of Washington Nonresident Fellow, Brookings Institution Co Director,
Confronting Suburban Poverty in the Greater New York Area
 Confronting Suburban Poverty in the Greater New York Area Alan Berube June 2015 1 The geography of poverty and opportunity has changed 2 We need a new agenda for metropolitan opportunity New York-Newark-Jersey
Update ,000 Missing Jobs: Wisconsin s Lagging Sectors
 The State of Working Wisconsin 33,000 Missing Jobs: Wisconsin s Lagging Sectors Painfully Slow: Wisconsin s Recovery Weaker than even the National Recovery The 2007 recession, the Great Recession, is now
Dimensions of rural urban migration
 CHAPTER-6 Dimensions of rural urban migration In the preceding chapter, trends in various streams of migration have been discussed. This chapter examines the various socio-economic and demographic aspects
City of Greater Dandenong Our People
 City of Greater Dandenong Our People 2 City of Greater Dandenong Our People Contents Greater Dandenong people 4 Greater Dandenong people statistics 11 and analysis Population 11 Age 12 Unemployment Rate
Trends and Changes Affecting Upstate New York. David L. Brown & Robin Blakely-Armitage State of Upstate Conference June 8, 2011
 Trends and Changes Affecting Upstate New York David L. Brown & Robin Blakely-Armitage State of Upstate Conference June 8, 2011 Challenges & Opportunities Change, not stability, is the normal situation
A Barometer of the Economic Recovery in Our State
 THE WELL-BEING OF NORTH CAROLINA S WORKERS IN 2012: A Barometer of the Economic Recovery in Our State By ALEXANDRA FORTER SIROTA Director, BUDGET & TAX CENTER. a project of the NORTH CAROLINA JUSTICE CENTER
SPECIAL REPORT. TD Economics ABORIGINAL WOMEN OUTPERFORMING IN LABOUR MARKETS
 SPECIAL REPORT TD Economics ABORIGINAL WOMEN OUTPERFORMING IN LABOUR MARKETS Highlights Aboriginal women living off-reserve have bucked national trends, with employment rates rising since 2007 alongside
Rural Development Issues in the Northeast:
 Rural Development Issues in the Northeast: 2000-2005 by Stephan J. Goetz December 1999 Rural Development Paper No. 2 1999 The Northeast Regional Center for Rural Development Located at: The Pennsylvania
Regional Data Snapshot
 Regional Data Snapshot Population, Economy & Education Features SET Civic Forum Uwharrie Region, NC Table of Contents 01 Overview 03 Human Capital 02 Demography 04 Labor Force 01 overview Uwharrie Region,
The State of Working Pennsylvania 2004
 The State of Working Pennsylvania 2004 Howard Wial The Keystone Research Center Harrisburg, Pennsylvania The Keystone Research Center The Keystone Research Center (KRC) was founded in 1996 to broaden public
SECTION 1. Demographic and Economic Profiles of California s Population
 SECTION 1 Demographic and Economic Profiles of s Population s population has special characteristics compared to the United States as a whole. Section 1 presents data on the size of the populations of
Chapter One: people & demographics
 Chapter One: people & demographics The composition of Alberta s population is the foundation for its post-secondary enrolment growth. The population s demographic profile determines the pressure points
Population Outlook for the Portland-Vancouver Metropolitan Region
 Portland State University PDXScholar Institute of Portland Metropolitan Studies Publications Institute of Portland Metropolitan Studies 2007 Population Outlook for the Portland-Vancouver Metropolitan Region
COMMUNITY SNAPSHOT A REPORT ON THE ECONOMIC AND SOCIAL WELL-BEING
 ADVERTISING SUPPLEMENT COMMUNITY SNAPSHOT A REPORT ON THE ECONOMIC AND SOCIAL WELL-BEING OF THE NATIONAL CAPITAL AREA MAY 2013 FIRST EDITION Prepared for United Way of the National Capital Area by the
Changing Times, Changing Enrollments: How Recent Demographic Trends are Affecting Enrollments in Portland Public Schools
 Portland State University PDXScholar School District Enrollment Forecast Reports Population Research Center 7-1-2000 Changing Times, Changing Enrollments: How Recent Demographic Trends are Affecting Enrollments
Recent Demographic Trends in Nonmetropolitan America: First Evidence from the 2010 Census Executive Summary
 Recent Demographic Trends in Nonmetropolitan America: First Evidence from the 2010 Census Executive Summary Kenneth M. Johnson Department of Sociology and Carsey Institute University of New Hampshire This
How Have Hispanics Fared in the Jobless Recovery?
 How Have Hispanics Fared in the Jobless Recovery? William M. Rodgers III Heldrich Center for Workforce Development Rutgers University and National Poverty Center and Richard B. Freeman Harvard University
GROWTH AMID DYSFUNCTION An Analysis of Trends in Housing, Migration, and Employment SOLD
 GROWTH AMID DYSFUNCTION An Analysis of Trends in Housing, Migration, and Employment SOLD PRODUCED BY Next 10 F. Noel Perry Colleen Kredell Marcia E. Perry Stephanie Leonard PREPARED BY Beacon Economics
Leveling the Playing Field
 AP Photo/Erik S. Lesser Leveling the Playing Field How to Ensure Minorities Share Equitably in the Economic Recovery and Beyond Christian E. Weller and Amanda Logan September 2009 www.americanprogress.org
The State of. Working Wisconsin. Update September Center on Wisconsin Strategy
 The State of Working Wisconsin Update 2005 September 2005 Center on Wisconsin Strategy About COWS The Center on Wisconsin Strategy (COWS), based at the University of Wisconsin-Madison, is a research center
The State of Working Wisconsin 2017
 The State of Working Wisconsin 2017 Facts & Figures Facts & Figures Laura Dresser and Joel Rogers INTRODUCTION For more than two decades now, annually, on Labor Day, COWS reports on how working people
The Brookings Institution Metropolitan Policy Program Robert Puentes, Fellow
 The Brookings Institution Metropolitan Policy Program Robert Puentes, Fellow Of First Burbs and Boom Burbs: Dealing with Suburban Transition in the 21st Century City of Plano, TX Annual Retreat October
CIRCLE The Center for Information & Research on Civic Learning & Engagement
 FACT SHEET CIRCLE The Center for Information & Research on Civic Learning & Engagement The Youth Vote 2004 By Mark Hugo Lopez, Emily Kirby, and Jared Sagoff 1 July 2005 Estimates from all sources suggest
BLS Spotlight on Statistics: Union Membership In The United States
 Cornell University ILR School DigitalCommons@ILR Federal Publications Key Workplace Documents 9-2016 BLS : Union Membership In The United States Megan Dunn Bureau of Labor Statistics James Walker Bureau
An overview of employment changes in the nonmetropolitan South David L. Barkley
 SOUTHERN Meeting the Challenges of the Rural South Through Land -Grant Scholarship and Outreach Education VIEWS Theme of this Issue: The Changing Complexion of the South s Rural Labor Markets from the
Riverside Labor Analysis. November 2018
 November 2018 The City of Labor Market Dynamics and Local Cost of Living Analysis Executive Summary The City of is located in one of the fastest growing parts of California. Over the period 2005-2016,
Poverty Profile. Executive Summary. Kingdom of Thailand
 Poverty Profile Executive Summary Kingdom of Thailand February 2001 Japan Bank for International Cooperation Chapter 1 Poverty in Thailand 1-1 Poverty Line The definition of poverty and methods for calculating
POPULATION STUDIES RESEARCH BRIEF ISSUE Number
 POPULATION STUDIES RESEARCH BRIEF ISSUE Number 2008021 School for Social and Policy Research 2008 Population Studies Group School for Social and Policy Research Charles Darwin University Northern Territory
Inequality in Labor Market Outcomes: Contrasting the 1980s and Earlier Decades
 Inequality in Labor Market Outcomes: Contrasting the 1980s and Earlier Decades Chinhui Juhn and Kevin M. Murphy* The views expressed in this article are those of the authors and do not necessarily reflect
RESEARCH BRIEF: The State of Black Workers before the Great Recession By Sylvia Allegretto and Steven Pitts 1
 July 23, 2010 Introduction RESEARCH BRIEF: The State of Black Workers before the Great Recession By Sylvia Allegretto and Steven Pitts 1 When first inaugurated, President Barack Obama worked to end the
BLACK-WHITE BENCHMARKS FOR THE CITY OF PITTSBURGH
 BLACK-WHITE BENCHMARKS FOR THE CITY OF PITTSBURGH INTRODUCTION Ralph Bangs, Christine Anthou, Shannon Hughes, Chris Shorter University Center for Social and Urban Research University of Pittsburgh March
A Regional Comparison Minneapolis Saint Paul Regional Economic Development Partnership
 Greater MSP Baltimore A Regional Comparison Minneapolis Saint Paul Regional Economic Development Partnership TOP EMPLOYERS IN AND MSA GREATER MSP EMPLOYER EMPLOYEES EMPLOYER EMPLOYEES Target Corp. 26,694
Characteristics of Poverty in Minnesota
 Characteristics of Poverty in Minnesota by Dennis A. Ahlburg P overty and rising inequality have often been seen as the necessary price of increased economic efficiency. In this view, a certain amount
Confronting Suburban Poverty in the Greater New York Area. Alan Berube, with the Brooking s Institute, presents on Confronting Suburban Poverty:
 Confronting Suburban Poverty in the Greater New York Area Alan Berube, with the Brooking s Institute, presents on Confronting Suburban Poverty: Alan and Elizabeth Kneebone travelled around 25 cities in
The Brookings Institution Metropolitan Policy Program Robert Puentes, Fellow
 The Brookings Institution Metropolitan Policy Program Robert Puentes, Fellow A Review of New Urban Demographics and Impacts on Housing National Multi Housing Council Research Forum March 26, 2007 St. Louis,
This analysis confirms other recent research showing a dramatic increase in the education level of newly
 CENTER FOR IMMIGRATION STUDIES April 2018 Better Educated, but Not Better Off A look at the education level and socioeconomic success of recent immigrants, to By Steven A. Camarota and Karen Zeigler This
CHOICES The magazine of food, farm and resource issues
 CHOICES The magazine of food, farm and resource issues 4th Quarter 2003 A publication of the American Agricultural Economics Association Rural Area Brain Drain: Is It a Reality? By Georgeanne Artz Brain
Briefing Book- Labor Market Trends in Metro Boston
 Briefing Book- Labor Market Two other briefing books focus on the importance of formal education and ESOL courses to Boston s foreign-born residents. While there are a number of reasons why improving immigrant
Immigrants are playing an increasingly
 Trends in the Low-Wage Immigrant Labor Force, 2000 2005 THE URBAN INSTITUTE March 2007 Randy Capps, Karina Fortuny The Urban Institute Immigrants are playing an increasingly important role in the U.S.
Minorities in Rural America
 Minorities in Rural America South Carolina Rural Health Research Center Department of Health Administration Norman J. Arnold School of Public Health University of South Carolina Columbia, SC 29203 Michael
3Demographic Drivers. The State of the Nation s Housing 2007
 3Demographic Drivers The demographic underpinnings of long-run housing demand remain solid. Net household growth should climb from an average 1.26 million annual pace in 1995 25 to 1.46 million in 25 215.
OLDER INDUSTRIAL CITIES
 Renewing America s economic promise through OLDER INDUSTRIAL CITIES Executive Summary Alan Berube and Cecile Murray April 2018 BROOKINGS METROPOLITAN POLICY PROGRAM 1 Executive Summary America s older
The Brookings Institution Metropolitan Policy Program Alan Berube, Fellow
 The Brookings Institution Metropolitan Policy Program Alan Berube, Fellow Confronting Concentrated Poverty in Fresno Fresno Works for Better Health September 6, 2006 Confronting Concentrated Poverty in
WRITTEN STATEMENT FOR THE RECORD
 WRITTEN STATEMENT FOR THE RECORD CHARLES W. FLUHARTY PRESIDENT AND CEO, RURAL POLICY RESEARCH INSTITUTE TRUMAN SCHOOL OF PUBLIC AFFAIRS UNIVERSITY OF MISSOURI COLUMBIA BEFORE THE UNITED STATES HOUSE OF
Chapter 17. The Labor Market and The Distribution of Income. Microeconomics: Principles, Applications, and Tools NINTH EDITION
 Microeconomics: Principles, Applications, and Tools NINTH EDITION Chapter 17 The Labor Market and The Distribution of Income A key factor in a worker s earnings is educational attainment. In 2009, the
What's Driving the Decline in U.S. Population Growth?
 Population Reference Bureau Inform. Empower. Advance. What's Driving the Decline in U.S. Population Growth? Mark Mather (May 2012) Between 2010 and 2011, the U.S. population increased by 0.7 percent, after
AMBER WAVES VOLUME 2 ISSUE 5
 VOLUME 2 ISSUE 5 20 Eyewire Anatomy of Nonmetro High-Poverty Areas Common in Plight, Distinctive in Nature Calvin L. Beale cbeale@ers.usda.gov FEBRUARY 2004 21 The 1990s saw growing U.S. prosperity, ending
A COMPARISON OF ARIZONA TO NATIONS OF COMPARABLE SIZE
 A COMPARISON OF ARIZONA TO NATIONS OF COMPARABLE SIZE A Report from the Office of the University Economist July 2009 Dennis Hoffman, Ph.D. Professor of Economics, University Economist, and Director, L.
Tracking Oregon s Progress. A Report of the
 Executive Summary Tracking Oregon s Progress A Report of the Tracking Oregon s Progress (TOP) Indicators Project Many hands helped with this report. We are indebted first of all to the advisory committee
Hispanic Health Insurance Rates Differ between Established and New Hispanic Destinations
 Population Trends in Post-Recession Rural America A Publication Series of the W3001 Research Project Hispanic Health Insurance Rates Differ between and New Hispanic s Brief No. 02-16 August 2016 Shannon
3 SOCIOECONOMIC ANALYSIS
 3 SOCIOECONOMIC ANALYSIS A. INTRODUCTION Cumberland, Maryland has historically been the center for manufacturing and industry within Western Maryland with multimodal (rail, auto, and recreation) transportation
Abstract. Acknowledgments
 Racial/Ethnic Minorities in Rural Areas: Progress and Stagnation, 1980-90. By Linda L. Swanson (ed.), Rural Economy Division, Economic Research Service, U.S. Department of Agriculture. Agricultural Economic
The Economic Benefits of Closing Educational Achievement Gaps
 ASSOCIATED PRESS/DAMIAN DOVARGANES The Economic Benefits of Closing Educational Achievement Gaps Promoting Growth and Strengthening the Nation by Improving the Educational Outcomes of Children of Color
The State of Working Connecticut 2011: Wages, Job Sector Changes, and the Great Recession
 The State of Working Connecticut 2011: Wages, Job Sector Changes, and the Great Recession Sarah Esty Orlando Rodriguez, M.A. December 2011 Produced with the generous support of the Melville Charitable
POLICY BRIEF. Assessing Labor Market Conditions in Madagascar: i. World Bank INSTAT. May Introduction & Summary
 World Bank POLICY INSTAT BRIEF May 2008 Assessing Labor Market Conditions in Madagascar: 2001-2005 i Introduction & Summary In a country like Madagascar where seven out of ten individuals live below the
DOING GOOD AND DOING WELL: WHY EQUITY MATTERS FOR SUSTAINING PROSPERITY IN A CHANGING AMERICA
 DOING GOOD AND DOING WELL: WHY EQUITY MATTERS FOR SUSTAINING PROSPERITY IN A CHANGING AMERICA 11/13 MANUEL PASTOR @Prof_MPastor 1 2 U.S. Change in Youth (
Housing Portland s Families A Background Report for a Workshop in Portland, Oregon, July 26, 2001, Sponsored by the National Housing Conference
 Housing Portland s Families A Background Report for a Workshop in Portland, Oregon, July 26, 2001, Sponsored by the National Housing Conference by Barry Edmonston and Risa Proehl Housing Portland s Families
What s so Scary about a Recession? A Long-term View of the State of Working Oregon
 Executive Summary 204 N. First St., Suite C PO Box 7 Silverton, OR 97381 www.ocpp.org 503-873-1201 fax 503-873-1947 Labor Day, September 3, 2001 What s so Scary about a Recession? A Long-term View of the
Journal of Higher Education Outreach and Engagement, Volume 11, Number 1, p. 195, (2006)
") Journal of Higher Education Outreach and Engagement, Volume 11, Number 1, p. 195, (2006) Poverty and Population Density: Implications for Economic Development Policy Karen Tinsley, Matt Bishop Abstract
Journal of Higher Education Outreach and Engagement, Volume 11, Number 1, p. 195, (2006) Poverty and Population Density: Implications for Economic Development Policy Karen Tinsley, Matt Bishop Abstract
The Black Labor Force in the Recovery
 Cornell University ILR School DigitalCommons@ILR Federal Publications Key Workplace Documents 7-11-2011 The Black Labor Force in the Recovery United States Department of Labor Follow this and additional
Facts & Figures in this issue: income employment growth trends baby boomers millennials immigration
 Facts & Figures in this issue: income employment growth trends baby boomers millennials immigration 2017 Baby Boomers The term baby boomer refers to individuals born in the United States between 1946 and
EMBARGOED UNTIL THURSDAY 9/5 AT 12:01 AM
 EMBARGOED UNTIL THURSDAY 9/5 AT 12:01 AM Poverty matters No. 1 It s now 50/50: chicago region poverty growth is A suburban story Nationwide, the number of people in poverty in the suburbs has now surpassed
Population Aging, Immigration and Future Labor Shortage : Myths and Virtual Reality
 Population Aging, Immigration and Future Labor Shortage : Myths and Virtual Reality Alain Bélanger Speakers Series of the Social Statistics Program McGill University, Montreal, January 23, 2013 Montréal,
Like in many regions around the country, leaders in
 Executive Summary Like in many regions around the country, leaders in Minneapolis-St. Paul strive constantly to innovate and adopt strategies to bolster the region s economic competitiveness. Luckily,