Center for Demography and Ecology
|
|
|
- Leona Wilkins
- 6 years ago
- Views:
Transcription
1 Center for Demography and Ecology University of Wisconsin-Madison Recent Trends in Nonmetropolitan Migration: Toward a New Turnaround? Glenn V. Fuguitt and Calvin L. Beale CDE Working Paper No
2 RECENT TRENDS IN NONMETROPOLITAN MIGRATION: TOWARD A NEW TURNAROUND? Glenn V. Fuguitt Department of Rural Sociology and Center for Demography and Ecology University of Wisconsin-Madison Calvin L. Beale Economic Research Service U.S. Department of Agriculture CDE WP May 1995 Revised version of paper presented at the annual meeting of the Southern Demographic Association, Atlanta, GA, October, Support for this research was provided by the College of Agricultural and Life Sciences, University of Wisconsin-Madison, and the Rural Economy Division, Economic Research Service, through a cooperative agreement, and by the Center for Demography and Ecology, University of Wisconsin-Madison, through a grant from the Center for Population Research of the National Institute for Child Health and Human Development (P30 HD05876). The authors wish to thank John Fulton and Richard Gibson who assisted in the analysis, and Denise Sutton who prepared the manuscript.
3 RECENT TRENDS IN NONMETROPOLITAN MIGRATION: TOWARD A NEW TURNAROUND? ABSTRACT Over the past 30 years there have been three unanticipated shifts in metropolitannonmetropolitan population change and migration: the nonmetropolitan turnaround of the 1970s, with a migration balance favoring nonmetropolitan areas; the downturn of the early 1980s when nonmetropolitan areas lost net migrants as they did in the 1960s, and a more recent post-1990 recovery, with nonmetropolitan net migration rates once again above those of metropolitan areas. We have examined these changes since 1970 using annual estimates of net migration, considering the changing metropolitan-nonmetropolitan differential, and differences across geographic and functional county types in nonmetropolitan areas. Some geographic and functional differences stand out across the 24-year period, for example, slower growth or outright loss in the farm belt and faster growth in retirement counties. Yet the most notable finding is the widespread nature of the turnaround, the reversal, and the current recovery. There are differences between the present and the 1970s, but a trend toward greater retention and/or acquisition of people in rural and small town areas is clear. 1
4 RECENT TRENDS IN NONMETROPOLITAN MIGRATION: TOWARD A NEW TURNAROUND? Over the past 30 years there have been three unanticipated shifts in the pattern of population change for rural and small town areas. In sharp contrast to previous decades, the "nonmetropolitan turnaround" of the late 1960s and 1970s was a period of renewed and widespread nonmetropolitan population growth and migration gain, which overall was at a higher level than that of metropolitan areas. Although much research was stimulated by this new trend, almost none of it anticipated the second change in the early 1980s, during which nonmetro growth slowed considerably, shifted to decline in many areas, and the migration balance once more favored metropolitan areas (Fuguitt, 1985; Beale, 1988; Albrecht, 1993; Johnson, 1993). Again it became common to make pessimistic predictions concerning the future of rural America, and based on most available evidence through 1990, to conclude that the turnaround was an interlude rather than the beginning of a new era (for example, Barkley, 1993; Frey, 1995). By the second half of the 1980s, however, annual county population estimates suggested a counter-trend (Beale and Fuguitt 1990). Stronger evidence since then, from both county estimates and the March Current Population Survey series, indicates that nonmetro growth has rebounded since the middle 1980s, so that by 1992 U.S. metro and nonmetro net migration rates had become about equivalent (Hansen 1993; Johnson and Beale 1994). The purpose of this paper is to provide an overview of nonmetropolitan trends in net migration across these three shifts since 1970, based on annual estimates of net migration between 1970 and It is now widely recognized that nonmetropolitan America is a very diverse entity. Nonmetropolitan is not synonymous with rural, and it is far from being coextensive with 2
5 farming or other extractive activities. There have always been important social and economic interrelations between metropolitan and nonmetropolitan areas which are reflected in nonmetropolitan locational differences. Many nonmetro counties specialize in one or another work activity. More broadly, economic specialization, settlement history, and cultural differences have made it possible to distinguish geographic subregions having distinctive nonmetro social and economic attributes. Accordingly, after a simple metro-nonmetro comparison of net migration trends over the period, we will distinguish nonmetro counties classed by nearness to metro areas and level of local urbanization. Then we will consider net migration trends for counties grouped by specialization, and finally trends for a delineation of geographic subregions that encompass the nation. Since the data series begins in 1970, we will focus on and compare the turnaround period (approximately ) with the succeeding downturn (approximately ) and the most recent and current upturn ( ). The demonstration of similarities and differences between these periods should help to improve our understanding of recent trends, and aid in speculations concerning the next period of metro-nonmetro migration and population redistribution. The results of this work also should provide a foundation for more intensive research on this topic based on alternative data, such as gross migration by the characteristics of movers and nonmovers. Data and Procedures In addition to county population data from the censuses of 1970, 1980 and 1990, we have utilized annual estimates of county population from the Federal-State Cooperative program made available by the U.S. Census. 1 The Bureau also provided a series of annual births and deaths by counties for the 24-year period, and we estimated net migration by the residual method. The resulting annualized rates per 1000 may, of course, be considered only 3
6 approximate, but they should nevertheless provide appropriate information for comparative purposes. A constant 1993 metropolitan-nonmetropolitan county designation is used throughout this analysis. Since periodic reclassification largely moves the more rapidly growing nonmetro counties into the metro category, using the most recent designation is conservative in terms of nonmetro growth, and biases the results in favor of more rapid growth (and net migration gain) in metro areas. The Trend in Metropolitan-Nonmetropolitan Net Migration The three periods of metro-nonmetro migration are clearly seen in Figure 1. From through nonmetro rates were above metropolitan, and this pattern is the hallmark of the turnaround era. (The puzzling nonmetro downturn between 1972 and 1974 was especially characteristic of mining counties, although mining jobs were increasing at the time.) From through , in contrast, there was an unbroken decline in the level of nonmetro migration, which became negative overall after Then, following the nonmetro net migration rates increased in an unbroken series, became positive after 1991, and again exceeded the metro rate by Metropolitan rates do not vary as widely as nonmetro rates, which is not surprising given that the nation's population is three-quarters metropolitan. One would expect a complementary relation between metro and nonmetro rates, since net migration loss in one should lead to gain in the other, net of the effect of international migration. Note that the lowest level of metro net migration was , the year of the highest nonmetro rate, and conversely the second highest level for metro areas was in , the year of the lowest level for nonmetro areas. Since , metro net migration rates have declined over most years, just as nonmetro rates have increased. 4
7 Although all cities do not grow, there are important reasons to associate urbanization with growth and net migration gain in nonmetro America. Many counties adjacent to metro areas are part of the process of deconcentration around large cities, and many, though by no means all, middle-sized nonmetro cities grow and deconcentrate in their own right. As a consequence, with each reclassification of counties as metropolitan, many of the most rapidly growing nonmetro counties are shifted to metropolitan status, either as new metropolitan areas or as fringe counties of existing metro areas. Since economic diversity is associated with urban activity, remote, completely rural nonmetro counties tend to be specialized in extractive economic activities, which generally have suffered protracted declines in employment demand. Consequently, one would expect a nonmetro growth hierarchy associated with degree of identification with urban activity. Yet over the entire period, this was strictly true for only a few years in the 1980s, according to Figure 2. (Here, nonmetro counties are classed as adjacent to a metro area, nonadjacent with urban population, or nonadjacent rural.) That this expectation was not met in the 1970s is a major reason why there was so much interest and research activity during the turnaround period. As shown in this figure, all nonmetro categories were above metropolitan in net inmigration from 1970 through It is rather remarkable that even nonadjacent, completely rural counties had a higher rate of net migration gain than metro counties in that time. Adjacent counties remained above metropolitan for two more years, but by were posting slight net outmigration which continued until the late 1980s. This figure shows that the downturn of the 1980s particularly affected the nonadjacent counties. Consequently, by there was a strong regular net migration hierarchy which continued through most of this decade, with non-adjacent rural showing the lowest level of retention, followed by nonadjacent urban, adjacent, and metropolitan counties. 5
8 Conversely, this means that the subsequent recovery of the late 1980s was strongest in the two groups of nonadjacent counties, as the residence groups came together. This convergence was almost complete by the 1990s, and is distinctive in that all residence categories had virtually identical levels of positive nonmetro net migration gain. The last two years of this graph show an interesting pattern that is similar to the early 1970s. Not only are all nonmetro residence groups above metro (this had not occurred since ), but the migration rate for the rural nonadjacent category is almost identical to that for the adjacent counties, and is notably above that for the urban nonadjacent counties. Together this shows that between 1992 and 1994 we have had a deconcentrating pattern extending to the bottom of the urban hierarchy. Just as nonmetropolitan counties are gaining more through migration than metropolitan counties in this most recent period, so in more remote settings completely rural counties have rates above those counties which include small cities. Range of Growth by County Type A second way to show the diversity of nonmetro America is to consider counties grouped by dominant socioeconomic character 2. We have distinguished commuting counties, (those with more than 15 percent of their workers commuting to metropolitan central counties), and counties specializing in one of three major economic functions as determined by the U.S. Department of Agriculture (retirement, manufacturing, and farming). Finally, we consider persistent poverty counties, which have had more than 20 percent of their residents in poverty in each census since Retirement counties, though leading the way in migration gain during the turnaround, were substantially affected by adverse economic, interest rate, and real estate sector conditions in the first half of the 1980s (Figure 3a). Nevertheless, they managed in every year to retain positive net migration and to grow more rapidly than other types of areas. After the net migration rate for retirement counties 6
9 increased each year, and by had reached 1.7 percent. This is still below the rates for each year in the 1970s, however, when the peak influx occurred. A number of these counties are also general recreation areas. For the most part the trends for retirement areas are mirrored by those in counties with high rates of commuting to metro areas, but at a lower level. During the early 1980s, these counties had essentially zero net migration. Subsequently the annual rate moved higher, and by the 1990s had reached the levels of the late 1970s, at close to one percent. Manufacturing areas contain too much of the nonmetro population to swing very high or low in migration rates, but the overall configuration is very similar to commuting and retirement counties. A span of 10 unbroken years of outmovement ended in These counties, however, had economic growth mostly outside of manufacturing, their dominant industrial sector (Cook and Mizer, 1994). Farming dependent counties increased their overall net migration rate erratically after , gaining over the year proceeding in five of eight years. From 1991 through 1994, however, these counties were again gaining more migrants than they lost, a situation not seen since After an intensive boom period in the middle 1970s, mining areas were the most severely affected by economic conditions of the 1980s. At their nadir, in , they lost three percent of their population by net outmigration in one year. Their demographic recovery was substantial in each succeeding year through , yet mining employment in the United States has continued to sag. In most mining counties the recent equilibrium between in and out migration can only be attributed to growth in other sectors of the local economy. In some, much growth of recreation business is present. One of the most interesting timelines of migration rates is that for counties of 7
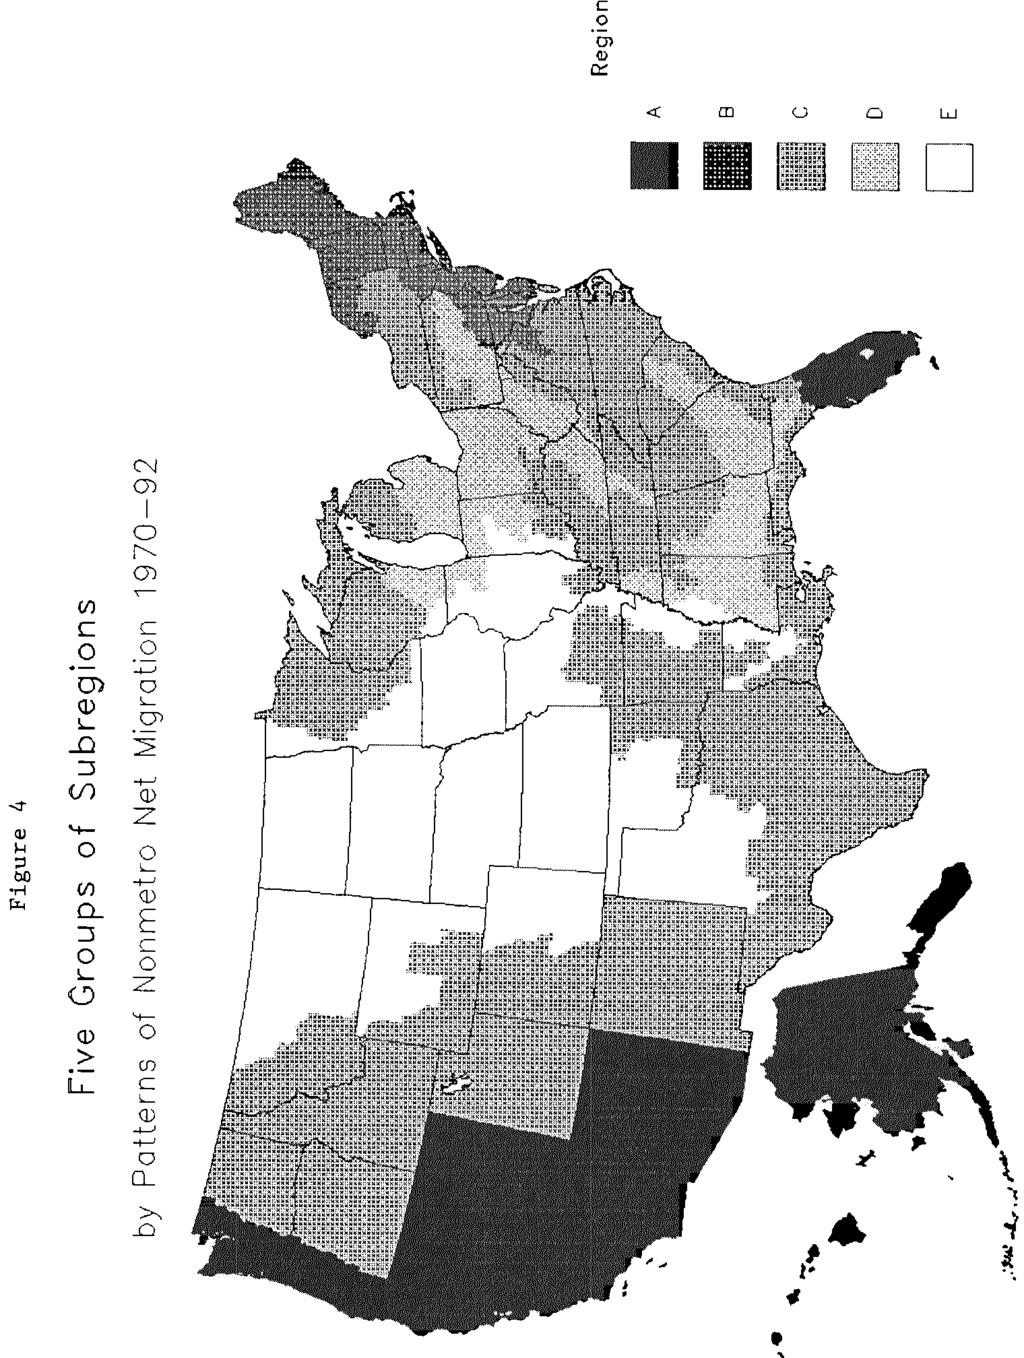
10 persistently high poverty (Figure 3b). These areas, which are largely a mixture of Southern Highlands, racially Black areas of the South, and Indian and Hispanic areas of the West and Great Plains, peaked in their net inmigration rate with the rest of nonmetropolitan America in , shifted to outmovement at the close of the decade, but failed to have any onset of recovery in the mid-1980s. Rather, outmovement did not reach its greatest extent until , four years later than the rest of the country. Then the shift to a higher degree of population retention in is so large, abrupt, and unrelated to any known events in these counties as to cast some doubt on the full validity of its size. Perhaps this class of counties is the one most affected by the change in the Census Bureau's estimation method after 1990 to complete reliance on IRS administrative records. However, the indicated further upward shift in rates from through cannot be accounted for by such a circumstance. Subregional Trends As a means of looking at the geographic variation in recent nonmetro population change, we compared 26 subregions covering the entire United States. This delineation, prepared some years ago for an earlier paper, groups together counties of reasonably similar social and economic characteristics and is not dependent on state boundaries. (For a more detailed discussion, see Fuguitt and Beale, 1978.) We have abridged the results here by grouping the subregions into five patterns of change in net migration (groups A through E), shown in the map which is Figure 4, with net migration patterns given in Figures 5a and 5b. Groups A and B have the highest net inmigration rates overall, but contrast markedly with C, D, and E in that they have not participated in the rebound of population inmovement or diminished loss in the late 1980s that has characterized the rest of the country. Group A consists of subregions that had net inmovement every year in both the 1970s and 1980s. Yet 8
11 despite this record and increasingly rapid inmovement from 1985 to 1990, their growth from migration has turned down since These areas are found in the Southwest, the Northern Pacific Coast and the Florida Peninsula. The well-publicized economic turn-down in many of these sections of the country after 1990, especially in California, may be the major factor producing a trend counter to the national one. Group B is comprised of Northern New England and the nonmetro areas that are interstitial or adjacent to the Northeastern Metropolitan Belt. Here can be seen a pattern of rising inmovement in the 1980s until 1988 that was quite counter-cyclical to what was happening in most of the rest of the country. But after 1988, inmovement steadily slackened until it was barely positive in This is consistent with the serious economic slump that affected New York and all of New England by By 1994, the net inmigration rate for group B had fallen marginally below that of Groups D and E in Figure 5b, groups that had experienced net outmovement all through the 1980s. Group C has the most common trend, being negative in migration during part of the 1980s, but positive by 1991 (see Figure 5b). Half of the 26 subregions conform to this pattern, including much of the South, the Rockies, and Rio Grande areas, plus the Upper Great Lakes. The largest shift in trend for any subregion since the time of greatest outmovement in the mid-1980s has occurred in the Rocky Mountains, Mormon Valleys, and Columbia Basin subregion within this group. In the first part of the decade, the collapse of boom-level mining employment led to major outmovement, but from to there was a steady demographic recovery from 1.5 percent annual net outmigration to 1.9 percent net inmovement. The source of this growth is not revived mining work, however, but is more linked to service jobs. Four subregions that displayed net outmigration throughout the 1980s have apparently 9
12 moved to modest immigration since 1990 (Group D). They are somewhat disparate, represented by the Lower Great Lakes Industrial subregion, the Northern and Southern Appalachian Coal Fields, and the old Cotton Belt of the Southern Coastal Plain. Their pattern is nearly that of the nonmetropolitan U.S. as a whole, which saw outmigration in every year of the 1980s, except for (refer to Figure 1). In Group E, which encompasses the Great Plains (both north and south), the Corn Belt and the Mississippi Delta, net inmigration occurred only briefly and minimally during the peak of the 1970s turnaround. Every year from through saw outmovement, more so than any other subregion type. Yet the trend of population retention has been upward since the depth of the farm crisis in 1986 until migration rates shifted to a slight net inmovement by Decline in Natural Increase We noted in a previous paper (Beale and Fuguitt, 1990) how the gap in the metro and nonmetro rates of natural increase had steadily widened throughout the 1980s in contrast with a pattern of some closure that characterized the 1970's (Figure 6). In the six years since that study there has been a little further widening, until by the rate of growth from excess of births over deaths in metro America was more than double that in nonmetro areas (.74 vs..32). The major change in nonmetro natural increase derives from declining birth rates, which in turn seem affected both by declining fertility and advancing age structure. For several years now, the expected completed childbearing of nonmetro women years has been no higher than that of metro women, as measured by the Census Bureau's inquiries on births to date and expected future births. In 1992 both metro and nonmetro women estimated 210 completed births per 100 women (Bachu, 1993). Higher nonmetro crude death rates, associated with an increasingly older population structure, also 10
13 add to the lower nonmetro natural increase, but falling nonmetro fertility has been the dynamic variable in the last decade. The metro population now has a distinct capacity to grow at a faster rate than that in nonmetro areas independently of migration, in a manner that was not true at the beginning of the 1980s. Conclusion Following a substantial downturn through the first half of the 1980s, the subsequent increase in rates of net migration yielded a pattern of nonmetro change that by 1990 was distinctly intermediate between those of the 1970s and 1980s. Many kinds of counties in varied parts of the country have had a modest to substantial amount of inmovement or improved retention in rural and small town places, but without yet attaining a population growth rate as high as metro places. Data on both employment and income provide supportive evidence. From , nonmetro employment rose by 6.6 percent, while metro jobs grew by 3.1 percent -- a significant nonmetro advantage present in each of the four post-1990 years, and unheard of during the 1980s (Economic Research Service, 1994). Now the Census Bureau reports that median household income (in 1993 dollars) fell by 2.9 percent from in nonmetro areas, but by 8.1 percent in metro areas (U.S. Bureau of the Census, 1994). In the collective sense, there has been no economic advantage to moving into metro areas from other places as yet in this decade. So despite the reduced level of potential growth from natural increase, nonmetro America has seen a recovery in its ability to retain or attract people that can be identified as originating by 1987 and persisting through 1994, the most recent data period. Are we in the midst of a new turnaround? More fundamentally, was the aberrant period in recent redistribution patterns during the turnaround, or in the years immediately following? Given the difficulty most everyone has had in predicting changes in metro- 11
14 nonmetro growth patterns, we are understandably reluctant to make an assertion. There are, however, a number of differences between the present period and the turnaround era, and a number of unanswered questions. Most explanations of the 1970s turnaround include (1) the period effects that led to booms in major rural extractive industries, (2) regional restructuring that led to loss of jobs, especially in manufacturing, in major metro areas, and supported a deconcentration of industrial activity into many nonmetro areas, and (3) technological and social trends supporting a more deconcentrated settlement for jobs and residences, coupled with the preferences many people hold for low density living. Today, there is no boom in extractive activities, although there has been some improvement in their economic conditions, particularly in commercial farming since the end of the farm crisis in the early 1980s. Post-1985 upturns in Western mining areas may well be associated with the recreation potential of many of these counties, rather than mining. Continued restructuring and movement to a world market led to a decline in manufacturing in nonmetro areas by the early 1980s, and we found that the renewed growth in the late 1980s and early 1990s in counties dependent on manufacturing was not primarily associated with an increase in manufacturing jobs. The deconcentration of population to counties with amenities, and to counties peripheral to metro areas continued throughout the 1980s but the upturns beginning in the late 1980s result in net migration rates still below those of the turnaround era. There has been much interest in the possible relaxation of locational requirements through technology and organization of work, particularly for service industries through advances in telecommunication (Dillman, 1991). By all accounts, telecommunication is still largely a potential for nonmetro economic growth, although anecdotal evidence of its adoption seems to mount. Also, it is not clear whether new ways of producing goods require greater rather than less mutual access, and greater integration with the world economy means 12
15 that those activities that can be done remotely can often be done in foreign settings at lower costs. One of our findings supporting a renewed turnaround is the widespread nature of the post-1985 trend. Indeed the convergence of many lines in the figures seems remarkable. Although we don't have comparable data for a time just before the turnaround began (it was well underway by 1970), the increased growth and rates of net migration across most types of nonmetro counties during the turnaround has been widely noted. This raises the intriguing question of whether the widespread nature of the new growth in both eras is due entirely to a coincidence of varied reasons for different types of areas, or whether there is an underlying demographic or socioeconomic factor affecting all areas. On the other hand, the recent increased differential between metro and nonmetro natural increase is undoubtedly slowing nonmetro population growth in a way that was not true in the 1970s, even though rates of net migration may be increasing. This may help to explain why some correspondents have been puzzled about recent findings as inconsistent with the perceived negative situation in local communities in their area. (Others, however, have reported evidence of growth.) Perhaps a more important difference, not covered in this analysis, is found by comparing the 1987 with the 1993 March Current Population Surveys. 3 We found that the recent increase in net migration for nonmetro areas is primarily due to a decline in outmigration, whereas earlier work showed that the 1970s turnaround was more due to increased movement into nonmetro areas (Tucker, 1976). Thus, as we suggest above, the most recent period of increased retention could be based more on a lack of attractive alternative opportunities in metropolitan areas than on an improved economic circumstance in nonmetro areas, though both have been present. Although much was made of the noneconomic bases of the turnaround, to understand 13
16 the present change and where it fits in what has been a succession of demographic surprises, we need to better relate population trends to employment and industry trends in both metro and nonmetro areas. Recognizing that migration is the main force driving population redistribution today, we should move beyond net rates to consider migration streams, and focus on both metro and nonmetro areas as origins and destinations of these streams, taking into account also international migration. In this paper we have demonstrated that something new is happening in metrononmetro population redistribution. If the turnaround of the 1970s was an aberration, here is another one. It is always possible that it will not mature further in terms of population or migration rates, and we have shown a number of differences from the last time. But we need to understand that the current "rebound" in U.S. nonmetro population retention and/or growth is very real and widespread, and recognize it as a major component of the continuing social and economic changes taking place in metropolitan and nonmetropolitan America today. 14
17 Notes 1. Following the censuses of 1970 and 1980, the Bureau adjusted the Federal-State Cooperative estimates for each year of the prior decade to be consistent with the census results. Estimates for 1991 through 1994 are based on the 1990 census, and utilize only data from IRS administrative record series. We find that migration rates for , however, although somewhat higher than expected, generally follow the trend begun in the middle 1980s of increasing levels of net migration in each succeeding year. Johnson and Beale (1994), moreover, compared the post-1990 Federal-State Cooperative estimates with independent state-generated estimates, available for more than one-third of the nonmetro counties. They found the results of the two sources to be consistent in terms of growth and decline in 75 percent of the cases. 2. Commuting counties were those with more than 15 percent of their workers commuting to central counties of metropolitan areas in The USDA classification of retirement counties included those that, for the period, had net inmigration rates for people aged 60 and over of 15 percent or more of the expected 1980 population 60 and over. Agricultural, or farming dependent counties, and mining dependent counties were those in which the industry contributed a weighted average of 20 percent or more of total labor and proprietor income over the five years from and in manufacturing dependent counties manufacturing contributed at least 30 percent of labor and proprietor income over the same period (Cook and Hady, 1993). Persistent poverty counties had more than 20 percent of their residents in poverty for the 1960 and all subsequent censuses through Although there is some overlap in the classification, we do not consider this a serious problem among the county functions. Results using nonoverlapping procedures, as classing 15
18 counties first as commuting or not, then all others as retirement or not, then manufacturing or not, etc., are almost identical with those allowing overlaps. Almost one-fourth of the nonmetro counties fell in none of these groups, and thus are not included in the type-ofcounty analysis. 3. Between 1987 and 1993 the nonmetro net migration rate shifted from -.92 to.54, for an increase of This was due to an increase in the inmigration rate of.18, from 3.11 to 3.29, and a decline in the outmigration rate of 1.28, from 4.03 to Similar results are obtained comparing 1986 and
19 References Albrecht, D. E The Renewal of Population Loss in the +Nonmetropolitan Great Plains. Rural Sociology 58: Bachu, A Fertility of American Women: June Current Population Reports Population Characteristics P Washington: U.S. Bureau of the Census. Barkley, D. L Introduction. Pp. 1-8 in David L. Barkley (ed) Economic Adaptation Alternatives for Nonmetropolitan Areas. Boulder: Westview Press. Beale, C. L Americans Headed for the Cities Once Again. Rural Development Perspectives 4(3):2-6 Beale, C. L. and G. V. Fuguitt Decade of Pessimistic Nonmetro Trends Ends on Optimistic Note. Rural Development Perspectives 6(3): Cook, P. J. and K. L. Mizer The Revised ERS County Typology. Economic Research Service, USDA, Rural Development Research Report No. 89. Cook, P. J. and T. F. Hady Updating the ERS County Typology: A View from the 1980's. Agriculture and Rural Economy Division, Economic Research Service, USDA. Staff Report No. AGES9327. Dillman, D Telematics and Rural Development. Pp in Cornelia B. Flora and James A. Christianson (eds.) Rural Policies for the 1990s. Boulder: Westview Press. Economic Research Service Rural Conditions and Trends. Vol. 5, No. 1. (U.S. Department of Agriculture). Frey, W. H The New Geography of U.S. Population Shifts: Trends Toward Balkanization. Forthcoming in Reynolds Farley (ed.) State of the Union America in the 1990s, Volume II: Social Trends. New York: Russell Sage. 17
20 Fuguitt, G. V The Nonmetropolitan Population Turnaround. Annual Review of Sociology 11: Fuguitt, G. V. and C. L. Beale Population Trends of Nonmetropolitan Cities and Villages in Subregions of the United States. Demography 15: Hansen, K Geographic Mobility March 1991 to March Current Population Reports Population Characteristics P Washington: U.S. Bureau of the Census. Johnson, K Demographic Change in Nonmetropolitan America, Rural Sociology 58: Johnson, K. and C. L. Beale The Recent Revival of Widespread Population Growth in Nonmetropolitan Areas of the United States. Rural Sociology 59: Tucker, C. J Changing Patterns of Migration between Metropolitan and Nonmetropolitan Areas in the United States: Recent Evidence. Demography 13: U.S. Bureau of the Census Income, Poverty and Valuation of Noncash Benefits. Current Population Reports Consumer Income, P
21
22
23
24
25
26
27
28
29 Center for Demography and Ecology University of Wisconsin 1180 Observatory Drive Rm Madison, WI U.S.A. 608/ FAX 608/
Recent Demographic Trends in Nonmetropolitan America: First Evidence from the 2010 Census Executive Summary
 Recent Demographic Trends in Nonmetropolitan America: First Evidence from the 2010 Census Executive Summary Kenneth M. Johnson Department of Sociology and Carsey Institute University of New Hampshire This
Center for Demography and Ecology
 Center for Demography and Ecology University of Wisconsin-Madison Recent Population Trends in Nonmetropolitan Cities and Villages: From the Turnaround, Through Reversal to the Rebound Glenn V. Fuguitt
Rural America At A Glance
 Rural America At A Glance 7 Edition Between July 5 and July 6, the population of nonmetro America grew.6 percent. Net domestic migration from metro areas accounted for nearly half of this growth. Gains
Demographic Trends in Nonmetropolitan America: Implications for Land Use Development and Conservation.
 University of New Hampshire University of New Hampshire Scholars' Repository Sociology Scholarship Sociology 2013 Demographic Trends in Nonmetropolitan America: Implications for Land Use Development and
Extended Abstract. The Demographic Components of Growth and Diversity in New Hispanic Destinations
 Extended Abstract The Demographic Components of Growth and Diversity in New Hispanic Destinations Daniel T. Lichter Departments of Policy Analysis & Management and Sociology Cornell University Kenneth
Chapter 7. Migration
 Chapter 7 Migration Chapter 7 Migration Americans have traditionally been highly higher levels of educational attainment than Figure 7-1. mobile, with nearly 1 in 7 people changing residence each year.
Baby Boom Migration Tilts Toward Rural America
 Baby Boom Migration Tilts Toward Rural America VOLUME 7 ISSUE 3 John Cromartie jbc@ers.usda.gov Peter Nelson Middlebury College 16 AMBER WAVES The size and direction of migration patterns vary considerably
Hispanic Health Insurance Rates Differ between Established and New Hispanic Destinations
 Population Trends in Post-Recession Rural America A Publication Series of the W3001 Research Project Hispanic Health Insurance Rates Differ between and New Hispanic s Brief No. 02-16 August 2016 Shannon
Changing Times, Changing Enrollments: How Recent Demographic Trends are Affecting Enrollments in Portland Public Schools
 Portland State University PDXScholar School District Enrollment Forecast Reports Population Research Center 7-1-2000 Changing Times, Changing Enrollments: How Recent Demographic Trends are Affecting Enrollments
The movement of people into and out of a state can have important
 Migration in the Tenth District: Long-Term Trends and Current Developments By William R. Keeton and Geoffrey B. Newton The movement of people into and out of a state can have important implications for
8AMBER WAVES VOLUME 2 ISSUE 3
 8AMBER WAVES VOLUME 2 ISSUE 3 F E A T U R E William Kandel, USDA/ERS ECONOMIC RESEARCH SERVICE/USDA Rural s Employment and Residential Trends William Kandel wkandel@ers.usda.gov Constance Newman cnewman@ers.usda.gov
AMBER WAVES VOLUME 2 ISSUE 5
 VOLUME 2 ISSUE 5 20 Eyewire Anatomy of Nonmetro High-Poverty Areas Common in Plight, Distinctive in Nature Calvin L. Beale cbeale@ers.usda.gov FEBRUARY 2004 21 The 1990s saw growing U.S. prosperity, ending
Straddling the Great Divide: Migration and Population Change in the Great Plains and Rocky Mountains
 Online Journal of Rural Research & Policy Volume 3 Issue 3 Straddling the Great Divide: Migration and Population Change in the Great Plains and Rocky Mountains Article 1 2008 Straddling the Great Divide:
Regional Income Trends and Convergence
 Regional Income Trends and Convergence J. Fred Giertz and Shekhar Mehta Institute of Government and Public Affairs University of Illinois February 13, 1996.... This paper is one of a series associated
Low-Skill Jobs A Shrinking Share of the Rural Economy
 Low-Skill Jobs A Shrinking Share of the Rural Economy 38 Robert Gibbs rgibbs@ers.usda.gov Lorin Kusmin lkusmin@ers.usda.gov John Cromartie jbc@ers.usda.gov A signature feature of the 20th-century U.S.
Baby Boom Migration and Its Impact on Rural America
 United States Department of Agriculture Economic Research Service Economic Research Report Number 79 August 2009 Baby Boom Migration and Its Impact on Rural America John Cromartie and Peter Nelson Visit
Abstract. Acknowledgments
 Racial/Ethnic Minorities in Rural Areas: Progress and Stagnation, 1980-90. By Linda L. Swanson (ed.), Rural Economy Division, Economic Research Service, U.S. Department of Agriculture. Agricultural Economic
The Changing Faces of New England. Increasing Spatial and Racial Diversity
 Reports on New England The Changing Faces of New England Increasing Spatial and Racial Diversity Kenneth M. Johnson Building Knowledge for Families and Communities Reports on NEW ENGLAND Volume 1, Number
STRENGTHENING RURAL CANADA: Fewer & Older: Population and Demographic Crossroads in Rural Saskatchewan. An Executive Summary
 STRENGTHENING RURAL CANADA: Fewer & Older: Population and Demographic Crossroads in Rural Saskatchewan An Executive Summary This paper has been prepared for the Strengthening Rural Canada initiative by:
National Population Growth Declines as Domestic Migration Flows Rise
 National Population Growth Declines as Domestic Migration Flows Rise By William H. Frey U.S. population trends are showing something of a dual personality when viewed from the perspective of the nation
Shyam S. Bhatia and Kazimierz J. Zaniewski. Department of Geography. University of Wisconsin - Oshkosh
 POPULATION CHANGE IN WISCONSIN, 1980-1990 Shyam S. Bhatia and Kazimierz J. Zaniewski Department of Geography University of Wisconsin - Oshkosh During the 1980's Wisconsin experienced a slow growth in population.
Population Outlook for the Portland-Vancouver Metropolitan Region
 Portland State University PDXScholar Institute of Portland Metropolitan Studies Publications Institute of Portland Metropolitan Studies 2007 Population Outlook for the Portland-Vancouver Metropolitan Region
Characteristics of Poverty in Minnesota
 Characteristics of Poverty in Minnesota by Dennis A. Ahlburg P overty and rising inequality have often been seen as the necessary price of increased economic efficiency. In this view, a certain amount
Meanwhile, the foreign-born population accounted for the remaining 39 percent of the decline in household growth in
 3 Demographic Drivers Since the Great Recession, fewer young adults are forming new households and fewer immigrants are coming to the United States. As a result, the pace of household growth is unusually
The Changing Faces of New Hampshire. Recent Demographic Trends in the Granite State
 Reports on New England The Changing Faces of New Hampshire Recent Demographic Trends in the Granite State Kenneth M. Johnson Building Knowledge for Families and Communities Reports on NEW ENGLAND Volume
Pennsylvania Population on the Move:
 Center for Economic and Community Development Penn State University Park, PA December 2018 Pennsylvania Population on the Move: 2000-17 A Graphic Update 2000-17 Population Labor Force Household Income
CHOICES The magazine of food, farm and resource issues
 CHOICES The magazine of food, farm and resource issues 4th Quarter 2003 A publication of the American Agricultural Economics Association Rural Area Brain Drain: Is It a Reality? By Georgeanne Artz Brain
Demographic Data. Comprehensive Plan
 Comprehensive Plan 2010-2030 4 Demographic Data Population and demographics have changed over the past several decades in the City of Elwood. It is important to incorporate these shifts into the planning
Post-Secondary Education, Training and Labour September Profile of the New Brunswick Labour Force
 Post-Secondary Education, Training and Labour September 2018 Profile of the New Brunswick Labour Force Contents Population Trends... 2 Key Labour Force Statistics... 5 New Brunswick Overview... 5 Sub-Regional
SECTION 1. Demographic and Economic Profiles of California s Population
 SECTION 1 Demographic and Economic Profiles of s Population s population has special characteristics compared to the United States as a whole. Section 1 presents data on the size of the populations of
A COMPARISON OF ARIZONA TO NATIONS OF COMPARABLE SIZE
 A COMPARISON OF ARIZONA TO NATIONS OF COMPARABLE SIZE A Report from the Office of the University Economist July 2009 Dennis Hoffman, Ph.D. Professor of Economics, University Economist, and Director, L.
Refrain or Reality: A United States Rural Policy?
 Refrain or Reality: A United States Rural Policy? Presented to The Kansas Hospital Association 2003 Rural Health Symposium Wichita, Kansas March 11, 2003 Charles W. Fluharty, Director Rural Policy Research
RELATIONSHIP BETWEEN COMMUNITY SATISFACTION AND MIGRATION INTENTIONS OF RURAL NEBRASKANS
 University of Nebraska - Lincoln DigitalCommons@University of Nebraska - Lincoln Publications from the Center for Applied Rural Innovation (CARI) CARI: Center for Applied Rural Innovation March 2003 RELATIONSHIP
Trends and Changes Affecting Upstate New York. David L. Brown & Robin Blakely-Armitage State of Upstate Conference June 8, 2011
 Trends and Changes Affecting Upstate New York David L. Brown & Robin Blakely-Armitage State of Upstate Conference June 8, 2011 Challenges & Opportunities Change, not stability, is the normal situation
Chapter 4 North America
 Chapter 4 North America Identifying the Boundaries Figure 4.1 The geographic center of North America is located near Rugby, North Dakota. Notice the flags of Mexico, Canada, and the United States. Source:
REGIONAL. San Joaquin County Population Projection
 Lodi 12 EBERHARDT SCHOOL OF BUSINESS Business Forecasting Center in partnership with San Joaquin Council of Governments 99 26 5 205 Tracy 4 Lathrop Stockton 120 Manteca Ripon Escalon REGIONAL analyst june
The State of Rural Minnesota, 2019
 P.O. Box 3185 Mankato, MN 56002-3185 (507)934-7700 www.ruralmn.org The State of Rural Minnesota, 2019 January 2019 By Kelly Asche, Research Associate Each year, the Center for Rural Policy and Development
MIGRATION STATISTICS AND BRAIN DRAIN/GAIN
 MIGRATION STATISTICS AND BRAIN DRAIN/GAIN Nebraska State Data Center 25th Annual Data Users Conference 2:15 to 3:15 p.m., August 19, 2014 David Drozd Randy Cantrell UNO Center for Public Affairs Research
STRENGTHENING RURAL CANADA: Fewer & Older: The Coming Population and Demographic Challenges in Rural Newfoundland & Labrador
 STRENGTHENING RURAL CANADA: Fewer & Older: The Coming Population and Demographic Challenges in Rural Newfoundland & Labrador An Executive Summary 1 This paper has been prepared for the Strengthening Rural
BY Rakesh Kochhar FOR RELEASE MARCH 07, 2019 FOR MEDIA OR OTHER INQUIRIES:
 FOR RELEASE MARCH 07, 2019 BY Rakesh Kochhar FOR MEDIA OR OTHER INQUIRIES: Rakesh Kochhar, Senior Researcher Jessica Pumphrey, Communications Associate 202.419.4372 RECOMMENDED CITATION Pew Research Center,
3Demographic Drivers. The State of the Nation s Housing 2007
 3Demographic Drivers The demographic underpinnings of long-run housing demand remain solid. Net household growth should climb from an average 1.26 million annual pace in 1995 25 to 1.46 million in 25 215.
Demographics. Chapter 2 - Table of contents. Environmental Scan 2008
 Environmental Scan 2008 2 Ontario s population, and consequently its labour force, is aging rapidly. The province faces many challenges related to a falling birth rate, an aging population and a large
Hispanic Population Growth and Rural Income Inequality
 Hispanic Population and Rural Income Inequality Emilio Parrado, Department of Sociology, Duke University William Kandel, Economic Research Service, U.S. Department of Agriculture September 2006 Draft version:
Growth in the Foreign-Born Workforce and Employment of the Native Born
 Report August 10, 2006 Growth in the Foreign-Born Workforce and Employment of the Native Born Rakesh Kochhar Associate Director for Research, Pew Hispanic Center Rapid increases in the foreign-born population
What Lies Ahead: Population, Household and Employment Forecasts to 2040 April Metropolitan Council Forecasts to 2040
 The Metropolitan Council forecasts population, households and employment for the sevencounty Minneapolis-St. Paul region with a 30-year time horizon. The Council will allocate this regional forecast to
Chapter 5. Residential Mobility in the United States and the Great Recession: A Shift to Local Moves
 Chapter 5 Residential Mobility in the United States and the Great Recession: A Shift to Local Moves Michael A. Stoll A mericans are very mobile. Over the last three decades, the share of Americans who
Britain s Population Exceptionalism within the European Union
 Britain s Population Exceptionalism within the European Union Introduction The United Kingdom s rate of population growth far exceeds that of most other European countries. This is particularly problematic
Neighborhood Diversity Characteristics in Iowa and their Implications for Home Loans and Business Investment
 Economics Technical Reports and White Papers Economics 9-2008 Neighborhood Diversity Characteristics in Iowa and their Implications for Home Loans and Business Investment Liesl Eathington Iowa State University,
Post-Migration Commuting Behavior Among Urban to Rural Migrants in England and Wales. Tony Champion, Mike Coombes, and David L. Brown INTRODUCTION
 Post-Migration Commuting Behavior Among Urban to Rural Migrants in England and Wales By Tony Champion, Mike Coombes, and David L. Brown INTRODUCTION England and Wales have experienced continuous counterurbanization
Labor markets in the Tenth District are
 Will Tightness in Tenth District Labor Markets Result in Economic Slowdown? By Ricardo C. Gazel and Chad R. Wilkerson Labor markets in the Tenth District are tighter now than at any time in recent memory.
Summary of the U.S. Census Bureau s 2015 State-Level Population Estimate for Massachusetts
 Summary of the U.S. Census Bureau s 2015 State-Level Population Estimate for Massachusetts Prepared by: Population Estimates Program For Release December 22, 2015 On December 22, 2015, the U.S. Census
Using data provided by the U.S. Census Bureau, this study first recreates the Bureau s most recent population
 Backgrounder Center for Immigration Studies December 2012 Projecting Immigration s Impact on the Size and Age Structure of the 21st Century American Population By Steven A. Camarota Using data provided
Assessment of Demographic & Community Data Updates & Revisions
 Assessment of Demographic & Community Data Updates & Revisions Scott Langen, Director of Operations McNair Business Development Inc. P: 306-790-1894 F: 306-789-7630 E: slangen@mcnair.ca October 30, 2013
Metro Vancouver Backgrounder Metro 2040 Residential Growth Projections
 Metro Vancouver 2040 - Backgrounder Metro 2040 Residential Growth Projections Purpose Metro Vancouver 2040 Shaping our Future, Metro s draft regional growth strategy, was released for public review in
Demographic and Socioeconomic Change in Appalachia EMERGING PATTERNS OF POPULATION REDISTRIBUTION AND MIGRATION IN APPALACHIA
 Demographic and Socioeconomic Change in Appalachia EMERGING PATTERNS OF POPULATION REDISTRIBUTION AND MIGRATION IN APPALACHIA by Daniel T. Lichter, Jillian Garratt, Mary L. Marshall, and Michael Cardella
We know that the Latinx community still faces many challenges, in particular the unresolved immigration status of so many in our community.
 1 Ten years ago United Way issued a groundbreaking report on the state of the growing Latinx Community in Dane County. At that time Latinos were the fastest growing racial/ethnic group not only in Dane
GLASGOW: TRANSFORMATION CITY DISCUSSION PAPER
 GLASGOW: TRANSFORMATION CITY DISCUSSION PAPER Discussion Paper 1. INTRODUCTION 1.1. This paper provides background information to one of a set of three seminars to be held in November and December 2006.
PRESENT TRENDS IN POPULATION DISTRIBUTION
 PRESENT TRENDS IN POPULATION DISTRIBUTION Conrad Taeuber Associate Director, Bureau of the Census U.S. Department of Commerce Our population has recently crossed the 200 million mark, and we are currently
EMBARGOED UNTIL THURSDAY 9/5 AT 12:01 AM
 EMBARGOED UNTIL THURSDAY 9/5 AT 12:01 AM Poverty matters No. 1 It s now 50/50: chicago region poverty growth is A suburban story Nationwide, the number of people in poverty in the suburbs has now surpassed
Feature Articles. 11 Rural Labor Markets Often Lead Urban Markets in Recessions and Expansions by Karen S. Hamrick
 Feature Articles 2 Overcoming Persistent Poverty And Sinking Into It: Income Trends in Persistent-Poverty and Other High-Poverty Rural Counties, 1989-94 by Mark Nord 11 Rural Labor Markets Often Lead Urban
MIGRATION CHALLENGES
 MIGRATION CHALLENGES Trends in People s Movement to and from the Milwaukee Area and Wisconsin Illuminate Important Issues By John D. Johnson and Charles Franklin Marquette Law School launched the Lubar
Methodology and Assumptions for the Mapping America s Futures Project
 UNDERSTANDING AND EXPLORING DEMOGRAPHIC CHANGE MAPPING AMERICA S FUTURES, BRIEF 5 Methodology and Assumptions for the Mapping America s Futures Project Kaitlin Franks Hildner, Austin Nichols, and Steven
Migration Patterns in The Northern Great Plains
 Migration Patterns in The Northern Great Plains Eugene P. Lewis Economic conditions in this nation and throughout the world are imposing external pressures on the Northern Great Plains Region' through
Population Vitality Overview
 8 Population Vitality Overview Population Vitality Overview The Population Vitality section covers information on total population, migration, age, household size, and race. In particular, the Population
Research. Research Brief RP04-1 March What the Research says about Spatial Variations in Factors Affecting Poverty
 Rural Poverty Research Center Research Brief RP04-1 March 2004 What the Research says about Spatial Variations in Factors Affecting Poverty Jane M. Mosley and Kathleen K. Miller 1 RUPRI Rural Poverty Research
PROJECTING THE LABOUR SUPPLY TO 2024
 PROJECTING THE LABOUR SUPPLY TO 2024 Charles Simkins Helen Suzman Professor of Political Economy School of Economic and Business Sciences University of the Witwatersrand May 2008 centre for poverty employment
Minorities in Rural America
 Minorities in Rural America South Carolina Rural Health Research Center Department of Health Administration Norman J. Arnold School of Public Health University of South Carolina Columbia, SC 29203 Michael
A Snapshot of Current Population Issues in the Northern Territory
 Research Brief Issue RB06, 2016 A Snapshot of Current Population Issues in the Northern Territory Dr. Andrew Taylor Dr. Tom Wilson Demography and Growth Planning, Northern Institute andrew.taylor@cdu.edu.au
DRIVERS OF DEMOGRAPHIC CHANGE AND HOW THEY AFFECT THE PROVISION OF EDUCATION
 DRIVERS OF DEMOGRAPHIC CHANGE AND HOW THEY AFFECT THE PROVISION OF EDUCATION This paper provides an overview of the different demographic drivers that determine population trends. It explains how the demographic
Housing Portland s Families A Background Report for a Workshop in Portland, Oregon, July 26, 2001, Sponsored by the National Housing Conference
 Housing Portland s Families A Background Report for a Workshop in Portland, Oregon, July 26, 2001, Sponsored by the National Housing Conference by Barry Edmonston and Risa Proehl Housing Portland s Families
Trends in the Racial Distribution of Wisconsin Poverty, This report is the second in a series of briefings on the results.
 Briefing 2 Trends in the Racial Distribution of Wisconsin Poverty, 1970-2000 Katherine J. Curtis, Heather O Connell This report is the second in a series of briefings on the results of recent research
Regional Trends in the Domestic Migration of Minnesota s Young People
 HOUSE RESEARCH & STATE DEMOGRAPHIC CENTER A Changing Minnesota Sean Williams, House Research Susan Brower, Minnesota State Demographic Center September 2018 Regional Trends in the Domestic Migration of
STRENGTHENING RURAL CANADA: Fewer & Older: The Coming Demographic Crisis in Rural Ontario
 STRENGTHENING RURAL CANADA: Fewer & Older: The Coming Demographic Crisis in Rural Ontario An Executive Summary 1 This paper has been prepared for the Strengthening Rural Canada initiative by: Dr. Bakhtiar
Racial integration between black and white people is at highest level for a century, new U.S. census reveals
 Thursday, Dec 16 2010 Racial integration between black and white people is at highest level for a century, new U.S. census reveals By Daily Mail Reporter Last updated at 1:11 PM on 16th December 2010 But
By the year 2100 the U.S. current 275 million
 A Faulty Demographic Road Map to the Future by B. Meredith Burke By the year 2100 the U.S. current 275 million population will most likely be a) 275 million; b) 571 million; c) 1.2 billion; d) somewhere
People. Population size and growth
 The social report monitors outcomes for the New Zealand population. This section provides background information on who those people are, and provides a context for the indicators that follow. People Population
Patrick Adler and Chris Tilly Institute for Research on Labor and Employment, UCLA. Ben Zipperer University of Massachusetts, Amherst
 THE STATE OF THE UNIONS IN 2013 A PROFILE OF UNION MEMBERSHIP IN LOS ANGELES, CALIFORNIA AND THE NATION 1 Patrick Adler and Chris Tilly Institute for Research on Labor and Employment, UCLA Ben Zipperer
Successful Adjustment to Economic Restructuring in the Nonmetro Northeast: by Stephen M. Smith and Kathleen Miller October, 2002
 Successful Adjustment to Economic Restructuring in the Nonmetro Northeast: 1950-1990 by Stephen M. Smith and Kathleen Miller October, 2002 Rural Development Paper No. 13 2002 The Northeast Regional Center
RACE, RESIDENCE, AND UNDEREMPLOYMENT: 50 YEARS IN COMPARATIVE PERSPECTIVE,
 RACE, RESIDENCE, AND UNDEREMPLOYMENT: 50 YEARS IN COMPARATIVE PERSPECTIVE, 1964-2017 Tim Slack, Louisiana State University Brian C. Thiede, Penn State University Leif Jensen, Penn State University Submitted
Riverside Labor Analysis. November 2018
 November 2018 The City of Labor Market Dynamics and Local Cost of Living Analysis Executive Summary The City of is located in one of the fastest growing parts of California. Over the period 2005-2016,
A Profile of CANADiAN WoMeN. NorTHerN CoMMuNiTieS
 A Profile of CANADiAN WoMeN in rural, remote AND NorTHerN CoMMuNiTieS DeMogrAPHiC Profile in 2006, the last census year for which data are currently available, approximately 2.8 million women resided in
POPULATION STUDIES RESEARCH BRIEF ISSUE Number
 POPULATION STUDIES RESEARCH BRIEF ISSUE Number 2008021 School for Social and Policy Research 2008 Population Studies Group School for Social and Policy Research Charles Darwin University Northern Territory
UNIVERSITY OF AGRICULTURE AT UR3ANA-CHAMPAIGN ILLINOIS LIBRARY
 UNIVERSITY OF ILLINOIS LIBRARY AT UR3ANA-CHAMPAIGN AGRICULTURE AGRICIMTIW HftRAfc) DEC 1 i 1989 MWiu'-wcii* -it These staff papers are published at the discretion of their authors who are solely responsible
Reverse Migration and Nonmetropolitan Employment in Four Great Plains States,
 University of Nebraska at Omaha DigitalCommons@UNO Sociology and Anthropology Faculty Publications Department of Sociology and Anthropology 2003 Reverse Migration and Nonmetropolitan Employment in Four
DETERMINANTS OF NET MIGRATION IN MONTANA
 University of Nebraska - Lincoln DigitalCommons@University of Nebraska - Lincoln Great Plains Research: A Journal of Natural and Social Sciences Great Plains Studies, Center for 2010 DETERMINANTS OF NET
Population change in Louisiana,
 Louisiana State University LSU Digital Commons LSU Agricultural Experiment Station Reports LSU AgCenter 1977 Population change in Louisiana, 1970-1975 Lisandro Perez Follow this and additional works at:
The Great Black Migration: Opportunity and competition in northern labor markets
 The Great Black Migration: Opportunity and competition in northern labor markets Leah Platt Boustan Leah Platt Boustan is Associate Professor of Economics at the University of California, Los Angeles.
New Brunswick Population Snapshot
 New Brunswick Population Snapshot 1 Project Info Project Title POPULATION DYNAMICS FOR SMALL AREAS AND RURAL COMMUNITIES Principle Investigator Paul Peters, Departments of Sociology and Economics, University
OREGON OUTLOOK Sponsored by Population Research Center Portland Multnomah Progress Board Oregon Progress Board
 REGN TATE ERIE APRIL 003 PPULATIN REEARCH CENTER REGN s MAJR PPULATIN TREND This report reviews Population Growth Household Trends Household ize Families and Non-families Implications Future Reports Metropolitan
Colorado Population Estimates Eddie Hunsinger 2010 State Demography Office Meeting
 Colorado Population Estimates Eddie Hunsinger 2010 State Demography Office Meeting What I ll cover this morning -I ll start with a brief overview of the data that we offer, and how we prepare that data
Human Population Growth Through Time
 Human Population Growth Through Time Current world population: 7.35 Billion (Nov. 2016) http://www.worldometers.info/world-population/ 2012 7 billion 1999 13 years 12 years 1974 1927 1804 13 years 14 years
LEFT BEHIND: WORKERS AND THEIR FAMILIES IN A CHANGING LOS ANGELES. Revised September 27, A Publication of the California Budget Project
 S P E C I A L R E P O R T LEFT BEHIND: WORKERS AND THEIR FAMILIES IN A CHANGING LOS ANGELES Revised September 27, 2006 A Publication of the Budget Project Acknowledgments Alissa Anderson Garcia prepared
Part 1: Focus on Income. Inequality. EMBARGOED until 5/28/14. indicator definitions and Rankings
 Part 1: Focus on Income indicator definitions and Rankings Inequality STATE OF NEW YORK CITY S HOUSING & NEIGHBORHOODS IN 2013 7 Focus on Income Inequality New York City has seen rising levels of income
Population and Dwelling Counts
 Release 1 Population and Dwelling Counts Population Counts Quick Facts In 2016, Conception Bay South had a population of 26,199, representing a percentage change of 5.4% from 2011. This compares to the
Rural Manitoba Profile:
 Rural Manitoba Profile: A Ten-year Census Analysis (1991 2001) Prepared by Jennifer de Peuter, MA and Marianne Sorensen, PhD of Tandem Social Research Consulting with contributions by Ray Bollman, Jean
MAGNET Migration and Governance Network An initiative of the Swiss Development Cooperation
 International Labour Organization ILO Regional Office for the Arab States MAGNET Migration and Governance Network An initiative of the Swiss Development Cooperation The Kuwaiti Labour Market and Foreign
Le Sueur County Demographic & Economic Profile Prepared on 7/12/2018
 Le Sueur County Demographic & Economic Profile Prepared on 7/12/2018 Prepared by: Mark Schultz Regional Labor Market Analyst Southeast and South Central Minnesota Minnesota Department of Employment and
Summary of the U.S. Census Bureau s 2018 State-Level Population Estimate for Massachusetts
 Summary of the U.S. Census Bureau s 2018 State-Level Population Estimate for Massachusetts Prepared by: Population Estimates Program For Release December 19, 2018 On December 19, 2018, the U.S. Census
WILLIAMSON STATE OF THE COUNTY Capital Area Council of Governments
 WILLIAMSON STATE OF THE COUNTY 2011 Capital Area Council of Governments POPULATION Capital Area Council of Governments POPULATION THE RISE OF TEXAS During the past decade, the State of Texas has proved
destination Philadelphia Tracking the City's Migration Trends executive summary
 destination Philadelphia October 6, 2010 executive summary An analysis of migration data from the Internal Revenue Service shows that the number of people moving into the city of Philadelphia has increased