Demographic Transition in Japan and Rural Development
|
|
|
- Blake McLaughlin
- 6 years ago
- Views:
Transcription
1 "Population and Development" Series No. 1 Demographic Transition in Japan and Rural Development FEBRUARY 1985 The Asian Population and Development Association (foundation)
2 CHAPTER 1 CHARACTERISTICS OF DEMOGRAPHIC TRANSITION IN JAPAN Toshio Kuroda Project Director Population Research Institute Nihon University
3 Tables, figures and notes are attached at the end of the chapter.
4 1. Significance of Demographic Transition in Japan Following World War II, Japan was the first country to successfully accomplish demographic transition. This demographic transition has a number of characteristics which are worthy of special mention. Firstly, it was the first demographic transition to take place outside the Western cultural sphere. All of the previous demographic transitions had taken place in nations of Western culture, and because of this fact, during its initial years people viewed the remarkable postwar demographic transition in Japan with doubt -- a drastic reduction in the fertility and mortality rates in such a short period of time, something that had never been experienced by Western nations. There arose an active debate. On one side, people claimed that the statistics were deficient, and on the other that if the figures were in fact correct, then the transition was a miracle or a very rare case having characteristics unlike any other Western experience. This argument was the focal point of discussions in American academic circle during the 1960s.(*1) Secondly, the Japanese case has international significance due to the fact that it was the first to take place in a non-european cultural environment. In particular, this raised a new question of whether a similar demographic transition could be expected to occur in the developing nations of Asia, which are also situated in a non-western cultural sphere. Moreover, there are also certain questions as to whether the Japanese demographic transition, which occurred in a non-western culture, could be explained as being substantially a "repeat" of the Western demographic transition. Although in the sense of demographic transition during the course of modernization, it may be understood as a "repeat" of the Western experience, in the strictest and most precise sense, it is not a mere "repeat" but one that was conditioned by the characteristics of Japan's modernization (*2). In other words, Japanese economic and social change, which served as the foundation for the transition in fertility rates, possessed characteristics conditioned by several factors such as historical, cultural and technological factors. Furthermore the period of the fertility decline, its speed and level were different from those experienced by Western nations. Nevertheless, there exists a significant and valuable international importance in Japan's demographic transition. The first reason lies in the fact that a phenomenon, which in the past had only been experienced in nations possessing Western culture, had occurred in Japan, a country in Asia located in the non-western cultural region of the world, This fact suggests the possibility of demographic transition occurring in societies located outside the realm of Western culture. -23-
5 The second reason is that through its own experience of demographic transition, Japan contributed both culturally and historically to bridging the gap between Western and non-western societies. Japan has proved that the phenomenon of demographic transition occurring during the process of modernization, i.e. economic and social change, is not unique to Western culture, but a universal phenomenon. The third reason is seen in the spread effects of Japanese demographic transition. It immediately spread south to Ryukyu (present Okinawa prefecture), which at that time was still under the military occupation of the U.S. Its fertility and mortality rates approached to the lower levels of Japan. Subsequently, the transition continued to spread to Hong Kong, Singapore, Taiwan and Korea. Those areas primarily belong to the Chinese cultural sphere, and the striking population phenomenon of Japan, belonging to the same cultural sphere served as the central model of diffusing this same phenomenon to other nations of the same cultural group. - The author has referred to this as the demographic diffusion effect (*3). Such a diffusion of effects may differ according to the degree of similarity of society and culture, depth of historical and geographical relations, international exchange and the relationship fostered by the progress of such information facilities as transportation and communication, and the education level or rising expectations for improving the living standard. Today, the diffusion effects of demographic transition are beginning to appear not only in the areas possessing strong characteristics of the above Chinese cultural sphere, but also in other countries in Eastern South Asia, as well as in India and Sri Lanka in Middle South Asia. In this respect, the low birth rate of approximately 20 or lower demonstrated by Barbados, Cuba, Puerto Rico and Uruguay in recent years may be viewed as the diffusion effects of low fertility seen in the U.S. in particular and Europe. 2. Demographic Transition in Japan and in Asian Nations Briefly, the Japanese demographic transition can be said to have followed the European pattern. The level of the birth rate prior to the start of a declining birth rate was around 35, a level comparable to that of Europe. Moreover, Japan and Europe shared another common factor of lacking a population policy addressing the reduction of the birth rate. As is the same in the Western World, demographic behavior, which brought about the decline of birth rate in Japan, possessed almost every demographic response. They include late marriages, use of contraceptive devices, abortion and sterility. The only exception to this is permanent celibacy (*4). In Japan, the percentage of those people never getting married for their entire life was extremely small, and the percentage currently married was -24-

6 extremely high similar to other Asian nations. It is worthy to note that the propensity to marry of the Japanese population is quite different from that of the West, but it also has unique Asian characteristics. The aforementioned characteristics of the demographic transition in the nations of Asia, which are different from that of the Japanese are explained below. First is the adoption of strong population policies by such nations. In the case of Japan, except for a population policy adopted during the WWII for the purpose of increasing the population, there has never existed population policies, which promoted family planning in order to control fertility (*5). Implementation of a strong population policy aiming at promoting fertility transition was beyond the scope of the European and Japanese demographic transition. In this respect, the fertility transition taking place after the War in such developing nations is strikingly different from that of Japan. The second unique factor is the adaptation and use of the fruits of epoch-making advancements and developments related to family planning methods for fertility control on the part of developing nations. Those safe and reliable methods such as pills and IUDs did not exist in the time when the West underwent its transition nor did Japan have such items during the days prior to and immediately following the War. Thirdly, there is the fact that the level of the birth rate before the initiation of the fertility control policy was much higher than that observed in the West and Japan prior to their transition in fertility. To illustrate this point, while the level of the crude birth rate in Japan and the West was approximately 35-36, that of the developing nations was at a higher level of around 45. It is a well-known fact that because of this, when the decline in mortality rates preceded fertility decline, the natural increase rate demonstrated an extraordinary growth of 2%-3%. This explains how explosive population growth, that was never experienced by the developed nations, occurred in such nations. As illustrated in the above points, the Japanese demographic transition, considered to be of the Western type, is different from that of the Asian developing nations. However, in view of the essential factor causing fertility to decline, they are not necessarily of different order. In other words, the Asian demographic transition cannot be said to be unexplainable by Western demographic transition. In most cases, the reduction in fertility would occur when a population, due to some desire or reason, would opt to have a smaller number of children. In the Western-type demographic transition taking place along side the modernization of society, smaller family patterns become a general social trend as a result of industrialization, -25-
7 urbanization, the advancement and diffusion of education, and the increase in the number of wage earners, and this in turn caused the birth rate to drop. In other words, it can be assumed to be a demographic reaction caused during the course of major social change. It should be mentioned that in the developing nations there occurred an extraordinary increase in the population prior to modernization, and this developed into an impediment to modernization itself. However, as a result, governments of such nations came to realize the need to reduce the birth rate in order to restrain population growth, and subsequently, fertility control, with family planning as its core, was positively implemented as a government policy. Stated differently, while there was a lack of a sense of urgent need for fertility control on the side of the people themselves, governments engaged themselves in promoting an enthusiastic campaign and providing assistance, and they were eventually successful in raising the consciousness of the people and encouraging the implementation of related policies. The fundamental difference between the reduction of'fertility of Japan or the West and that of the developing nations in Asia exists in their respective motivation for fertility control. In the case of Japan, granted that there existed a special factor of destitution following WWII, it was the people themselves, motivated by the pressures of major social and economic change, who voluntarily showed their response in the form of fertility control. On the other hand, in the developing nations, the motivation for fertility control came from the government, and the people gradually accepted and started to practice family planning recommended by the government. In the other words, despite the differences in how motivation regarding fertility control arose i.e. whether it was caused due to social, economic or environmental change or due to government policies -- the results are the same for both cases because each process eventually saw the development of a people's propensity for smaller families. 3. Demographic Transition is not Universal As has been once pointed out by Dr. Taeuber, who maintained that the "present demographic transition by the developing nations cannot be a mere "repeat" of the experiences of the European nations or Pacific nations having already achieved modernization," (*6) demographic transition cannot be uniform in nature. Even in Europe, which provided the setting for the establishment of classical demographic transition theory (*7), an orderly and systematic demographic transition has never been seen. This is true in the developing nations today. During the second stage of demographic transition theory, it is claimed that the drop in the death rate preceding birth rate decline had resulted in a rapid increase in the population. Nevertheless, to the contrary, there were cases where a decline in the birth rate preceeded that of the death rate as well as -26-
8 those where despite a preceding decline in the latter, the decline in the former did not follow immediately. If econmic growth is interpreted as industrialization, urbanization, and the transition from home production to factory production, then consequently it can be said that such economic growth was neither necessary nor sufficient for demographic transition. As is often the case, it is incorrect to believe that "economic development is the best family planning". Because the so-called classical theory of demographic transition is intended to describe the stages of changes in population dynamics in the course of economic development and growth, changes in population dynamics is only a by-product. Therefore, economic development is a premise for the reduction of the birth rate. In other words, this theory suggests that 'any policies designed to reduce fertility are meaningless, and above all economic development is necessary. However, at the present, there realistidally exists such phenomena demonstrating that even in the absence of sufficient economic development, the birth rate can be reduced by means of effective family planning policy. They are exemplified by the remarkable decline in the birth rates achieved in Java of Indonesia, Kerala of India, Sri Lanka and China. Also, a drastic drop in the birth rate in Singapore demonstrates the favorable effect exerted by a vigorous fertility control policy as well as the high economic growth of the country. It goes without saying that economic development is desirable, and it opens the path to promoting smaller family norm. A startling recent drop in fertility in Thailand is also the fruit of synergic effect of the government's family planning policy and remarkable economic growth. 4. Demographic Transition in Japan The modernization of Japan began in 1868 when the Meiji Government was born as a result of the collapse of the Takugawa Feudal Governmet. And, it is assumed that it was around 1920, the year when the first national census was taken, that Japan had completed its economic take-off and was ready to enter into a period of maturity. Although, a so-called modern population census was first conducted in 1920, as stated in the above, the Registration Law (Koseki-ho) had already been enacted in April 1871, and in the following year, 1872, a survey (kenko) to record the number of members of each household was conducted. In this way, as a result of the establishment of the registration system_in 1872, a system of recording vital statistics began. However, there is a great discrepancy and gap in terms of completeness and accuracy between the statistics taken during the first half and latter half of the period, thus making consistent analysis difficult. -27-
9 Many experts have so far attempted to make estimates concerning total population, age composition and population dynamics. Using such, an outline of the demographic transition in Japan will be discussed hereafter. When viewing the changes in population dynamics, which took place during a period of more than a century from 1870 to the present, it is beneficial to divide the period into two; i.e. a period of approximately 70 years until the end of the World War II and the 40-year postwar period. This is due to the fact that during the long period lasting until WWII, a unilateral declining trend of mortality and lagging behind of fertility decline were recognized. It may be interesting to see that it was similar to the second stage of classical demographic transition. However, the years following WWII have exhibited complex changes, reflecting great confusion for population dynamics due to the War, and thus reviews should be separately made. (1) commencement of Demographic Transition s - Table 1 illustrates the changes in population dynamics for approximately 70 years from 1870 to the end of the second World War. The population dynamics demonstrated during this long period, which covers the early days of modernization through the periods of economic maturity as well as remarkable development reaching the level of the developed nations, may be characterized by the continuance of a one-sided declining trend of mortality and a belated start for the decline in fertility which began 1910's. As a result, the natural increase rate rose to above 1% from the end of 19th century from previous 0.5% annual rate. With respect to mortality rate, which had recorded an annual rate of 30 at the beginning of modernization, declined to 25 by the early 20th century and reached a milestone level of below 20 in the 1920, and by it became as low as 16. In short, the mortality rate was almost halved during this 70-year period. Meanwhile, as explained previously, the birth rate remained at a high level around 35, and although it finally began to show a downward trend in the 1910s, it was not until after 1935, that it reached the level of around 30. It took as long as 60 years to reduce the rate from 36 of the early modernization period to 30. However, in the 1940s, the declining birth rate trend was curtailed to some degree due to the War-time pronatalist policy. A slight increase to 30.7 recorded during as compared to 29.3 in shown on Table 1, is the result of such an impact. However, such a policy to increase the population by the government proved to be unexpectedly ineffective. In other words, the War had served as a delaying factor for fertility transition. On the other hand, since the mortality rate still continued on its downward trend, the natural increase rate -28-
 Completion of Demographic Transition - Postwar Years - The Second World War had an enormous impact on and caused numerous changes for Japan's population dynamics.")
10 continued to register a high level. As a result, it reached an extremely high level of 1.4% per annum during the latter half of the 1920s as well as during (2) Completion of Demographic Transition - Postwar Years - The Second World War had an enormous impact on and caused numerous changes for Japan's population dynamics. Such effects and changes occurred in 2 stages. The first stage was the experience of the direct effects of the War, namely a drastic increase in the number of deaths and a sharp drop in the number of births. As a result, the natural increase rate also dropped sharply. These changes were observed for 3 years from 1944, the year prior to the end of the War until 1946, the year following the close of War. As illustrated in Table 2, the most severe impact of the War on population dynamics was observed in 1945 during which the death rate exceeded the birth rate, causing the natural increase rate to shift to negative growth. The second stage is represented by the three year baby boom from 1947 to This shift from a rapid decrease to a sharp rise in the birth rate is attributable to military personnel and civilians returning to Japan from overseas as well as demobilization of armed forces personnel, which constituted the baby-boom. Stated differently, this was the result of concentrated births and marriages, which had been deferred until the termination of the war. Although the changes in population dynamics, namely trend of declining birth and death rates was interrupted by the War, the death rate had began to drop to 14.6 in 1947 in comparison to 16.3 in The birth rate also recovered its declining trend from 30.7 recorded during to 28.1 in Therefore, the discontinuation of the declining trend was only temporary; only 4 years for death rates and 6 years even for the case of birth rates. As illustrated in the above, following the short period of suspension, Japan's population dynamics then continued to demonstrate a declining trend, and the pace of this trend was one of unprecedented quickness even when compared to the Western experience. For more than a century since 1870, with the exception of a very limited period time during WWII, mortality rates continued to exhibit a declining trend. Therefore, the characteristics of changing population dynamics after the War may be identified by focusing attention on the changes occurring in the birth rates. The postwar fertility transition may be classified into the 5 following stages They are; the initial stage of turbulence when both a sudden drop and a baby boom were experienced ( ); the sencond stage of drastic decline ( ); the third stage of stability ( ); the fourth stage of slight increase and the final stage of the second declining period ( present). -29-
11 Vital statistics records of many Japanese cities were either destroyed by fire or lost as a result of the War, and thus national records are not available for 1944, 1945 and The figures given for these three years are only estimates for the readers' reference. The first stage is one of turbulence lasting for 5 years from Although the rate had dropped to 23 in 1945, the year when the War ended, it quickly recovered to a level exceeding 30 during 1947 to 1949 as a result of marriage boom and the baby boom triggered by the great numbers of repatriates and discharged military personnel. This high level is comparable to that recorded in the 1920s, but this baby boom was only temporary and ended after a mere 3-year period to be followed by the 2nd phase of drastic decline. The characteristics of the Japanese baby boom, which is in clear contrast to the 18-year baby boom in the U.S. ( ), is attributable to fundamental differences in the economic conditions of the two nations. Whereas the United States, as a victor, was able to sustain its economic prosperity, Japan, a loser, losing both its economic strength and most of its cities, was compelled to fall into severe destitution. In Japan, an extraordinary situation reflected by unemployment and shortage of food of the time served to be the most important factor of restraining subsequent births. Although temporarily, illegal abortions increased drastically necessitating the government to quickly enact the Eugenic Protection Law. Under this Law, the government provided guidelines and rules concerning eugenic operations and contrasception from an eugenic viewpoint and allowed induced abortions with the doctors' approval under certain conditions. In this manner, the birth rate dropped at an unprecedented speed after 1950 and entered into the 2nd phase. After quickly breaking the 30 level and recording 28 in 1950, it continued to demonstrate remarkable drops registering 20 in 1954 and 17 in The rate, which had been 34 in 1947, was reduced by half in 10 years. Also, the number of births dropped from approximately 2.7 million per annum during the baby boom period to 1.5 million during the same period above. The third stage is a period of stability during which the birth rate level of 17 continued for approximately 10 years from 1957 to However, it should be noted that this stage included an extraordinary period observed for three years before and after 1966, the year of "Hinoeuma" (fire-horse year). This superstition believing that girls born in the "Hinoeuma" year, which comes once every 60 years, are destined to lead unhappy lives contributed popularizing birth control through family planning. In consequence, not only did it the birth rate of 1966 drop to a level of 13.7, the lowest in the history of vital statistics in Japan, but also affected the birth rates of the preceding and subsequent years, increasing them to 18.6 in 1965 and 19.3 in 1967 respectively. In any event, despite such an irregular birth rate, the average of these 3 years was 17.2 or
 covers the period of reactionary rise.")
12 comparable to the level of the entire this stage. This was the reason why this limited period of disturbance should also be included in this particular stage of stability. The fourth period ( ) covers the period of reactionary rise. This is due to the fact that the generation, born during the baby boom immediately after the close of the War, reached marriagable age. As a result, the rate rose to 19 from 17 of the preceding stage. The fifth stage covers the period of thesecondfertility decline, which continues to the present. The period has shown a gradual but steady decline from the peak of 19.4 recorded towards the end of the previous period. As shown in Table 2, the figure has demonstrated a declining trend every year since In recent years, it has reached a level as low as 12, which is quite low even in comparison to Western nations. However, even in terms of the crude birth rate, the pace of decline has started to slow down indicating that it has almost reached its limitations. As would be discussed below, the total fertility rate figures indicate that it has already reached the lowest level in 1981, and, though marginal, has shown reactionary rises in 1982 and (3) Factors of Fertility Transition Above all things, a change in the sense of values, namely expectations and hopes directed to a lesser number of children, as well as the availability of means to implement such a desire be required in order to cause a change in fertility. Furthermore, the external conditions, effecting a natural drop of birth rate, must be considered. In Japan, the fertility transition started around 1920, but it is also true that in those days, the practice of birth control was limited only to intellectual residents of major cities, and thus quite naturally the decline was very slow. During a 17-year period from 1920 to 1937, the birth rate in Japan dropped by 5 points (14%) from 36 to 31 (*8). In terms of the total fertility rate, the drop recorded 17% from 5.24 of 1920 to 4.36 of 1937 indicating that actual fertility decline was higher than that of the crude birth rate. Of those affecting birth rates, a typical external condition is the delay of marriage, namely later marriages. In 1920, the greatest number of people were married at an age of 20.6,. whereas the age rose to 22 in Extended years of education and an increase in female employment in major cities have raised the age of marriage. Since there is a limit regarding how long one can remain reproductive, raising of the age for getting married would mean a reduced frequency of chances of pregnancy and a subsequent reduction in birth rate. Before the War, family planning was a practice limited only to urban intellectuals in Japan, and it was only after the War that it was diffused to all classes of society and to all regions. In the

13 early 1950s, the government, in recognition of the danger of abortion on the motherhood, has initiated the full-scale promotion of sound family planning. Although a reduction in birth rate or in other words, fertility control, has accomplished epoch-making results as described above, the majority of results was attributable to induced abortion. According to one study (*9), in 1955 the ratio of the contribution to the decline in fetility between induced abortion and contraception was 7:3. However, later, owing to positive governmental efforts as well as better recognition and understanding on the part of the people, the ratio has been reversed to demonstrate the dominance of fertility control through the use of contraception. In 1960, the ratio was 5:5 and in 1965, it further changed to 3:7. Such a shift in the fertility control method from induced abortion to family planning was achieved as a result of the disappearance of postwar austerity and the recovery of the prewar standard of living level as well as the consequent stability of livinghoods and upgraded education levels. In this way, a smaller family norm had taken root among general people. Accordingly, the current rate of using contraceptive methods has increased from 33.6% in 1955 to 55.5% and 60.5% in 1965 and 1975, respectively. If a population group, which had practiced before is added to the number (21.0%), the total ratio would exceed 80%, meaning that only 13.2%of people have never practiced such a method (*10). In this context, reasons for the implementation of family planning bear much importance. When a trend in such reasons is viewed using the data above mentioned, the following points are noteworthy. In the 1950s, economical reasons to protect their livelihoods, i.e. more children would result in poverty -- were predominant..however, reflecting the subsequent economic growth, reasons have changed to become a kind of cultural desire such as educating children. Because education is extremely costly, people once believed that it would be better to have a smaller number of children, providing them with a sufficient level of edcuation. Upon entering the 1970s, reasons changed further and those of "protecting the mothers' health" came to account for a larger share in comparison to others. Here, it is important to note that even in the course of smaller families becoming the norm, even if people's motivations should change, the behavioral standard of a smaller number of births would not change so easily. In conclusion, it can be said that the fertility transition has been completed in Japan. The birth rate is expected to remain at the level of 12 per 1,000 people (crude birth rate), while the mortality rate is demonstrating horizontal movement. Also, a natural increase

14 has continued to record figures at the 0.6% level. (4) Fertility Trend Viewed in Terms of the Reproduction Rate of Females. Here, trends of Japanese fertility will be reviewed in terms of the reproduction rates, which excludes effects of the changes in the age composition of population. Table 3 shows the trends observed from the prewar days until the present regarding the total fertility rate, gross production rate, and net reproduction rate. Since 1975, Japanese couples have given birth to less than 2 children on the average. Particularly, since 1978, the number has decreased to a level as low as 1.7. However, it is also worthy to note that with a total fertility rate of 1.74 in 1981 as the bottom, it has began to show slight increases recently recording 1.77 and 1.80 in 1982 and 1983, respectively. Nonetheless, it is too early to conclude whether Japanese fertility has reached its lowest limit and will continue to level off or will show reactionary rises. It is certain that Japan has completed its fertility transition, but it still remains as a future task to examine about the course it will follow in the future. In closing, it should be emphasized that analyses and measures relating to further changes in the age structure (the author refers to it as the "age structure transition"), which is a natural result of demographic transtion, should be urgently needed

15 Table 1 Trends of vital rates during the early years of modernization to WWII Birth rate Period 0 ) (A* Death rate (0/00) Natural increase rate (0 /00) (Source) Population Estimates by Sex and Age From the 1870s to 1920s. Institute of Population Problems, Research Series No. 145, February 1, Each 5 year period covers a period from January 1st of the first year until January 1st of the year following the last year of the said 5 year period. Statistics after 1920 are based on calculations by the Institute of Population Problems of the Ministry of Health and Welfare. In this case, the 5 year period covers 5 years from October 1st of the 1st year until October 1 of the year following the last year of the said period

16 Table 2 Trends of Vital Rates after WWII until Present Year Birth rate (Oko) Death rate (060) Natural increase rate (Ohm) 1944 * 29.2 * * 23.2 * * 25.3 *

17 Year Birth rate (oho) Death rate (oko) Natural increase rate (% 0) ** 12.5 ** (Source) "Vital Statistics" of the Ministry of Health and Welfare. * is derived from the 1951 version of the U.N. Population Yearbook. Estimates by Japanese experts are used. ** Conversions made on the basis of reports covering the period from January to October
 (3) (3) i- (2) (1) -i- (3) (4) (5) 1920 5.24 2.56 1.59 0.62 3.30 1925 5.11 2.51 1.56 0.62 3.28 1930 4.71 2.30 1.52 0.66 3.10 1937 4.36 2.13 1.49 0.70 2.92 1940 4.11 2.01 1.44 0.72 2.86 1947 4.")
18 Table 3 Trends of the Population Reproduction Rates in Japan Year Total fertility rate Gross reproduction rate Net reproduction rate Reproduction survival rate Stationary gross reproduction rate (1) (2) (3) (3) i- (2) (1) -i- (3) (4) (5)

19 Year Total Gross Net Reproduction Stationary fertility reproduc- reproduc- survival rate gross reproducrate tion rate tion rate tion rate (1) (2) (3) (3) + (2) (1) i. (3) (4) (5) Note: Total fertility rate indicates the average number of children given birth to by one woman during her life, which is obtained using a specific fertility rate by age. Gross reproduction rate indicates the number of girl(s) given birth to by one woman during her life to replace herself. Net reproduction rate is obtained by deducting those girls who die before they reach an age capable of replacing their mothers. Reproduction survival rate is obtained by dividing the net reproduction rate by the gross reproduction rate, and showing the degree of losses in births caused by death during the reproduction process under the present probability of dying. Stationary gross reproduction rate indicates level of total fertility rate required to obtain net reproduciton rate one
20
21
22 Notes (*1) Kuroda, T., Nihon Jinko No Bunseki (Analysis of Japanese Population). Ichiryu-sha Publishing Co., 1968, 1970 (enlarged). Yasukawa, M., Jinko no Keizai-gaku (Economics of Population), Shunju-sha, 1967 (revised and enlarged). (*2) Taeuber, I.B., Demographic Modernization: Continuities and Transitions, Demography, vol. 3, No. 3, 1966; Davis, K., The Theory of Change and Response in Modern Demographic History, Population Index, vol. 29 No. 4, October (*3) Kuroda, T., Nihon Jinko no Bunseki (Analysis of Japanses Population). pp (*4) Davis, Kingsley., The Theory of Change and Response in Modern Demographic History, Population Index, XXIX, No. 4 (October, 1963), (*5) Chapter 23 Japan, Minoru Muramatsu and Toshio Kuroda, Population Policy in Developed Countries, edited by Bernard Berelson, A Population Council Book, McGraw-Hill Book Company, 1974, (*6) Taeuber, p.90 (refer to the above) (*7) They were developed particularly in the 1950s by Notestein, F.W., Coale. A.J., and Hoover, E.M. of the U.S.A. and many other scholars. In particular, Notestein distinguished three demographic types or stages of demographic evolution: They are; a) High growth potentials, where fertility remains high and death rate is also high. b) Transitional growth, where due to a drastic drop in death rates but still high fertility, the natural increase rate becomes high. c) Incipient decline or "Transition Completed," where both rates reach low levels, or at times where the birth rate has dropped to be even below the replacemet level. (*8) Although the birth rate drop during this period appears to be moderate, it is absolutely not necessarily the case when viewed from the standpoint of the inital period of
23 fertility transition. In Great Britain, where the birth rate started to decline in 1876, its similar patterns are seen in terms of level of birth rate of Japan, because British birth rate was 36 in 1876, and 31 in (*9) Aoki, H., Shutsusei Yokusei ni Kansuru Tokei-shiryo (Statistical Materials on Fertility Regulation), Research Series No. 181, Institute of Population Problems, (*10) Summary of Seventeenth National Survey on Family Planning, The Population Problems Research Council, The Mainichi Newspapers, Tokyo, Japan, August
24 CHAPTER 2 RURAL-URBAN DIFFERENTIAL IN FERTILITY AND ITS NARROWING PROCESS Makoto Atoh Director Division of Human Reproduction & Population Quality Institute of Population Problems Ministry of Health and Welfare
25 Tables, figures and notes are attached at the end of the chapter.
26 1. Introduction According to "Demographic Transition Theory" which explained the major change in population in modern Western society, it was thought that the fertility transition, namely the transition from traditional high fertility to modern low fertility would not occur uniformly in each and all of the social strata, but rather, the change would be first seen in a certain strata and eventually diffuse itself to the other stratas (*1). In other words, it was believed that the small family norm (i.e. a view which believes that it is preferable to have a smaller number of children) and an effective way to restrain birth would, at first, penetrate into the urban middle class before spreading gradually into lower urban classes and into the rural society and,thus, although the rural fertility should,at first, greatly exceed that of the urban areas, such a fertility difference would eventually diminish itself as the transition progresses. Such a way of view is represented by a so-called "diffusion hypothesis" concerning the fertility transition. However, separate from such an idea, there have been other views proposed by some, which maintain that there also existed an effective way to control the fertility of a couple in the rural society prior to the transition, and such birth control was actually practiced at appropriate times and thus the concept of fertility control.and its practice are nothing particularly innovative. Also, cases have been presented which indicate that not only the rural-urban differential in fertility were omnipresent during the pre-trasitional period, but also the transition occurred simultaneously in both rural and urban areas (e.g. Sweden) (*2). However, in recent years, new studies have been made public. They report that the family limitation, in other words, a behavioral pattern whereby a couple controls the birth in accordance with the number of their children, is inherent in the post transition period and thus cannot be seen in the pre-transition period (*3). To illustrate, they say that although there may have been both conscious and unconscious practice of birth control in the pre-transitional period, it was in the nature of either a temporary means to respond to emergency situations such as famine or adjustment of birth intervals by extending the period of lactation, and thus there is nothing which indicates that couples practiced birth control with an ultimate goal of limiting the number of children (family size). In other words, they claim that prior to the transition period, the births followed the pattern of "natural fertility" in principle. This view does not necessarily serve as evidence for "diffusion hyposthesis." Nevertheless, supposing that innovative behavioral pattern (in this case, family limitation) is generally accepted by the urban community before being accepted by the rural community, then this may be pointed to as one circumstantial evidence
27 In the past, discussion concerning "diffusion hypothesis" had evolved mainly in relationship to the fertility transition in Europe. However, it is worthy to review this aspect with regards to Japan, which is virtually the only country amongst the non-european world that accomplished the demographic transition. Accordingly, this chapter will discuss the historical trend of the fertility differential between the urban and rural areas of Japan. Also, it is necessary that the discussion should not be limited to the superficial observation of the changes in the difference, but should extend its thoughts to the reasons that caused such changes. It is believed that through such efforts, it will be possible to evaluate the applicability of the diffusion hypothesis to the course of fertility transition in Japan, and also to reveal the similarities and differences between European and Japanese experiences in fertility transition. 2. Fertility Transition in Japan In Japan, after marking the highest level in the history of vital statistics in 1920, (36.2%), the crude birth rate (i.e. yearly number of births per population of 1,000) continued to decline slowly during the prewar period, and reached the level of 26.6% in 1939 (Fig. 1). After World War II, the country experienced a so-called baby boom for three years beginning 1947, and during this period the crude birth rate shifted around the level of 35%. However, with 1950 as a turning point, it suddenly shifted to show a declining trend, and in only eight subsequent years, the rate declined by as much as 48% to record 17.2% in Statistics indicate that the decline of fertility in the modern age which started in 1920 marked its overall ending after 40 years, and this 40 year period may be referred to as that of fertility transition in Japan. In case of Japan, the nature of fertility transition was substantially different between the pre and post war periods. Namely, the decline of the birth rate prior to the War was gradual whilst on the contrary, that in the post war period was drastic. The results of the study which used the decomposition method to make the comparative analysis of the declines of crude birth rates of the pre and post war periods revealed that, if the impact of the age composition change is to be ignored, approximately 70% of the fertility rate decline can be attributed to the drop of proportion marrying, while the remaining 30% to the drop of marital fertility during the period prior to the War. On the contrary, with respect to the post War days, 80% of the decline is attributable to the drop of marital fertility and 20% to the drop of proportion marrying (*4). In other words, the gradual decline of fertility rate observed during the period before the War was primarily effected by the drop of the -46-

28 proportion marrying, i.e. the postponement of marriages, whereas the dramatic decline after the War was mainly caused by the fertility decline of the married population, namely birth control practiced by married couples. Using the metaphorical expression of A. Coale, it can be said that in Japan although Malthusian control of fertility was practiced during the prewar period, after the War, the neo-malthusian control spread itself as a popular practice (*5). Unlike the Western nations, "early and universal marriage" was dominant in the Japanese society during Meiji and Taisho eras. The shift from early to late marriages, which brought about the drop of the proportion marrying in the prewar period, may be explained to be generally attributable to the advancement of industrialization, urbanization and rise of school enrollment rate, the phenomena of economic development (*6). Tendency of late marriages continued after the War, and consequently, today, Japan is one of the foremost nations known for late marriages. The direct cause of the sharp decline of marital fertility after the War is the defacto liberalization of induced abortion which came into effect by the enactment of the Eugenic Protection Law of Although contraceptive measures had been gradually diffused, owing partially to the activities of family planning organizations, it is presumed that it was only after 1960 that the birth-overting effects of the contraception exceeded that of abortions (*7). One of the societal factors that led to married couples quickly adopting the measures for birth control after the War, was the extreme deterioration of the living standards due to the defeat in the War (as well as serious sense of poverty and austerity in comparison to the prewar period). Nevertheless, it should be understood that, even before the War, owing to industrialization, urbanization and upgrading of education levels, there existed a ground for eventual adoption of birth control (*8). This is evidenced by a fact that birth control practice by couples have been further disseminated even after the mid-1950's, when the social confusion due to defeat in War calmed and the national economy recovered to the living level of the prewar period. 3. Trends in the Urban-Rural Differential in Fertility In considering the fertility difference between the rural and urban areas, the question pertaining to the definition of the urban area arises to be solved before all. This is because an image of an urban area differs greatly between countries and periods of time, and this makes the international and inter-time comparisons extremely difficult. In the case of Japan, the classification of shibu (urban
29 districts) and gunbu (rural districts) had been consistently employed from the prewar period by the administrative branch. However, as time passed changes developed which included the expansion of urban areas, and as a result of the enforcement of the Law Promoting the Merger of Towns and Villages in 1953, it was realized that the former classification began to no longer reflect the true realities of the rural and urban areas in terms of population density. Consequently, in 1960 the Statistics Bureau of the Prime Minister's Office introduced a statistical concept using the terms of DID (densely inhabited district) and NON-DID (*9). For the purpose of this study, the author will use both of the above classifications as appropriate in terms of the source of data. In addition, with respect to certain problems, the paper may make the comparison between the two metropolises (Tokyo and Osaka) and other prefectural districts. (1) Changes in Fertility Rate by Classification of Urban and Rural Areas in Japan Table 1 illustrates the population statistics by urban and rural areas obtained in each census year between 1920 to 1980; they are given in terms of population composition, crude birth rates and the differential index of the two districts, standardized birth rates and the differential index. First, with respect to changes in the urban population composition in 1920, the population ratio of the urban area (cities) was less than 20%, below the current level of developing nations. Since then, the population ratio in the urban area gradually increased to a 38% level in Urbanization, as reflected in urban population composition, has been drastic in the postwar years. It exceeded 50% in as early as 1955, and continued to grow constantly reaching to constitute 75% of the total population in In terms of population composition of densely inhabited districts, the progress of urbanization after the War has not been too drastic; nevertheless, it reached 54% in 1970 indicating that, by that period of time, Japan had converted itself to a complete urban (type) society. During the course of the urbanization, the crude birth rate continued to decline consistently in both urban and rural areas with the one exception of the postwar baby boom. Although the largest difference between the crude birth rates of rural and urban areas was recorded in 1920, since the degree of drop in rural area exceeded that of the urban area during prewar years, the difference narrowed to some extent in Although after the War, during 1947 to 1955, the difference tended to expand reflecting the sharp decline of birth rate in urban areas, in subsequent years it again demonstrated a narrowing 48
30 trend. Particularly, since 1965, the birth rate of rural areas has continued to record the level below that of urban area. When the trend of a rural-urban differential in fertility is to be studied by the factor of crude birth rate, one cannot avoid not only the influences exerted by the differences of rates between ages, but also that of the difference between age structures of the two areas. Hence, in view of such, indirect standardized birth rate (*10) was calculated to allow comparison freedom from the influences of the age structure of the two areas. According to this, because the decline of birth rate of urban areas before the War was comparable to that of rural areas, the fertility differential of the two areas marked almost no changes with during the prewar time. Therefore, it was learned that the narrowing of the differential in crude birth rate observed before the War, was attributable to the fact that age structure changes in urban areas had exerted relatively a favorable impact over the births. After the War, even the analysis by the indirect standardized birth rate indicated a similar trend, i.e. a temporary expansion of the rural-urban differential in birth rate and the subsequent narrowing of the difference. However, it also explains that the reason why the crude birth rate in rural areas declined below that of urban areas after 1965 was because the age structure of the latter exerted favorable impact onto births, and that the difference in birth rate by age between two areas was almost negligible. In other words, a major migration of youth from rural to urban area, which occurred during the mid 1950s to mid 1960's, affected the pushing of the crude birth rate of urban areas during the same period. In summary, as far as the data by rural and urban areas indicate in 1920, the year understood to be the start of fertility transition in Japan, fertility in rural areas substantially exceeded that of the urban area. And during the period prior to the War, since both urban and rural areas had experienced gradual decline of fertility, the difference between the two groups did not diminish. However, it was also revealed that after the War, although there was a temporary expansion of the difference due to a drastic drop of fertility in cities in initial years, soon the rural fertility began to record a drop comparable or greater than that of urban areas. Consequently, by the time Japan completed its transition to the urban society, the difference between the two groups almost diminished. (2) Demographic Factors of the Rural-Urban Fertility Decline When seeing Japan as a whole, it can be said that the gradual decline of birth rate before the War was mainly attributable to the drop of the proportion marrying namely the postponement of marriage,
31 whereas the sharp drop observed after the War was primarily due to the decline of marital fertility, namely birth control by couples. Analysis of urban and rural areas respectively in terms of this point shall be made. For the above purpose the metropolis areas of Tokyo and Osaka will be grouped as one while the remaining prefectural areas will be grouped according to regional blocks. For each group, the average value of CBR', (birth rate based on the standardized age structure,) and CBR", (birth rate based on both standardized age structure and marital status,) were calculated for 1930, 1950, and The results are given in Fig. 2, and Tables 2 and 3. Since CBR" is a birth rate index obtained by standardizing both the age structure and marital status, it could be considered as a relative index of birth rate of married population. On the contrary, since it is an index of birth rate where only the age structure is standardized, CBR' is believed to be subject to both impacts of proportion marrying and birth rate of married population. Therefore, a comparison of CBR' and CBR" would allow the evaluation of the impact exerted onto the birth rate differential by the differences of proportion marrying. With respect to CBR' in 1930, Tokyo and Osaka recorded the nation's lowest figure even in comparison to respective prefectural areas, and the ratio of the average of each regional block against that of these two metropolises ranged widely from 1.3 of Kinki to 1.8 in Hokkaido/Tohoku (Table 2). Meanwhile, regarding CBR", despite the overall contraction of the difference against the Tokyo/Osaka group, the difference between CBR" and CBR' is not observed for regions of Kanto, Kinki and Kyushu. This suggests that since there is very little difference in terms of the proportion marrying between Tokyo/Osaka and the respective regions of Kanto, Kinki and Kyushu, the differences of birth rates were primarily due to differences in marital fertility. On the other hand, it was also found that particularly in Hokkaido/Tohoku regions, not only marital fertility but also the proportion marrying was high, causing the synergistic effect of rising the birth rate. In view of changes between 1930 to 1950 (Table 3), while in all areas the degree of decline of CBR" was minimal, that of CBR' showed the decline of 10-30%. This is a clear illustration of the fact that the decline of the proportion marrying had been the primary cause of birth rate drop regardless of areas before the War. In particular, CBR" of Tohoku/Osaka and Kyushu had even shown a marginal rise. With respect to the difference between Tokyo/Osaka and other regions observed in 1950 (Table 2), the difference rate in CBR' extended from 1.1 of Kinki to 1.6 of Hokkaido/Tohoku, whereas that of -50-
32 CBR" ranged from 1.1 of Kinki to 1.3 of Hokkaido/ Tohoku. In comparing the above with the data of 1930, it was learned that the difference became smaller for both indices. This is a result of a marginal rise of CBR" for Tokyo/Osaka. Incidentally, the reason why the difference with Kyushu showed almost no changes can be explained by the fact that CBR" in Kyushu also demonstrated similar growth for that period. Between 1950 to 1960, in all regions CBR" declined substantially while the rate of decline of CBR" was also comparable (Table 3). This indicates that the drastic drop of birth rate seen in that period was primarily due to the drop of marital fertility for all regions. With respect to differences between Tokyo/Osaka and other respective regional blocks (Table 2), in 1960 the rate of differences in CBR" was approximately 1.0 to 1.2, and as a result it can be said that the differences in marital fertility disappeared mostly during this period. Meanwhile, a fairly high rate of difference was recorded (1.3) in Hokkaido/Tohoku and Kyushu in terms of CBR' - age standardized birth rate. The trend in the former is due to fairly higher proportion marrying (in other words, due to relatively early marriage) and the latter is because of higher birth rate of married population. In summary, as a result of the comprehensive comparison of fertility of the two major industrial centers, i.e. Tokyo and Osaka, with other respective regional blocks, it was learned that every region demonstrated a trend almost identical to the nationwide trend. It revealed that drop of birth rate was caused mainly by the decline of the proportion marrying (in other words, the postponement of marriages) prior to the War, whereas, after the War, the sharp drop was effected by a drastic decline of marital fertility. (3) Rural-.Urban Differential in Fertility of the Couples as Seen from Fertility Surveys Fertility can be measured by the number of births (children ever born) obtainable from data such as fertility surveys. The number of children given birth by a married woman by the end of her reproduction period is called completed fertility. Completed fertility, unlike the fertility index we have been using, measures cohort fertility. Completed fertility by respective birth cohort is affected by the average marriage age of each cohort. That is because in general, the postponement of marriage for the population in which birth control is not thorough have a possibility to cause rather an extensive influence to the completed fertility. Table 4 indicates the changes of completed fertility in rural and urban areas respectively using the results of censuses conducted in 1950, 1960 and 1970, as well as the result of the seventh National
33 Fertility Survey (1977) conducted by the Institute of Population Problems of the Ministry of Health and Welfare. Since the data from the censuses is on married women and the data from the 7NFS is on women who get married for the first time, there is a difference; however, when observing the trend in rural-urban differential this causes very little problem. Rather, it should be noted that the fertility figure of married women 50 years or older in 1950 have the possibility of underenumeration caused by mistake in or leak of memory, even more so in older cohorts. According to the table, the average number of children ever born of couples who completed the reproduction process prior to 1935 (birth cohort prior to 1890) in rural areas is approximately 5.5 and 5 in urban areas; the difference was 1.1 times. The rural-urban differential went up to 1.3 times in the following three cohorts because the average fertility in rural areas slightly increased and that in urban areas slightly decreased. There was no change in difference of the couples who completed the reproduction process in 1960 (birth cohort of ) in which the average number of children ever born in rural areas decreased by approximately one, since that in urban areas showed similar decrease. In the following cohorts, however, the drop in average fertility in rural areas was larger than that of urban areas, and the difference became gradually smaller. With respect to the cohort married after sudden drop of birth rate after the War (birth cohort of ), the difference has been around 1.1 times, and in the latest cohort, the average number of children ever born both in rural and urban areas has been two (*11). The comparison of Tokyo/Osaka and other prefectures was made to see the change of proportion marrying and the rate of birth by married population under the pre and post war fertility drop. The pattern we observed was that the rural/urban difference in marital fertility slightly decreased in pre war period and largely decreased in post war period. When completed fertility is compared by rural and urban, or by DID and non-did, it is revealed that the difference enlarged somewhat for the cohorts who completed their reproductive years before the War and it remained large for the cohort who were in the midst of reproductive period at the time of the postwar precipitous decline in fertility, but that the difference largely decreased from the cohort who married after the period of the postwar sudden fertility decline. It is difficult to assert the prewar completed fertility differential was enlarged, because of the inherent problem of the data as one of the reasons. Looking at the general trend of the rising age of marriage in prewar years, it is reasonable to consider that the average number of children ever born decreased in the rural area also. However, when noting the fact that the difference was large in the cohorts who were in the marriage and birth period during the time of sudden drop in fertility after the War, we can speculate that the low fertility pattern of couples initially and largely penetrated through -52-
 Rural-Urban Differentials Seen in the Spread of Birth Control The postwar sudden drop of birth rate was brought about by the drop in the birth rate of married population.")
34 the urban area. This interpretation seems to coincide with the fact that the rural-urban differential of indirect standardized birth rate enlarged during the time of sudden drop of birth rate. (4) Rural-Urban Differentials Seen in the Spread of Birth Control The postwar sudden drop of birth rate was brought about by the drop in the birth rate of married population.this means that the birth control was propagated and it became possible to limit the number of children as wanted. Unfortunately, we cannot pursue the change of attitude toward the family size since there is no data regarding the wanted number of children or intended number of children in pre war and in the period of sudden drop of fertility (*12). Fortunately, however, Mainichi Shimbun Population Problems Research Council has been conducting surveys approximately every two years since 1952, and the trend of change of the rural-urban differential in propagation of birth control, can be learned though it may be incomplete. Table 5 indicates the change in the rate of induced abortion experience, and current or ever use of contraception by the size of cities, on the whole sample of the survey (married women under. 50 years old). The trend is obvious, although it is difficult to assert since the difference of age structure by the size of cities is not standardized. The survey conducted among the sudden drop in birth rate (1952 and 1957) showed that the larger the size of a city is, the higher the proportion of women who have ever used induced abortion or women who are practicing contraception, In the survey conducted in 1969 and 1971 when low birth rate became a standard, there was no rural-urban differencial in propagation of abortion and contraception. The effective birth control methods (especially induced abortion) that became available due to alleviated legal restriction, first diffused through the urban areas: and then in a short period spread into the rural areas, and the difference between urban areas and rural areas rapidly disappeared. 4. Summary When the birth rate in 1920 (which is considered to be the starting point of fertility transition in our country) is compared between rural and urban areas, birth rate in urban areas is largely below that of rural areas. One of the reasons is that the proportion marrying in urban areas was low (mainly because of higher age at first marriage), and another reason is that marital fertility was low. When just looking at this data, it seems to support the theory that the rural-urban differential in fertility existed before fertility transition, but it is difficult to make assertion since we do not have any reliable data for the period prior to
35 After 1920 until the second World War, the birth rate of our country decreased gradually. The main reason of that was the drop of proportion marrying, the postponement of marriage, and the drop in marital fertility was not so large. The birth rate both in rural and urban areas showed moderate decline, and the reason of the drop in either case was mainly the drop in proportion marrying. One should not forget that unlike fertility transition in Western nations, the rise in age of marriage was the trigger of fertility conversion in our country (*13). In this period, the transition from early marriage to later marriage proceeded simulatneously in urban and rural areas, and in that sense, it is difficult to build the hypothesis that the pattern of late marriage was spread from urban area to the rural area. After the War, although there boom, the birth rate turned to show the low level equivalent to that of subsequent years. occurred three years of a baby a drastic drop, and Japan reached advanced nations in merely 10 More than anything, it was the fertility control by couples, made possible by the virtual liberalization of induced abortion that brought about the fertility transition after the War. During the same period, the decline of urban birth rate exceeded that of rural areas, which in turn resulted in the expansion of urban-rural difference. Nevertheless, rural areas also followed with a sharp drop of birth rate, and as a result by mid-1960's, the fertility difference between the rural and urban areas almost disappeared. During a certain period of this quick decline process, it clearly demonstrated a pattern of initial spread of effective birth control in urban areas (particularly induced abortion) and its subsequent penetration into rural areas. This corresponds to "diffusion hypothesis" established during the European process of fertility transition. However, it should also be noted that the Japanese case is unique in terms of that the process was concluded in a surprisingly short period of time. The facts that the fertility transition in Japan was accomplished in an extremely short period of time and that the diffusion process of birth control from urban to rural areas was very short may be explained by the omnipresence of motivation for birth control irrespective of the area, and availability of the most effective means of birth control in all parts of Japan. -54-

36

37

38

39

40
41
 Fig.")
42 Hokkaido, Tohoku A Chubu Kanto Chugoku, Shikoku CBR ') Age standar d ized birth rate ( I 0 Chugoku, Shikok Ch Tokyo Osaka Tokyo, Osaka Kinki Kanto Kinki Kyushu Kyushu Age/marital status standardized birth rate(cbr") Fig. 2 Trends in Standardized Birth Rate by Region (Relationship between age standardized birth rate and age/marital status standardized birth rate.) 61
43 Notes (*1) Representative examples are J.A.Banks, Prosperity and Parenthood, London, Routledge and Kegan Paul, In Japan "On: Differential Fertility" by Tatsuo Honda, Journal of Population Problems, Institute of Population Problems of Ministry of Health and Welfare, No 68, 1957 pp (*2) For example, E.A. Wrigley, "Family Limitation in Pre-Industrial England," Economic History Review, Vol. 19, Gosta Carlson, "The Decline of Fertility: Innovation or Adjustment Process," Population Studies, Vol. 20, 1966, pp (*3) John Knodel, "Family Limitation and Fertility Transition: Evidence from the Age Pattern of Fertility in Europe and Asia," Population Studies, Vol. 31, No.2, July 1977, pp (*4) Author's paper; "Comparative Analysis of Birth Rate Decline between Pre and Post War Periods" in Annual Report of Institute of Population Problems, No.22, 1980, pp (*5) Ansley J. Coale, "The Decline of Fertility in Europe from the French Revolution to World War II," S.J. Berman, et al (ed.), Fertility and Family Planning: A World View, University of Michigan Press, 1969, pp (*6) Details concerning the reasons for the postponement of marriage are given in Carl Mosk, "Nuptiality in Meiji Japan," Journal of Social History, Vol.13, No.3, 1980, pp e.g."analysis of Birth Control Effect in Fertility of Couples in Pre and Post-War Periods" by Tatsuo Honda, Journal of Population Problems, No.78, 1959, pp Carl Mosk, "The Decline of Marital Fertility in Japan," Population Studies, Vol.33, 1979, pp For DID population refer to Study on Urban Population Distribution in Japan by Atsushi Ohtomo, published by Taimeido, Because birth data by age and areas (rural vs urban) were not available for all census years in the Japanese Vital Statistics, it was not possible to make time-serial comparative analysis by using the direct standardized
44 method. (*11) Details are given in a paper by the author, "Social determinants of fertility in Japan" in Journal of Population Problems, No.157, 1981, pp (*12) Recent analysis concerning desired number of children or intended number of children are given in papers by the author; "Possibility of Fertility Forecast in Modern Japan" in Journal of Population Problems, No.149, Jan. 1979, pp16-31; "Analysis of Recent Decline of Fertility in Japan" in Journal of Population Problems, No.5, 1982, pp (*13) Fertility transition in the Western society was primarily due to decline of birth rates in married population, and thus there were almost no change in the marriage pattern during the transitional period. In the Western world, late marriages and a high rate of life-time celibacy were dominant already in the period prior to transition, and the proportion marrying was low. This is described in John Hajnal, "European Marriage Patterns in Perspective," in D.V. Glass and D.E.C. Eversless, Population in History, Arnold, 1965, pp Ansley Cosle, op cit

45 CHAPTER 3 PREFECTURAL AND URBAN-RURAL DIFFERENTIALS IN MORTALITY Kazumasa Kobayashi Professor of Demography Population Research Institute Nihon University
46 Tables, figures and notes are attached at the end of the chapter.

47 1. Introduction In comparison with recent trends, the regional differences in mortality in Japan was still extremely conspicuous in the 1920's reliable data which may be used for regional comparisons of mortality in Japan are only available from 1920 onward. This Chapter will describe the outline of regional differences in mortality in Japan for the period from the 1920's to the present. The discussion will be based primarily on data given by prefectures. The index indicating overall mortality (non-age specific) will be employed for comparison more often than age-specific mortality rates. With respect to mortality index indicating the overall level, it would be convenient to the sex-age-standardizd mortality rates. The level of such standardized mortality rates, however, does not, by itself, possess a particular realistic significance. Instead, this paper will use, mainly, values of the expectation of life at birth from the life table, since they are easier to understand. In order to avoid trouble in using this index caused by that this is usually given separately by sex, this paper will use the life expectancy at birth for both sex combined which is the weighted average with the assumption of sex ratio at birth being 105 males per 100 females. 2. Regional Differences in Life Expectancy at Birth (1) First Half of 1920's According to the life table for (*1), the life expectancy at birth for the whole of Japan during the first half of the 1920's was years (male years and female years), shorter compared to recent years by 34 years. Also, according to the life tables by prefectures (*2) compiled for the same 5-year period of , the life expectancy at birth showed wide variations from the longest of years (Miyazaki) to the lowest of years (Ishikawa) (*3). The coefficient of variation was 6.19% thus indicating a dispersion much larger than 0.65% for The primary industry rate (proportion of workers engaged in primary industry) will be used in this paper as the index illustrating the degree of urbanization of each prefecture. The prefectural correlation between the primary industry rate and the life expectancy at birth is given in Figure 1. The primary industry rate of prefectures excluding the 7 major prefectures of Tokyo, Kanagawa, Aichi, Kyoto, Osaka, Hyogo and Fukuoka showed a range of 49 to 75% which include prefectures with conspicuously different levels of life expectancy at birth. Therefore, if limited to this area, there is absolutely no correlation between the primary industry ratio and the life expectancy at birth. -67-

48 As is indicated by the dotted lines in Figure 1, the majority of prefectures with relatively higher levels of life expectancy at birth were those located to the West of Kyoto. Meanwhile, the life expectancy of the seven major prefectures were below the nationwide level. In particular, Osaka which recorded the lowest within this group and Tokyo showed low levels in the nationwide comparisons as well ranking 4th and 5th from the lowest, respectively. As mentioned above, the pattern of high mortality in major urban prefectures and low mortality rates in rural prefectures of Western Japan was a marked characteristic of the time. The simple coefficient of correlation was showing a slight negative correlation. However, this characteristic disappeared rapidly after this period. The three prefectures which ranked the three lowest were lower by far compared to other prefectures. They are, in order from the lowest, Fukui, Toyama and Ishikawa in the Hokuriku region. (2) First Half of 1930's During the first half of the 1930's, ( ), ten years from the above, the life expectancy at birth of 7 major urban prefectures very much improved compared to other prefectures (*4). For instance, in the first half of the 1920's, each level of life expectancy at birth in the 7 major prefecture ranked as follows in the nationwide comparison; Fukuoka 25th, Hyogo 31st, Aichi 34th, Kyoto 37th, Kanagawa 41st, Tokyo 42nd and Osaka 43rd; however, the life table for the period of 1931 to 1935 showed an overall rise in the ranking of the 7 prefectures; Tokyo 11th, Kanagawa 19th, Hyogo 24th, Kyoto 27th, Aichi 28th, Fukuoka 30th and Osaka 34th. The rise in Tokyo was remarkable (See Fig. 5). Moreover, in terms of growth rates in life expectancy the seven major urban prefectures registered high growth rates with Tokyo ranking 1st with 25.2% and Kanagawa (22.9%) Osaka (19.1%) and Kyoto (14.2%) positioning 2nd, 3rd and 6th respectively. With respect to prefectures other than the seven mentioned above, as indicated in Fig. 2, the majority with the exception of the 3 prefectures in Hokuriku, are concentrated in the range of 45 to 50 years of life expectancy at birth. Coefficient of variation of life expectancy at birth of all the prefectures was 4.74%, a considerable reduction in comparison with 6.19% of a decade ago. Also, as is instantly clear from the Fig. 2, there was almost no correlation between the primary industry rate and the life expectancy at birth. Simple coefficient of correlation was (3) 1950's -68-
 indicates that the maximum life expectancy was marked by Tokyo with 67.09 years whereas the minimum was recorded by Akita with 61.93 years.")
49 By the mid 1950's, the nationwide life expectancy reached years (male years, female years). The life table by prefectures prepared for 1954 to 1956 (*5) indicates that the maximum life expectancy was marked by Tokyo with years whereas the minimum was recorded by Akita with years. Coefficient of variation was 1.93% demonstrating a further decline from 4.74% of the early 1930's. As pointed out in the above, the improvement rate of life expectancy of major rural prefectures was generally conspicuous as compared to other prefectures from 1920's to 1930's. Accordingly, as indicated in Fig. 3, the seven major prefectures are found in higher levels bracket as compared to others with comparison of their life expectancy at birth, with Tokyo and Kanagawa positioned at first and second place respectively. Although there seems to be very little correlation of life expectancy at birth and the primary industry ratio of prefectures with the exception of the seven major prefectures, the simple coefficient of correlation of all the prefectures, inclusive of the seven, showed a negative correlation of The three prefectures of Hokuriku region no longer shows the lowest level of life expectancy at birth. (4) 1970's For the three year period covering the national census of October 1, 1970, there exists a variety of life tables providing useful data for the study on urban-rural differences in mortality (*6). They include life tables not only for prefectures but also for individual metropolitan cities and for different sizes of locality. The following illustrates the figures of life expectancy at birth of such area groups (given in years). The Table reveals that, with the exception of Kita-Kyushu city and Osaka city, the order in terms of life expectancy at birth is formed clearly according to the size of its population with the metropolitan cities at the top followed by other city groups with a population of more than 300,000, cities with a population between 150,000 and 300,000, cities with a population less than 150,000 and town and village groups. Also, it is worthy to note that although the difference between Kawasaki city ranked at the tope with years and town and village groups in the northern area were at the bottom with years. This is a marginal difference of less than 2 years. There is a clear trend towards mortality rates being lower in urban areas and higher in rural areas. -69-

50 Region Male Female Average Kawasaki Wards of Tokyo Yokohama Kyoto Sapporo Fukuoka Nagoya Kobe Cities with population of more than 300,000* Cities with population of more than 150,000 but less than 300, Nationwide Cities with population of less than 150,000 (North) ** Cities with population of less than 150,000 (South) Kita Kyushu Osaka Municipalities (South) Municipalities (North) Notes Excluding designated cities (cities listed in the above) Areas to the north of Fukui, Gifu and Mie. The others are included in the south
, prefectural differences on life expectancy at birth were further reduced to register a coefficient in variation of 0.65% (0.")
51 (5) 1980 The life table for 1980 (*7) shows that nationwide life expectancy at birth for that year was years (male years, female years). According to the life table by prefectures for the same year (*8), prefectural differences on life expectancy at birth were further reduced to register a coefficient in variation of 0.65% (0.96% in 1970). The highest level of life expectancy was marked by Kanagawa with years while the lowest was years in Aomori. The difference was merely 2.16 years. The prefectural coefficient of correlation between the primary industry rate and life expectancy at birth showed a negative correlation of (Fig. 4) Observations of data up until 1980 discussed above revealed that there has been a transition of trends during the said period; in other words, although in the 1920's there had been an positive correlation between low levels of primary industry rate and low life expectancy at birth (i.e. high mortality), the trend later turned to show a negative correlation of prefectures of low primary industry rate recording higher life expectancy at birth (low mortality). 3. Changes in the Order of Life Expectancy at Birth by Prefectures During the period from 1920's to to 1980's, the mortality rate in Japan declined substantially and as a result life expectancy at birth increased by years from years in in the period of of 1921 to 1925 to years in As mentioned earlier, a remarkable reduction in prefectural differences in mortality was observed during this period. In addition, it is also worthy to note that this period may also be characterized by drastic changes in the prefectural order of mortality levels. According to the prefectural life table of 1921 to 1925, the top 10 prefectures with longer life expectancy at birth were Miyazaki (longest), Nagasaki, Kagoshima, Nagano, Tottori, Kumamoto, Wakayama, Ehime, Okayama and Kochi. Except for Nagano, they are all located in the western part of Japan, and in particular, six of these are in Shikoku and Kyushu regions. On the other hand, the prefecture life table of 1980 shows that of the 10 prefectures mentioned above Okayama (2nd), Nagano (4th) and Kumamoto (10th) remained in the top ten of the ranking for life expectancy at birth. In observing the trends of prefectural order of life expectancy at birth in the 5 different periods from , , , 1970 and 1980 from their respective prefectural life table, Okayama not only continued to record high levels of ranking but also showed improvements (9th, 9th, 6th, 2nd, 2nd). -71-

52 Similarly, Nagano maintained itself at high levels (4th, 1st, 5th, 9th, 4th). Kumamoto's position in the respective period was 6th, 6th, 21st, 28th and 10th. As is evident, although its ranking dropped temporarily during , it regained to the 10th position in On the contrary, sharp drops were observed in 1980 for the prefectures of Kagoshima, Nagasaki, Kochi, Wakayama and Miyazaki which recorded the 45th, 42nd, 38th, 37th and 33rd respectively. Meanwhile Ehime was 16th and Tottori 19th. On the other hand with respect to life expectancy at birth in the 10 prefectures with the lowest lengths, the three prefectures of Hokuriku, namely Ishikawa (the lowest), Toyama and Fukui constituted the bottom group followed by a second group of major urban prefectures of Osaka, Tokyo and Kanagawa, and then by the three prefectures of Tohoku, namely Aomori, Iwate and Akita. The 10th from the bottom was Kyoto. The rankings of 3 Hokuriku prefectures went up substantially on the 1980 life table. Of the three, Fukui rose sharply to 7th, whereas Ishikawa and Toyama ranked 20th and 25th, respectively. On the life table, Tokyo and Kanagawa were each placed with improved high ranking of 11th and 19th. After World War II, although Tokyo once rose to the top position, it ranked 3rd in Meanwhile, Kanagawa accomplished the first position in Kyoto was recorded in second place during , but later, in 1980 ranked in 8th position, Osaka which climbed to 14th place in 1970 later dropped to the low rank of 40 in Aomori, Akita and Iwate continuously remained at the lower levels all through the past period with their respective positions at 46th, 41st and 36th in During the period from 1920 to the 1980's, if minor irregularities are to be ignored, it can be said that there have been two different patterns of prefectures' behaviour with respect to their rankings in the life table. In other words, the group of 17 prefectures experienced a remarkable uprise in their ranking of life expectancy at birth, while the other group of 18 showed a relatively substantial decline. Fig. 5 illustrates the changes of the two groups with respect to 5 periods from , , , 1970 and The first group of 17 prefectures includes major urban prefectures and their neighboring prefectures of Saitama, Chiba, Tokyo, Kanagawa, Aichi, Gifu, Mie, Shiga and Kyoto, three from Hokuriku, and Shizuoka, Shimanp, Okayama, Hiroshima and Kagawa. The latter group of 18 prefectures is comprised of Hokkaido, Aomori, Iwate, Akita, Fukushima, Tochigi, Ibaraki, Yamanashi, Wakayama, Tottori, Yamaguchi, Tokushima, Ehime, Kochi, Nagasaki, Oita, Miyazaki, and Kagoshima. -72-

53 4. Regional Differences of Mortality by Age (1) Age Patterns of Mortality A simple way of comparing regional age patterns of mortality will be taken below by means of selecting a number of exemplary areas with particularly high and low mortality rates and comparing their respective patterns of age at death with that of the nationwide level. The source of the data employed is probability of dying sqx 54x by sex taken from the nationwide life table and the life table from prefectures for Chosen for their high mortality were Aomori and Kagoshima, while ward area of Tokyo prefecture and Nagano prefecture were chosen as the areas of low mortality. The former two were chosen from eastern and western parts of Japan, respectively, whereas the latter two were chosen from urban and rural areas, respectively. In terms of the prefectural ranking for the life expectancy at birth for 1980; Aomori ranked 47th for male and 44th for female, Kagoshima 43rd for both sexes; the ward area of Tokyo prefecture as next to 4th place for male and next to 11th place for female, Nagano ranked 3rd and 9th, for male and female, respectively. Ratios of 59x (x = 0.5,... 80, 85) for each of the above areas were calculated by sex of nationwide life table as 100. (Fig. 6) Characteristics common to both Aomori and Kagoshima are a larger deviation in younger ages and a smaller deviation toward older ages. This may not be especially limited to the above two prefectures, but may be seen, to some extent in many of other areas. This will be known by comparing coefficients of variation of prefectural- mortality rates by age. In general, there is a trend for these prefectural variations to become larger in the younger generations and smaller in the senior generations. For example in 1980, in the case of male, whereas the coefficient of variation of m was as as high as 20.4%, that of 5975 On was merely 4.7%. Regarding Nagano, it has already been mentioned that despite its relatively rural nature, it has traditionally kept low levels of mortality. In comparison with the nationwide level, the mortality rate was conspicuously low for both sexes in the age groups of middle and early elderly age. Concerning th younger generation, the male mortality in their teens was remarkably lower than the nationwide level, on the contrary, those for the females of the same age group were higher than the nationwide level. With respect to mortality rate of the ward area of Tokyo, two characteristics were observed: One is that the rate is substantially lower than the national level for both sexes in their late teens to early twenties; the other is that the rate for those between their -73-

54 late thirtees to 50s is comparable to that of the nationwide level. This difference in the mortality rate by age patterns in Tokyo and Nagano is interesting to note, since there is very little difference between their respective life expectancy at birth. (2) Period Changes of Prefectural Distribution of Mortality by Ages For example, when the preferectural distributions of mortality for 1925 and 1980 are compared, there is absolutely no preferectural correlation observed between the two years in terms of overall mortality levels. The coefficient of correlation which is calculated by using standardized mortality (standardized on the basis of the sex-age composition of population for all Japan for 1930) was When the coefficient of correlation for each age-specific rate of mortality is caluculated for male, it is found that the coefficient of correlation was between to for age groups from 0-4 years to years, respectively, and thus no correlation is seen in any of the above age groups (*9). However, the coefficient of correlation increases as age increases with 0.296, and for the age groups of 65-69, and years, respectively. For those above 80, the coefficient again dropped to Figure 7 is an illustration of the prefectural correlation of mortality rates of for age group between 1925 and According to the figure, with the exception of Tokushima and Nagasaki, a fairly strong correlation is observed between 1925 and 1980, and a relatively low level of old age mortality in western Japan was recorded in both years. If Tokushima and Nagasaki are excluded, the coefficient of correlation would be raised from to It can be said that in such higher age groups, the prefectural distributive pattern demonstrated by the corresponding age group in 1920's have been retained to some extent even to the present day. Those in the age group of years in 1980 were between 20 to 24 years in However, the prefectural correlation between male mortality rates of the age group of years in 1925 and that of 75 to 79 years in 1980 is not recognized at all because the coefficient of correlation is merely Thus the older pattern of prefectural distribution for mortality in age group found in 1980 may not be a pattern survived as a cohort phenomenon from Could it be said that there exists a strong age-effect? This question remains to be answered through future studies. 5. Differences in Mortality Rates, Causes of Death between Urban and Rural Areas -74-

55 According to the comparative study of mortality between rural and urban areas for 1965 conducted by Watanabe et al (*10). Using the mortality rates standardized on the basis of nationwide population of 1960, the mortality per 1,000 population was 6.9 and 7.4 for rural and urban areas, respectively, with the mortality rate of rural areas higher by 7%. Nevertheless, in terms of the causes of death there are a number of causes which showed higher mortality rates in urban areas. Namely, mortality rate of diabetes, tuberculosis, malignant neoplasm and cirrhosis of the liver were higher in urban areas. Death rates caused by gastroenteritis, accidents and suicide are higher by far in rural areas. However, although the urban-rural differences are not so large, it is these diseases, with a high mortality rate, such as cerebral blood vessel disease and apoplexy that are exerting the greatest impact in raising the mortality rates of all the causes of death in the rural areas. They are followed by deaths due to accidents. It should be noted here that the above phenomenon summarizes a nationwide trend and thus differences will be found when analyzed by each prefecture. To illustrate, whereas on a nationwide level, the mortality rate of all the causes of death is higher in rural areas, 15 out of the total of 46 prefectures have shown higher mortality rates in the urban areas. Regarding the mortality caused by malignant neoplasm, while the rural area has shown a higher rate on a nationwide level, there are as many as 41 prefectures, an overwhelming majority, which has demonstrated higher mortality in the urban area. On the other hand, although mortality of of cerebral blood vessel disease and apoplexy is higher in the rural areas when seen on a nationwide level the number of prefectures actually recording higher rates in the rural area, is limited to only 27. Furthermore, observations of mortality rates in cause of deaths were made by way of classifying seven major cities (Tokyo, Yokohama, Nagoya, Kyoto, Osaka, Kobe and Kita-Kyushu) as one group and theremaining cities as the second and rural areas as the third group. As a result, it was discovered that mortality rates with apoplexy, heart disease, pneumonia, bronchitis, stomach and duodenal ulcer, nephritis nephrosis, senescence, accidents and automobile accidents were the lowest while tuberculosis, malignant neoplasm, diabetes, arteriosclerosis, heart disease, hypertony, cirrhosis of liver were highest in the seven major cities. On the whole, it was also found, that the mortality of other cities than the seven mentioned had the lowest level of all. 6. Conclusion -75-

56 During the period since 1920 until the present, the time highlighted by this paper, Japan experienced a remarkable decline on a nationwide average level of mortality. Furthermore, such a decline was accompanied by absolute as well as relative reduction of regional differences in mortality as measured by preferectural data. In the early 1920's, though not so strong, a correlation of higher mortality in more urbanized areas and lower in more rural areas was observed. The factor that weakened this correlation was a large difference in mortality seen among various rural prefectures. This was characterized by a contrast of high mortality in the east (inclusive of Hokuriku) and lower mortality in the west. With respect to prefectures excluding 7 major ones already mentioned, no correlation whatsoever was observed between the primary industry rate and mortality level. From the data concerning the early 1930's, a relative rise of life expectancy was seen in seven major urban prefectures. After World War II, lower mortality in more urbanized areas and higher mortality in more rural areas became a general tendency, a reversal from the pre-war picture. This relationship is evident on the 1970 life tables compiled by large, medium, and small cities, and other municipalities
57 Fig. 1 Prefectural Correlation between Proportion of Primary Industry and Life Expectancy at Birth (Average of Both Sexes): Proportion of Primary Industry 1920, Life Expectancy at Birth years Prefectures west of Kyoto / 11 '' 0 \ it% I dp). 1 0,..."'' / S / L ife expectancy at birth Seven major urban/ prefectures O F I 1 ill...---,...a, /....'' / /-;,' I `s, / 1 dp) Three prefectures of Hokuriku % Proportion of primary industry 77
: Proportion of Primary Industry 1930, Life Expectancy at Birth 1931-35 78")
58 Life expectancy at birth years Seven major urban prefectures, 1..., i 0, 0 e ft..,,,.. 1 t. i a * 0 ; 6:Three prefectures of Hokuriku % Proportion of primary industry Fig. 2 Prefectural Correlation between Proportion of Primary Industry and Life Expectancy at Birth (Average of Both Sexes): Proportion of Primary Industry 1930, Life Expectancy at Birth

59 Fig. 3 Prefectural Correlation between Proportion of Primary Industry and Life Expectancy at Birth (Average of Both Sexes): Proportion of Primary Industry 1955, Life Expectancy at Birth years L ife expectancy at b irth 65 Seven major urban prefectures wo...w I i a 1 % P %., / I '. O N., P : P It Three prefectures of Hokuriku 60 T- I i I I I % Proportion of primary industry 79

60 Fig. 4 Prefectural Correlation between Proportion of Primary Industry and Life Expectancy at Birth (Average of Both Sexes) 1980 L i fe expectancy at birth years Seven major urban prefectures /0.11,.. II *P. i 4.. 1:1 rf,. f... a 0. : It '. e I* ".:r..; I '0 30% Proportion of primary industry -- 80
 Prefectures Showing Strong Rising Trend 1921-1931- 1954-1970 1980 1925 1935 1956-81- Kanagawa Okayama Tokyo Kagawa Shizuoka Fukui Kyoto Hiroshima Chiba Mie Aichi")
61 Fig. 5 Life Expectancy at Birth; Changes in the Order of Prefectures Order by prefectures (1) Prefectures Showing Strong Rising Trend Kanagawa Okayama Tokyo Kagawa Shizuoka Fukui Kyoto Hiroshima Chiba Mie Aichi Shimane Gifu Saitama Ishikawa Shiga Toyama
62 (2) Prefectures Showing Strong Declining Trend Order by prefectures _ kw., 1 9 _ _ 13 _ _ k% \ 16 _ t \ _ JI 82 Ehime Yamanashi Tottori Yamaguchi Oita Miyazaki Hokkaido Fukushima Iwate Wakayama Kochi Ibaraki 41 Akita 42 Nagasaki 43 Tokushima Tochigi "IIIIIVAI Kagoshima 46 Aomori
63 Index I Female I ti`. Aomori Prefecture Kagoshima Prefecture r" Female Nagano Prefecture Male 110, 23 Wards of Tokyo : I5 50 6I Age x Fig. 6 Ratios of 5qx by Sex for Aomori, Nagano, Kagoshima and 23 Wards of Tokyo to 100 5qx for All Japan:

64 Fig. 7 Correlation of PrefecturalMortality between 1925 and 1980: Males in Age Group % Mortality in Tokushima t f 1 t 1 t 1 t 1 I t i t t i Nagasaki a I i I a e % /I \N... %, It I i, 0 I 1 I. I t I % I Os % I 0 lae i I SO : / I I, (1. 01ri 1 Prefectures west of Kyoto r,.: ' 1.0 I.' 5 _ i 0. i: % t I i P *...P % Mortality in
 Since the data of Okinawa prefecture was not available for certain period of years after the war, Okinawa was excluded from the years covered to assure appropriate comparison.")
 Based on the information mentioned in item (2). Although life tables by prefectures exist for 1931-1935, nationwide life table were not compiled for the same period.")
65 Notes (*1) Ministry of Health and Welfare The 15th Life Tables. Tokyo. (*2) Mizushima, Haruo A Collection of Prefecture Life Tables, Japan, Osaka, Seimeihoken Bunka Kenkyujo. (*3) Since the data of Okinawa prefecture was not available for certain period of years after the war, Okinawa was excluded from the years covered to assure appropriate comparison. The same is true for the calculation of coefficient of variation. (*4) The proportion of those employed by the primary industry among the total number of employees (both sexes). (*4) Based on the information mentioned in item (2). Although life tables by prefectures exist for , nationwide life table were not compiled for the same period. (*5) Based on the information same as above. (*6) Ministry of Health and Welfare The 13th Life Tables. Tokyo. (*7) Based on the information listed in item (1) (*8) Ministry of Health and Welfare Showa 55 nen chiiki betsu seimeihyo (Life tables by regions, 1980). Kosei-no-shihyo, Special 1982 edition, Volume 29, No.16. (*9) Institute of Population Problems, Ministry of Health and Welfare Standardized Vital Rates by Prefectures: Research Series, No Tokyo. Institute of Population Problems, Ministry of Health and Welfare Standardized Vital Rates by Prefectures: Research Series, No Tokyo (*10) Watanabe, Sadamu et al. Noson no Kenko fukushi shiriizu, Volume 25, No.1 ppl-46,
66 CHAPTER 4 MIGRATION AND RURAL DEVELOPMENT Yoichi Okazaki Director-General Institute of Population Problems Ministry of Health and Welfare
67 Tables, figures and notes are attached at the end of the chapter.

68 Introduction During the early Meiji period, when modernistic developments were begun in Japan, the majority of the population lived in rural areas. About 100 years later, at the present, the majority of the Japanese population lives in urban areas. Urbanization accompanying economic and social development is a phenomenon common in all nations, but in regards to Japan, it can be said that its progress was especially remarkable. However, it was not until after World War II that urbanization had progressed especially rapidly; progress before the war was comparatively slow. Before the war, rural areas and the agricultural industry played an important part in the modernization and industrialization of the Japanese economy as the source of supply for population and labor force. As a result, the relative status of the agricultural population declined, however its absolute status was maintained by political measures. This is indicated, for example, in the fact that although the proportion of those employed in the primary industry to the total number of employed declined gradually, the actual number of those employed in the primary industry showed hardly any changes. It is also indicated in the fact that the bulk of migrators to the cities before the war were younger sons, while the eldest son remained in the rural areas. It is thought that post-war migration and urbanization are both quantitatively and qualitatively different than those which occurred before the war. Economic development was well under way by around 1955, and within time, a remarkable concentration of capital, technology, and labor force occurred in cities, especially coastal industrial zones suited for heavy chemical industries, the leading industry at that time. The rapid increase of job opportunities induced migration from the rural regions, thus causing a mass migration to the cities. As a result, the actual number of those employed in the primary industry including agriculture had decreased, as opposed to the pre-war period. The number of those employed in the primary industry was about 1.6 million in 1955, but 10 years later (1965) that number was not more than 1.2 million, and finally about 6 million in Needless to say, the conspicuous population decrease in rural areas and in the agricultural industry while accompanied by high economic growth, has had large effects. In comparison with the pre-war period, the living standards of the Japanese people has generally progressed or improved remarkably, especially in rural areas. The theme of this chapter is to analyze this process of improvement from the viewpoint of migration. -89-

69 1. Outline of Migration 1955 was a period when almost all of the economic indicators had returned to the standard of pre-war peacetime ( ), and the new post-war economic system had started functioning on a full scale. It can be said that the full-scale progress of the Japanese economy had sprung from this period. By chance, the "Migration Report Based on Resident Registration" was to be published every year from 1954 by the Bureau of Statistics, Office of the Prime Minister (presently the Bureau of Statistics, Management and Coordination Agency,) and we are able to obtain migration data during important periods regarding this theme. These statistics concern the number of migrations between each city, ward, town, and village (in 1954 there were 8,197 such municipalities in Japan.) Later, municipalities were incorporated and the number decreased to 4,891 in 1955, 4,049 in 1956, and 3,863 in The number has stablilized around the 3,380 mark since Needless to say, the number of migrations has been affected by the incorporation of municipalities. However, it is thought that these effects are small excluding a few years in the late 1950's. First, looking at Fig. 1 "Changes in the Total Number of Migrations between Cities, Wards, Towns, and Villages (including those within and between prefectures) we can point out the following characteristics. First, the number of migrations increased rapidly from 1955 through the late 1960's. The number of migrations in 1955 was 5.14 million, increasiang to 7.38 million in 1965, and recording the maximum of 8.54 million in During this period the Japanese economy had developed extremely smoothly, and the data shows that migrations had intensified in accordance with economic development. Second, the number of migrations has been declining since 1973 and throughout the late 70's and the early 80's. In 1980, the number was 7.07 million; in 1983, 6.67 million. This period corresponds with the economic transition period following the "oil crisis," and has had effects on migrations which we cannot overlook. Third, a short-term fluctuation in migration is indicated quite clearly from the growth rate of the number of migrations in comparison with the previous year. There were several prosperities and depressions that took place since 1955 during the economic development, and it is interesting to note that they have affected the growth rate of the number of migrations. The causes of migrations are not solely economic such as job opportunities or income differences but are more diverse housing conditions or afforestation conditions - these will be mentioned later on - but generally it can be said that economic factors are influential

70 The total number of migrations is collected and published in accordance with two categories: The number of migrations within that prefecture, and the number of migrations between prefectures. The proportion of the above two in the total number of migrations is nearly fifty-fifty throughout the observation period, but if we are to point out a long-term change, the number of migrations within a prefecture was a little over 50 percent until about While during the following 10 year period, the number of migrations between prefectures slightly surpassed the 50 percent mark. After that, the number of migrations within a prefecture again exceeded 50 percent. The fact that there were many municipalities in 1955 and the following few years, could be one considered as a reason why the number of migrations within a prefecture increased. However, it is thought that the increased number of migrations within that prefecture from the late 1960's up to the present, reflects a change in the actual condition of migration. As will be mentioned later, this is because, at the present, long-distance migrations toward the metropolitan areas which were seen during the high economic growth period, have decreased relatively, and comparatively short-distance migrations within a prefecture have increased. Regarding rural development, the theme of this report, migrations within a prefecture and migrations between prefectures are both significant. However, from the viewpoint of statistical data., it is impossible to analyze the former any further. Therefore, we will conduct further examinations concerning migrations between prefectures. Table 1 shows the number of migrations between prefectures by type. Presently, there are many diverse regional characteristics within the 47 prefectures of Japan, such as extremely urbanized regions, in contrast with regions that are heavily laden with agriculture, or the intermediate regions. In order to clarify changes in migrations, in this study Japan was divided into two regions, the metropolitan areas and other areas. We have included the Tokyo metropolitan area (Saitama, Chiba, Tokyo, Kanagawa), Chukyo metropolitan area (Gifu, Aichi, Mie), and Hanshin metropolitan area (Kyoto, Osaka, Hyogo) in the former, and the remaining 37 prefectures in the latter. It is needless to say that the metropolis and prefectures of Tokyo, Osaka, and Aichi which are the centers of the aforementioned metropolitan areas, are urban regions. The various prefectures surrounding these centers have increasingly become areas to commute from in recent years. However, it would be better to consider more accurate divisions, using such methods to include densly populated district (*1). However, it is difficult to execute such divisions since raw data is classified according to prefectures. According to Table 1, the change in the number of migration by the four migration types, becomes clear, based on the establishment of the metropolitan and non-metropolitan areas mentioned before. 91

71 First, regarding the trend of migration from non-metropolitan areas to metropolitan areas (in other words, migration from rural regions to typical urban regions,) there was a movement from 1955 to Afterwards, the trend became stagnant temporarily, then increased to reach a maximum in 1970, and has since showed a decreasing trend up to this present day. Such trends have corresponded perfectly with the economic development. In contrast, the trend of migration from metropolitan areas to non-metropolitan areas (in other words, backward migration) had increased steadily since the latter half of the 1950's, and after reaching a maximum in 1973 it has been decreasing steadily ever since. The empirical theory since Ravenstein states that a migration toward a fixed direction is always accompanied by a reverse migration, and the situation in Japan confirms this. However, its contents and causes propose some very interesting questions that still need to be solved. Migrations within metropolitan areas between the 10 urban prefectures included in the metropolitan areas had also increased steadily between the latter half of the 1950's until 1973, and have decreased steadily since then. Migrations within metropolitan areas are mainly migrations from the central part to its surrounding regions. This is a special migration, since the reason is usually housing conditions. Lastly, extremely various types of migrations are included within non-metropolitan areas (migrations between the 37 prefectures); however, fluctuations are not so big, as can be seen from the table. If we conduct further studies, we find that the scope of migrations is comparatively restricted, and generally, a large number of migrations are seen between neighboring prefectures located just a short way off. Please note that the extremely important change indicated in Table 1, is the change of the excess number of people moving into a metropolitan area. This is the difference between the number of people moving into a metropolitan area from non-metropolitan areas and the number of people moving out from metropolitan areas. The greatest difference was 655,000 recorded in However, that number has declined since then, and the difference has been nearly 0 since In fact, excess emigration has been recorded for certain years. It can be said that fluctuations of post-war migrations can be seen most vividly in the changes of excess immigration to metropolitan areas. This shows that metropolitan areas had played a large part in the post-war high economic growth, while clarifying the details how these metropolitan areas had accomplished their missions and how we entered a new stage called "the age of locality." Moreover, there are indications of increases in excess immigration to metropolitan areas once again, but this is due to increases of immigration only to the Tokyo metropolitan area. No such -92-
 a large number of migrations occurred in the last 20 years, especially to")
72 indications are seen for the Chukyo and Hanshin metropolitan areas. The aforementioned is the outline of migrations from 1955 up to the present, in which two facts, were confirmed: (1) a large number of migrations occurred in the last 20 years, especially to metropolitan areas, and (2) a new movement has begun in the past 10 years. 2. Transfigurations of Migration Patterns It is necessary to clarify the characteristics of migrators according to their ages when considering what effect migrations had had toward rural areas. This is also important when considering the causes of migrations. The "Migration Report Based on Resident Registration" which was utilized in the former section does not indicate the ages of migrators. Because of this, a different statistical data must be used for this section. The national census is one statistical data from which we are able to see the ages of migrators. In the census conducted in, 1960, 70, and 80, either the place of residence (for the 1960 census), or the former place of residence and the time when the migrator came to the present place of residence were surveyed. From this we can obtain information concerning the ages of migrators. Table 2 shows this according to sexes. Table 2 shows that high migration rates are common in the three age groups of 15 to 19 year olds, 20 to 24 year olds, and 25 to 29 year olds. According to the information for 1970 and 1980, a considerably high migration rate is seen for 30 to 34 year olds. For age groups older than that, migration rates tend to decline. On the contrary, the 1980 result shows that migration rates became higher for people over 70. This point should be noticed at a time when the aging of population is expected to proceed in the future. Moreover, a high migration rate is seen for infants under the age of 5. This is, of course, a subordinate migration accompanying the migration of their parents. When comparing the three periods 1960, 1970, and 1980, we find that the maximum migration rate for each age group was recorded in 1970 and then declined somewhat in However, it should be noted that the migration rate for elderly people over the age of 75 has been rising over the past 20 years. The fact that the migration rate is declining as a whole is understandable from the general survey of the former section, but the reason for the rising migration rate of the elderly must be clarified

73 Lastly, when looking at migration rates according to sexes, it can be said that generally the migration rate of men is higher than that of women. This is particularly true for age groups between 15 to 30-34, who migrate quite frequently. However, regarding the elderly over the age of 65, the migration rate of women exceeds that of men. It is supposed that this point is related to the cause of migrations of the elderly, and is also an important subject for examination. In the aforementioned we have examined migration rates according to sexes and ages on a national basis (and not according to areas). As a result, it has become clear that both young men and women between the ages of 15 and mid 30's migrate quite often. Next, when looking at migrations according to areas, we must also examine the migration situation according to sexes and ages. Table 3 shows the calculated results of net migration rates for the four areas of Tokyo (center of metropolitan area), Chiba (area surrounding Tokyo), Aomori (representing rural areas), and Ibaraki (representing neighboring areas of the Tokyo metropolitan area). Unlike the results of the National Census migration survey shown in Table 2, the net migration rate in this case was calculated indirectly by the so-called "census surviving rate method." Table 3 shows the net migration rate for the six periods of , , , , , and Regarding ages, only the age groups which migrate most frequently (obvious from the aforementioned points) are shown. They consist of four groups: (1) the age group where the ages at the beginning of each observation period (for example, the year 1950 for the period extending from 1950 to 1955) were and the ages at the end of the observation period (in this case, 1955) were 15-19, (2) the age group where the ages at the beginning of the observation periods were 15-19, (3) 20-24, and (4) Moreover, migration rates were calculated according to sexes in this case also, but the difference in sexes is not so substantial while concerning the following important characteristics. First, when looking at Tokyo (central part of a metropolitan area), we find that there is a high incoming excess rate throughout all of the observation period for the age groups where the ages at the beginning of observation periods were and But the incoming excess rate has been declining steadily since 1950 to the present day, and the recent incoming excess rate for the younger age group has been extremely low, in particular. From to , the incoming excess rate for the age group where the ages at the beginning of observation periods were was higher than that of the age group, but the incoming excess rate for the latter has become higher since then

74 The age groups which show even more conspicuous changes in the net migration rate are the groups a few years older than the aforementioned. In other words, the age groups where the ages at the beginning of observation periods were and These age groups showed incoming excess during the and periods but have been showing outgoing excess since 1960; moreover, this situation has been intensifying with the passage of time. Regarding Chiba (surrounding area of the Tokyo metropolitan area), young age groups in particular showed outgoing excess for the and periods. Since then, however, incoming excess was recorded for all age groups, and in particular the incoming excess rates of comparatively older age groups has been considerably high. At first, Chiba had been the supply area of the younger population for Tokyo, but later on became both the reception area for immigrators into the Tokyo metropolitan area from rural areas, and the area for people emigrating from Tokyo mainly due to housing conditions. These facts can be observed from the table. Next, looking at Aomori (rural areas in contrast with metropolitan areas), we find that emigrating excess has been recorded for all age groups throughout all observation periods extending from 1950, except for recent years. The emigrating excess rate is high for comparatively younger age groups, and was especially high for the and periods. However, the "emigration" has relaxed somewhat since then. Ages groups where the ages at the beginning of observation periods were and used to record emigrating excess, but have recently reversed to record immigrating excess; furthermore, it should be noted that the immigrating excess rate is considerably high. Lastly, when looking at Ibaraki, we find a similar situation to that of Aomori. Besides the fact that the excess rate of immigrating excess areas has been slackening rapidly (because Ibaraki is located next to a metropolitan area), the change from emigrating excess to immigrating excess occurred at an early stage and since then the immigrating excess rate has been rising. In the aforementioned paragraphs we have seen the transfigurations of migration patterns since Two facts have become clear: (1) the intense immigration of young people to metropolitan areas during the high economic growth period, (2) the marked transfiguration since the conversion to low growth economy in the late 1970's. 3. Causes of Migrations and the Significance of Rural Development As a general consideration, many causes (economic, social, political, etc.) are cited for migrations. However, regarding the -95-
 is indicated as the most fundamental cause. In fact, in contrast to the national growth rate of employed during the 1955-60 period (11.")
75 mass migration from rural areas to urban areas during the post-war high economic growth period, the expansion of job opportunies in industrial areas (where leading industries were located at that time) is indicated as the most fundamental cause. In fact, in contrast to the national growth rate of employed during the period (11.3%), the growth rates of the three metropolitan areas were especially high, with the Tokyo area recording 28.2%, the Hanshin area 24.0%, and the Chukyo area 16.6%. Similarly, the national growth rate during the period was 9.0% in comparison with 24.1% for the Tokyo area, 20.5% for the Hanshin area, and 11.2% for the Chukyo area. Contrary to this, in areas other than the above where a mass emigration population and labor force was seen, there were not any growth industries which could compete with the heavy chemical industries (the leading industry at that time.) People also became steadily aware of the existence of an excess labor force in the tide of technological innovations. For these reasons, migrations of population and labor force were movements favorable for the solution of problems related to various industries in these areas. As it turned out to be, these migrations helped to reduce regional differences concerning income levels. When we consider how these regional differences changed by using the prefectural income per person as the index, the highest income in 1956 was V153,287 for Tokyo while the lowest was V48,328 for Okinawa, Tokyo being 3.17 times higher than Okinawa. For a more correct index of differences, the variation coefficient (*2) of prefectural income (*2) Standard deviation divided by the average. per person for all urban and rural prefectures, was calculated to be When a similar calculation is conducted for 1965, the highest income was 2.98 times that of the lowest, and the variation coefficient was Furthermore, for 1976 the highest income was 2.17 times that of the lowest, and the variation coefficient was The difference of prefectural income per person has been growing smaller during the 20 years since the late 1950's, when migration was frequent. Of course, such reductions of income differences were not achieved solely by migrations, but are also the result of the many drafted and enforced regional development policies during that period. These regional development policies, based on industrial promotion in various regions, include a wide range of policies such as the adjustment and improvement of industry-related facilities, transportation and communication facilities, and facilities concerning the livelihood of the people. Furthermore, regarding agriculture, considerations are being made for the support of farm prices, besides the many measures for increasing productivity
 have disappeared, and it can be said that rural areas are actually superior in terms of housing and living")
76 These actions have proved successful, and present living standards have showed marked improvement nationally. The differences between urban and rural areas (such as those seen in the pre-war period) have disappeared, and it can be said that rural areas are actually superior in terms of housing and living conditions to urban areas. For example, the following states the comparison between urban and rural districts, or between farming households and non-farming households. Regarding residences, the number of rooms per residence in urban districts was 4.24 rooms and 5.52 rooms in rural districts. The number of tatami (straw mats) per residence is mats in urban districts and mats in rural districts, and the number of tatami per person is 7.43 mats in urban districts and 8.88 mats in rural districts. ("Housing Survey", Bureau of Statistics, Office of the Prime Minister, 1983.) Also, looking at the propagation rate of major consumers' durables in farming households and non-farming households, the respective rates were: 82.5% and 60.6% for automobiles; 99.7% and 98.9% for electric refrigerators; 99.3% and 98.1% for electric washing machines; and 99.0% and 98.8% for color TV sets. In these terms, farming households again proved superior ("Survey of Consumption Trends: Trends of Household Consumptions," Economic Planning Agency, 1983). The high economic growth which started in the late 1950's and 1960's had great effects upon the Japanese economy and society, thus changing the standards and structures of living immensely. In terms of migration, not only did it cause a mass migration to urban areas, but also, Japan was completely reconstructed into an urbanized society by the urbanization of former agricultural areas. In 1945, when World War II had ended, the urban population comprised 28% of the total population, and in 1955 the urban population jumped to comprise 56%. But in 1980, the urban population further increased, comprising 76%. Even when looking at the population of population concentrated districts (which are, in a strict sense, urban areas), the population of population concentrated districts comprised 60% of the national population in It can be said that at the present, the tides of urbanization have washed away rural districts or nonconcentrated districts to a considerable degree. It is thought that these changes are the fundamental reasons for the remarkable improvement of the quality and standards of living in Japan. It has already been indicated that a noticeable transfiguration in migration pattern could be seen in the late 1970's. One reason for this is that as the economic growth rate of Japan declined, the industrial structure changd and thus, job opportunities in metropolitan areas diminished relatively. The national growth rate of people employed during the period was 4.7%; in comparison, that of the Tokyo area was 6.6%, the Hanshin area 3.0%, the Chukyo area 5.5%. The marked growth observed during the high economic growth period can no longer be seen. Rather, a growth rate higher than the national average is observed in Kita Kanto, Kyushu, and Hokkaido

77 However, at the same time, it is thought that regional differences in income levels and standards of living have become smaller in recent years, and have thus brought about changes in migration patterns. It is obvious that motivations for migration should weaken now that transportation has been developed, and the differences in terms of living have become insignificant, while the conditions in rural areas are in a sense better than urban areas. Furthermore, we cannot overlook the fact that changes in the population structure have contributed to the changes in recent migration patterns. As proven in the former section, the mainstream of migration movements were the young people; however, the population structure of Japan is aging steadily, and the class of younger people (which migrates frequently) is gradually growing smaller. These demographic changes greatly affect migrations. In other words, the late 1950's and 1960's (when migrations became quite frequent) was a period when the migrating age groups were groups comprised of the pre-war age of fecundity, and especially the post-war baby boom. This was also a period when the supply conditions had been prepared to respond to the demand increases in metropolises. We cannot forget that these supply related conditions were partly the cause of the stagnation of migrations in the latter half of the 1970's. Moreover, it must be pointed out that one other demographic condition is important when considering migrations and settlement in the future. That is, a "two-children society" has taken root in post-war Japan, and a so-called "eldest son-eldest daughter society" has been formed. In other words, the number of second and third sons have become smaller. It is thought that this condition might entwine with problems such as, succession of the family profession or aging of one's parents, thus bringing about restrictions in migrations or force U-turn migrations after temporary ones. Regarding this point, the former fact that migration rates for elderly people have been rising recently is extremely important. Most migrations of elderly people are migrations between municipalities within one prefecture and not long-distance migrations between prefectures. This does not mean that children are returning to the place of residence of their aged parents, but rather suggests the possibility that movements in which aged parents move to their children's place of residence will increase in the future. Taking these new migration situations as a premise, we should consider what sort of development measures should be taken in the future. In concluding this chapter, I would like to state my personal opinion using the following data. Table 4 shows (1) the population density to possible residential areas in 1980 according to urban and rural prefectures, and (2) an index which is not used often, the ratio of the population to the prefectural income (population.economic power density)
, Osaka (6609), and Kanagawa (4778), while Hokkaido and the regions of Tohoku, San-in, Shikoku, and")
78 Large regional differences are seen for the population density to possible residential areas. The density is conspicuously high in existing metropolitan areas such as Tokyo (8562 people/km2), Osaka (6609), and Kanagawa (4778), while Hokkaido and the regions of Tohoku, San-in, Shikoku, and Kyushu show low density. In this sense the population should be reapportioned and it is thought that this would be rational from the viewpoint of land utilization. However, looking at the population.economic power density, we see low densities for existing metropolitan areas such as Tokyo (398), Osaka (496), and Aichi (552), while in contrast the densities of other areas are high. Therefore, in this term, the density will be balanced if the population was concentrated further in metropolitan areas. The theme of land development should be the settlement of this contradiction. But if the goal of land development is to correct imbalances by developing new economic conditions, and not just considering measures under the given economic conditions, the first goal in the future should be the reapportionment of economic powers in regions. It is thought that we should turn our eyes from existing metropolitan areas (which have already been developed to a full extent), and, relatively, put our efforts in the development of undeveloped regions

79

80
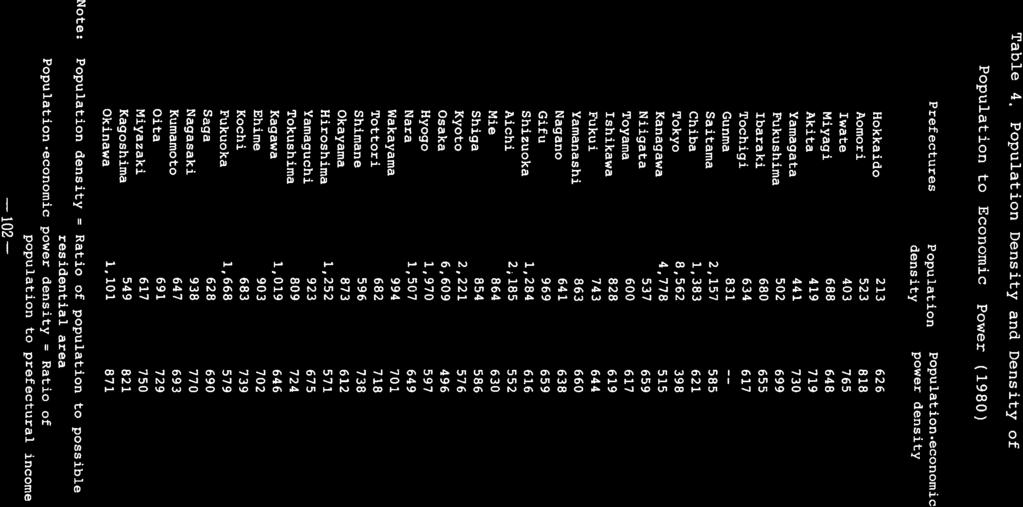
81

82
83
 Standard deviation divided by the average.")
84 Notes (*1) Densly Populated districts are special urban areas which were established by using census survey districts as its unit, and population density and population accumulation as its standard. Census results are also collected according to densly populated districts. (*2) Standard deviation divided by the average
85 CHAPTER 5 POPULATION CHANGES AND DEVELOPMENT IN RURAL SOCIETY Hiroaki Shimizu Chief Migration Research Section Institute of Populaiton Problems Ministry of Health and Welfare
86 Tables, figures and notes are attached at the end of the chapter.

87 Introduction The theme of this chapter is to clarify the problems of rural population changes and development. Here, we will describe and analyze the relationship between the progress of "aging of population" in rural areas, and changes in family or household structures by focusing on regional characteristics, and attempt to approach the given theme. This is because descriptions and analysis from such viewpoints will clarify diversities of changes in the Japanese rural population and its immanent problems; at the same time, I cannot help but think that these descriptions and analysis hold "the resources" to establish development policies corresponding to those diversities of changes in the population. 1. Factors Concerning Analytical Viewpoints of Changes in the Rural Population (1) Diversities in the Social Structure There have been extremely varied arguments up until now regarding how to understand the social structure (The principle of. human relationships immanent within a certain society), but it is thought that "the homogeneous society theory"(*1) expressed by Chie Nakane, has won many supporters. But recently, views opposing this theory have been expressed. Yoshihiko Amino states, "aren't we too familiar with the generally accepted idea that, the Japanese are a lnomogeneous people constituted from the same language and race. Even if we do use the same language and race. Even if we do use the same language, it would be a great mistake to think that communication between fellow Japanese would be smooth and easy. Also, even if the Japanese are a single race, aren't we the race which has one of the most varied facial features, which is mentioned quite often? People often say, I am of the southern stock because, I have large eyes and a dark complexion. But ordinarily we often speak of the facial features of the Japanese according to various stocks, such as the northern stock or Korean stock. I just mentioned that the idea that the Japanese are a homogeneous people is generally accepted. However, it could also be said that the fact that the Japanese are a complex or heterogeneous people may be steadily becoming a matter of common knowledge quite far reaching."(*2) Moreover, Amino states that the east-west differences of racial and social structures which are being observed today "could certainly be traced back to the middle ages."(*3) Then, he states, "it is rather natural to think that this difference is the difference of the social constitution of east and west"(*4) and that "It is not possible to understand this difference by viewpoint such as; which came first and which came later, or which is the essense and which is the modification, from the beginning. This is not such a simple
 Meanwhile, what sort of ideas are there regarding family structures, (*7) which form the basis of this social structure?")
88 problem to be solved by these methods."(*5) Upon these viewpoints, Amino proposes that at present eastern Japan and western Japan" should be regarded as "mutually independent."(*6) Meanwhile, what sort of ideas are there regarding family structures, (*7) which form the basis of this social structure? According to Tokuzo Omachi, with reference to Japanese families, it was formally common for lineal relatives to live under the same roof. But through surveys conducted, Omachi showed that there were families which did not fit the aforementioned fact. These families are families in which, although lineal relatives are living in the same village, couples try to live in independent houses away from other relatives, and try to separate as much as possible meals and household economies. Omachi also states that families of the former type are distributed mainly in "Tohoku (northeastern) Japan", and the latter type mainly in "Seinan (southwestern) Japan".(*8) These studies by Omachi are being continued and developed by Masao Gamo. Gamo has given examples "regarding the basic social institutions of a race such as famines, marriages, and regional societies, heterogeneous factors coexist in Japan."(*9) He has also emphasized the fact that "without understanding the differences" in these basic social institutions, "the Japanese social structure cannot be understood."(*10) Upon these findings, Gamo has expressed 3 types of family structures. The first is "families showing expansion trends" (inheretance by elder sister, or married brothers and sisters living together, and parents and married children living together). Second is " the status quo families" (inheretance by eldest son with parents and married children living together). The third is "families showing contraction trends" (inheretance by youngest child, or couples of different generations (=retired couples) living separately). Also, when looking at the regionalism of these families (meaning there exists a quantitative or qualitative difference in the Japanese society), families of the first type are distributed mainly in northeastern Japan, families of the second type are distributed nationally, and families of the third type are distributed mainly in southwestern Japan.(*11) If we put the various opinions introduced here in order, we see that the two different opinions regarding the Japanese social structure (family structure) are opposed to each other, one opinion being that the Japanese social structure is homogeneous and the other heterogeneous factors coexist with each other. However, when elucidating the social structure (especially the rural social structure), it seems that all of the opinions share nearly the same point of view, they point out the importance of establishing the family structure as the subject of research

89 (2) Analytical Viewpoints of Changes in the Rural Population Do such viewpoints exist in the field of demography? It seems that the major subject of demography researches is the demographic situations on a national scale. But in the early Showa Period ( ) there were researches which noted the regionalism in the phenomenon of the Japanese population. It is said that research based on such viewpoints were promoted by Minoru Tachi. Masao Ueda states that "regarding the characteristics of the population phenomenon in northeastern Japan and southeastern Japan, these studies began when Minoru Tachi conducted demonstrations of the dynamics of population, especially in relation to characteristics of the distribution of standardized birth rate and death rate".(*12) It seems that such analytical viewpoints are carried on by Masao Ueda, Toshio Kuroda, Nobuo Shinozaki, Kazumasa Kobayashi, Yoichi Okazaki, Hidehiko Hama, Kiichi Yamaguchi, Hiroshi Kawabe, and Sumiko Uchino.(*13) It is thought that to compare and contrast changes in the population (the combination of changes in the population size and changes in the age structure)(*14), the theme of our research, by regionalism (To compare and contrast by dividing Japan into 2 regions, northeastern Japan and southwestern Japan)(*15) is by no means an unexpected viewpoint even in demographic research. 2. Trends in Changes of the Rural Population When looking at the situation of changes in the Japanese rural population, the rural population has steadily decreased due to the migration of mainly young people to urban areas from rural areas during" the high economic growth period", which began in the latter half of the 1950s. It is said that this migration phenomena brought about "aging of population".(*16) Then, the problem of how to support the increasing number of elderly becomes a social problem, accompanying changes in the rural population. As is generally known, many elderly people in rural areas lead their daily lives with their households and families. Therefore, in the present situation the support of elderly people in rural areas is mainly dependent on private support. Such problems of changes in the population cannot be but deeply related to family and household structures. Keeping these trends in mind, an attempt will be made here to describe and analyze the subject of population change by limiting the study areas to population variation and age composition, and by incorporating family and household structural factors into the framework of analysis and by focusing on regional characteristics. The description and analysis of the problem will be covered for the period after the year 1955, due to the significant trend shown in the rate of employment in the agricultural industry and "aging of population" after that specific year

90 At this point we are still left with the task of clarifying the index we use when referring to rural communities and rural population. In this paper, a rural community will be defined as a district which has a relatively high population rate engaged in agriculture, and the rural community population will be referred to as "gunbu" or district population figure. By using these concepts introduced above, let us take a brief look at changes in population and household aspects both at the national and district (or rural community) level. The national population growth steadily grew between the years of 1955 and During the same period, "the ratio of old age population" also increased due to a drop in the birth and death rates. The ratio which was only 5.3% in 1955 reached 7.1% ("aged dependency ratio" of 10.3% - hereafter, the figures in parenthesis will refer to this "aged dependency ratio"). In 1970, making Japan one of the advanced countries in "aging of population."(17) In 1980, the ratio showed 9.1% (13.5%). The situation of households also changed. Specifically, the percentage of "nuclear families" increased and the average number of persons per household decreased continuously. Although "the percentage of the aged nuclear families"(*18) are also showing an upward trend at the same time, its percentage distribution is still very low at 39.2% in On the other hand, at the gunbu (district) or rural community level, the population steadily decreased during the years between 1955 and 1975, but from 1975 until 1980, this trend reversed and showed some growth. Close examination of the process of this population reduction reveals the highest reduction rate during the period between 1955 and It should also be added that the reduction rate has fallen after that period. This decrease in population can be attributed to the migration of people from rural areas to urban cities. And because this extensive migration occurred mainly among the younger generation, as a result "the ratio of old age population" in the rural areas reached 7.1% as early as This means that the rural societies became what is called "the aging societies" 10 years faster than Japan as a whole. Comparing "the ratio of old age population" in rural communities with that of the estimated medium figure compiled by the Institute of Population Problems, Ministry of Health and Welfare, the 1980 figure of the former corresponds to the 1990 or even 1991 level of the latter. As a matter of course,"the aged dependency ratio" is also high and it should be noted that the burden of supporting the aged is becoming heavier and heavier. Next, the household situation shows a forward trend towards increased "nuclear families" and smaller families. However, "the percentage of nuclear families" is lower in comparison with that of the national average, and its composition ratio has not yet reached 60%. Family size is larger in comparison with the national level, but "the percentage of the aged nuclear families", whose distribution ratio in 1980 is 30.0%, -112-

91 is below the national standard. Judging from the data available it appears that in rural communities "the aging society" progressed rather remarkably as a result of the extensive outflow of the younger generation, but the majority of the aged still live in "three-generation families" at present time. What about the ratio of the working population engaged in agriculture? After 1955 the ratio exceeded 50% until However, it dropped below the 50% level during the later years and in 1980, it fell as low as 23.2% (refer to Table 1). To summarise, the present rural community may be described as "the aging society", "rurban society" and moreover, a society having "three-generations of cohabitation" type families. 3. Regional Differences in Rural Population Changes - Comparative analysis of rural communities in Iwate and Kagoshima prefecture - According to the statistics showing the ratio of the working population engaged in agriculture in each prefecture (1980 figure), the prefecture having the highest ratio is Iwate followed by Kagoshima, Yamagata, Aomori, Akita, Kumamoto, Fukushima, Miyazaki and Ibaraki. All of these prefectures have a ratio of more than 20%. From the information given above, it can be said that there are a relatively greater number of agriculturally-oriented prefectures in "northeastern Japan"(see Table 2). Based on the above data, I would like to do a comparative study on changes in the representative prefectures of northeastern Japan and southwestern Japan, namely Iwate and Kagoshima and examine regional characteristics seen in the local population changes. Let us first of all take a look at the percentage of the working population engaged in agriculture in Iwate prefecture. 1970, their ratio was greater than 50% but it fell below 50% to level up till today. The pattern of population fluctuation of Iwate is much similar to that of the nationwide (rural district) population transitions, although decreasing and increasing rates are below the national standard. Such situations are reflected in "the ratio of old age population". This is to say, "the ratio of old age population" exceeded 7% during the years between 1965 and 1970 but each year it was below the national level. Nevertheless, according to the estimate of the Institute of Population Problems, its 1980 ratio was already at the 1988 or even 1989 level. Concerning households, the number -113-

92 continuously increased since The rate of growth somewhat slowed down between 1960 and 1965 and between 1970 and 1975, however, within the next five years between 1975 and 1980 it rose sharply. Family size is on a downward trend but it is still larger than the national level. Now then, how about the family composition? The ratio of "nuclear families" were found to be under the national level, and at the same time, less than 50% which implies that "the aged nuclear families" hold similar percentage levels as those mentioned above. Against this assumption however the composition ratio of these "aged nuclear families" is considerably lower than the national level and is below 20%. Taking all these consideration into account, the household structure of Iwate's rural community can be referred to as "status quo families" that is they succeeded from generation to generation(*19) (refer to Table 1). Now, let us take a look at the rural communities in Kagoshima. The ratio of the working population engaged in agriculture was more than 50% until 1970, however, it fell below 50% from 1975 and was remained at that level until today. As far as this transition pattern is covered, there seems to be no significant differences between the two prefectures. The overall population continued to decrease after 1955 until However, it should be pointed out that the rate of this population decrease was higher than the national level during the years between 1955 and During 1975 and 1980, the trend reversed itself to one of population increment. However, owing to the decreased population rate that was above national level, "aging of population" progressed at a remarkably fast pace and in 1955, it had already reached the 1965 level of a rural community in Iwate prefecture. Therefore, Kagoshima reached the 7% line much earlier during 1955 and It is also interesting to note here that "the ratio of old age population" in 1980 is comparable to that of the estimated lever of the year 2000 given by the Institute of Population Problems. This implies that the rural society of Kagoshima are 20 years ahead in the process of aging and as a consequence, it is a society placing extremely heavy burdens on the generation supporting the elderly population. Let us now turn to the changing family situation. The average number of persons per household became less than 4 in 1965 and reached a 3 person level in It should be noted that this average family size is lower than that of the national level, and at the same time it resembles the Kanagawa prefecture's 1980 figure (of 3.06 persons per household). Kagoshima's "percentage of nuclear family" was already more than 60% in 1965 which is not only well above the national standard (for gunbu) but is also higher than the national average (62.6% in 1965). "The aged nuclear family" rate is also high and it exceeded 50% in 1970 which means that at this point, the rate had already topped the 1980 national average (39.2%). 53.2% registered in 1970 even exceeds the figure 52.2% recorded in Osaka in 1980 (see Table 1). 114

93 The results mentioned above indicate that rural communities of Kagoshima have large elderly populations and many of these elderly people do not live with their children but live with their spouses. Therefore, the household structure of rural Kagoshima can be classified as "families having contractual trends". We have so far described and analyzed the ratio of the working population engaged in agriculture, population changes and household structural changes of rural communities in Iwate and Kagoshima and compared the two. The similarities and differences which surfaced can be summarized as follows. First of all, both rural Iwate and Kagoshima showed downward trends in the working population engaged in agriculture, population decline during the years between 1955 and 1970, reverse trends of population increases after 1975, noticeable progress in "aging of population", diminishment of households and forward trends towards "nuclear families". The differences were seen in the degree and period of occurrence of above-mentioned similarities (except for the ratio of the working population engaged in agriculture). For example, the number of households in rural Iwate grew constantly whereas the increment in Kagoshima started only after Also, percentage figures of "nuclear families" and that of "the aged nuclear families" greatly differed between the two prefectures. Especially in comparison with the rates of "the aged nuclear families" which seem to indicate that rural Iwate has more of "the status quo" type families per population compared to rural Kagoshima, which has more of "the families showing contractual trends".(*20) 4. Population Changes and Development in Rural Communities After having described and analyzed the population and families or household changes in rural parts of Iwate and Kagoshima, our next task is to tackle the problem of development and show the proper direction to be taken based on these descriptions and analysis. But as we attempt to do so, we will be compelled to deal with problems highly political and administrative in nature. Therefore, first of all, I would like to elucidate the philosophy of development on which my views are based and furthermore to suggest one of the possible development policies. (1) The Philosophy of Development The main subject here is the rural or regional development and it is defined as follows. Regional development is said to be "mainly administrative and policy enforcement work attempting to reform the society systematically and intentionally in order to upgrade the economic efficiency of the region, ability and welfare of the citizens and moreover to find solutions to various regional problems".(*21) -115-

94 Here, I would like to approach the subject of philosophy of development by first introducing Kunio Yanagida's way of thinking (centered around the main points of Yanagida studies). Let me first introduce Yanagida's philosophy on "systematic and intentional reform of the communities". "'The happiness of every citizen' was the idea that inspired Yanagida to improve the existing situation and to bring about comfortable living standards in the future."(*22) Therefore, "for him, any reforms or aspirations for future living standards were a reform and aspiration for the worse, as long as they ignored the idea of 'the happiness of every citizen'".(*23) In other words, "Yanagida contemplated politics for the improved living standard of the populace."(*24) To Yanagida "who was involved in the rural district and home affairs administration as a capable young government official"(*25), "Japan, after the Meiji era seemed to lack real politics and policy science, and instead only had bureaucratic rule or, reversely, strong influence of opportunism (*26)". With such a background Yanagida's views must have played a significant role in the formation of his philosophy described earlier. Then why did he think that Japan was lacking real politics and policy science. It is probably because he thought that "all the decision makers since the beginning of Meiji era considered preparatory work necessary for this task cumbersome and avoided facing this major problem all together"(*27), and moreover, "politicians and administrators in modern Japan have never really conducted research or made plans to a significant degree"(*28). In short, Yanagida held the idea that "the happiness of every citizen" as his development philosophy and believed that as long as it depended on theoretical basis, it would never be realized. What then, was Yanagida's means of actualizing his development philosophy? "Yanagida, as a government official, denied any abstruct works done based only on theoretical studies as a means of carrying out political plans or decision making. Instead, he adopted more practical and realistic ways of programming and decision-making, by collecting specific information and materials.(*29) Yanagida's way represented "his criticism towards officialistic bureaucracy and his intrinsic posture towards politics". He believed that a "sincere effort to see the real state of the citizens and to respond to them is true politics, and one that can enhance and develop specific plans for "the happiness of every citizen".(*30)

95 Yanagida suggested the above described ideas and practical methodology to policy planners, but what did he demand out of the citizens? It is said that he demanded the people to start from logic of "doubt" and to cultivate "common sense". What did he mean by cultivaion of "common sense"? By this, he meant "enriching knowledge founded upon empirical facts and developing their ability to make proper judgment.(*31) He considered this cultivation of "common sense" by the populace would lead to the realization of "the happiness of every citizen". In other words, if the people were receptive to the policies that went against the idea of "the happiness of every citizen", that meant lack of cultivation of "common sense" on the part of the people. In any case, Yanagida has shown a rigorous stance towards both policy-makers and the people. (2) Population Changes and Development in Rural Communities - In Relation to the Arrival of "The Aging Society" - If we are to support Kunio Yanagida's philosophy introduced above, we must use prudence when making any suggestions towards development policies especially because the measures I intend to present here is based on desk work which Yanagida admonished people not to practice. Keeping in mind the limitations of paper work, I would like to suggest one of the means for development. The issue which first surfaced through the comparative studies of the two rural communities was the progress of "aging of population". Therefore, I have decided to approach this issue of population change and development in rural communities by examining the perspective of family support extended to the old age group showing relative increase. Gamo named the ideology existing behind "the status-quo families"(*32) or "families showing expansive trends" characteristic of rural communities in "northeastern Japan" as "the logic for single value judgment"(*33) because this ideology (system value judgment has a certain consistency) it always places the highest priority on respecting the parent -- child relationship. In rural parts of "southwestern Japan", with "families showing contractual trends" holds the ideology that respects parent -- child relationships before marriage but converts to an ideology which places the highest priority on respecting husband and wife relationship after marriage. He called this "the logic of circumstantial response."(*34) Indeed, if such ideological differences existed between "northeastern Japan" and "southwestern Japan", we must establish -117-

96 policies that comform to "the logic of single value judgment" in the case of "northeastern Japan" when promoting support measures for the aged. That means policies that solve various problems related to the support of the aged must be established based on the idea of "support by cohabitation". On the other hand, support policies of the aged must be based on the idea of "separation" in the case of "southwestern Japan". In any event, if various kinds of rural communities exist between Iwate and Kagoshima, with extreme cases of logic in such a small land like Japan, we must draw up the most appropriate plans for each community. And moreover, such plans must be prepared by using information and material gathered through specific research and surveys. Nevertheless, what we have covered here is based primarily on paper work and therefore the understanding of the two rural communities remains superficial. For this reason, I will refrain from dwelling any further on this issue and just leave the previously mentioned means as they were presented. 5. Conclusion In this paper, I have studied the population and household structure changes in rural Japan by using two rural communities in Iwate and Kagoshima as examples. As a result, it has become clear that some similarities and distinct differences exist in population and household structures between the two rural areas. Upon this finding, I expressed my view that if one is to create development policies with such similarities and differences in mind, it is inevitable that we would find certain peculiarities incorporated in each of these policies. However, since this study remained as paper work, incompletening of this work cannot be denied in view of Yanagida's philosophy of development. Therefore, I have mainly concentrated on discussing the issues concerning periods prior to any development policies and only briefly presented my view on the means of development policy making. In Japan, there exist diversified cultures and unless development policies considering each unique culture are established, we cannot hope to realize "the happiness of every citizen"

97

98 Table 2 The Ratio of the Working Population Engaged in Agriculture per Prefectures (1980) Prefectures Ratio of working population engaged in agriculture Prefectures Ratio of working population engaged in agriculture National ratio Hokkaido Shiga Aomori Kyoto Iwate Ohsaka Miyagi Hyogo Akita Nara Yamagata Wakayama Fukushima Tottori Ibaraki Shimane Tochigi Okayama Gunma Hiroshima Saitama Yamaguchi Chiba Tokushima Tokyo Kagawa Kanagawa Ehime Niigata Kochi Toyama Fukuoka Ishikawa Saga Fukui Nagasaki Yamanashi Kumamoto Nagano Ohita Gifu Miyazaki Shizuoka Kagoshima Aichi Okinawa Mie 9.6 Source: "National Census Report" 1980, The Statistics Bureau of the Prime Minister's Office

99 Notes Nakane, Chie, Human Relationship in Vertical Society. Kodansha's new book series, Kodansha, p.188 Nakane states that "Tracing back into the history as far as possible within the level of the present science, it is clear that the Japanese Archipelago were inhabited by overwhelmingly large homogeneous races who shared the same basic culture Quite often people make regional distinctions such as Kanto, Kansai, Tohoku and Seinan Japan and pay great attention to the regional differences. However, despite such differences, common factors are found throughout the country and are surprisingly strong. In fact, when such regional differences existing in Japan are compared with those existing in other countries it becomes clear that what people called "regional differences" are only relative differences found within one homogeneous society where similarities or common factors bear greater significance.* (*2) Amino,Yoshihiko. Japanese History of East and West. (Soshiete Bunko 7) Soshiete, p.11 (*3) Amino, Ibid p.162 (*4) Amino, Ibid p.163 (*5) Amino, Ibid p.40 (*6) Amino, Ibid p.41 (*7) Nakane, Chie. Radio University Course - Comparison of Social Structures - With the Focus on Asia - Ohbunsha, p.12 Nakane states "If a big society called a nation is the largest unit, then, a family is the smallest unit group of the opposite extreme. But although a family is the smallest unit, it is a primary group that exists commonly in every society. Family is also a place where people first learn about human relationships and therefore, people's values and basic group characteristics; are all reflected in the way families exist. In this context, family units can give important suggestions as to group characteristics and human relationships that exist in this particular society. Therefore, it is an essential subject to be studied in doing comparative analysis of social structures." Kitano, Seiichi and Kazuhiko Sumiya. (Discussion) Japanese "Ie" and family - Issues of Ariga. Kitano debate. May issue of Shiso. Iwanami Shoten. May

100 1968 p.144 Kitano states; "I believe that the social structure unique to the Japanese rural society that forms that basis of Japanese capitalism and social stratum constituting it, cannot be defined unless the Japanese "Ie" system is explicitly analyzed." (*8) Ohmachi, Tokuzo. Family.Edited by Tokuzo Ohmachi and others. System of Japanese Folklore. The 3rd volume - Society and Folk customs (1). Heibonsha, p.220 (*9) Gamo, Masao. An Essay on Structural Changes in Japanese Society after the War. Edited and commented by Masao Gamo. Gendai no Espri, People and their relatives the 80th issue, Shibundo, March, p. 197 (*10) Gamo, Ibid p.197 (*11) Gamo, Masao. Japanese "Ie" and "Mura". Edited by Taryo Ohbayashi. Races of the world. East Asia the 13th volume Heibonsha, pp22-43 (*12) Ueda, Masao Demographic Characteristics in Northeastern and Southwestern Japan. "The Journal of Population Problems" No.101 issue February, pp (*13) For example, Ueda, Masao. Ibid., Kuroda, Toshio. "Structure of the Japanese Population Transition: Kokon Shoin, Shinozaki, Nobuo "A Study on Marriage Area", "Annual reports of the Institute of Population Problems". No.12, October Kobayashi, Kazumasa "Changes Observed in the Japanese Population and Marriage Area", "Studies on Research Policies Related to Japanese Regionality." (Research Reports, Scientific Researches of the Ministry of Education, Science and Culture) March, Okazaki, Yoichi. "Transition to the Aging Society - Population, Economy and Society in Japan" Kobunsha, Hama, Hidehiko. "Regional Studies of the Japanese Population Structure - Its changing process, aspects of transition, and future prospects" Chikura Shobo, Yamaguchi, Kiichi, and Ymamoto, Michiko "Changes of the Age Structure in Regional Population by Prefectures", "The Journal of Population Problems" No. 166 April, Kawabe, Hiroshi "Regional Structure of the Population." Edited by Noriyoshi Ukita, "The Outline of Human Geography, Geography Course 9" Asakura Shoten, Uchino, Sumiko "Dual Strucutual Movement Hypothesis on Migration - Transition of Migration on the Japanese Archipelago". "The Journal of Population Problems" No. 139 July,
 Demarcation having Fossa Magna as its tentative boundary (*16) Kuroda, Toshio \"Structure of the Japanese Population Transition (Revised Edition)\" Kokon Shoin 1982 pp.")
101 (*14) Yamaguchi, Kiichi "Statics and Dynamic of Population." Yoichi Okazaki and others; "The Theory on Population" (Seirin Sosho) Seirin Shoin Shinsha, 1974, p.48 (*15) Demarcation having Fossa Magna as its tentative boundary (*16) Kuroda, Toshio "Structure of the Japanese Population Transition (Revised Edition)" Kokon Shoin 1982 pp (*17) We have adopted a view which considers a country with more than a 7% elderly population to be a nation with an aging population. (*18) The computation formula are as follows; Percentage The number of the aged familibs (Ordinary of the aged - households having members who are over 65 families Number of ordinary households x 100 Number of the aged Families with only the nuclear families (The elderlies (Families in Percentage aged families having + which the old people of the aged structure of nuclear live on their own) nuclear family) families Number of the aged families x 100 (*19) I have made these judgements from the component ratio of "the aged nuclear families" based upon the assumption that "the aged family" is the last stage in the cycle of a family and quantitative composition of families here represents the state of families in that society to a certain degree (Qualitative aspects = Internal structure). If that is the case then the family structure ("The system of Family Formation Customs") can be grasped using this component ratio as a guideline. (*20) However, it is argued that such differences are related to the progress of "aging of population". As a reference, I will present here the diagram showing the correlation between "the ratio of old age population" and the rate of "the aged nuclear families" by prefectures for
 og 30(Wakayama) a O 4 1.-.44(0ita) 2 39.2 4.1 0 O 0 O 30 0 k 44 5 11(Saitam%) 2 1 h- 43(Kumamoto) 37(Kegewa) (Mie).33(0kayama).12(CHibe) 29(Nara) 24.")
102 (Kagoshima) 60 a H Tokyo) 27(Osaka) 39(Kochi) ,c1 _ 47(0ḳinawa) 45(Miyazaki) 1(Hokkaido). (Fukuokar 40 2,. 42(Nagasaki) 14(Kanagewa) 7(Kyoto) :38(Ehime) (HI'ft l(hiroshime) 3!(Yemaguchi) og 30(Wakayama) a O (0ita) O 0 O 30 0 k (Saitam%) 2 1 h- 43(Kumamoto) 37(Kegewa) (Mie).33(0kayama).12(CHibe) 29(Nara) q(Tlegen)t) 23(Aichi) 10(Gunme) 6 41(Sage) 3 20(Nageno) 25(Shige) 31(i-ottori) 2(Aomori) 0 ;.9 ;,,.17(Ishikawa) 4(Miyagi)* 21 7(Fukushima) 21(Gifu).18(Fukui) 3(Iwei e) 5(Akita) '15(Niigate) 616(Toyama) 6(Yemegate) 8 Ibaraki 9 Tbchigi 19 Yemanashi 22 Shizuoka I % Percentage of the elderly population (*21) Edited by Hamashima, Akira and others. Handy, Dictionary of Sociology (revised edition) Yuhikaku, p.268 (*22) Ito, Kanji., "Kunio Yanagida - His Sciences and Perspectives" Ushio Shuppansha, p.75 (*23) Ito, Ibid., pp75-76 (*24) Hashikawa, Bunzo., "Various Aspects of Modern Japanese Political Thoughts" Miraisha, p.24 (*25) Hashikawa, Ibid., p.23 (*26) Hashikawa, Ibid., p
103 (*27) Hashikawa, Ibid., p.23 (*28) Hashikawa, Ibid., p.23 (*29) Goto,Soichiro. "The essays on Kunio Yanagida Introduction" Dento to Gendaisha p.39 (*30) Goto, Ibid., pp (*31) Goto, Ibid, p.75 (*32) Gamo interprets this type to be distributed throughout the nation but I understood it to exist mainly in the Northeastern region of Japan. (*33) Gamo, Ibid. (Footnote 9) p. 195 (*34) Gamo, Ibid. (Footnote 9) p
104 CHAPTER 6 RURAL-URBAN DEMOGRAPHIC BALANCE Tatsuya Itoh Research Demographer Division of Human Reproduction & Population Quality Institute of Population Problems Ministry of Health and Welfare
105 Tables, figures and notes are attached at the end of the chapter.

106 1. Preface After the end of World War II, death rates world-wide lowered, population increased explosively, and less developed countries have consequently been confronted with various population related problems - particularly that of a concentration of population in capital-centered urban areas. This rapid increase of population in urban areas has caused numerous problems; for example, housing shortages, sewerage and water, and an insufficient supply of utilities necessary for our daily life. Most of the newly migrated population live in slums without proper living conditions and the slums are expanding day after day. The United Nations has collected and analysed exact information on the transition and the fluctuating factors of population increase, and has also made a projection for the future of population increase. These publications may serve as basic materials in finding solutions to the various problems which have arisen since this explosive increase. (*1). Using these materials, we will analyze the problem of population increase and concentration in the urban areas of less-developed countries. Figure 1 illustrates growth of the total population and of urban populations in the whole world, in more-developed countries (MDC), and in less-developed countries (LDC) from 1920 to We can see from the Figure, first, that population increase and concentration into urban areas of less-developed countries started after World War II. From , the world population more than doubled, from 1.9 billion to 4.4 billion, and 80% of this increase (2 billion) occurred in less-developed countries. Concurrently, the world urban population increased fivefold from 360 million to 1.8 billion. In 1920, 72% of the world urban population was that of the most developed countries, while the urban population of less-developed countries was only 100 million. After 1960 however, the urban population of less-developed countries increased rapidly. In the 1970's it surpassed the urban population of most developed countries, and in 1980 it hit 970 million, thus increasing tenfold within 60 years. However, the proportion of urban population in the less-developed countries only increased from 8.4% to 30.5%, since the total population of these countries also increased considerably. In comparison, the proportion of urban population in the more-developed countries has increased from 38.7% in 1920 (which is larger than the present ratio in less-developed countries), to 70.7% in Second, it is forecasted that population increase and urban concentration in less-developed countries will be more accelerated from 1980 to The world population will increase by 1.9 billion in those 20 years and 95% of this increase will be that of the less-developed countries. At the same time, the world urban population will increase by 1.4 billion and 82% of this increase (

107 billion), will also be that of the less-developed countries. This means that the urban population in less-developed countries will more than double from 970 million to 2.12 billion in those 20 years. Japan is the only state in Asia, except city-states such as Hong Kong and Singapore, that has reached the last stage of population concentration in urban areas. If this process and its characteristics or the transition and characteristics of the rural-urban demographic balance in Japan are clarified, they will serve as important materials in considering population concentration in urban areas of less-developed countries, especially Asian nations. In this chapter, changes in the rural-urban demographic balance in Japan will be discussed. 2. Transition of the Rural-Urban Demographic Balance: Current Population Concentration into Cities (1) Definitions of Rural and Urban Areas It is necessary to consider the basic concept underlying the compilation of data on rural and urban areas before observing fluctuations in the population distribution of rural and urban areas. Attempts at giving a standardized definition of rural or urban areas common to states of the world have not been successful. Various and numerous definitions and classifications of rural and urban areas have been based on considerations of history, politics, culture, and administration of each society. However, in analysing long-term changes in the rural and urban areas of a state, the definitions of the rural and urban areas used in statistics of that state are employed. The following three are the most widely used definitions in Japanese statistics on rural and ruban areas. The first definition of urban and rural areas is that the urban area is a city area (shi-area in Japan) and the rural area is the other area such as town or village (machi and mura). Generally, the smallest self-governing bodies are classified as an urban area or rural area according to population size, population density, industrial activity, history, etc. Therefore, urban and rural populations are self-governing bodies grouped as shi-areas and rural areas, respectively. The problems which occur when this definition is used are: First, problems in chronological comparison since the urban and rural areas vary as to when a self-governing body of a town or village is municipalized; the second problem is that, when the municipal boundary is extended by annexation of towns and villages, a rural area is included around an urban area in the municipality. The second definition is that the urban areas are densely inhabited districts (DID) and the rural areas are the other districts. To note, annexation of cities, towns and villages, which has been seen

108 since about 1930 in our country, accelerated after 1953 when "The Town and Village Annexation Promotion Act" was enforced. The result is that the number of cities, towns, and villages has decreased from 12,244 in 1920 to 10,500 in 1950, and further down to 3574 in 1960, almost the same as at present. Thus rural areas have come to be included in municipal areas as administrative areas. For this reason, an attempt at reclassifying urban and rural areas based on data of the enumeration districts of population censuses within cities, towns and villages was made so that more precise data on actual urban and rural areas can be obtained. In Japan, actual urban areas therefore defined are called "Densely Inhabited Districts (DIDs)" (*2). However, it has been only since the 1960 Population Census that "Densely Inhabited Districts" have been established, and that various data on these districts has been collected and published. Situations before 1960 must only be presented with presumption (*3). In the third definition, the metropolitan areas and non-metropolitan areas are classified as either urban or rural areas based on data of prefectures. The urban and rural populations based on the first and second definitions represent an exact balance of population of urban and rural areas at the time of research, though ranges of urban and rural areas vary at every research point in time. In other words, changes in population balance of urban and rural areas based on these definitions are caused not only by differences in natural increase and migration between urban and rural areas, but also by re-classification of the two areas. Hence, for a regional unit to be employed for information on population such as vital statistics, migration statistics, etc., self-governing bodies are sometimes classified as either an urban or a rural self-governing body. When this definition is to be used, larger administrative units such as prefectures are used as regional units. Consequently, non-metropolitan areas are included in shi-areas and metropolitan areas are included in machi and mura, making it impossible to indicate a true rural-urban balance of population. However, a detailed population balance transition can be observed. We are going to use the data based on these three definitions discussed above with respect to the purpose of analysis. (2) Trends of Urbanization Figure 2 shows population growth in shi-areas, and Densely Inhabited Districts and metropolitan areas, as well as growth of total population from 1920 to This Figure indicates that the total number of population in Japan has almost doubled, increasing from million to million, and that the population in shi-areas increased the most remarkably among the three, followed by the population of the Densely Inhabited Districts, and last a moderate increase in population of metropolitan areas

109 The population in shi-area indicated the most remarkable increase almost ninefold, from 10 million in 1920 to 89 million in This increase began in the 1930's, and though the population decreased temporarily during World War II, an increase began again after The population in shi-area reached 60 million (63% of the total population) in 1960, and after 20 years increased by 29 million to 89 million, which is over the total population increase in the period. This increase of shi-area population is partly due to the rearrangement of municipal boundaries by annexation of towns and villages. Next, the trend of population growth in Densely Inhabited Districts will be examined. The Densely Inhabited District is a regional unit which was first used in the 1960 Population Census; therefore, the numerical values before that are estimated from statistics on industrial employees (*4). According to this result of estimation, the population in Densely Inhabited Districts in 1920 was 16.7 million (30% of the total population.) Therefore, the population in Densely Inhabited Districts increased by million in 60 years from 1920 to % of this increase, 29 million, occurred in the most recent 20 years. Last, population increase in metropolitan areas is mild when compared to that in shi-area or Densely Inhabited Districts. However, its increase is 82% of the increase in total population from 1920 to 1980, and its proportion to total population increased from 36% to 50%. Figure 3 shows that the proportion of urban population in Japan has been increasing consistently since 1920, except during the time around World War II. It also indicates that the population concentration in urban areas in our country accelerated from 1955 to 1975, the so-called "period of high growth of economy", and that it has since returned to a mild level of growth. (3) Factors in Changes of Rural-Urban Demographic Balance --- Factors in Population Concentration into Urban Areas The increased rate of total population in 5 years was on the level of 10% before the War, and it decreased by half to about 5% in the latter half of the 1950's (low rates have been noted since then.) The increase in total population is due to natural increase, or the balance of births and deaths, because the number of permanent migrants from foreign countries has been extremely small except for the period around World War II (although migration to and from foreign countries has become more and more active recently.) The population in shi-areas and Densely Inhabited Districts increased remarkably in the period of high economic growth, but the increase was partly due to rearrangement of city boundaries as described before. Therefore, we are going to take the increase of population in metropolitan areas into consideration while discussing demographic factors in population concentration into urban areas after the War

110 The rate of population growth in metropolitan areas rose rapidly to 12-14% during the period of high growth of economy, which was almost threefold of that before the War (the rate before the War was only a small percentage above the degree of national population growth.) Since 1970 however, the rate of population growth in metropolitan areas has been decreasing and for the last 5 year period was 4.9%, which was not very different from the 4.6% rate of population growth in the whole country. Why did the rate of population growth in metropolitan areas increase from 1955 to 1975, and why did it begin to decrease since 1975? When we look at the change in the natural increase rate in metropolitan areas, we notice that it had been only 1%-2% above the rate of population growth in the whole country, although between and it had actually increased from 5.3% to 7.9%. Therefore we can conclude that the change of the population growth rate in metropolitan areas has been caused by migration from non-metropolitan areas (social increase.) In other words, the social increase rates between 1955 and 1960 and between 1960 and 1965 were about 7%, which were higher than the natural increase rates of Japan. Since 1965 however, the rate began to decline and it dropped to 2.0% between 1970 and Hence, in examining the urban concentration of population, we need to analyse the quantitative and qualitative changes in migration between rural and urban areas. Such analysis follows in the sections below. 3. Quantitive and Characteristic Changes in Migrants between Rural and Urban Areas (1) Changes in Migration Pattern The migration rate, which is the number of migrants per 1,000 in population, was stable around 5.8% in the 1950's. In the 1960's it began to rise and was again stablized at high levels around 8% between 1965 and After 1974, however, the migration rate started to decline to the levels of the 1950's. When we examine these changes in the migration rate, we can see that while the rate of migration to another city, town or village in the same prefecture (intra-prefecture migration rate) varied only slightly, the migration rate to another prefecture (inter-prefecture migration rate) accounted for a large portion of the total migration rate. Next, when we classify the much fluctuating inter-prefecture migration into four categories, migration within metropolitan areas, migration within non-metropolitan areas, migration from metropolitan areas to non-metropolitan areas, and migration from non-metropolitan areas to metropolitan areas, we can see the following: First, since the rate of migration within non-metropolitan areas had little variation year by year like the intra-prefecture migration rate, the changes in the other three migration patterns accounted for the inter-prefecture migration changes. Second, most of the migration from those three migration patterns between 1955 and 1965, was from

111 non-metroplitan areas to metropolitan areas, similar to migration from rural to urban. However, after 1966, most of the migration was within metropolitan areas, especially to the residentail areas in the suburbs. Third, after migration from metropolitan areas to non-metropolitan areas began to decrease in 1974 the number of migrations from metropolitan to non-metropolitan areas and from non-metropolitan to metropolitan areas began to show no difference. In conclusion, migration changes in Japan after the War were caused mainly by migration from rural areas to urban areas, or migration from countries to cities, and migration within metropolitan areas, especially migration to the residential area in the suburbs. While on the other hand, the annual changes in migration inside prefectures and inside non-metropolitan areas were both small. Furthermore, the two migrations between metropolitan and non-metropolitan areas began to balance from the latter half of the 1970's, and that was accounted mainly for the recent decline in the social increase rate in urban areas. (2) Factors in Migration After the War the aforementioned changes in migration in our country were often explained in connection with economic changes. For example, Kuroda wrote: "In the period of economic growth when labor is extremely demanded, many long-distance migrations were found, while in the period of economic stagnation most of the migrations were to near areas due to a limited scope of recruitment by various enterprises" (*5). Also, besides these economic explanations dealing with migration or movement of labor, we can also find some studies which analyse conditions of migrants or characteristics of migrants from rural areas in connection with the family system or the succession of "family." Shigeo Nojiri conducted 15 years of research in 20 villages in 7 prefectures in Tohoku, Hokuriku, and Kanto from His findings from these investigations were made public that the rate of deserting villages by eldest sons (future heads of families) was lower than that of other sons, although it proved to be higher than had been expected. However, "the rate of returning to villages by eldest sons was evidently higher than that of the other sons," which also indicates that the deserting of villages by eldest sons were temporary and recurrent, or that it was an incomplete deserting, while the deserting of villages by other sons were complete and nonrecurrent (*6). From these results Nojiri concluded: "Migration by the eldest son has only a small probability of settlement in the city. This migration with little probability of settlement indicates that the farm family's demand of eternal succession is being fulfilled by making its eldest son, who occupies the central position in the family, return to succeed the family after allowing him a temporary migration."
, on the levels of 5.5 million and 14 million, respectively.")
112 Honda noticed the fact that the number of farm households, farmers and forestry industry workers scarcely changed in the period of industrial modernization which started in the middle of the Meiji era (from 1874 to World War II), on the levels of 5.5 million and 14 million, respectively. He pointed out that the population equivalent to the natural increase of farming population was regarded as surplus population, and was made to give up farming, and that most of this population left their villages (*7). He calculated the average of this population per farm family by assuming the average number of children ever born per farm family to be 5, the number of surviving offspring at the age of 20 to be 4, and the number of offspring to succeed the profession of parents to be 2 (male and female,) and estimated the average number of surplus population per year to be thousand, and the number of labor populations to be 300 thousand by assuming the number of farm families to be 5.5 million where one generation's span is 30 years (*8). Namiki estimated that the population leaving farm families every 5 years from 1920 to 1955 was about 400 thousand before the War and more than 500 thousand after 1950 (*9). These studies together made it clear that the population leaving farm families or farming villages was "surplus population" over the population necessary for the change of generations or for a natural increase of the farming populations, and that this population was extremely stable from the beginning of the Meiji era until 10 years after the War. In addition, when Yamaguchi explained the increased migration into metropolitan areas between 1960 and 1964 and the tendency toward a balance of the two migrations between metropolitan areas and non-metroplitan areas in 1970's, he pointed out that the quantity and characteristic of young migrants from rural areas differed in the 1960's and 1970's (*10). He obtained the average number of three to four children aged per mothers aged in each prefecture, which was over two per mother for family succession, He also found that some of the children later left their prefectures for jobs but that about two children per farm family were secured in each prefecture in the 1960's. In 1970, however, he showed that the average number of year-old children per year-old mothers dramatically dropped to about two, reflecting the birth rate decline after the 1950's. Furthermore, in some prefectures the number was below two, the necessary number for succession of family. He also showed that approximately half of those children migrated out of their prefectures in order to study at metropolitan area universities and that accordingly, population regeneration in non-urban areas would be ruined nationally without a "U-turn" of these student migrants or a balance of the two migrations between non-urban and urban areas. Yamaguchi's analysis was epoch-making in explaining the changes in migration after the 1960's, since the three factors, fallen birth rate, "succession of family", and the object of migration were interrelated

113 From the above overview of the changes and factors in migration after the War, we can see that in order to explain migration it is not sufficient to only pay attention to economic variables. We must also discuss changes in the population of the ages having a high probability of migration due to the demographic transition, and to conditions of the migrants prescribed by the family system, such as the succession of family in each region. We are first going to discuss how changes in the population of the ages, particularly those with a high probability of migration, affected the migration rate. Secondly, we will discuss the relationship of that rate with the family system or the succession of family. (3) Change in Age Structure and Migration Rate First, using the method of standardization will be analized, how changed in the age structure affected the migration rate using the method of standardization. The demographic transion greatly altered the age structure of the Japanese population after That is, when the increased migration rate was recorded, the number of population age groups having a high probability of migration increased remarkably. On the other hand, when the migration rate dropped, that same population decreased. Using two sets of migration rates by age, for inter-prefectures, and intra-prefecture, based on the population censuses of 1970 and 1980 as the standardized migration rates, two sets of expected migration rates for the years between were calculated (*11). When comparing the results with the actual migration rates, first it was found that the expected migration rates were stabilized from 1950 to 1970, when the actual migration rates were moving upward. This means that the age structure of the ages having a high probability of migration did not largely vary. In other words, the migration rate for each age increased by almost the same degree with the actual observed migration rates. Second, the decline of actual migration rate from 1970 to 1980 was half accounted for by changes in the age structure and the effect was larger on the inter-prefecture migration. 4. Family System and "Potential Life-Time Out-Migrants" (1) Sustained Reproduction of Generations and "Potential Life-Time Out-Migrants" In calculating expected migration rates, the assumption was made that persons of the same age had an equal probability of migration. According to the studies on the Japanese family system, we have several family system in Japan; not only the stem family system but also the nuclear family system. However, it seems that the main principle of Japan's family system involves the succession of family (*12). Considering this fact, it is more reasonable to think 136 -
.")
114 that the probability of migration differs from persons even of the same age according to his position in the family. This is because at least one child of a couple is expected to live with or near his parents and the child himself thinks in this way (*13). Although small differences are found between 1) societies such as the one of lineal families (succession by eldest son, succession by eldest daughter, and succession by last son) or "families with one child to remain" where the succeeding child continues to live with his parents even after marriage, or 2) in others such as, "families of multiple households" (*14) or "families with no child to remain after marriage" where the succeeding child is to live near his parents in the same site. Accordingly, when we identify the child who is expected to live together with or near his parents as a "successor," the migration rate of the "successor" is less than that of the other children (children who are to be married with "successors" are included with other children). Children in Japan can be classified into the following three categories from the viewpoint of migration and family: The first group are children who will be "successors" in the future. The migration possiblity of this group is smaller than that of other children and their migration for the purpose of study or employment is temporary. The number of children in this first group corresponds with the number of parent couples or households. Children in the second group are children who will be married to "successors." They migrate for marriage at least once in their lives but the distance of migration is usually short. The number of these children is determined by the number of "successors" and scarcely by economic change. Children in the third group are children other than "successors" or their future spouses. These children must leave their farming villages unless business opportunities are available at their localities. If they cannot find jobs around their farming villages, they must migrate into other districts. Consequently, most of their destinations are outside their prefectures. The number of these children is decided mainly by the number of surviving offspring and not by economic change, but their destinations are thought to be affeced by the distribution of labor demands. The children in this third group are designated as "potential life-time out-migrants" in this chapter. "Potential life-time out-migrants" as considered by parents are adult offspring other than successors and their spouses, and the number can be defined as the number of adult offspring minus 2 persons (successor and his/her spouse. Furthermore, it is more acccurate to consider the age-specific migration rate as dependent on the number of brothers and sisters in each generation or, more exactly, the average number of adult cohort offspring corresponding to the age, rather than taking the age-specific migration rate to be the same always. This is because in generations with many brothers and sisters the ratio of potential left-time out-migrants becomes higher and the generations

115 show a higher rate of migration into other prefectures. In contrast, in generations with a small number of brothers and sisters, the ratio of children in the first and second groups becomes larger, and the level of out-migration becomes smaller. (2) Number of Adult Offspring Per Couple and Number of "Potential Life-Time Out-Migrants" related to the Demographic Transition Now we can see that the number of "potential life-time out-migrants" is highly dependent on changes in birth death rates, or the demographic transition. Hence, from the trends of the average number of children ever born of each female cohort, and the surviving rates of male cohort found in the Population Censuses, the population of our country can be classified into the following three cohorts: first generation, who were born up to 1925, experienced high fertility and high mortality; second generation, who were born in , experienced falling mortality; third generation, who were born after 1950 and their parents have two children, went through their life under extremly low mortality. From this Table we can see that the average parents of the first generation, whose characteristics are many births and many premature deaths, bore 5 children and had 2.5 adult offspring since only half of their children grew up. On average when 2 offspring would be a successor and his/her spouse was excluded, the number of "potential life-time out-migrants" was 0.5, or the rate of "potential life-time out-migrants" per couple was 20%. This rate of "potential life-time out-migrants" per couple is the same as the rate of "life-time out-migration" of this generation. Next, the average parents of the second generation bore a little less than 4 children, and about 1 child died beforecoming of age. Consequently, we can say that the number of "potential life-time out-migration" per couple was 1 and that the rate of "life-time out-migration" rose to 33%. The average parents of the third generation who married after the War, however, had 2 grown-up offspring and they scarcely had any "potential life-time out-migrants". When we consider these facts from a historical viewpoint, we can easily understand that, during the period of high economic growth in the 1960's, the second generation were the ages experiencing high migration rates year by year, that it was this generation that made the age-specific migration rate higher, and that the third generation began to grow up to these ages after (3) Relationship between "Potential Life-Time Out-Migrants" and Migration Patterns Next how the number of "potential life-time out-migrants" per couple caused by the demographic transition, and the rate of life-time out-migration, are connected with the migration rate or the migration 138

116 patterns will be discussed. In calculating the number of "potential migrants" for each year, the following assumption was made. The 10 through 14 year-old population was assumed to be the "children," since in Japan, almost all the children below 15 live together with their parents. Ages of mothers were assumed to be , and the average value of year-old and year-old female populations was assumed to be the "number of mothers." The reasons for taking these values were: (1) the mean age at birth of mother is comparatively stable at 27, (2) most of the deliveries occur within 5 years from marriage, and (3) in 1980 Population Census, 44.3% of the mothers of year-old children were year-old and 31.5% were year-old. When "children" and "mothers" are defined as above, and since the number of "potential life-time out-migrants" per couple has been defined to be number of adult offspring minus 2 persons (successor and his/her spouse), the total of "potential life-time out-migrants" in a region can be calculated from the formula below, using the numbers of populations by age and sex. POM(t) = P(10-14,t) - 2* (PF(35-39,t) + PF(40-44,t))/2) = P(10-14,t) - (PF (35-39,t) + PF(40-44,t) where: POM(t) is the number of potential life-time out-migrants in the year "t", P(10-14,t) is year-old population in the year "t," and PF(35-39,t) and PF(40-44,t) are year-old and year-old female populations, respectively. The changes in number of children, mothers and "potential life-time out-migrants" from 1920 to 1980 are shown in Figure 5. First the number of children per mother (children / mothers ratio) will be calcuated. It mounted from 3.7 in 1920 to 4.3 in 1935 and then began to decrease. It was again 3.7 in 1960 and has been around 2.0 since Next, the number of "potential life-time out-migrants" increased slowly from 3 million to 4 million from 1920 to 1955, but it suddenly leaped to 5 million in Then afterwards, the number of "potential life-time out-migrants" dropped rapidly and it has been almost 0 after This means that no parents have had any "potential life-time out-migrants" since 1970 and that most of the migrating offspring have been successors or their spouses. Perhaps it can be concluded from the above that the great number of "potential life-time out-migrants" in 1960 made the migration rate in the 1960's high, and that the decreased number of "potential life-time out-migrants" after 1970 caused decline of the migration rate in the 1970's. With this conclusion in mind, the next point of investigation is the relationship between the migration pattern and geographical distribution of "potential life-time out-migrants."

117 "Potential life-time out-migrants" are so defined that we can calculate the number of "potential life-time out-migrants" in an area, from the data of populations by age and sex.the numbers of "potential life-time out-migrants" in metropolitan areas and non-metropolitan area 1920 to 1980 were calculated. The results show that the number of children per mother (children / mothers ratio) in the metropolitan areas had been 3 until 1960 and the ratio decreased to below 2.0 after 1970 due to the decline of the birth rate since the 1950's, reducing the number of "potential life-time out-migrants" to 0 by The number of children per mother (children / mothers ratio) in the non-metropolitan area, however, had been always as high as till 1970, and the number of "potential life-time out-migrants" had increased from about 2.7 million in the 1950's to 3.34 million in However, the ratio of childlren to mothers in the non-metropolitan area dropped to after 1970 during the depression in birth rate, thus reducing the number of "potential life-time out-migrants" in the non-metropolitan area down to several hundred thousand. Hence, so long as the reproduction of generation in each region is assumed, the migration to metropolitan areas after this period is temporary, and the two migrations between non-metropolitan areas and metropolitan areas are just balanced. Therefore, it can be assumed that these changes in the number of "potential life-time out-migrants" in non-metropolitan areas account for the decreased migration rate and the change in the migration pattern in the 1970's. 5. Summary and Forecast of Changes in Rural-urban Demographic Balance As previously discussed, rural societies in Japan can be said to have as their basic principle, the secured change of generation even though they vary in the type of family system. In order to guarantee a safe change of generation during a period of high death rate such as before the War, the number of children must be 2 or more. The surplus population who are not expected to be successors (which is the difference between the numbers of children and parents), or the natural increase of farm family was pushed out into cities. The rate of concentration of population into cities was mild before the War. The Demographic transition or the change from high fertility and high mortality, to low fertility and low mortality, took place in a short period after the War. The large surplus population of the generation of many siblings and few premature deaths, born in the middle of the demographic transition, was present in rural areas in the 1950's and 1960's and most of this population migrated into big cities. This was the drastically increased migration from non-metropolitan areas to metropolitan areas in the 1960's. In addition to this change in age structure the demographic transition, we cannot overlook another factor in regard to the population concentration in cities in the 1960's: the high growth rate of the economy generated a great demand for labor force in metropolitan -140-

118 areas, thereby providing jobs for those migrants. After the War in Japan, regional differences in differential fertility have been small, and the number of adult offspring has been stable at 2, as described in Chapter 2. We call the generation born a little after the War who appear in the last stage of demographic transition, the "generation of low fertility and low mortality," In the latter half of the 1970's when this generation began to reach economically active ages, there were no "potential life-time out-migrants." in rural areas to be discharged into the cities; so as long as the safe change of generation in rural societies was to be observed, the population who had migrated to the cities had to finally return to their rural areas. The result is that most of the population increase in big cities now is due to natural increase, not to social increase as seen before. If the stable change of generations in societies is assumed, the urban-rural demographic balance will be decided by the difference of natural increase in urban and rural areas in the future, since one-way migration such as in the 1960's is not speculated to occur again. A quantitative balance of population cannot be imagined to change greatly. Since recent migration from non-urban areas is mainly for school, and if we suppose that these students will return to their birthplaces after graduation or at their parents' retirement, a qualitative distribution of the population with respect to educational career will be gradually balanced

119
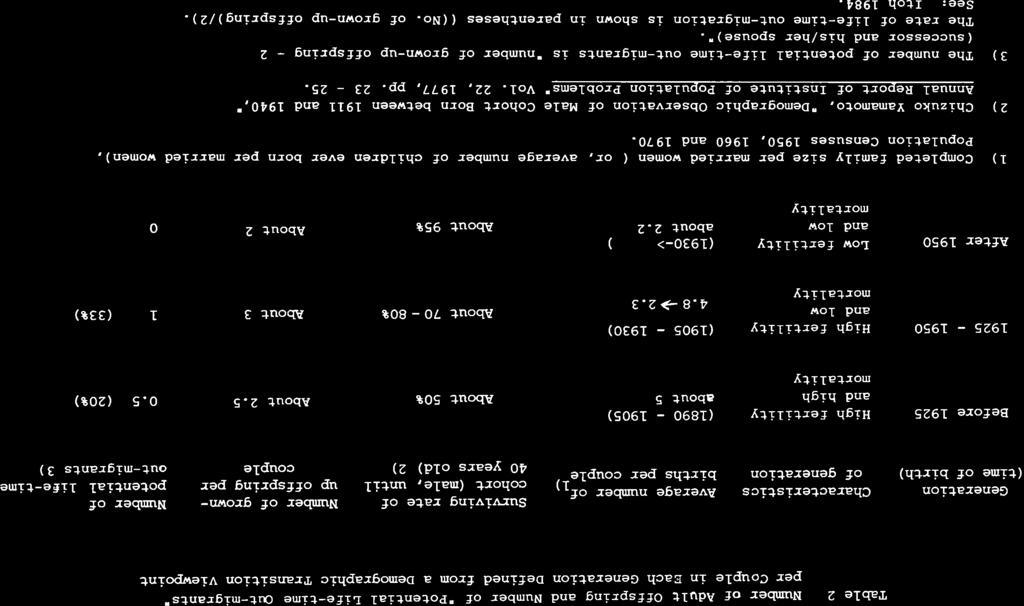
120
121
122
123
124
125

126 Notes (*1) For example United Nations, PATTERNS OF URBAN AND RURAL POPULATION GROWTH, United Nations, New York, 1980 (ST/ESA/SER.A/68), and Hauser, M. Philip, Robert W. Gardner, Aprodico A. Laquian and Salah El-Shakhs, Population and the Urban Future, State University of New York, New York, (*2) Japan, Statistics Bureau,Office of the Prime Minister, 1960 Population Census Densely Inhabited Districts - Its Population, Areas and Map (*3) Atsushi Ohtomo, Distribution of Urban Population in Japan, Taimeido, Refer especially to pp (*4) Ibid. (*5) Toshio Kuroda, Nihon Jinkoron (Population Dynamics in Japan) Jichosa, 1983, p.47 (*6) Shigeo Nojiri, "Nomin Rison no Jisyoteki Kenkyu (study on migrants from Farmer's Family)" Iwanami Shoten, Refer especially to pp (*7) Tatsuo Honda, "Historical Analysis of Japanese Demographical Problems - An Introduction to Study of Demographic Problems in Rural Areas","Jinko Mondai Kenkyu" Vol. 6, No. 2, 1950, pp (*8) Tatsuo Honda, "Historical Analysis of Japanese Demographic Problems", Society for study of farming population, "Noson Jinko Mondai Kenkyu" Vol. 2, 1952, p.59. (*9) Shokichi Namiki, "Migration of Farming Population," Population in Rural Areas edited by Shigeio Noguchi, Chuo Keizaisha, 1959, pp (*10) Fujio Yamaguchi, "Patterns of Long Distance Migration", "Regional Structures of migration" (Japanese Regional Structures 5) edited by Tatsuya Itoh, Hiroo Naito and Fujio Yamaguchi, Taimeido, 1979, pp (*11) Tatsuya Itoh, "Recent Trends of Internal Migration in Japan and "Potential Life-time Out-migrants", Jinko Mondai Kenkyu No. 172, 1984, pp (*12) Hiroaki Shimizu summarizes the succession system of our country: "As is well know, the succession system of our
 and \"succession by selected child\" (parents select which child will succeed family.")
127 country can be classified into four: "succession by eldest son" (eldest son succeeds family), "succession by first born child" or "succession by eldest daughter" (first born child, either male or female, remains in family,) and "succession by selected child" (parents select which child will succeed family.)" Hiroaki Shimizu, "Structure of Household and Family," "Koureika Syakai eno Michi (Process to Aged Society)" edited by Fumio Miura and Yoichi Okazaki, Chuo Hoki Shuppan, 1982, note (3) on p.183 concerning pp (*13) Tokuzo Omachi, "Family," Societies and Folkways (1) (Outline of Japanese Ethnography, Vol. 3,) Heibonsha, 1962, pp Refer especially to pp (*14) Michio Suenari, "Kinship and Relatives", Anthropology edited by Teigo Yoshida, Toyo Keizai Shimposha, 1975, and Hiroaki Shimizu, "Family/Household," "Regional Structures of Migration" edited by Tatsuya Itoh, Hiroo Naito and Fujio Yamaguchi, pp Refer especially to pp
Demographic Transition in Japan and Rural Development
 "Population and Development" Series No. 1 Demographic Transition in Japan and Rural Development FEBRUARY 1985 The Asian Population and Development Association (foundation) CHAPTER 1 CHARACTERISTICS OF
People. Population size and growth
 The social report monitors outcomes for the New Zealand population. This section provides background information on who those people are, and provides a context for the indicators that follow. People Population
Human Population Growth Through Time
 Human Population Growth Through Time Current world population: 7.35 Billion (Nov. 2016) http://www.worldometers.info/world-population/ 2012 7 billion 1999 13 years 12 years 1974 1927 1804 13 years 14 years
Can Japan Take Standpoint Promoting Establishment of Common Currency in East Asia?
 Far Eastern Studies Vol.8 March 2009 Center for Far Eastern Studies, University of Toyama Can Japan Take Standpoint Promoting Establishment of Common Currency in East Asia? Takaaki HATTORI * 1 Introduction
Summary of the Results
 Summary of the Results CHAPTER I: SIZE AND GEOGRAPHICAL DISTRIBUTION OF THE POPULATION 1. Trends in the Population of Japan The population of Japan is 127.77 million. It increased by 0.7% over the five-year
 http://www.youtube.com/watch?v=ymwwrgv_aie Demographics Demography is the scientific study of population. Demographers look statistically as to how people are distributed spatially by age, gender, occupation,
CHAPTER I: SIZE AND GEOGRAPHICAL DISTRIBUTION OF THE POPULATION
 CHAPTER I: SIZE AND GEOGRAPHICAL DISTRIBUTION OF THE POPULATION 1. Trends in the Population of Japan The population of Japan is 127.77 million. It increased by 0.7% over the five-year period, the lowest
1 Dr. Center of Sociology, Ho Chi Minh National Political Academy, Vietnam.
 Conference "Southeast Asia s Population in a Changing Asian Context June 10-13, 2002 Siam City Hotel, Bangkok, Thailand The Patterns of fertility decline and family changes in Vietnam s emerging market
Population & Migration
 Population & Migration Population Distribution Humans are not distributed evenly across the earth. Geographers identify regions of Earth s surface where population is clustered and regions where it is
11. Demographic Transition in Rural China:
 11. Demographic Transition in Rural China: A field survey of five provinces Funing Zhong and Jing Xiang Introduction Rural urban migration and labour mobility are major drivers of China s recent economic
Population Change and Public Health Exercise 8A
 Population Change and Public Health Exercise 8A 1. The denominator for calculation of net migration rate is A. Mid year population of the place of destination B. Mid year population of the place of departure
TOPICS INCLUDE: Population Growth Demographic Data Rule of 70 Age-Structure Pyramids Impact of Growth UNIT 3: POPULATION
 TOPICS INCLUDE: Population Growth Demographic Data Rule of 70 Age-Structure Pyramids Impact of Growth UNIT 3: POPULATION # of individuals in a given area Uniform equally spaced Clumped/Clustered individuals
DRIVERS OF DEMOGRAPHIC CHANGE AND HOW THEY AFFECT THE PROVISION OF EDUCATION
 DRIVERS OF DEMOGRAPHIC CHANGE AND HOW THEY AFFECT THE PROVISION OF EDUCATION This paper provides an overview of the different demographic drivers that determine population trends. It explains how the demographic
People. Population size and growth. Components of population change
 The social report monitors outcomes for the New Zealand population. This section contains background information on the size and characteristics of the population to provide a context for the indicators
Human development in China. Dr Zhao Baige
 Human development in China Dr Zhao Baige 19 Environment Twenty years ago I began my academic life as a researcher in Cambridge, and it is as an academic that I shall describe the progress China has made
Population & Migration
 Population & Migration Population Distribution Humans are not distributed evenly across the earth. Geographers identify regions of Earth s surface where population is clustered and regions where it is
INFOSTAT INSTITUTE OF INFORMATICS AND STATISTICS Demographic Research Centre. Population in Slovakia 2004
 INFOSTAT INSTITUTE OF INFORMATICS AND STATISTICS Demographic Research Centre Population in Slovakia 24 Bratislava, December 25 2 Population of Slovakia 24 Analytical publication, which assesses the population
FOREIGN TRADE DEPENDENCE AND INTERDEPENDENCE: AN INFLUENCE ON THE RESILIENCE OF THE NATIONAL ECONOMY
 FOREIGN TRADE DEPENDENCE AND INTERDEPENDENCE: AN INFLUENCE ON THE RESILIENCE OF THE NATIONAL ECONOMY Alina BOYKO ABSTRACT Globalization leads to a convergence of the regulation mechanisms of economic relations
PROJECTING THE LABOUR SUPPLY TO 2024
 PROJECTING THE LABOUR SUPPLY TO 2024 Charles Simkins Helen Suzman Professor of Political Economy School of Economic and Business Sciences University of the Witwatersrand May 2008 centre for poverty employment
STRENGTHENING RURAL CANADA: Fewer & Older: Population and Demographic Crossroads in Rural Saskatchewan. An Executive Summary
 STRENGTHENING RURAL CANADA: Fewer & Older: Population and Demographic Crossroads in Rural Saskatchewan An Executive Summary This paper has been prepared for the Strengthening Rural Canada initiative by:
Number of marriages increases and number of divorces decreases; infant mortality rate is the lowest ever
 Demographic Statistics 2017 15 November 2018 Number of marriages increases and number of divorces decreases; infant mortality rate is the lowest ever The demographic situation in Portugal in 2017 continues
10/24/2017. China. Labor Shortage in China?! Outline. Population Pattern. Population from Censuses
 China Population and Family Planning (chapter 6) Labor Shortage in China?! 1.4 Billion vs. 325 million (U.S.) Made in China, China as the factory of the world V.S. Chinese Labor, Cheap No More In Coastal
Supplementary Notes: (PJ Shlachtman, Miller book) Human Population: Growth, Demography, and Carrying Capacity
 Human Population: Growth, Demography, and Carrying Capacity") Supplementary Notes: (PJ Shlachtman, Miller book) Human Population:, Demography, and Carrying Capacity Factors Affecting Human Population Size Pop. size is affected by birth s, death s, emigration and
Supplementary Notes: (PJ Shlachtman, Miller book) Human Population:, Demography, and Carrying Capacity Factors Affecting Human Population Size Pop. size is affected by birth s, death s, emigration and
SS 11: COUNTERPOINTS CH. 13: POPULATION: CANADA AND THE WORLD NOTES the UN declared the world s population had reached 6 billion.
 SS 11: COUNTERPOINTS CH. 13: POPULATION: CANADA AND THE WORLD NOTES 1 INTRODUCTION 1. 1999 the UN declared the world s population had reached 6 billion. 2. Forecasters are sure that at least another billion
The Trends of Income Inequality and Poverty and a Profile of
 http://www.info.tdri.or.th/library/quarterly/text/d90_3.htm Page 1 of 6 Published in TDRI Quarterly Review Vol. 5 No. 4 December 1990, pp. 14-19 Editor: Nancy Conklin The Trends of Income Inequality and
NAME DATE CLASS. Directions: Answer each of the following questions. Include in your answers the vocabulary words in parentheses.
 Vocabulary Activity Content Vocabulary Directions: Answer each of the following questions. Include in your answers the vocabulary words in parentheses. 1. What does the term crude birthrate have to do
The Demography of the Labor Force in Emerging Markets
 The Demography of the Labor Force in Emerging Markets David Lam I. Introduction This paper discusses how demographic changes are affecting the labor force in emerging markets. As will be shown below, the
Evaluating the Role of Immigration in U.S. Population Projections
 Evaluating the Role of Immigration in U.S. Population Projections Stephen Tordella, Decision Demographics Steven Camarota, Center for Immigration Studies Tom Godfrey, Decision Demographics Nancy Wemmerus
Education and Fertility in Two Chinese Provinces : to
 Articles Education and Fertility in Two Chinese Provinces : to China s family planning programme has been able to transcend the barriers of illiteracy and low educational levels By Ronald Freedman, Xiao
Migrant Youth: A statistical profile of recently arrived young migrants. immigration.govt.nz
 Migrant Youth: A statistical profile of recently arrived young migrants. immigration.govt.nz ABOUT THIS REPORT Published September 2017 By Ministry of Business, Innovation and Employment 15 Stout Street
STATISTICAL REFLECTIONS
 World Population Day, 11 July 217 STATISTICAL REFLECTIONS 18 July 217 Contents Introduction...1 World population trends...1 Rearrangement among continents...2 Change in the age structure, ageing world
vi. rising InequalIty with high growth and falling Poverty
 43 vi. rising InequalIty with high growth and falling Poverty Inequality is on the rise in several countries in East Asia, most notably in China. The good news is that poverty declined rapidly at the same
Pakistan 2.5 Europe 11.5 Bangladesh 2.0 Japan 1.8 Philippines 1.3 Viet Nam 1.2 Thailand 1.0
 173 People Snapshots Asia and the Pacific accounts for nearly 55% of global population and 6 of the world s 10 most populous economies. The region s population is forecast to grow by almost 1 billion by
Poverty Profile. Executive Summary. Kingdom of Thailand
 Poverty Profile Executive Summary Kingdom of Thailand February 2001 Japan Bank for International Cooperation Chapter 1 Poverty in Thailand 1-1 Poverty Line The definition of poverty and methods for calculating
Figure 1. International Student Enrolment Numbers by Sector 2002 to 2017
 International Student Enrolments in Australia by Sector in Comparison to Higher Education Professor Emeritus Frank P. Larkins The University of Melbourne Summary The growth in international students enrolling
A population with a rising average age, with a growing proportion of people aged over 65yrs. Ageing population
 Ageing population Age structure Agricultural change A population with a rising average age, with a growing proportion of people aged over 65yrs Percentage of the population (or number of people of each
Chinese on the American Frontier, : Explorations Using Census Microdata, with Surprising Results
 Chew, Liu & Patel: Chinese on the American Frontier Page 1 of 9 Chinese on the American Frontier, 1880-1900: Explorations Using Census Microdata, with Surprising Results (Extended Abstract / Prospectus
Changing Times, Changing Enrollments: How Recent Demographic Trends are Affecting Enrollments in Portland Public Schools
 Portland State University PDXScholar School District Enrollment Forecast Reports Population Research Center 7-1-2000 Changing Times, Changing Enrollments: How Recent Demographic Trends are Affecting Enrollments
Chapter 6: Human Population & Its Impact How many is too many? 7 billion currently; 1.6 mill. more each week ~2.4 bill. more by 2050 Developing 82%
 Chapter 6: Human Population & Its Impact How many is too many? 7 billion currently; 1.6 mill. more each week ~2.4 bill. more by 2050 Developing 82% of population Developed high resource use; (more coming
Social Stratification: Sex and Gender Part III
 Social Stratification: Sex and Gender Part III Culture does not make people. People make culture. If it is true that the full humanity of women is not our culture, then we can and must make it our culture.
APES Chapter 10 Study Guide. 1. How can the population change in a particular year be calculated?
 APES Chapter 10 Study Guide 1. How can the population change in a particular year be calculated? 2. Define the term crude birth rate. 3. Name the continent that has the highest crude birth rate and crude
Extended Abstract. The Demographic Components of Growth and Diversity in New Hispanic Destinations
 Extended Abstract The Demographic Components of Growth and Diversity in New Hispanic Destinations Daniel T. Lichter Departments of Policy Analysis & Management and Sociology Cornell University Kenneth
Case Study on Youth Issues: Philippines
 Case Study on Youth Issues: Philippines Introduction The Philippines has one of the largest populations of the ASEAN member states, with 105 million inhabitants, surpassed only by Indonesia. It also has
GLOBALIZATION S CHALLENGES FOR THE DEVELOPED COUNTRIES
 GLOBALIZATION S CHALLENGES FOR THE DEVELOPED COUNTRIES Shreekant G. Joag St. John s University New York INTRODUCTION By the end of the World War II, US and Europe, having experienced the disastrous consequences
The new demographic and social challenges in Spain: the aging process and the immigration
 International Geographical Union Commission GLOBAL CHANGE AND HUMAN MOBILITY The 4th International Conference on Population Geographies The Chinese University of Hong Kong (10-13 July 2007) The new demographic
Executive summary. Part I. Major trends in wages
 Executive summary Part I. Major trends in wages Lowest wage growth globally in 2017 since 2008 Global wage growth in 2017 was not only lower than in 2016, but fell to its lowest growth rate since 2008,
Population Outlook for the Portland-Vancouver Metropolitan Region
 Portland State University PDXScholar Institute of Portland Metropolitan Studies Publications Institute of Portland Metropolitan Studies 2007 Population Outlook for the Portland-Vancouver Metropolitan Region
Is Economic Development Good for Gender Equality? Income Growth and Poverty
 Is Economic Development Good for Gender Equality? February 25 and 27, 2003 Income Growth and Poverty Evidence from many countries shows that while economic growth has not eliminated poverty, the share
THE ROLE OF INTERNATIONAL MIGRATION IN MAINTAINING THE POPULATION SIZE OF HUNGARY BETWEEN LÁSZLÓ HABLICSEK and PÁL PÉTER TÓTH
 THE ROLE OF INTERNATIONAL MIGRATION IN MAINTAINING THE POPULATION SIZE OF HUNGARY BETWEEN 2000 2050 LÁSZLÓ HABLICSEK and PÁL PÉTER TÓTH INTRODUCTION 1 Fertility plays an outstanding role among the phenomena
GLOBALISATION AND ASIAN YOUTH
 GLOBALISATION AND ASIAN YOUTH by Graeme Hugo Federation Fellow, Professor of Geography and Director of the National Centre for Social Applications of GIS, The University of Adelaide Paper presented at
The labor market in Japan,
 DAIJI KAWAGUCHI University of Tokyo, Japan, and IZA, Germany HIROAKI MORI Hitotsubashi University, Japan The labor market in Japan, Despite a plummeting working-age population, Japan has sustained its
SUMMARY ANALYSIS OF KEY INDICATORS
 SUMMARY ANALYSIS OF KEY INDICATORS from the FSM 2010 Census of Population and Housing DIVISION OF STATISTICS FSM Office of Statistics, Budget, Overseas Development Assistance and Compact Management (S.B.O.C)
MAJOR DETERMINANTS OF POPULATION GROWTH
 MAJOR DETERMINANTS OF POPULATION GROWTH ww.arseam.com Dr. Nasreen A Ashraf Vasundhara Vihar Colony, Lucknow, India E-mail: drssashraf.sjc@gmail.com Abstract The term Population Growth or Population change
Bangladesh and Pakistan: Divergent Developments
 Bangladesh and Pakistan: Divergent Developments Between Indian independence in 1947 and the end of the civil war (1965 1971) Pakistan and Bangladesh together constituted the state of Pakistan. Since they
HIGHLIGHTS. There is a clear trend in the OECD area towards. which is reflected in the economic and innovative performance of certain OECD countries.
 HIGHLIGHTS The ability to create, distribute and exploit knowledge is increasingly central to competitive advantage, wealth creation and better standards of living. The STI Scoreboard 2001 presents the
david e. bloom and david canning
 demographics and development policy BY B y late 2011 there will be more than 7 billion people in the world, with 8 billion in 2025 and 9 billion before 2050. New technologies and institutions, and a lot
INTERNATIONAL GENDER PERSPECTIVE
 Chapter 7 INTERNATIONAL GENDER PERSPECTIVE OF DEVELOPMENT INDICATORS Women & Men In India 2016 115 116 International Gender Perspective International Gender Perspective of Development Indicators India
Assuming the Future: Evaluating World Population Projections
 Assuming the Future: Evaluating World Population Projections By Joseph Chamie Extended Abstract World population, now at 7 billion, is expected to be nearing stabilization at 10 billion by the end of the
Population Table 1. Population of Estonia and change in population by census year
 Population 1881 2000 A country s population usually grows or diminishes due to the influence of two factors: rate of natural increase, which is the difference between births and deaths, and rate of mechanical
Migrations and work: the demographic perspective
 Migrations and work: the demographic perspective Europe and Africa: facing each other, linked by the Mediterranean, one that has the absolute need to export labour in massive amounts and the other the
Social and Demographic Trends in Burnaby and Neighbouring Communities 1981 to 2006
 Social and Demographic Trends in and Neighbouring Communities 1981 to 2006 October 2009 Table of Contents October 2009 1 Introduction... 2 2 Population... 3 Population Growth... 3 Age Structure... 4 3
AMID Working Paper Series 45/2005
 AMID Working Paper Series 45/2005 The Demography of the Middle East and North Africa in a Global Context Poul Chr. Matthiessen Collstrops Fond Introduction The present paper aims to provide a description
Chapter One: people & demographics
 Chapter One: people & demographics The composition of Alberta s population is the foundation for its post-secondary enrolment growth. The population s demographic profile determines the pressure points
ASEAN: THE AEC IS HERE, FINALLY 2030: NOMINAL GDP USD TRILLION US CHINA EURO AREA ASEAN JAPAN UK $20.8 $34.6 IN IN
 14: NOMINAL GDP USD TRILLION US EURO AREA CHINA JAPAN UK $2.9 $4.6 : THE AEC IS HERE, FINALLY $1.4 $13.4 $17.4 3: NOMINAL GDP USD TRILLION US CHINA EURO AREA JAPAN UK $6.8 $6.4 $8.5 $.8 $34.6 $33.6 $2.5
Youth labour market overview
 1 Youth labour market overview With 1.35 billion people, China has the largest population in the world and a total working age population of 937 million. For historical and political reasons, full employment
Population, Health, and Human Well-Being-- Portugal
 Population, Health, and Human Well-Being-- Portugal EarthTrends Country Profiles Demographic and Health Indicators Portugal Europe World Total Population (in thousands of people) 1950 8,405 548,206 2,519,495
Demography. Demography is the study of human population. Population is a dynamic open systems with inputs, processes and outputs.
 Population Demography Demography is the study of human population. Population is a dynamic open systems with inputs, processes and outputs. This means that change constantly occurs in population numbers,
LABOUR AND EMPLOYMENT
 5 LABOUR AND EMPLOYMENT The labour force constitutes a key resource that is vital in the growth and development of countries. An overarching principle that guides interventions affecting the sector aims
The reviewer finds it an unusually congenial task to comment
 Annotations 129 the concise, historical summary and the exposition of the possibilities of future development. A valuable selected bibliography is appended. N orman Jolliffe, M.D. PUBLIC HEALTH A N D DEM
MAGNET Migration and Governance Network An initiative of the Swiss Development Cooperation
 International Labour Organization ILO Regional Office for the Arab States MAGNET Migration and Governance Network An initiative of the Swiss Development Cooperation The Kuwaiti Labour Market and Foreign
How Long will China s Demographic Dividend Continue? A Question with Implications for Sustainable Economic Growth
 How Long will China s Demographic Dividend Continue? A Question with Implications for Sustainable Economic Growth Summary By Keiichiro Oizumi Senior Economist Center for Pacific Business Studies Economics
How s Life in Austria?
 How s Life in Austria? November 2017 Austria performs close to the OECD average in many well-being dimensions, and exceeds it in several cases. For example, in 2015, household net adjusted disposable income
Growth and Migration to a Third Country: The Case of Korean Migrants in Latin America
 JOURNAL OF INTERNATIONAL AND AREA STUDIES Volume 23, Number 2, 2016, pp.77-87 77 Growth and Migration to a Third Country: The Case of Korean Migrants in Latin America Chong-Sup Kim and Eunsuk Lee* This
birth control birth control brain drain birth rate coastal plain commuting Consciously preventing unwanted pregnancies.
 birth control birth control Consciously preventing unwanted pregnancies. Consciously preventing unwanted pregnancies. birth rate brain drain Scientists from Britain to America The number of live births
Gender Issues and Employment in Asia
 J ERE R. BEHRMAN AND ZHENG ZHANG Abstract A major means of engaging women more in development processes is increasingly productive employment. This paper adds perspective on gender issues and employment
Asia-Pacific Population Journal. Vol. 27, No.1, June 2012
 Asia-Pacific Population Journal Vol. 27, No.1, June 2012 Asia-Pacific Population Journal i Full text of articles available at: www.unescap.org/appj.asp ASIA-PACIFIC POPULATION JOURNAL Vol. 27, No. 1,
PRESENT TRENDS IN POPULATION DISTRIBUTION
 PRESENT TRENDS IN POPULATION DISTRIBUTION Conrad Taeuber Associate Director, Bureau of the Census U.S. Department of Commerce Our population has recently crossed the 200 million mark, and we are currently
Shrinking populations in Eastern Europe
 Shrinking populations in Eastern Europe s for policy-makers and advocates What is at stake? In several countries in Eastern Europe, populations are shrinking. The world s ten fastest shrinking populations
Foreign workers in the Korean labour market: current status and policy issues
 Foreign workers in the Korean labour market: current status and policy issues Seung-Cheol Jeon 1 Abstract The number of foreign workers in Korea is growing rapidly, increasing from 1.1 million in 2012
Spatial Inequality in Cameroon during the Period
 AERC COLLABORATIVE RESEARCH ON GROWTH AND POVERTY REDUCTION Spatial Inequality in Cameroon during the 1996-2007 Period POLICY BRIEF English Version April, 2012 Samuel Fambon Isaac Tamba FSEG University
Britain s Population Exceptionalism within the European Union
 Britain s Population Exceptionalism within the European Union Introduction The United Kingdom s rate of population growth far exceeds that of most other European countries. This is particularly problematic
Population Aging, Immigration and Future Labor Shortage : Myths and Virtual Reality
 Population Aging, Immigration and Future Labor Shortage : Myths and Virtual Reality Alain Bélanger Speakers Series of the Social Statistics Program McGill University, Montreal, January 23, 2013 Montréal,
2. In what stage of the demographic transition model are most LDC? a. First b. Second c. Third d. Fourth e. Fifth
 1. The three largest population clusters in the world are in a. East Asia, South Asia, Southeast Asia b. East Asia, South Asia, South America c. Africa, South Asia, East Asia d. Australia, South Asia,
STRENGTHENING RURAL CANADA: Fewer & Older: The Coming Demographic Crisis in Rural Ontario
 STRENGTHENING RURAL CANADA: Fewer & Older: The Coming Demographic Crisis in Rural Ontario An Executive Summary 1 This paper has been prepared for the Strengthening Rural Canada initiative by: Dr. Bakhtiar
Poverty profile and social protection strategy for the mountainous regions of Western Nepal
 October 2014 Karnali Employment Programme Technical Assistance Poverty profile and social protection strategy for the mountainous regions of Western Nepal Policy Note Introduction This policy note presents
World Population A.D World Population from the Beginnings to the Present. Words
 1 Today, about 6 billion people live on our earth. Each year, the world s population grows by about 80 million. If it continues to grow at such a rate the world s population will reach 9 billion by the
INTERNATIONAL COMPARISON
 Chapter 7 INTERNATIONAL COMPARISON OF GENDER INDICATORS Women & Men in India -2017 125 126 International Comparison of Gender Indicators International Comparison of Gender Indicators India is part of many
Chapter 5: Internationalization & Industrialization
 Chapter 5: Internationalization & Industrialization Chapter 5: Internationalization & Industrialization... 1 5.1 THEORY OF INVESTMENT... 4 5.2 AN OPEN ECONOMY: IMPORT-EXPORT-LED GROWTH MODEL... 6 5.3 FOREIGN
Policy Brief on Migration and Urbanization
 The Republic of the Union of Myanmar 2014 Myanmar Population and Housing Census Policy Brief on Migration and Urbanization Department of Population Ministry of Labour, Immigration and Population With technical
A COMPARISON OF ARIZONA TO NATIONS OF COMPARABLE SIZE
 A COMPARISON OF ARIZONA TO NATIONS OF COMPARABLE SIZE A Report from the Office of the University Economist July 2009 Dennis Hoffman, Ph.D. Professor of Economics, University Economist, and Director, L.
No. 1. THE ROLE OF INTERNATIONAL MIGRATION IN MAINTAINING HUNGARY S POPULATION SIZE BETWEEN WORKING PAPERS ON POPULATION, FAMILY AND WELFARE
 NKI Central Statistical Office Demographic Research Institute H 1119 Budapest Andor utca 47 49. Telefon: (36 1) 229 8413 Fax: (36 1) 229 8552 www.demografia.hu WORKING PAPERS ON POPULATION, FAMILY AND
Keys to a Sustainable Development Path
 Keys to a Sustainable Development Path Prof. Shigeru T. OTSUBO GSID, Nagoya University Topic 1 The Evolution of a Development Paradigm Revolutions and & the Evolution of Economic Systems This part was
Meanwhile, the foreign-born population accounted for the remaining 39 percent of the decline in household growth in
 3 Demographic Drivers Since the Great Recession, fewer young adults are forming new households and fewer immigrants are coming to the United States. As a result, the pace of household growth is unusually
Global Changes and Fundamental Development Trends in China in the Second Decade of the 21st Century
 Global Changes and Fundamental Development Trends in China in the Second Decade of the 21st Century Zheng Bijian Former Executive Vice President Party School of the Central Committee of the CPC All honored
THE IMPACT OF CHAIN MIGRATION ON ENGLISH CITIES
 Briefing Paper 9.13 www.migrationwatchuk.org THE IMPACT OF CHAIN MIGRATION ON ENGLISH CITIES Summary 1. Government proposals on chain migration have overlooked the most important factor - transcontinental
Unit 1 Population dynamics
 Unit 1 Population dynamics Dynamics continually changing Population is the centre around which human geography revolves. Because populations change constantly over time it is necessary for geographers
6. Policy Recommendations on How to Strengthen Financial Cooperation in Asia Wang Tongsan
 6. Policy Recommendations on How to Strengthen Financial Cooperation in Asia Wang Tongsan Institute of Quantitative & Technical Economics Chinese Academy of Social Sciences -198- Since the Chiang Mai Initiative
The population of Spain will decrease 1.2% in the next 10 years if the current demographic trends remain unchanged
 28 September 2011 Short-Term Population Projection for Spain, 2011-2021 The population of Spain will decrease 1.2% in the next 10 years if the current demographic trends remain unchanged From 2019 the
Introduction: The State of Europe s Population, 2003
 Introduction: The State of Europe s Population, 2003 Changes in the size, growth and composition of the population are of key importance to policy-makers in practically all domains of life. To provide
Mexico: How to Tap Progress. Remarks by. Manuel Sánchez. Member of the Governing Board of the Bank of Mexico. at the. Federal Reserve Bank of Dallas
 Mexico: How to Tap Progress Remarks by Manuel Sánchez Member of the Governing Board of the Bank of Mexico at the Federal Reserve Bank of Dallas Houston, TX November 1, 2012 I feel privileged to be with