Willow dale East Neighborhood
|
|
|
- Shawn Lewis
- 6 years ago
- Views:
Transcription


1 Willow dale East Neighborhood Community Well-Being Report ( ) By Paridokht Shahcheraghi Toronto Centre for Community Learning & Development 1
2 Table of content List of Abbreviations 2 Glossary 3 Executive Summary 4 5 Introduction Neighborhood profile Methodology 9 Analysis Economy Education Environment & Infrastructure Mental/Physical Health Civic/Community Engagement Governance Conclusion 26 Recommendations References 27 2
3 Acknowledgment I would like to send my gratitude to: Alfred Jean-Baptiste - the Executive Director of the Toronto Center for Community Learning and Development Caroline-Mahlikah Aweri Outten Deputy Executive Director of the Toronto Centre for Community Learning and development Ryan Fukunaga (Digital Tech) Mercedes Intern from the University of Toronto, assistant of Writing Workshop Sara Abdulhussain Intern from the University of Toronto, assistant of Writing Workshop Sarah Gaikwad Representative from the Chang School, instructor of Writing Workshop Sureya Ibrahim (Community Engagement Worker) Soheil Shafagh 3
4 EXECUTIVE SUMMARY Well-being survey plays a key role in the Immigrant Women Integration Program, Toronto Centre for Community Learning and Development (TCCL&D). This survey provides an overview of the community s needs. This report is based on the Canadian Index of Well-Being, which includes: demographic information, living standards, health, democratic engagement, community validity, public services, leisure and culture and environment friendly activities. This survey was directed from October 2014 to November 2014 in the Willow dale East neighborhood. Respondents participated by filling out a hard copy form or even an online version of the form in order to identify the gaps among the community s ability to access different accessible services. From all the resident that fill out the survey in this neighborhood,they know the name of neighborhood, 72% of residents live in this neighborhood less than 5 years, the majority of them live in their home less than 5 years. 25% of them are between years old, and 23% are between years old, and 12% are between years old, and 10% are under 20 years old, 61% of them are female, 76 % of them married, 17% of them are single. 27% of them graduate degree or higher and 25% are undergraduate degree from university or college. 61% have education and training in specific field. 97% of applicants speak as intermediate level,78% of them have permanent resident,76% live in Canada between 1-5 years, the majority of respondents from Middle East and 6% from East Asian.72% speak in this neighborhood with 1 or 3 people and 70% sometimes visit or chat with their neighbors and The majority of respondents believed that they have moderate impact to their neighborhood,51% of applicants have school-aged children and 56% sometimes are actively involved with activities in their neighborhood.65% of them they not participants in any neighborhood groups or organization.57% of them attended in community events. 44% they are satisfied of their neighborhood. The majority of them mentioned that this neighborhood is safe. 23% of them their annual household income is less than $ 5000 and 19% are between $ $ % live in rental apartment. 38% of resident mentioned that half of their household income spent on housing. 13% employee and 33% study in school.51% say their health is good.85% they don t smoke cigarettes or any tobaccos products. 46% to exercise less than once a week. More than half of them live in near the Subway station from their home. About 4
5 all of them buy most of their meats, fruits and vegetables in their neighborhood and the majority of them are satisfied with groceries. They mentioned that they are satisfied of neighborhood because of safety. Based on ( statistic Canada census ) 63% of population in this neighborhood are between years old and 11% are seniors. 30% of population of willow dale east the mother tongue is English and 66% have Nonofficial mother tongue. The 3 top mother tongue language is, 11% Farsi, 10% Korean, 9% Chinese. 68% live in apartment and 18% live in single -Detached House. Unemployment rate is 8% and 86% have postsecondary certificate diploma and degree. 26% of population ( after tax-household income) the annual income are between $26000 to $ % of population are low-income and Median After Tax-Household Income are $69000 is the same with city of Toronto. In ward 23 Median Household income is $55000 and top 5 ethnic origins is Chinese, Korean, Iranian, Italian, Jewish. Unemployment rate is 7%. Newcomer generally are less overweight or obese, smoke less, drink less alcohal but have higher rates of depression after giving birth and have poorer dental health and they are less active. Mental health and chronic diseases in newcomers are less likely than Canadian-born residents. In ward 23 compare with City of Toronto we have a lower rate of hospitalization and mortality for Respiratory diseases, Cancer and Cardiovascular disease and lower rate of sexually transmitted infections and similar rate of enteric disease and Influenza. 5
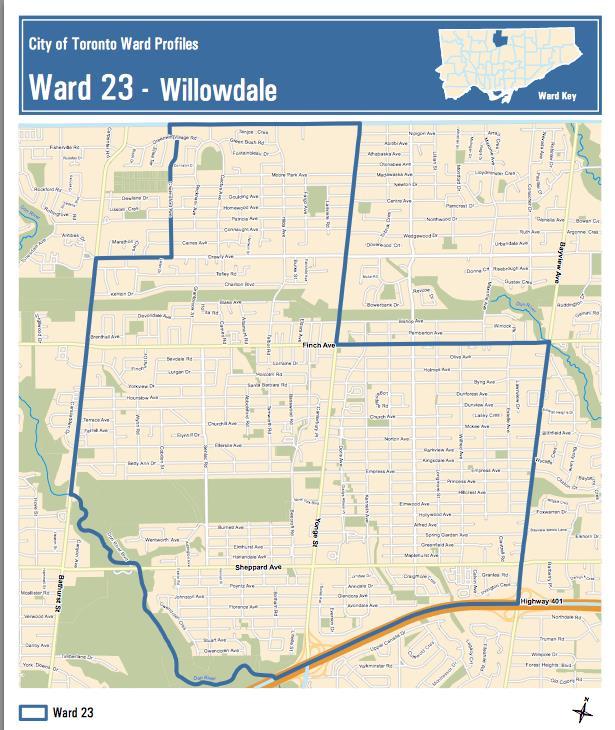
6 INTRODUCTION Willow dale is an established,affluent community in the city of Toronto,Ontario, Canada, located in the district of North York.It was originally made up of from three postal villages Newton brook,willow dale and Lansing. Willow dale was originally postal village (orig.willow Dale) which covered the area from Finch Ave.at the north to Elmwood Ave at the south and Bathurst st.at the west to Bay view Ave. at the east.the postal village of Lansing was from Elmwood Ave. at the north to approx.hwy.401 at the south and Bathurst st.at the west to Bay view Ave.at the east (East of Bay view Ave. would have been the postal village of Oriole.)The north- south centerline of Lansing and Willow dale was Yonge st.the postal village of Lansing remained in existence until the post office at Lansing corner (northwest corner of Yonge St. and Sheppard Ave) was closed. When a new post office was built in Willow dale, the whole area of the former postal village of Lansing and Willow dale then became Willow dale, but still only a postal village, all within the township of North York at that time.newton brook,originally Newton Brook, was also a postal village, located on Yonge st.,north from Finch Ave. to Steel Ave). The boundaries of the current neighborhood extend as far as Victoria Park Avenue, west to Bathurst street south to the 401 freeway, and north to Steels avenue.willowdale east are located between Finch Ave., in the north, Bay view Ave., in the east, Yonge street in the west and 401 high way in south. 6
7 Neighborhood Profile Toronto North York Ward 23 7
: Leung,")

")
8 Willow dale East Member of Parliament (MP): Leung, Chungsen Member of Provincial Parliament (MPP): Hon David Zimmer, MPP (Willow dale) Councilor: John Filion 8
9 METHODOLOGY This year, we were a group of newcomers women, participating in the Immigrant Women s Integration Leadership Program. This year we were conducting a survey to measure well-being in our neighborhoods, by conducting a Well-being survey, we hope to get a better understanding of how you and others in our neighborhoods experience day-to-day life. For example, the various ways individuals are able to develop their potential, work productively and creatively, build strong and positive relationship with others and contribute to community. In Willow dale east I distribute 50 hard copy and 50 online draft in different places for example in community center Saint Stephen community house, door to door in my neighborhood, North York library, Mel Lastman Square, North York Civic Center, people who shopping in Wholefood store in Yonge and Sheppard, Loblaws store in Cummer Centre, People who sitting in Coffee shop for example : Star Box,Second cup and Mac Donald Café. Willow dale East has many shopping centre, Farmer s Market in Mel Lastman Square on every Thursday in summer with reasonable price of course organic. People on Thursday bought a food and sat the chair in Mel Lastman Square and enjoyed the local food. In Mel Lastman Square every Friday in summer has many festival that cause people who lived here feel happy. It has a beautiful center that named Sheppard Center with a nice food court. I think this neighborhood is very safe, convenient, accessible to Subway with high educated people, so happy and care about health, with people who know about healthy food and care about them. 9


10 Analysis Figure1. 26% of applicants in Willow dale East between and 23% between Age % 11% 26% 23% 13% 23% Under and over Figure 1.Blonging of age Education 64% 36% Yes No Figure 2. The number of residents who have Canadian training/experience Figure2. 64% of people who fill up the survey are training experience or Canadian education. 10
11 2% 98% Yes No Figure 3. The majority of respondents English is second language. Figure 3. The number of residents who speak English as a second Figure 4.The level of speaking English Figure 4. 55% speak English as an intermediate, 7% speak English fluently 18% 7% 20% 55% Fluent Advanced Intermediate Basic 11


12 Figure 5. 79% of them are permanent resident and %21 Canadian resident. 79% 0% 21% Figure5. Figure 5. 79% permanet residents and 77% of them came to Canada between 1-5 years Canadian citizen Permanent resident Conventional Refugee Refugee Claimant International Student Temporary foreign worker Visitor 12
13 Civic Engagement Strongly agree Somewhat agre 7%0% 2% 4% 36% 51% Neither agree nor disagree Somewhat disagree Strongly disagree Don't know Figure 6. People around the Willow dale east, %51 responded that they are willing to help their neighbors and 36% responded neither agree nor disagree. 13
14 Figure7. People in this neighborhood 51% somewhat agree help their neighbors even if they are from different back grounds..half of the respondents told that they were helping with each other. Civic Engagement 4%0% 2% 5% 36% 53% Strongly agree Somewhat agree Neither agree nor disagree Somewhat disagree 6%2% 0%11% 26% 55% Strongly agree Somewhat agree Neither agree nor disagree Somewhat disagree Strongly disagree Don't know Figure 8. Figur 8.The majority of respondents in Willow dale speak and talk with neighbors at least between one and three people and get along with each other. Figure 8.People in Willow dale East get along with each other and 55% responded that they are somewhat disagree with this question that ( people in this neighborhood generally don t get along with each other). 73% said that they speak with people at least between 1-3 people in a day. 14
15 Civic Engagement 9% 15% 0% 4% 72% Figure 9. The majority of people in Willow dale east speak with neighboors between 1-3 people every day. Figure10. Civic Engagement 17% 4% 9% 70% Often Sometimes Rarely Never Figure 10.The majority of people in Willow dale East sometimes visit or chat with neighboors. 15
16 Figure % 0% 4% Big impact Moderate Small impact No impact 77% Figure 11.77% people responded that we have moderate impact with each other to build the better neighborhood. 51% they have school-aged children and %56 sometimes involved with activity in school in their school. 65% currently participate in any neighborhood group or organization and only 22% attended a community meeting public, hearing and discussion group and. 10% called or sent a letter to any local politician. 4% joined the protest or demonstration. 16
17 Figure % 4% 0% 8% 43% Very Unsatisfied Unsatisfied Not Sure Satisfied Very Satisfied Figure % satisfied with the neighborhood and 43% very unsatisfied. Safety 0% 2% Yes No Don't Know 98% Figure 13. Almost all of the applicants mentioned that Willow dale east is a good place and safe. 17
18 Figure 14. Economic 19% 9% 13% 4%2% 23% 6% 9% 4% 11% Less than $5,000 $5,001-$1,0000 $10,001-$20,000 $20,001-$25,000 $25,001-$35,000 $35,001-$45,000 $45,001-$55,000 $55,001-$65,000 $65,001-$75,000 More than $75,000 Figure 14.According by the data in Willow dale East 23% of applicants, their annual income is less than $5000 and 6% between$ 5000 till $10000 and 19% annual income is between $55000 till $ Figure 15. 7% 0%4% Very Dissatisfied 19% Somewhat Dissatisfied Somewhat Satisfied Satisfied 70% Very Satisfied Figure 15. Most of the applicants satisfied with standard of living. 18
19 Health 6% 0%7% 17% 70% Very Dissatisfied Somewhat Dissatisfied Somewhat Satisfied Satisfied Very Satisfied Figure 16. The majority of applicants somewhat satisfied with their currently achieving in life.70% somewhat satisfied with personal relationships and 74 %satisfied with feeling part of their community. 63% they feel safe with their community.59% are agree with interacting job and family. Figure 17. More than half of them feel happy. Health 66% 0% 2% 32% Very unhappy Unhappy Neither unhappy nor happy Happy Very happy 19
20 Economy Figure % 2% 13% 51% Very confident Confident Neither confident nor not confident Not confident Figure % are neither confident nor not confident with lenders and informal Credit and 34% not confident with informal Credit when they had financial difficulties. 9%0% Very confident 23% Confident 68% Neither confident nor not confident Not confident Figure 19. Figure 19. With financial difficulty 65% confident with getting help from family and relative and 51% neither confident nor not confident with Group and association. 81% are confident with Government and Bank. 80% satisfied with other formal credit. 20
21 Economic Very Dissatisfied 15% 0% 19% Somewhat Dissatisfied Somewhat Satisfied 34% 32% Satisfied Very Satisfied Figure % satisfied with household situation.and 55% thought that the future is likely they will be better than today. In this neighborhood most of the respondents unsatisfied with household situation. About half of them live in rental apartment and every year the price goes up. Figure % 2% 0% Own Rent 45% Living with family Living with friends Shelter No housing Figure % of people that filled up the survey their housing are rent. 21

22 Figure 22. Economic 9% 0%11% 0%4% 6% 38% 32% Less than 10% 11-20% 21-30% 31-40% 41-50% 51-60% 61-70% 71-75% More than 75% Figure % of people said that 41-50% of their household income spent on housing. 32% of people said that 31-40%, their household income spent on housing. About half of the household income spent on housing and 11% more than 75% of income spent for housing. 22
23 Figure 23. 8% 6% 15% 33% 12% 14% 8%4% Educational In school Employed Volunteering Business owner Unpaid work at home In a training program Looking for work Other 33% of people that filled up the survey were in the school and 14% were employee. 51% told their healthy are good. 85% they did not smoke cigarettes and tobaccos produc. Figure 24.The majority of them told that their health were good. Health 51% 2%2% 7% 38% Excellent Very good Good Fair Poor 23
24 Figure 25. Physical Activity Physical Activity Once a week 47% 4% 17% 32% Twice a week More than twice a week Less than once a week Figure % less than once week had at least 30 minutes of physical exercise. 32% more than twice a week had physical activity at least 30 minutes. Less than half of applicants do exercise more than twice a week. It shows many people in this neighbrhood do exercise less than Canadian citizen. Environmental Less than 15 minutes Figure 26.The majority of them live near the subway and it takes less than 15 minutes. 16 to 30 minutes 31 to 40 minutes 41 to 50 minutes 51 to 60 minutes 61 to 75 minutes More than 90 minutes Don't Know 24

25 Enviornmental 4% 96% Yes No Figure 27. Almost all of them are able to buy most of their maeats and vegetables and fruits in their neighborhood.. Conclusion and Recommendation By data this neighborhood is very safe and have a new buildings,beautiful condominium, Townhouses, houses and rental apartments, with a lot of immigrants from Middle East and East Asia, so convenient, accessible to Subway,with friendly people, so safe but the most significant challenges in the neighborhood right now the lack of community centre,i saw many people from this neighborhood had long waiting list for English classes. This neighborhood needs more community centre for huge of immigrants that they will come and want to be settle. In Willow dale east does not have community center for information to newcomers for renting and buying apartment or house. We need a specific community close to this neighborhood.i think government should be more inspect the activity of Real State Agencies and also 25
26 government providing subsidized language courses, building a community centre, establishing policies that would inhibit unregulated real-state inflation. References City of Toronto. (2012, May). Willow dale East - Your City. Retrieved November 28, 2014, Retrieved from: d60f89RCRD&vgnextchannel=1e68f40f9aae0410VgnVCM d60f89 RCRD. 26
27 27
CRESCENT TOWN EAST YORK
 CRESCENT TOWN EAST YORK COMMUNITY NEEDS ASSESSMENT REPORT 2014-2015 TORONTO CENTRE FOR COMMUNITY LEARNING AND DEVELOPMENT IMMIGRANT WOMEN INTEGRATION PROGRAM (IWIP) Presented by: NIPA KAR January 16th,
(Note: These are inititial neighbourhood estimates and are subject to change.) 1,000 Female 54%
 1,000 Female 54%") LAWRENCE AVE E 0-4 5-9 10-14 15-19 20-24 25-29 30-34 35-39 40-44 45-49 50-54 55-59 60-64 65-69 70-74 75-79 80-84 85-89 90-94 95-99 100+ 2011 Neighbourhood Demographic Estimates RAILSIDE RD C P R DON RIVER
LAWRENCE AVE E 0-4 5-9 10-14 15-19 20-24 25-29 30-34 35-39 40-44 45-49 50-54 55-59 60-64 65-69 70-74 75-79 80-84 85-89 90-94 95-99 100+ 2011 Neighbourhood Demographic Estimates RAILSIDE RD C P R DON RIVER
Moss Park Neighborhood Needs Assessment Report- Community Well Being ( ) Toronto Centre for Community Learning & Development.
 Toronto Centre for Community Learning & Development.") Moss Park Neighborhood Needs Assessment Report- Community Well Being (2012-2013) Toronto Centre for Community Learning & Development Fatma Bafagih Friday February 15 th, 2013 Acknowledgements I would like
Moss Park Neighborhood Needs Assessment Report- Community Well Being (2012-2013) Toronto Centre for Community Learning & Development Fatma Bafagih Friday February 15 th, 2013 Acknowledgements I would like
(Note: These are inititial neighbourhood estimates and are subject to change.) NEI Score. 1,000 Female 52%
 NEI Score. 1,000 Female 52%") 0-4 5-9 10-14 15-19 20-24 25-29 30-34 35-39 40-44 45-49 50-54 55-59 60-64 65-69 70-74 75-79 80-84 85-89 90-94 95-99 100+ 2011 Neighbourhood Demographic Estimates EGLINTON AVE E C P R DON VALLEY PARKWAY
0-4 5-9 10-14 15-19 20-24 25-29 30-34 35-39 40-44 45-49 50-54 55-59 60-64 65-69 70-74 75-79 80-84 85-89 90-94 95-99 100+ 2011 Neighbourhood Demographic Estimates EGLINTON AVE E C P R DON VALLEY PARKWAY
Regent Park Neighbourhood Needs Assessment Report
 2014-2015 Regent Park Neighbourhood Needs Assessment Report Toronto Centre for Community Learning & Development - Immigrant Women Integration Program Irum Siddiqui 1 2014-2015 Acknowledgements This Community
(Note: These are inititial neighbourhood estimates and are subject to change.) SCARBOROUGH SHORELINE. NEI Score. 1,500 Female 53%
 SCARBOROUGH SHORELINE. NEI Score. 1,500 Female 53%") 0-4 5-9 10-14 15-19 20-24 25-29 30-34 35-39 40-44 45-49 50-54 55-59 60-64 65-69 70-74 75-79 80-84 85-89 90-94 95-99 100+ 2011 Neighbourhood Demographic Estimates HIGHLAND CREEK WEST HIGHLAND CREEK KINGSTON
0-4 5-9 10-14 15-19 20-24 25-29 30-34 35-39 40-44 45-49 50-54 55-59 60-64 65-69 70-74 75-79 80-84 85-89 90-94 95-99 100+ 2011 Neighbourhood Demographic Estimates HIGHLAND CREEK WEST HIGHLAND CREEK KINGSTON
(Note: These are inititial neighbourhood estimates and are subject to change.) C P R. NEI Score. 600 Female 51%
 C P R. NEI Score. 600 Female 51%") 0-4 5-9 10-14 15-19 20-24 25-29 30-34 35-39 40-44 45-49 50-54 55-59 60-64 65-69 70-74 75-79 80-84 85-89 90-94 95-99 100+ 2011 Neighbourhood Demographic Estimates STEELES AVE W FENMAR DR C P R GARYRAY DR
0-4 5-9 10-14 15-19 20-24 25-29 30-34 35-39 40-44 45-49 50-54 55-59 60-64 65-69 70-74 75-79 80-84 85-89 90-94 95-99 100+ 2011 Neighbourhood Demographic Estimates STEELES AVE W FENMAR DR C P R GARYRAY DR
Black and Minority Ethnic Group communities in Hull: Health and Lifestyle Summary
 Black and Minority Ethnic Group communities in Hull: Health and Lifestyle Summary Public Health Sciences Hull Public Health April 2013 Front cover photographs of Hull are taken from the Hull City Council
Crescent Town & Oakridge NEIGHBOURHOOD PROFILE: TAYLOR MASSEY
 & NEIGHBOURHOOD PROFILE: TAYLOR MASSEY February 2017 Neighbourhood Profile: Taylor Massey Located within the inner suburbs of, the Taylor Massey neighbourhood 1 is rich in its ethnic and cultural diversity.
What is the Census? Why is it important?
 1 What is the Census? Every five years, Statistics Canada conducts a Census providing a detailed account of the Canadian population. The Census is intended to provide snapshot of the demographic, social
(Note: These are inititial neighbourhood estimates and are subject to change.) C P R. NEI Score. Female 52%
 C P R. NEI Score. Female 52%") 0-4 5-9 10-14 15-19 20-24 25-29 30-34 JANE ST 35-39 40-44 45-49 50-54 55-59 60-64 65-69 70-74 75-79 80-84 85-89 90-94 95-99 100+ 2011 Neighbourhood Demographic Estimates EGLINTON AVE W JANE ST WESTON RD
0-4 5-9 10-14 15-19 20-24 25-29 30-34 JANE ST 35-39 40-44 45-49 50-54 55-59 60-64 65-69 70-74 75-79 80-84 85-89 90-94 95-99 100+ 2011 Neighbourhood Demographic Estimates EGLINTON AVE W JANE ST WESTON RD
Community Resources & Needs Assessment Report of Regent Park. By Fahmida Hossain
 Community Resources & Needs Assessment Report of Regent Park By Fahmida Hossain The Centre for Community Learning & Development March, 2012 0 Executive Summary The purpose of this report is to provide
(Note: These are inititial neighbourhood estimates and are subject to change.) C N R. NEI Score. Female 54%
 C N R. NEI Score. Female 54%") 0-4 5-9 10-14 15-19 20-24 25-29 30-34 35-39 40-44 45-49 50-54 55-59 60-64 65-69 70-74 75-79 80-84 85-89 90-94 95-99 100+ 2011 Neighbourhood Demographic Estimates STANSBURY CRES MIDLAND AVE CITADEL DR WEST
0-4 5-9 10-14 15-19 20-24 25-29 30-34 35-39 40-44 45-49 50-54 55-59 60-64 65-69 70-74 75-79 80-84 85-89 90-94 95-99 100+ 2011 Neighbourhood Demographic Estimates STANSBURY CRES MIDLAND AVE CITADEL DR WEST
Kensington-Chinatown. Resource & Needs Assessment Report. Kathryn Lin
 Kensington-Chinatown Resource & Needs Assessment Report Kathryn Lin February 14 th, 2011 ACKNOWLEDGEMENT I am very thankful to Alfred Jean Baptiste, the Executive Director of Centre for Community Learning
CITY OF MISSISSAUGA. Overview 2-1. A. Demographic and Cultural Characteristics
 Portraits of Peel Overview 2-1 A. Demographic and Cultural Characteristics Population: Size, Age and Growth 2-2 Immigrants 2-3 Visible Minorities 2-4 Language 2-5 Religion 2-6 Mobility Status 2-7 B. Household
Keelesdale-Eglinton West
 BLACK CREEK DR 0-4 5-9 10-14 15-19 20-24 25-29 30-34 KEELE ST 35-39 40-44 45-49 50-54 -59 KANE AVE 60-64 65-69 70-74 75-79 80-84 85-89 90-94 95-99 100+ 2011 Neighbourhood Demographic Estimates EGLINTON
BRAMALEA. Overview A. Demographic and Cultural Characteristics
 The Social Planning Council of Peel Portraits of Peel BRAMALEA Overview 13-1 A. Demographic and Cultural Characteristics Population: Size, Age and Growth 13-2 Immigrants 13-3 Visible Minorities 13-4 Language
Regina City Priority Population Study Study #2 - Immigrants. August 2011 EXECUTIVE SUMMARY
 Regina City Priority Population Study Study #2 - Immigrants August 2011 EXECUTIVE SUMMARY Executive Summary The City of Regina has commissioned four background studies to help inform the development of
COMMUNITY PROFILE COQUITLAM. Coquitlam Immigrant Demographics I Page 1
 COMMUNITY PROFILE COQUITLAM Coquitlam Demographics I Page 1 COQUITLAM IMMIGRANT DEMOGRAPHICS Your quick and easy look at facts and figures around immigration. Newcomers are an important and growing part
London & Middlesex Local Immigration Partnership: Community Capacity and Perceptions of the LMLIP
 Community Capacity and Perceptions of the LMLIP 1 London & Middlesex Local Immigration Partnership: Community Capacity and Perceptions of the LMLIP Prepared by: Amanda DeVaul-Fetters, Kelly Barnes, and
people/hectare Ward Toronto
 Bar Chart showing the rate of population growth between the years 2006 and 2016 for the Ward compared to the City of based on the 2006 and data. For more information, please contact Michael Wright at 416-392-7558
COMMUNITY PROFILE TOWNSHIP OF LANGLEY. Township of Langley Immigrant Demographics I Page 1
 COMMUNITY PROFILE TOWNSHIP OF LANGLEY Township of Langley Demographics I Page 1 TOWNSHIP OF LANGLEY IMMIGRANT DEMOGRAPHICS Your quick and easy look at facts and figures around immigration. Newcomers are
North York City of Toronto Community Council Area Profiles 2016 Census
 Bar Chart showing the rate of population growth between the years 2006 and 2016 for the Ward compared to the City of based on the 2006 and data. For more information, please contact Michael Wright at 416-392-7558
Ward 4 Etobicoke Centre City of Toronto Ward Profiles 2016 Census
 Bar Chart showing the rate of population growth between the years 2006 and 2016 for the Ward compared to the City of based on the 2006 and data. For more information, please contact Michael Wright at 416-392-7558
Ward 17 Davenport City of Toronto Ward Profiles 2016 Census
 Bar Chart showing the rate of population growth between the years 2006 and 2016 for the Ward compared to the City of based on the 2006 and data. For more information, please contact Michael Wright at 416-392-7558
Bostwick Neighbourhood Profile
 Bostwick Profile For further information contact: John-Paul Sousa Planning Research Analyst Direct: (519) 661-2500 ext. 5989 I email: jpsousa@london.ca Page 1 Page 2 Population Characteristics & Age Distribution
Readily Available Immigration Data
 Readily Available Immigration Data Tristan Cayn Research Officer, Strategic Research and Statistics PMC Node Meeting Calgary, Alberta November 25, 2008 Overview What immigration data is readily available?
Scarborough City of Toronto Community Council Area Profiles 2016 Census
 Bar Chart showing the rate of population growth between the years 2006 and 2016 for the Ward compared to the City of based on the 2006 and data. For more information, please contact Michael Wright at 416-392-7558
3.1 HISTORIC AND FORECASTED POPULATION FIGURES
 SECTION 3: COMMUNITY PROFILE This section contains an overview of demographic characteristics which are applicable to the analysis of Vaughan s parks, recreation, and library facilities. Identifying who
Ward 14 Parkdale-High Park City of Toronto Ward Profiles 2016 Census
 Bar Chart showing the rate of population growth between the years 2006 and 2016 for the Ward compared to the City of based on the 2006 and data. For more information, please contact Michael Wright at 416-392-7558
TOWNSHIP OF LANGLEY, B.C Township of Langley Immigrant Demographics I
 Immigrant demographics TOWNSHIP OF LANGLEY, B.C. - 2018 Township of Langley Immigrant Demographics I Page 1 TOWNSHIP OF LANGLEY IMMIGRANT DEMOGRAPHICS Your quick and easy look at facts and figures around
Enderby A City in North Okanagan Regional District
 Produced by Stats for Global NonResponse Rate: 44.3 Population Total Immigrants Change in Change in Immigrants Population Number Percent Population Number Percent 1991 2,128 23.8 1991 to 1996 626 3 13.
Community Social Profile Cambridge and North Dumfries
 Community Trends for 2013 in Cambridge, North Dumfries, Wellesley, Wilmot and Woolwich Community Social Profile - Cambridge and North Dumfries Published December 2014 Community Social Profile Cambridge
Fanshawe Neighbourhood Profile
 Fanshawe Profile For further information contact: John-Paul Sousa Planning Research Analyst Direct: (519) 661-2500 ext. 5989 I email: jpsousa@london.ca Page 1 Page 2 Population Characteristics & Age Distribution
Immigrant PORT COQUITLAM, B.C Port Coquitlam Immigrant Demographics I
 Immigrant demographics PORT COQUITLAM, B.C. - 2018 Immigrant Demographics I Page 1 PORT COQUITLAM IMMIGRANT DEMOGRAPHICS Your quick and easy look at facts and figures around immigration. Newcomers are
Socio-Economic Profile
 LOCAL HEALTH AREA 7 - Socio-Economic Profile Powell River Comox Cumberland Denman Island Hornby Island Qualicum CENSUS POPULATION LAND AREA POPULATION DENSITY Number % of Region Sq. Km. % of Region Persons
2016 Census Bulletin: Immigration & Ethnic Diversity
 2016 Census Bulletin: Immigration & Ethnic Diversity Kingston, Ontario Census Metropolitan Area (CMA) The 2016 Census Day was May 10, 2016. On October 25, 2017, Statistics Canada released its sixth data
The population universe (target population) of the 2011 Census includes the following groups:
 of the 2011 Census includes the following groups:") Glossary DEMOGRAPHICS Population The population universe includes variables that provide information about individuals, covering demographic characteristics and language. See Figure 16 for a list of these
Glossary DEMOGRAPHICS Population The population universe includes variables that provide information about individuals, covering demographic characteristics and language. See Figure 16 for a list of these
COMMUNITY PROFILE BURNABY
 COMMUNITY PROFILE BURNABY Burnaby Demographics I Page 1 BURNABY IMMIGRANT DEMOGRAPHICS Your quick and easy look at facts and figures around immigration. Newcomers are an important and growing part of your
The Global City: Newcomer Health in Toronto
 STAFF REPORT ACTION REQUIRED The Global City: Newcomer Health in Toronto Date: November 15, 2011 To: From: Wards: Board of Health Medical Officer of Health All Reference Number: SUMMARY Toronto Public
A Social Profile of the Halton Visible Minority Population
 Halton Social Planning Council and Volunteer Centre A Social Profile of the Halton Visible Minority Population December 2000 Prepared by Ted Hildebrandt Senior Planner Lyn Apgar - Research Associate December
Ward 16 River. City of Ottawa Ward Profiles 2011 Census and National Household Survey POPULATION* 45, ,390. Total City of Ottawa Population
 POPULATION* Total Ward Population 45,795 +2.0% 2006-2011 Total City of Ottawa Population 883,390 +8.8% 2006-2011 Population by Age Group Ward 16 City of Ottawa 2006 2011 06-11 2006 2011 06-11 Age Group
 www.actrochester.org Monroe County General Overview Monroe County is the region s urban center and reflects the highs and lows, and stark disparities, of the Finger Lakes region. It has the most educated
2011 CENSUS & NATIONAL HOUSEHOLD SURVEY CITY OF BRAMPTON - WARD 3 PROFILE
 2011 CENSUS & NATIONAL HOUSEHOLD SURVEY CITY OF BRAMPTON WARD 3 PROFILE WARD HIGHLIGHTS Population 47,500 2011 Population 50.7% Females 2011 Population by Age Group 13% 18% 014 9.07% of total population
Immigrant. coquitlam, B.C Coquitlam Immigrant Demographics I
 Immigrant demographics coquitlam, B.C. - 2018 Immigrant Demographics I Page 1 coquitlam IMMIGRANT DEMOGRAPHICS Your quick and easy look at facts and figures around immigration. Newcomers are an important
Part II. Description of the Community Assessment
 Rubina Aktar 1 Part II. Description of the Community Assessment A. Use Census Tract or other statistical resources to determine boundaries of the community This community is known as Gramercy Park and
2011 CENSUS & NATIONAL HOUSEHOLD SURVEY CITY OF BRAMPTON - WARD 10 PROFILE
 2011 CENSUS & NATIONAL HOUSEHOLD SURVEY CITY OF BRAMPTON WARD 10 PROFILE WARD HIGHLIGHTS Population 10.72% of total population 56,185 2011 Population 33 Median Age 50.1% Females 49.9% Males 2011 Population
Planning Study Area 1 Burnaby Heights
 Neighbourhood Profiles 2006 Census Planning Study Area 1 Heights is bounded by Burrard Inlet to the north, Willingdon Avenue to the east, Hastings Street to the south and Boundary Road to the west. PLANNING
Spryfield Highlights. Household Living Arrangements. The following are highlights from the 2016 Census.
 Highlights The following are highlights from the 2016 Census., as defined for United Way's Action for Neighbourhood Change, had a Census population of 11,700 in 2016. The outline shown to the right, and
NEXT STEPS: IMMIGRATION AND SETTLEMENT TO CAPE BRETON ISLAND
 NEXT STEPS: IMMIGRATION AND SETTLEMENT TO CAPE BRETON ISLAND May 4 th, 2015 Final Report: Phase I Immigration Partnerships Department of International & Aboriginal Affairs Cape Breton University Contents
Canada s Health Region Peer Groups. How do we compare?
 Canada s ealth Region Peer Groups ow do we compare? Prepared by James aggerstone September 18, 2014 The following document is a draft document prepared to bring some of the evidence about this subject
The Chinese Community in Canada
 Catalogue no. 89-621-XIE No. 001 ISSN: 1719-7376 ISBN: 0-662-43444-7 Analytical Paper Profiles of Ethnic Communities in Canada The Chinese Community in Canada 2001 by Colin Lindsay Social and Aboriginal
Social and Demographic Trends in Burnaby and Neighbouring Communities 1981 to 2006
 Social and Demographic Trends in and Neighbouring Communities 1981 to 2006 October 2009 Table of Contents October 2009 1 Introduction... 2 2 Population... 3 Population Growth... 3 Age Structure... 4 3
Food Insecurity among Latin American Recent Immigrants in Toronto. Dr. Mandana Vahabi. Dr. Cecilia Rocha. Daphne Cockwell School of Nursing
 Food Insecurity among Latin American Recent Immigrants in Toronto Dr. Mandana Vahabi Daphne Cockwell School of Nursing Dr. Cecilia Rocha School of Nutrition Centre for Studies in Food Security Ryerson
new westminster, B.C New Westminster Immigrant Demographics I
 Immigrant demographics new westminster, B.C. - 2018 Immigrant Demographics I Page 1 new westminster IMMIGRANT DEMOGRAPHICS Your quick and easy look at facts and figures around immigration. Newcomers are
Introduction... i. Population Family Structure Education Mobility Status... 7
 Table of Contents Introduction... i Population... 2 Family Structure... 5 Education... 6 Mobility Status... 7 ward two Ethnicity, Language, Immigrants and Visible Minority... 9 Labour Force Characteristics...13
2016 Census Bulletin: Education and Labour
 2016 Census Bulletin: Education and Labour Kingston, Ontario Census Metropolitan Area (CMA) The 2016 Census Day was May 10, 2016. In the fall of 2017, Statistics Canada released various data sets from
Verdun borough HIGHLIGHTS. In 1996, the Verdun borough had a population of 59,714. LOCATION
 Socio-economic profile borough February 2002 HIGHLIGHTS In 1996, the borough had a population of 59,714. LOCATION Between 1991 and 1996, the population of the borough declined by 2.6%. One-person households
REGENT PARK NEIGHBOURHOOD NEEDS ASSESSMENT REPORT - COMMUNITY WELL BEING
 REGENT PARK NEIGHBOURHOOD NEEDS ASSESSMENT REPORT - COMMUNITY WELL BEING 2012-2013 CENTER FOR COMMUNITY LEADERSHIP & DEVELOPMENT IMMIGRANT WOMEN INTEGRATION PROGRAM SHERRY (SHUANGMEI) SUI 1 Acknowledgment:
Castlegar A City in Central Kootenay Regional District
 Produced by Stats for Population Total Immigrants Change in Change in Immigrants Population Number Percent Population Number Percent 1991 6,579 885 13.5 1991 to 1996 448 45 5.1 1996 7,27 93 13.2 1996 to
COMMUNITY PROFILE: Fort St. John, British Columbia Census Subdivision (CSD) PHASE 1 Winter 2018
 PHASE 1 Winter 2018") COMMUNITY PROFILE: Fort St. John, British Columbia Census Subdivision (CSD) PHASE 1 Winter 2018 About the Community Development Institute Established in 2004, the Community Development Institute (CDI)
COMMUNITY PROFILE: Fort St. John, British Columbia Census Subdivision (CSD) PHASE 1 Winter 2018 About the Community Development Institute Established in 2004, the Community Development Institute (CDI)
4. How would you describe the area where you live? Would you say you live in...
 Gallup, The Gallup Poll, and CE 11 are trademarks of Gallup, Inc. Copyright 199-000, 008-010 Gallup, Inc. All rights reserved. Knight Foundation Questionnaire 010 1. In what county do you live?. Please
MAKING CANADA HOME: THE SYRIAN REFUGEE RESETTLEMENT INITIATIVE TWO YEARS AFTER ARRIVAL
 MAKING CANADA HOME: THE SYRIAN REFUGEE RESETTLEMENT INITIATIVE TWO YEARS AFTER ARRIVAL TABLE OF CONTENTS EXECUTIVE SUMMARY... 2 KEY FINDINGS FROM SYRIAN NEWCOMERS LIVING IN THE GREATER TORONTO AREA AFTER
Additional Data and Insights for Mississauga s 2018 Vital Signs. Gap Between the Rich and Poor. Income
 Additional Data and Insights for Mississauga s 2018 Vital Signs Gap Between the Rich and Poor Income The maps below show how the average individual incomes in the Greater Toronto Area have changed since
I would like to speak about meaningful representation and empowerment for effective political participation.
 UN Forum on Minorities and Effective Political Participation Agenda Item V. National Practices and Real Experiences Presentation by Mary Anne Chambers Ladies and gentlemen. My name is Mary Anne Chambers.
CENSUS RESULTS WARD 3 PROFILE
 2011 CENSUS RESULTS WARD 3 PROFILE Town of Halton Hills City of Brampton Hwy. 407 Finch Ave. Town of Milton Hwy. 407 ETR Ninth Line 10 Derry Rd. Winston Churchill Blvd. 9 Erin Mills Pkwy. Mississauga Rd.
T H E P I T T S B U R G H Q U A L I T Y O F L I F E
 U C S U R T H E P I T T S B U R G H Q U A L I T Y O F L I F E introduction In order to understand where we are going, we must first understand where we are. In that spirit, we are pleased to release a
CENSUS RESULTS WARD 8 PROFILE
 2011 CENSUS RESULTS WARD 8 PROFILE Town of Halton Hills City of Brampton Hwy. 407 Finch Ave. Town of Milton Hwy. 407 ETR Ninth Line 10 Derry Rd. Winston Churchill Blvd. 9 Erin Mills Pkwy. Mississauga Rd.
2011 CENSUS & NATIONAL HOUSEHOLD SURVEY CITY OF BRAMPTON - WARD 1 PROFILE
 CENSUS & NATIONAL HOUSEHOLD SURVEY CITY OF BRAMPTON WARD 1 PROFILE WARD HIGHLIGHTS Population 53,130 Population 51.0% Females Population by Age Group 9% 20% 014 10.14% of total population 36 Median Age
St. James Town Need Assessment Report. A Partial requirement for the fulfillment of Immigrant Women Leadership Training Program
 St. James Town Need Assessment Report A Partial requirement for the fulfillment of Immigrant Women Leadership Training Program Sheela Bhandari 2011/2012 Acknowledgement This study is one the community
CENSUS RESULTS NATIONAL HOUSEHOLD SURVEY
 2011 CENSUS RESULTS NATIONAL HOUSEHOLD SURVEY INTRODUCTION The inaugural National Household Survey (NHS) was a voluntary survey which replaced the mandatory long-form census questionnaire. The NHS was
2011 CENSUS & NATIONAL HOUSEHOLD SURVEY CITY OF BRAMPTON - WARD 4 PROFILE
 2011 CENSUS & NATIONAL HOUSEHOLD SURVEY CITY OF BRAMPTON WARD 4 PROFILE WARD HIGHLIGHTS Population 9.51% of total population 49,850 2011 Population 34 Median Age 50.5% Females 49.5% Males 2011 Population
Survey Community Index of Wellbeing Report: Regent Park
 2010-2011 Survey Community Index of Wellbeing Report: Regent Park BY: Uttara Chowdhury Introduction:- Survey Community index of wellbeing 2010 is done by a group of newcomer women from community across
Port McNeill A Town in Mount Waddington Regional District
 Produced by Stats for Global NonResponse Rate: 35.1 Population Total Immigrants Change in Change in Immigrants Population Number Percent Population Number Percent 1991 2,641 225 8.5 1991 to 1996 284 5
Corporate. Report COUNCIL DATE: April 28, 2008 NO: R071 REGULAR COUNCIL. TO: Mayor & Council DATE: April 28, 2008
 Corporate NO: R071 Report COUNCIL DATE: April 28, 2008 REGULAR COUNCIL TO: Mayor & Council DATE: April 28, 2008 FROM: General Manager, Planning and Development FILE: 6600-01 SUBJECT: 2006 Census Information
CENSUS RESULTS WARD 7 PROFILE
 2011 CENSUS RESULTS WARD 7 PROFILE Town of Halton Hills City of Brampton Hwy. 407 Finch Ave. Town of Milton Hwy. 407 ETR Ninth Line 10 Derry Rd. Winston Churchill Blvd. 9 Erin Mills Pkwy. Mississauga Rd.
Introduction... i. Population Family Structure Education Mobility Status... 7
 Table of Contents Introduction... i Population... 2 Family Structure... 5 Education... 6 Mobility Status... 7 Ethnicity, Language, Immigrants and Visible Minority... 9 ward three Labour Force Characteristics...13
View Royal A Town in Capital Regional District
 Produced by Stats for Global NonResponse Rate: 18.4 Population Total Immigrants Change in Change in Immigrants Population Number Percent Population Number Percent 1991 5,996 9 15.6 1991 to 1996 445 315
Vaughan Community Health Centre Community Profiles
 Vaughan Community Health Centre Community Profiles Prepared by Public Interest Strategy and Communications May 2009 Table of Contents Vaughan Stories to Tell...3 Concord Neighbourhood Profile...19 Kleinburg
Nelson A City in Central Kootenay Regional District
 Produced by Stats for Global NonResponse Rate: 28.3 Population Total Immigrants Change in Change in Immigrants Population Number Percent Population Number Percent 1991 8,849 1,175 13.3 1991 to 1996 736
Immigrant DELTA, B.C Delta Immigrant Demographics I
 Immigrant demographics DELTA, B.C. - 2018 Immigrant Demographics I Page 1 DELTA IMMIGRANT DEMOGRAPHICS Your quick and easy look at facts and figures around immigration. Newcomers are an important and growing
City of Bellingham Residential Survey 2013
 APPENDICES City of Bellingham Residential Survey 2013 January 2014 Pamela Jull, PhD Rachel Williams, MA Joyce Prigot, PhD Carol Lavoie P.O. Box 1193 1116 Key Street Suite 203 Bellingham, Washington 98227
CENSUS RESULTS WARD 9 PROFILE
 2011 CENSUS RESULTS WARD 9 PROFILE Town of Halton Hills City of Brampton Hwy. 407 Finch Ave. Town of Milton Hwy. 407 ETR Ninth Line 10 Derry Rd. Winston Churchill Blvd. 9 Erin Mills Pkwy. Mississauga Rd.
TAKING STOCK for TAKING ACTION. Capacity for Newcomer Settlement and Integration in Saskatoon
 for Capacity for Newcomer Settlement and Integration in Saskatoon INTRODUCTION All newcomers to Saskatoon have something to offer our city, and at times they need help finding ways to use their knowledge
Regina City Priority Population Study Study #1 - Aboriginal People. August 2011 EXECUTIVE SUMMARY
 Regina City Priority Population Study Study #1 - Aboriginal People August 2011 EXECUTIVE SUMMARY Executive Summary The City of Regina has commissioned four background studies to help inform the development
Settlement and Housing Experiences of Recent Immigrants in Small-and Mid-sized Cities in the Interior of British Columbia
 Settlement and Housing Experiences of Recent Immigrants in Small-and Mid-sized Cities in the Interior of British Columbia Carlos Teixeira (University of British Columbia Okanagan Campus) & Julie Drolet
Harrison Hot Springs A Village in Fraser Valley Regional District
 Global NonResponse Rate: 42.4 Population Total Immigrants Change in Change in Immigrants Population Number Percent Population Number Percent 1991 655 17 26. 1991 to 1996 243 3 17.6 1996 898 2 22.3 1996
Detention Centers Rapid Food Assessment
 August 2016 Detention Centers Rapid Food Assessment Detention Task Force Libya Introduction Over the course of the year Detention Centre Task Force, through its members working in the Detention Centres,
Bayt.com Middle East Consumer Confidence Index. February 2016
 Bayt.com Middle East Consumer Confidence Index February 2016 Section 1 PROJECT BACKGROUND Objectives To understand perceptions and attitudes of consumers in the Middle East regarding the economy of their
Lake Country A District Municipality in Central Okanagan Regional District
 Produced by Stats for Population Total Immigrants Change in Change in Immigrants Population Number Percent Population Number Percent 1991 1991 to 1996 1996 9,7 1,275 14.2 1996 to 1 26 7 5.5 1 9,267 1,345
CENSUS RESULTS WARD 10 PROFILE
 2011 CENSUS RESULTS WARD 10 PROFILE Town of Halton Hills City of Brampton Hwy. 407 Finch Ave. Town of Milton Hwy. 407 ETR Ninth Line 10 Derry Rd. Winston Churchill Blvd. 9 Erin Mills Pkwy. Mississauga
WHO ARE THE MILLENNIALS SUPPORTING DONALD TRUMP?
 WHO ARE THE MILLENNIALS SUPPORTING DONALD TRUMP? A research study brief from the 2017 Millennial Impact Report detailing Trump voter responses. Do millennials support President Donald Trump? At least a
City Windsor 1981 Canada Census WARD 1
 City Windsor 1981 Canada Census March 2, 2012 Table of Contents... 3 POPULATION BY AGE... 4 LANGUAGE/RELIGION... 5 ETHNICITY/MOBILITY... 6 BIRTHPLACE / IMMIGRATION... 7 EDUCATION / LABOUR FORCE... 8 INDUSTRY
CENSUS RESULTS WARD 6 PROFILE
 2011 CENSUS RESULTS WARD 6 PROFILE Town of Halton Hills City of Brampton Hwy. 407 Finch Ave. Town of Milton Hwy. 407 ETR Ninth Line 10 Derry Rd. Winston Churchill Blvd. 9 Erin Mills Pkwy. Mississauga Rd.
Cache Creek A Village in Thompson-Nicola Regional District
 A Village in ThompsonNicola Regional District Produced by Stats for Global NonResponse Rate: 39.1 Population Total Immigrants Change in Change in Immigrants Population Number Percent Population Number
GCB Survey. Some of Most of
 GCB Survey TI1. How many of the following people do you think are involved in corruption, or haven t you heard enough about them to say? [Interviewer: Read out options] None Some of Most of Don't know/
Grand Forks A City in Kootenay-Boundary Regional District
 A City in KootenayBoundary Regional District Produced by Stats for Global NonResponse Rate: 45.8 Population Total Immigrants Change in Change in Immigrants Population Number Percent Population Number Percent
Victoria A City in Capital Regional District
 Produced by Stats for Global Non-Response Rate: 24.6 Population Total Immigrants Change in Change in Immigrants Population Number Percent Population Number Percent 1991 71,228 14,665 20.6 1991 to 1996
Interministerial Women s Secretariat
 Women in PEI: A Statistical Review Interministerial Women s Secretariat Table of Contents Executive Summary 1 1 The Female Population of PEI 8 Chapter Summary 8 Population by Age 9 Mother Tongue 11 Languages
Burnaby A City in Greater Vancouver Regional District
 Produced by Stats for Global Non-Response Rate: 23.6 Population Total Change in Change in Population Number Percent Population Number Percent 1991 158,858 49,5 31.2 1991 to 1996,351 24,5 49.1 1996 179,9