Crescent Town & Oakridge NEIGHBOURHOOD PROFILE: TAYLOR MASSEY
|
|
|
- Edward Page
- 6 years ago
- Views:
Transcription

1 & NEIGHBOURHOOD PROFILE: TAYLOR MASSEY February 2017


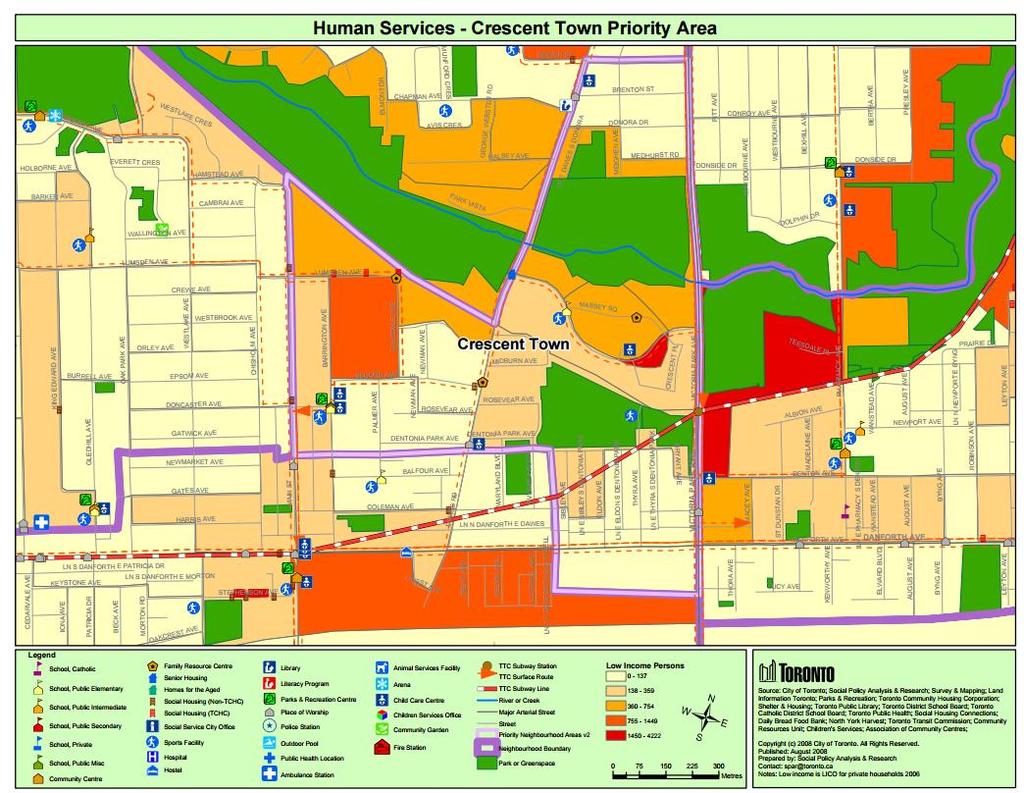
2 Neighbourhood Profile: Taylor Massey Located within the inner suburbs of, the Taylor Massey neighbourhood 1 is rich in its ethnic and cultural diversity. Comprised of and neighborhoods, it is home to many of our immigrants, newcomers, and refugees. holds a high-density population of 15,594, while is home to a population of 13,497. While and are geographically and politically diverse, they share similar demographics, as is demonstrated within this report. The Taylor Massey neighbourhood is recognized by the United Way and the City Council as a priority neighbourhood, a status that is measured by level of access to key community services, median household income, education, and the knowledge of English or French. The identification of priority neighbourhoods aims to ultimately increase opportunities and improve services for people in underserved areas. 2 That said, it would be a mistake to call it a community in crisis. It has a high proportion of retired seniors and newly arrived immigrants making their start. Taylor Massey is a community with many strengths and assets, although is not without its challenges. 1 This is one in a series of Access Alliance Multicultural Health and Community Services (Access Alliance) Neighbourhood Profiles. Access Alliance is committed to creating and disseminating information that will lead to policy and services that enhance the lives of immigrants and refugees, and supports in organizational priority setting, program planning, and partnership development. Access Alliance works to improve health outcomes for the most vulnerable immigrants, refugees, and their communities by providing services and addressing social and system inequities. Access Alliance works across the city of with individuals and communities facing barriers to the social determinants of health. This includes immigrants and refugees, individuals and groups facing barriers in accessing services, and communities impacted by the racialization of poverty and precarious employment. Access Alliance provides accessible, community-governed, interprofessional care that includes primary health care services, health promotion, illness prevention and treatment, chronic disease management, and settlement services for individual and community capacity building. Our vision is for s diverse communities to achieve health with dignity. 2 Source: Anonymous. (2008, July 19). What are priority neighbourhoods? Star. (Neighbourhood #61, City of ) Location: Victoria Park Avenue to the east, Dentonia Park Avenue and Danforth Avenue to the south, Main Street and Dawes Road to the west, and Brenton Street to the north. (Census Tract: ) The neighbourhood is a planned, self-contained community with a mix of condominium apartment buildings and low- and high-rise rental apartment buildings amid pedestrian walkways that link school, recreation and community spaces. 3 (Neighbourhood #121, City of ) Location: Warden Avenue and Mack Avenue to the east, Canadian National Railway to the south, Victoria Park Avenue to the west, Massey Creek to the north. (Census Tracts: , , ) is a mature neighbourhood with a mix of older housing constructed between 1910 and the 1950s, while new home construction is ongoing. It contains an abundance of vibrant shopping districts, recreational facilities, and parkland. 4 Taylor Massey is located in Ward 35, Scarborough South-West 3 Source: Neighbourhood Guide 4 Source: Neighbourhood Guide 2


3 BACK TO THE ROOTS OF TAYLOR MASSEY The roots of can be traced back to 1887, when Walter Massey, Canada s first industrialist and the son of Hart Massey, purchased a 240-acre property near Dawes Road and Victoria Park. That land, also known as Massey Farm, was named Dentonia after Mrs. Massey s family whose surname was Denton. 5 The City Dairy Company, opened in 1901, produced the first pasteurized milk in Canada, and considered Massey Farm its home, as there was a strong history behind it. In the early 20 th century, s milk supply was unsafe, often containing bacteria linked to typhoid, diphtheria and scarlet fever. 6 Walter Massey s vision was to produce the purest, safest, highest-quality milk that could be delivered at an affordable price to the whole city of, in particular, to the children. The history of neighbourhood dates back to 1913, when the Public School was built, and where Park is now located. 7 Although the school was demolished in 1967 and replaced with a more modern school on Byng Road, a memorial stone still stands in its place at the Danforth road entrance to Park. The development of was highly influenced by the Danforth Road, one of the oldest roads in. Homeowners were attracted to this area, and Danforth bus services were constructed as early as City Dairy, Dentonia Park in After Walter s death in 1901, Susan Massey donated the forty acres of Dentonia to the opening of the School. Jumping ahead to 1969, the School property was sold to developers who built the present day neighbourhood. Danforth Avenue, The neighbourhood was further enhanced when the Bloor- Danforth subway line was constructed in the 1950s, making transportation more convenient for residents. 5 Source: Neighbourhood Guide. (n.d.)., Retrieved from 6 Source: Hauch, V. (2016). Once upon a city: Dentonia Park born of Massey's dairy dream. Star. 7 Source: Neighbourhood Guide. (n.d.). Retrieved from istory 8 Source: William James. (ca. 1935). City of Archives. Fonds 1244, Item


. 2001 Social Profile #1; City of. (2007). 2006 Social Profile #1; City of. (2012).")
4 POPULATION BY AGE AND GENDER Seniors 10% Working Age 60% Children 19% Youth 11% Seniors 10% Working Age 55% Children 23% Youth 12% Seniors 9% Working Age 55% Children 23% Youth 13% Children Ages % Male 51.3% Female 48.8% Male 51.3% Female 49.2% Male 50.8% Female Youth Ages Working Age Ages Seniors 11% Working Age 58% Children 20% Youth 11% Seniors 10% Working Age 60% Children 19% Youth 11% Seniors 11% Working Age 56% Children 21% Youth 12% Seniors Ages % Male 50.9% Female 49.1% Male 50.9% Female 48.7% Male 51.3% Female Sources: City of. (2003) Social Profile #1; City of. (2007) Social Profile #1; City of. (2012) Social Profile #1 City of. (2003) Social Profile #1; City of. (2007) Social Profile #1; City of. (2012) Social Profile #1 4

 35.00 39 38.")
5 SOCIO-DEMOGRAPHIC SUMMARY Census Variables City of Demographic Composition 9 Total Population 2,503,281 13,743 13,368 16,207 15,211 % Living alone % 65+ living alone % 1 year mobility in population Socioeconomic Status Median household income before $52,833 $30,724 $31,367 $38,976 $39,265 tax Median household income after tax $46,236 - $29,936 - $36,047 % Families-low income before tax % Families-low income after tax % Rented Dwellings % Unemployment rate % Not in labour force (15+) % Less than high school education (>20) % With a university degree Language, Immigration, Ethno-Racial Diversity % No knowledge of English/French % Recent immigrants- within 5 years % Recent immigrants- within 10 years % immigrants % racialized groups Source for this page: Community Health Profiles Partnership, 2012 Families supported by single mothers are among the most vulnerable. Compared to 12.8% of female loneparent families overall in, has a rate of 26.6%, and 29.6%. The Taylor Massey neighbourhood is home to a high population of immigrants, newcomers, and refugees since both and have a high percentage of racialized groups compared to the City of. Racialized Groups as Percentage of Population (2011) 69% 65% 9 Dash(-)-statistics were not available for this census year 10 The percentage of population that has moved places of residence within one year Overall City of 49% 5
6 ETHNOGRAPHIC DIVERSITY N=16,207 Top 5 Languages Spoken at Home (Excluding English and French) N=13,743 N=2,481,510 N=15,211 N=13,368 N=2,503,270 N=15,594 N=13,497 N=2,615,070 Bengali - 4.7% Chinese* - 3.5% Urdu - 2.5% Tamil - 2.3% Serbian - 1.3% Mandarin - 4.6% Tamil - 3.2% Bengali - 2.4% Urdu - 1.8% Arabic - 0.7% Chinese* - 4.6% Italian % Tamil - 1.2% Portuguese - 1.1% Spanish - 0.8% Bengali % Chinese* - 6.9% Urdu - 4.5% Romanian - 2.9% Tamil - 2.5% Bengali % Chinese* - 6.6% Tamil - 2.5% Tagalog - 2.4% Urdu - 2.4% Chinese* % Italian - 7.8% Punjabi - 5.5% Tagalog/ Filipino - 4.6% Portuguese - 4.5% Bengali % Urdu - 3.4% Tamil - 1.5% Romanian - 1.4% Tagalog - 1.3% Bengali % Urdu - 2.7% Persian - 2.1% Cantonese - 2.0% Tagalog - 1.7% Chinese* - 3.3% Cantonese - 3.2% Italian - 2.8% Spanish - 2.7% Tagalog - 2.7% *Not specified N=16,207 Top 5 Racialized 11 Groups N=13,743 N=15,211 N=13,368 N=15,594 N=13,497 South Asian % Black/African/ Caribbean - 7.1% Chinese - 6.7% Filipino 4.0% Other - 2.4% South Asian % Black % Chinese - 8.9% Filipino - 6.8% Arab/West Asian - 3.9% South Asian % Chinese - 9.1% Black - 6.3% Filipino - 3.9% Arab/West-Indian - 1.1% South Asian % Black % Chinese - 8.0% Filipino - 7.5% Arab/West Asian - 3.8% South Asian % Black - 7.9% China - 5.3% Filipino 4.6% Southeast Asian 2.5% South Asian - 32% Black % Filipino - 6.7% Chinese - 5.6% West Asian - 1.9% 11 The Ontario Human Rights Commission recommends the term Racialized Groups rather than Visible Minority (the census term), recognizing that race is a socially constructed way of categorizing and creating differences among people that marginalizes some and makes white the norm. 12 Sources: 2001, 2006, 2011 Social Profile #2-neighbourhoods, immigration, ethnicity, language; 2001, 2006, 2011 Social Profile #2-neighbourhoods, immigration, ethnicity, language. 6
7 IMMIGRATION Top 5 Recent Immigrants N=16,207 N=13,743 N=2,481,510 N=15,211 N=13,368 N=2,503,270 N=15,954 N=13,497 N=2,615,070 Pakistan 845 Bangladesh 760 India 520 China 410 Bangladesh 665 Pakistan 445 Sri Lanka 280 India 265 China 205 China 45,905 India 26,560 Pakistan 17,495 Philippines 16,755 Sri Lanka 15,885 South Asia* 1,825 Middle East 320 Southeast Asia 245 East Asia 175 South Asia* 2,210 East Asia 415 East Europe 395 South East Asia 145 Africa 150 American 32,485 Europe 25,120 Africa 14,245 Philippines 31,485 China 29,105 Bangladesh 1,290 Pakistan 255 Europe 170 India 155 Philippines 130 Bangladesh 1,305 India 250 Pakistan 225 China 170 Philippines 165 American 32,485 Europe 25,120 Africa 14,245 Philippines 31,485 China 29,105 *India, Pakistan, Bangladesh. For the rest, countries were not specified. Recent immigrants in the Taylor Massey Period of Immigration neighbourhood have higher levels of education and come from very skilled categories. Despite City of their high education, they have lower 49% household income, and are more likely to 39% 40% reside in rental housing units. This is due to the 33% 28% lack of Canadian work experience and non- 22% 21% 19% recognition of their foreign credentials. 14% 11% The percentage of the population living with 8% 8% low-income varies 5% slightly 2% across 3% the Taylor Massey neighborhood: sits at 40%, Born in Canada Before and Crescent Non-permanent Town at 35%compared residentsto the city's 19%. 13 Sources: 2001 Social Profile #2-Neighbourhoods, Immigration, Ethnicity, Language; 2001 Social Profile #2-Neighbourhoods, Immigration, Ethnicity, Language; 2001 City of Social Profile #2; National Household Survey 2006; National Household Survey, Source: National Household Survey,
8 INCOME AND EDUCATION $80,000 to $124,999 Percentage of Household Income After-Tax (2011) 15 $125,000+ $50,000 to $79,999 $20,000 to $49,999 Under $20,000 0% 10% 20% 30% 40% 50% City of Level of Education for Ages (2011) 15 No certificate High School Postsecondary certificate,diploma,or degree 12% 16% 11% 20% 22% 21% City of 67% 62% 69% Household Income After-Tax (2011) 15 Crescent Town City of Recent immigrants in are, on average, highly skilled and educated. Despite this, they see lower household incomes, and are more likely to live in a rental housing unit. This is thought to be attributed to their lack of Canadian work experience and non- recognition of their foreign credentials (Source: Access Alliance The Global City: Newcomer health in ). Average Household Income After-Tax Median Household Income After-Tax $45,283 $41,303 $70,945 $37,875 $32,079 $52,149 The percentage of the population living with low-income varies slightly across the Taylor Massey neighborhood: sits at 40%, and at 35% (compared to at 19%). 15 As of 2012, the percentage of the population that receives social assistance in the Taylor Massey neighbourhood is well above the city s average, 10%. These numbers are 16.9% and 22% for and, respectively. Source: Health Profiles. (2014). Urban HEART (matrix data). Retrieved from 8
9 BIRTH INDICATORS Birth Indicators 15 City of Total hospital births, , year average percentage of births/1,000 to women yrs 43.4% Fertility Rate* Total hospital births to women yrs, , Number of Women yrs, ,605 3,510 4,235 Rate of pregnancies/1,000 among women yrs, % 62.2% 56.4% Teen Pregnancy Rate Number of Women yrs, , Total pregnancies to women yrs, , Rate of pregnancies/1,000 among women yrs, % 50.4% 40% Low Birth weight (LBW)- Total Births Total births (with known birth weight), , Number of LBW (birth weight<2500 grams) 6, Percentage of LBW (birth weight<2500 grams) 7.5% 7.7% 10.8% Low Birth weight (LBW)- Singleton Births Singleton registered births(with known birth weight), , Number of LBW (birth weight<2500 grams) 4, Percentage of LBW (birth weight<2500 grams) 5.6% 6.00% 7.1% Births By Mother's Country of Birth (MCOB) Number of Registered births by MCOB, , Number of Births to mothers not born in Canada 18, Percentage of Births to mothers not born in Canada 61.4% 79.1% 79% * Fertility rates and teen pregnancy rates include both live and still births. 15 Community Health Profiles Partnership,

10 HOUSING Housing Affordability, City of Spending 30% or more of household total income on shelter costs 44% 40% 35% Does not meet National Occupancy Standard 14% 27% 44% The vast majority of high-rise buildings are scattered in s innersuburbs - this includes the Taylor Massey neighbourhood. The high-rise buildings in were initially targeted towards young singles and couples without children, with the proximity to Victoria park subway station making the area convenient for transportation. As the population of grew significantly over the years, it came to be known as an immigrant reception area. 16 The removal of rent control in the 1990s allowed the owners of high-rises to significantly increase rent prices. In turn, this change represented the denial of one of the most fundamental human rights - access to affordable housing. 17 Today, a greater proportion income is spent on housing in the area, compared to s average. 18 Yet, these high-rise buildings are more than just housing, and represent a home away from home to those who yearn for a sense of belonging. When residents first immigrate to the area, the tendency is for them to want to live close to those of their own culture. This helps to explain the high spatial concentration of Bangladeshi communities in Private Dwellings By Structure Type Source: Murdie, R., & Ghosh, S. (2010). Does spatial concentration always mean a lack of integration? Exploring ethnic concentration and integration in. Journal of Ethnic and Migration Studies, 36(2). 17 Source: Ghosh, S. (2014). Everyday lives in vertical neighbourhoods: Exploring Bangladeshi residential spaces in 's inner suburbs. International Journal of Urban and Regional Research, 38(6), Source: National Household Survey, Source: City of. (2003,2007,2014). Social Profile # 3; City of. (2003,2007,2014). Social Profile # 3 10
11 PREVALENCE OF CHRONIC HEALTH CONDITIONS Percentage of Population with Diabetes Age-standardized, Ages 20+ Ages 65+ Male Female Both Sexes Male Female Both Sexes Taylor Massey Percentage of Population with Asthma Age-Standardized, Ages 20+ Ages 65+ Male Female Both Sexes Male Female Both Sexes Taylor Massey Percentage of Population with High Blood Pressure Age-Standardized, Ages 20+ Ages 65+ Male Female Both Sexes Male Female Both Sexes Taylor Massey Trends in health and wellbeing suggest that those residents of priority neighborhoods in East York experience the highest prevalence of all chronic conditions, including diabetes, asthma, high blood pressure, and mental health visits. The prevalence of chronic conditions is higher among females than males. The prevalence of chronic conditions, especially high blood pressure, drastically increases for seniors ages Source: Community Health Profiles Partnership,
12 PREMATURE MORTALITY 21 Top 5 Leading Causes of Premature Mortality Premature Mortality Rate by Gender City of City of Premature Mortality Rate, Age <75 (Total Count) ,038 Ischaemic heart disease, 12.4 Ischaemic heart disease, 17.8 Ischaemic heart disease, 13.0 Total population, Age <75 (2006) Males 6,380 7,115 1,135,615 Top 5 leading causes of premature mortality (%) Cancer of lung & bronchus, 9.0 Diabetes, 6.2 Cerebrovascula r diseases, 5.1 Chronic lower respiratory diseases 5.1 Cancer of lung & bronchus, 7.2 Cerebrovascular diseases, 5.3 Cancer of lymph, blood & related, 4.3 Intentional selfharm, 4.3 Cancer of lung & bronchus, 9.2 Cancer of colon, rectum or anus, 4.5 Diabetes, 3.9 Cerebrovascular diseases, 3.8 Number of premature deaths, Age <75 ( ) Total population, Age <75 (2006) Number of Premature deaths, Age <75 ( ) ,384 Females 6,460 7,285 1,191, , Source: Community Health Profiles Partnership,
13 FOOD ASSETS AND OPPORTUNITIES Number of Food Services Available in the Neighbourhood (Legend: Ward City of - Average 23 ) Good Food and Mobile Food Markets 3 34 <1 Healthy Food Retail 26 1, Community Food Agencies 0 23 <1 Community Kitchens Emergency Food Assistance Programs School and Community Gardens Farmer s Markets 0 38 <1 Food Co-ops* 0 5 <1 Food Festivals The Taylor Massey Neighbourhood, comprised of and, is located in Ward 35, Scarborough South-West. *Food Co-op: A non-profit food-distribution outlet organized cooperatively, often selling organic or locally grown food. How to Read: The blue font symbolizes the number of services available in the area, the middle number is in, and third is the average. 23 Food Policy Council Food by Ward: Ward 35. Disclaimer: This Neighbourhood Profile is the property of Access Alliance Multicultural Health and Community Services. It can be cited as: Access Alliance. (2017). Neighbourhood Profile: Taylor Massey.. For any questions or concerns, please contact: Akm Alamgir, Manager, Quality and Accountability Systems, Access Alliance aalamgir@accessalliance.ca
14 14
(Note: These are inititial neighbourhood estimates and are subject to change.) C N R. NEI Score. Female 54%
 C N R. NEI Score. Female 54%") 0-4 5-9 10-14 15-19 20-24 25-29 30-34 35-39 40-44 45-49 50-54 55-59 60-64 65-69 70-74 75-79 80-84 85-89 90-94 95-99 100+ 2011 Neighbourhood Demographic Estimates STANSBURY CRES MIDLAND AVE CITADEL DR WEST
0-4 5-9 10-14 15-19 20-24 25-29 30-34 35-39 40-44 45-49 50-54 55-59 60-64 65-69 70-74 75-79 80-84 85-89 90-94 95-99 100+ 2011 Neighbourhood Demographic Estimates STANSBURY CRES MIDLAND AVE CITADEL DR WEST
(Note: These are inititial neighbourhood estimates and are subject to change.) SCARBOROUGH SHORELINE. NEI Score. 1,500 Female 53%
 SCARBOROUGH SHORELINE. NEI Score. 1,500 Female 53%") 0-4 5-9 10-14 15-19 20-24 25-29 30-34 35-39 40-44 45-49 50-54 55-59 60-64 65-69 70-74 75-79 80-84 85-89 90-94 95-99 100+ 2011 Neighbourhood Demographic Estimates HIGHLAND CREEK WEST HIGHLAND CREEK KINGSTON
0-4 5-9 10-14 15-19 20-24 25-29 30-34 35-39 40-44 45-49 50-54 55-59 60-64 65-69 70-74 75-79 80-84 85-89 90-94 95-99 100+ 2011 Neighbourhood Demographic Estimates HIGHLAND CREEK WEST HIGHLAND CREEK KINGSTON
(Note: These are inititial neighbourhood estimates and are subject to change.) NEI Score. 1,000 Female 52%
 NEI Score. 1,000 Female 52%") 0-4 5-9 10-14 15-19 20-24 25-29 30-34 35-39 40-44 45-49 50-54 55-59 60-64 65-69 70-74 75-79 80-84 85-89 90-94 95-99 100+ 2011 Neighbourhood Demographic Estimates EGLINTON AVE E C P R DON VALLEY PARKWAY
0-4 5-9 10-14 15-19 20-24 25-29 30-34 35-39 40-44 45-49 50-54 55-59 60-64 65-69 70-74 75-79 80-84 85-89 90-94 95-99 100+ 2011 Neighbourhood Demographic Estimates EGLINTON AVE E C P R DON VALLEY PARKWAY
(Note: These are inititial neighbourhood estimates and are subject to change.) 1,000 Female 54%
 1,000 Female 54%") LAWRENCE AVE E 0-4 5-9 10-14 15-19 20-24 25-29 30-34 35-39 40-44 45-49 50-54 55-59 60-64 65-69 70-74 75-79 80-84 85-89 90-94 95-99 100+ 2011 Neighbourhood Demographic Estimates RAILSIDE RD C P R DON RIVER
LAWRENCE AVE E 0-4 5-9 10-14 15-19 20-24 25-29 30-34 35-39 40-44 45-49 50-54 55-59 60-64 65-69 70-74 75-79 80-84 85-89 90-94 95-99 100+ 2011 Neighbourhood Demographic Estimates RAILSIDE RD C P R DON RIVER
people/hectare Ward Toronto
 Bar Chart showing the rate of population growth between the years 2006 and 2016 for the Ward compared to the City of based on the 2006 and data. For more information, please contact Michael Wright at 416-392-7558
Keelesdale-Eglinton West
 BLACK CREEK DR 0-4 5-9 10-14 15-19 20-24 25-29 30-34 KEELE ST 35-39 40-44 45-49 50-54 -59 KANE AVE 60-64 65-69 70-74 75-79 80-84 85-89 90-94 95-99 100+ 2011 Neighbourhood Demographic Estimates EGLINTON
North York City of Toronto Community Council Area Profiles 2016 Census
 Bar Chart showing the rate of population growth between the years 2006 and 2016 for the Ward compared to the City of based on the 2006 and data. For more information, please contact Michael Wright at 416-392-7558
Scarborough City of Toronto Community Council Area Profiles 2016 Census
 Bar Chart showing the rate of population growth between the years 2006 and 2016 for the Ward compared to the City of based on the 2006 and data. For more information, please contact Michael Wright at 416-392-7558
(Note: These are inititial neighbourhood estimates and are subject to change.) C P R. NEI Score. 600 Female 51%
 C P R. NEI Score. 600 Female 51%") 0-4 5-9 10-14 15-19 20-24 25-29 30-34 35-39 40-44 45-49 50-54 55-59 60-64 65-69 70-74 75-79 80-84 85-89 90-94 95-99 100+ 2011 Neighbourhood Demographic Estimates STEELES AVE W FENMAR DR C P R GARYRAY DR
0-4 5-9 10-14 15-19 20-24 25-29 30-34 35-39 40-44 45-49 50-54 55-59 60-64 65-69 70-74 75-79 80-84 85-89 90-94 95-99 100+ 2011 Neighbourhood Demographic Estimates STEELES AVE W FENMAR DR C P R GARYRAY DR
Ward 4 Etobicoke Centre City of Toronto Ward Profiles 2016 Census
 Bar Chart showing the rate of population growth between the years 2006 and 2016 for the Ward compared to the City of based on the 2006 and data. For more information, please contact Michael Wright at 416-392-7558
2011 CENSUS & NATIONAL HOUSEHOLD SURVEY CITY OF BRAMPTON - WARD 4 PROFILE
 2011 CENSUS & NATIONAL HOUSEHOLD SURVEY CITY OF BRAMPTON WARD 4 PROFILE WARD HIGHLIGHTS Population 9.51% of total population 49,850 2011 Population 34 Median Age 50.5% Females 49.5% Males 2011 Population
(Note: These are inititial neighbourhood estimates and are subject to change.) C P R. NEI Score. Female 52%
 C P R. NEI Score. Female 52%") 0-4 5-9 10-14 15-19 20-24 25-29 30-34 JANE ST 35-39 40-44 45-49 50-54 55-59 60-64 65-69 70-74 75-79 80-84 85-89 90-94 95-99 100+ 2011 Neighbourhood Demographic Estimates EGLINTON AVE W JANE ST WESTON RD
0-4 5-9 10-14 15-19 20-24 25-29 30-34 JANE ST 35-39 40-44 45-49 50-54 55-59 60-64 65-69 70-74 75-79 80-84 85-89 90-94 95-99 100+ 2011 Neighbourhood Demographic Estimates EGLINTON AVE W JANE ST WESTON RD
2011 CENSUS & NATIONAL HOUSEHOLD SURVEY CITY OF BRAMPTON - WARD 3 PROFILE
 2011 CENSUS & NATIONAL HOUSEHOLD SURVEY CITY OF BRAMPTON WARD 3 PROFILE WARD HIGHLIGHTS Population 47,500 2011 Population 50.7% Females 2011 Population by Age Group 13% 18% 014 9.07% of total population
Ward 17 Davenport City of Toronto Ward Profiles 2016 Census
 Bar Chart showing the rate of population growth between the years 2006 and 2016 for the Ward compared to the City of based on the 2006 and data. For more information, please contact Michael Wright at 416-392-7558
2011 CENSUS & NATIONAL HOUSEHOLD SURVEY CITY OF BRAMPTON - WARD 10 PROFILE
 2011 CENSUS & NATIONAL HOUSEHOLD SURVEY CITY OF BRAMPTON WARD 10 PROFILE WARD HIGHLIGHTS Population 10.72% of total population 56,185 2011 Population 33 Median Age 50.1% Females 49.9% Males 2011 Population
2011 CENSUS & NATIONAL HOUSEHOLD SURVEY CITY OF BRAMPTON - WARD 1 PROFILE
 CENSUS & NATIONAL HOUSEHOLD SURVEY CITY OF BRAMPTON WARD 1 PROFILE WARD HIGHLIGHTS Population 53,130 Population 51.0% Females Population by Age Group 9% 20% 014 10.14% of total population 36 Median Age
Ward 14 Parkdale-High Park City of Toronto Ward Profiles 2016 Census
 Bar Chart showing the rate of population growth between the years 2006 and 2016 for the Ward compared to the City of based on the 2006 and data. For more information, please contact Michael Wright at 416-392-7558
Planning Study Area 1 Burnaby Heights
 Neighbourhood Profiles 2006 Census Planning Study Area 1 Heights is bounded by Burrard Inlet to the north, Willingdon Avenue to the east, Hastings Street to the south and Boundary Road to the west. PLANNING
Dufferin Grove: Neighbourhood Profile
 I. Population and Age Population 21 Neighbourhood Population: 12693 12% of Catchment Area Population: Change in population growth (1996-21): # 145 % 1% same as pop change in the catchment area Population
2011 National Household Survey Profile on the Town of Richmond Hill: 1st Release
 2011 National Household Survey Profile on the Town of Richmond Hill: 1st Release Every five years the Government of Canada through Statistics Canada undertakes a nationwide Census. The purpose of the Census
Social and Demographic Trends in Burnaby and Neighbouring Communities 1981 to 2006
 Social and Demographic Trends in and Neighbouring Communities 1981 to 2006 October 2009 Table of Contents October 2009 1 Introduction... 2 2 Population... 3 Population Growth... 3 Age Structure... 4 3
CITY OF MISSISSAUGA. Overview 2-1. A. Demographic and Cultural Characteristics
 Portraits of Peel Overview 2-1 A. Demographic and Cultural Characteristics Population: Size, Age and Growth 2-2 Immigrants 2-3 Visible Minorities 2-4 Language 2-5 Religion 2-6 Mobility Status 2-7 B. Household
Changing Faces Profile of Burlington Newcomers. November 2010
 Changing Faces Profile of Burlington Newcomers November 2010 2010 Community Development Halton, all rights reserved. Copies of this document may be reproduced non-commercially for the purpose of community
IMMIGRANTS AND VISIBLE MINORITIES IN PEEL
 THE SOCIAL PLANNING COUNCIL OF PEEL ISSN #1198-5976 I n f o S h a r e VOLUME 11, NUMBER 1 MAY 2003 IMMIGRANTS AND VISIBLE MINORITIES IN PEEL Information on cultural diversity within a population is important
Study Area Maps. Profile Tables. W Broadway & Cambie St, Vancouver, BC Pitney Bowes 2016 Estimates and Projections. W Broadway & Cambie St
 Powered by PCensus Page 1 Study Area Maps Profile Tables 2016 Demographic Snapshot Population Trends Household Trends Population by Age and Sex Comparison Population by Age and Sex Household Maintainers
CENSUS RESULTS WARD 3 PROFILE
 2011 CENSUS RESULTS WARD 3 PROFILE Town of Halton Hills City of Brampton Hwy. 407 Finch Ave. Town of Milton Hwy. 407 ETR Ninth Line 10 Derry Rd. Winston Churchill Blvd. 9 Erin Mills Pkwy. Mississauga Rd.
BRAMALEA. Overview A. Demographic and Cultural Characteristics
 The Social Planning Council of Peel Portraits of Peel BRAMALEA Overview 13-1 A. Demographic and Cultural Characteristics Population: Size, Age and Growth 13-2 Immigrants 13-3 Visible Minorities 13-4 Language
Verdun borough HIGHLIGHTS. In 1996, the Verdun borough had a population of 59,714. LOCATION
 Socio-economic profile borough February 2002 HIGHLIGHTS In 1996, the borough had a population of 59,714. LOCATION Between 1991 and 1996, the population of the borough declined by 2.6%. One-person households
CENSUS RESULTS WARD 7 PROFILE
 2011 CENSUS RESULTS WARD 7 PROFILE Town of Halton Hills City of Brampton Hwy. 407 Finch Ave. Town of Milton Hwy. 407 ETR Ninth Line 10 Derry Rd. Winston Churchill Blvd. 9 Erin Mills Pkwy. Mississauga Rd.
The Future of North West Sydney
 The Future of North West Sydney AUGUST 2018 2 Contents Demographic & Education Trends in Sydney s North West 5 Methodology 7 Sydney s North West 8 Population growth 8 Age profile 9 Student enrolments 12
North Vancouver, City of A City in Greater Vancouver Regional District
 Global Non-Response Rate: 25.8 Population Total Immigrants Change in Change in Immigrants Population Number Percent Population Number Percent 1991 38,436,8 28.2 1991 to 1996 3,39 2,46 22.7 1996 41,475
CRESCENT TOWN EAST YORK
 CRESCENT TOWN EAST YORK COMMUNITY NEEDS ASSESSMENT REPORT 2014-2015 TORONTO CENTRE FOR COMMUNITY LEARNING AND DEVELOPMENT IMMIGRANT WOMEN INTEGRATION PROGRAM (IWIP) Presented by: NIPA KAR January 16th,
CENSUS RESULTS WARD 10 PROFILE
 2011 CENSUS RESULTS WARD 10 PROFILE Town of Halton Hills City of Brampton Hwy. 407 Finch Ave. Town of Milton Hwy. 407 ETR Ninth Line 10 Derry Rd. Winston Churchill Blvd. 9 Erin Mills Pkwy. Mississauga
CENSUS RESULTS WARD 6 PROFILE
 2011 CENSUS RESULTS WARD 6 PROFILE Town of Halton Hills City of Brampton Hwy. 407 Finch Ave. Town of Milton Hwy. 407 ETR Ninth Line 10 Derry Rd. Winston Churchill Blvd. 9 Erin Mills Pkwy. Mississauga Rd.
Social Profile of Oakville An Overview
 Social Profile of Oakville An Overview Prepared by Community Development Halton Funding support provided by the United Way of Oakville 2004 Community Development Halton, all rights reserved. Copies of
Corporate. Report COUNCIL DATE: April 28, 2008 NO: R071 REGULAR COUNCIL. TO: Mayor & Council DATE: April 28, 2008
 Corporate NO: R071 Report COUNCIL DATE: April 28, 2008 REGULAR COUNCIL TO: Mayor & Council DATE: April 28, 2008 FROM: General Manager, Planning and Development FILE: 6600-01 SUBJECT: 2006 Census Information
CENSUS RESULTS WARD 8 PROFILE
 2011 CENSUS RESULTS WARD 8 PROFILE Town of Halton Hills City of Brampton Hwy. 407 Finch Ave. Town of Milton Hwy. 407 ETR Ninth Line 10 Derry Rd. Winston Churchill Blvd. 9 Erin Mills Pkwy. Mississauga Rd.
Immigrant Seniors in British Columbia
 Immigrant Seniors in British Columbia December 2010 Immigrant Seniors in British Columbia Most people who immigrate as seniors come to B.C. to reunite with their families. In fact, 86.2% of the 5,733 new
Canada at 150 and the road ahead A view from Census 2016
 Canada at 150 and the road ahead A view from Census 2016 Dr. Doug Norris Senior Vice President and Chief Demographer 2017 Environics Analytics User Conference November 8, 2017 Canada continues to lead
Saanich A District Municipality in Capital Regional District
 Produced by Stats for Population Total Immigrants Change in Change in Immigrants Population Number Percent Population Number Percent 1991 95,583 20,285 21.2 1991 to 1996 5,805 755 3.7 1996 101,388 21,040
CENSUS RESULTS WARD 9 PROFILE
 2011 CENSUS RESULTS WARD 9 PROFILE Town of Halton Hills City of Brampton Hwy. 407 Finch Ave. Town of Milton Hwy. 407 ETR Ninth Line 10 Derry Rd. Winston Churchill Blvd. 9 Erin Mills Pkwy. Mississauga Rd.
Chairman and Members of the Planning and Development Committee. Thomas S. Mokrzycki, Commissioner of Planning and Building
 CD.15.DAT DATE: TO: FROM: SUBJECT: Chairman and Members of the Planning and Development Committee Thomas S. Mokrzycki, Commissioner of Planning and Building Mississauga: A City of Many Cultures MEETING
Skeena-Queen Charlotte A Regional District in British Columbia
 Global NonResponse Rate: 34.7 Population Total Immigrants Change in Change in Immigrants Population Number Percent Population Number Percent 1991 24,287 3,125 12.9 1991 to 1996 58 27 8.6 1996 24,795 2,855
Burnaby A City in Greater Vancouver Regional District
 Produced by Stats for Global Non-Response Rate: 23.6 Population Total Change in Change in Population Number Percent Population Number Percent 1991 158,858 49,5 31.2 1991 to 1996,351 24,5 49.1 1996 179,9
Immigrants Economic Integration: Successes and Challenges
 Social Planning Council of Ottawa REPORT SUMMARY Immigrants Economic Integration: Successes and Challenges A Profile of Immigrants in Ottawa Based on the 2006 Census June 2009 Suggested Donation: $20.00
2016 Census: Housing, Immigration and Ethnocultural Diversity, Aboriginal peoples
 October 26, 2017 Backgrounder 2016 Census: Housing, Immigration and Ethnocultural Diversity, Aboriginal peoples The 2016 Census Day was May 10, 2016. On October 25, 2017, Statistics Canada released data
The Planning & Development Department recommends that Council receive this report for information.
 CORPORATE REPORT NO: R237 COUNCIL DATE: November 19, 2018 REGULAR COUNCIL TO: Mayor & Council DATE: November 15, 2018 FROM: General Manager, Planning & Development FILE: 6600-01 SUBJECT: Surrey Community
AVERAGE HOUSEHOLD INCOME $103,177 ($93,586) RENTERS 21% (29%) UNEMPLOYMENT RATE 5% (7%) TAKE TRANSIT TO WORK 6% (15%)
 RENTERS 21% (29%) UNEMPLOYMENT RATE 5% (7%) TAKE TRANSIT TO WORK 6% (15%)") CITY OF COMMUNITY PROFILES 2016 Census Data City of Surrey Statistics WHALLEY CITY CENTRE GUILDFORD FLEETWOOD NEWTON AREA 4,917 ha (32,621 ha) AVERAGE HOUSEHOLD INCOME $103,177 ($93,586) SOUTH POPULATION
CITY OF COMMUNITY PROFILES 2016 Census Data City of Surrey Statistics WHALLEY CITY CENTRE GUILDFORD FLEETWOOD NEWTON AREA 4,917 ha (32,621 ha) AVERAGE HOUSEHOLD INCOME $103,177 ($93,586) SOUTH POPULATION
Socio-Economic Profile
 LOCAL HEALTH AREA 7 - Socio-Economic Profile Powell River Comox Cumberland Denman Island Hornby Island Qualicum CENSUS POPULATION LAND AREA POPULATION DENSITY Number % of Region Sq. Km. % of Region Persons
2016 Census Bulletin: Immigration & Ethnic Diversity
 2016 Census Bulletin: Immigration & Ethnic Diversity Kingston, Ontario Census Metropolitan Area (CMA) The 2016 Census Day was May 10, 2016. On October 25, 2017, Statistics Canada released its sixth data
AVERAGE HOUSEHOLD INCOME $83,026 ($93,586) RENTERS 37% (29%) UNEMPLOYMENT RATE 7% (7%) TAKE TRANSIT TO WORK 20% (15%)
 RENTERS 37% (29%) UNEMPLOYMENT RATE 7% (7%) TAKE TRANSIT TO WORK 20% (15%)") CITY OF COMMUNITY PROFILES 2016 Census Data City of Surrey Statistics CITY CENTRE GUILDFORD FLEETWOOD NEWTON CLOVERDALE AREA 3,131 ha (32,621 ha) AVERAGE HOUSEHOLD INCOME $83,026 ($93,586) SOUTH POPULATION
CITY OF COMMUNITY PROFILES 2016 Census Data City of Surrey Statistics CITY CENTRE GUILDFORD FLEETWOOD NEWTON CLOVERDALE AREA 3,131 ha (32,621 ha) AVERAGE HOUSEHOLD INCOME $83,026 ($93,586) SOUTH POPULATION
Nanaimo A City in Nanaimo Regional District
 A City in Regional District Produced by Stats for Population Total Immigrants Change in Change in Immigrants Population Number Percent Population Number Percent 1991 6,129 8,885 14.8 1991 to 1996,1 2,44
People. Population size and growth. Components of population change
 The social report monitors outcomes for the New Zealand population. This section contains background information on the size and characteristics of the population to provide a context for the indicators
View Royal A Town in Capital Regional District
 Produced by Stats for Global NonResponse Rate: 18.4 Population Total Immigrants Change in Change in Immigrants Population Number Percent Population Number Percent 1991 5,996 9 15.6 1991 to 1996 445 315
Introduction... i. Population Family Structure Education Mobility Status... 7
 Table of Contents Introduction... i Population... 2 Family Structure... 5 Education... 6 Mobility Status... 7 ward two Ethnicity, Language, Immigrants and Visible Minority... 9 Labour Force Characteristics...13
Osoyoos A Town in Okanagan-Similkameen Regional District
 A Town in OkanaganSimilkameen Regional District Produced by Stats for Global NonResponse Rate: 38.5 Population Total Immigrants Change in Change in Immigrants Population Number Percent Population Number
Changing Faces Profile of Oakville Newcomers. January 2010
 Changing Faces Profile of Oakville Newcomers January 2010 2010 Community Development Halton, all rights reserved. Copies of this document may be reproduced non commercially for the purpose of community
Spryfield Highlights. Household Living Arrangements. The following are highlights from the 2016 Census.
 Highlights The following are highlights from the 2016 Census., as defined for United Way's Action for Neighbourhood Change, had a Census population of 11,700 in 2016. The outline shown to the right, and
Castlegar A City in Central Kootenay Regional District
 Produced by Stats for Population Total Immigrants Change in Change in Immigrants Population Number Percent Population Number Percent 1991 6,579 885 13.5 1991 to 1996 448 45 5.1 1996 7,27 93 13.2 1996 to
AVERAGE HOUSEHOLD INCOME $97,637 ($93,586) RENTERS 22% (29%) UNEMPLOYMENT RATE 7% (7%) TAKE TRANSIT TO WORK 15% (15%)
 RENTERS 22% (29%) UNEMPLOYMENT RATE 7% (7%) TAKE TRANSIT TO WORK 15% (15%)") CITY OF COMMUNITY PROFILES 2016 Census Data City of Surrey Statistics WHALLEY CITY CENTRE GUILDFORD NEWTON CLOVERDALE AREA 1,809 ha (32,621 ha) AVERAGE HOUSEHOLD INCOME $97,637 ($93,586) SOUTH POPULATION
CITY OF COMMUNITY PROFILES 2016 Census Data City of Surrey Statistics WHALLEY CITY CENTRE GUILDFORD NEWTON CLOVERDALE AREA 1,809 ha (32,621 ha) AVERAGE HOUSEHOLD INCOME $97,637 ($93,586) SOUTH POPULATION
Strathcona A Regional District in British Columbia
 Produced by Stats for Population Total Immigrants Change in Change in Immigrants Population Number Percent Population Number Percent 1991 - - - 1991 to 1996 - - - 1996 - - - 1996 to 1 - - - 1 - - - 1 to
Victoria A City in Capital Regional District
 Produced by Stats for Global Non-Response Rate: 24.6 Population Total Immigrants Change in Change in Immigrants Population Number Percent Population Number Percent 1991 71,228 14,665 20.6 1991 to 1996
CENSUS RESULTS NATIONAL HOUSEHOLD SURVEY
 2011 CENSUS RESULTS NATIONAL HOUSEHOLD SURVEY INTRODUCTION The inaugural National Household Survey (NHS) was a voluntary survey which replaced the mandatory long-form census questionnaire. The NHS was
Powell River A City in Powell River Regional District
 A City in Regional District Produced by Stats for Population Total Immigrants Change in Change in Immigrants Population Number Percent Population Number Percent 1991 12,991 1,965 15.1 1991 to 1996 14 4
Quesnel A City in Cariboo Regional District
 Produced by Stats for Global NonResponse Rate:.4 Population Total Immigrants Change in Change in Immigrants Population Number Percent Population Number Percent 1991 8,8 1,35 16.4 1991 to 1996 26 5.4 1996
Immigration and Ethno-Cultural Diversity
 2016 London Census: Fact Sheet 7 Immigration and Ethno-Cultural Diversity On October 25, 2017 Statistics Canada released the 2016 Census data on Immigration and Ethno-Cultural Diversity. This summary highlights
Demographic Change: The Changing Character of Toronto s Inner City, 1961 to 2001
 Demographic Change: The Changing Character of Toronto s Inner City, 1961 to 2001 SERIES 2 Maps based on the Canadian Census, using Census Tract level data The CURA Study Area: Bathurst St, Bloor St., Roncesvales
Immigrant DELTA, B.C Delta Immigrant Demographics I
 Immigrant demographics DELTA, B.C. - 2018 Immigrant Demographics I Page 1 DELTA IMMIGRANT DEMOGRAPHICS Your quick and easy look at facts and figures around immigration. Newcomers are an important and growing
North Okanagan A Regional District in British Columbia
 Population Total Immigrants Change in Change in Immigrants Population Number Percent Population Number Percent 1991 61,744 7,855 12.7 1991 to 1996 9,863 685 8.7 1996 71,67 8,54 11.9 1996 to 1 1,6-28 -
A Social Profile of the Halton Visible Minority Population
 Halton Social Planning Council and Volunteer Centre A Social Profile of the Halton Visible Minority Population December 2000 Prepared by Ted Hildebrandt Senior Planner Lyn Apgar - Research Associate December
Introduction... i. Population Family Structure Education Mobility Status... 7
 ward ten Table of Contents Introduction... i Population... 2 Family Structure... 5 Education... 6 Mobility Status... 7 ward ten Ethnicity, Language, Immigrants and Visible Minority... 9 Labour Force Characteristics...13
DEMOGRAPHICS IN CANADIAN SOCIETY. Unit 2
 DEMOGRAPHICS IN CANADIAN SOCIETY Unit 2 WHAT I M LEARNING TODAY Explore how Canada s diversity impacts how society functions Understand how money and power influence who is in control of society Explore
$58,761 ($93,586) 57% (29%) 8% (7%) 36% (15%)
 57% (29%) 8% (7%) 36% (15%)") CITY OF COMMUNITY PROFILES 2016 Census Data City of Surrey Statistics CITY WHALLEY GUILDFORD FLEETWOOD NEWTON CLOVERDALE AREA 548 ha (32,621 ha) AVERAGE HOUSEHOLD INCOME $58,761 ($93,586) SOUTH POPULATION
CITY OF COMMUNITY PROFILES 2016 Census Data City of Surrey Statistics CITY WHALLEY GUILDFORD FLEETWOOD NEWTON CLOVERDALE AREA 548 ha (32,621 ha) AVERAGE HOUSEHOLD INCOME $58,761 ($93,586) SOUTH POPULATION
Salmon Arm A City in Columbia-Shuswap Regional District
 Produced by Stats for Global NonResponse Rate: 22.8 Population Total Change in Change in Population Number Percent Population Number Percent 1991 12,115 1,365 11.3 1991 to 1996 2,549 25 18.3 1996 14,664
East Kootenay A Regional District in British Columbia
 Produced by Stats for Global Non-Response Rate: 35.5 Population Total Immigrants Change in Change in Immigrants Population Number Percent Population Number Percent 1991 52,368 5,9 11.3 1991 to 1996 3,998-55
Grand Forks A City in Kootenay-Boundary Regional District
 A City in KootenayBoundary Regional District Produced by Stats for Global NonResponse Rate: 45.8 Population Total Immigrants Change in Change in Immigrants Population Number Percent Population Number Percent
new westminster, B.C New Westminster Immigrant Demographics I
 Immigrant demographics new westminster, B.C. - 2018 Immigrant Demographics I Page 1 new westminster IMMIGRANT DEMOGRAPHICS Your quick and easy look at facts and figures around immigration. Newcomers are
Port McNeill A Town in Mount Waddington Regional District
 Produced by Stats for Global NonResponse Rate: 35.1 Population Total Immigrants Change in Change in Immigrants Population Number Percent Population Number Percent 1991 2,641 225 8.5 1991 to 1996 284 5
HIGHLIGHTS. 62% with postsecondary 58% $1,081 average monthly rent. $1,026 average monthly rent. China #1 immigrant. China #1 immigrant place of birth
 HIGHLIGHTS Ward Toronto 2010 Household Income 62% with postsecondary certificate, diploma or degree 58% with postsecondary certificate, diploma or degree 30% 25% 20% 15% 10% 5% $1,081 average monthly rent
Immigrant. coquitlam, B.C Coquitlam Immigrant Demographics I
 Immigrant demographics coquitlam, B.C. - 2018 Immigrant Demographics I Page 1 coquitlam IMMIGRANT DEMOGRAPHICS Your quick and easy look at facts and figures around immigration. Newcomers are an important
Creston A Town in Central Kootenay Regional District
 Produced by Stats for Global NonResponse Rate: 32.4 Population Total Immigrants Change in Change in Immigrants Population Number Percent Population Number Percent 1991 4,27 655 15.6 1991 to 1996 69 175
$ $1,026. HIGHLIGHTS Ward Toronto. 52% with postsecondary 58% $978 average monthly rent. China #1 immigrant place of birth
 HIGHLIGHTS Ward Toronto 2010 Household Income 52% with postsecondary certificate, diploma or degree 58% with postsecondary certificate, diploma or degree 35% 30% 25% 20% 15% 10% 5% $978 average monthly
CENSUS BULLETIN #5 Immigration and ethnocultural diversity Housing Aboriginal peoples
 CENSUS BULLETIN #5 Immigration and ethnocultural diversity Housing Aboriginal peoples October 25, 217 Bulletin Highlights: 86.1 per cent of the Brampton s 216 surveyed population held a Canadian citizenship
Lake Country A District Municipality in Central Okanagan Regional District
 Produced by Stats for Population Total Immigrants Change in Change in Immigrants Population Number Percent Population Number Percent 1991 1991 to 1996 1996 9,7 1,275 14.2 1996 to 1 26 7 5.5 1 9,267 1,345
Highlands A District Municipality in Capital Regional District
 Produced by Stats for Global NonResponse Rate: 33 Population Total Immigrants Change in Change in Immigrants Population Number Percent Population Number Percent 1991 1,94 1991 to 1996 329 1996 1,423 21
Northern Rockies Regional Municipality A Regional Municipality in Northern Rockies Regional District
 Produced by Stats for Global NonResponse Rate: 39.2 Population Total Immigrants Change in Change in Immigrants Population Number Percent Population Number Percent 1991 1991 to 1996 1996 1996 to 21 21 21
Parksville A City in Nanaimo Regional District
 Produced by Stats for Global NonResponse Rate: 2.3 Population Total Immigrants Change in Change in Immigrants Population Number Percent Population Number Percent 1991 7,381 1,27 17.2 1991 to 1996 2,91
Immigrant PORT COQUITLAM, B.C Port Coquitlam Immigrant Demographics I
 Immigrant demographics PORT COQUITLAM, B.C. - 2018 Immigrant Demographics I Page 1 PORT COQUITLAM IMMIGRANT DEMOGRAPHICS Your quick and easy look at facts and figures around immigration. Newcomers are
Introduction... i. Population Family Structure Education Mobility Status... 7
 Table of Contents Introduction... i Population... 2 Family Structure... 5 Education... 6 Mobility Status... 7 Ethnicity, Language, Immigrants and Visible Minority... 9 ward three Labour Force Characteristics...13
Enderby A City in North Okanagan Regional District
 Produced by Stats for Global NonResponse Rate: 44.3 Population Total Immigrants Change in Change in Immigrants Population Number Percent Population Number Percent 1991 2,128 23.8 1991 to 1996 626 3 13.
HIGHLIGHTS Ward Toronto. 67% with postsecondary 58% $1,040 average monthly rent. $ $1,026 average monthly rent. China #1 immigrant place of birth
 HIGHLIGHTS Ward Toronto 2010 Household Income 67% with postsecondary certificate, diploma or degree 58% with postsecondary certificate, diploma or degree 30% 25% 20% 15% 10% 5% $1,040 average monthly rent
Simcoe County Census 2016 Update. Prepared by Research Analyst
 Simcoe County Census 2016 Update Prepared by Research Analyst Census 2016 Update 1. Census 2016 2. Population Growth 3. Children 0-6 years 4. Census Families 5. Median Household Income 6. Prevalence of
Final Report Toronto East Local Immigration Partnership WoodGreen Community Services. September 2010
 Final Report Toronto East Local Immigration Partnership WoodGreen Community Services September 2010 Prepared by: Diane Dyson, Manager of Planning and Research Mezba Hassan, Project Administrator Mohammed
The Global City: Newcomer Health in Toronto
 STAFF REPORT ACTION REQUIRED The Global City: Newcomer Health in Toronto Date: November 15, 2011 To: From: Wards: Board of Health Medical Officer of Health All Reference Number: SUMMARY Toronto Public
Community Social Profile Cambridge and North Dumfries
 Community Trends for 2013 in Cambridge, North Dumfries, Wellesley, Wilmot and Woolwich Community Social Profile - Cambridge and North Dumfries Published December 2014 Community Social Profile Cambridge
Nelson A City in Central Kootenay Regional District
 Produced by Stats for Global NonResponse Rate: 28.3 Population Total Immigrants Change in Change in Immigrants Population Number Percent Population Number Percent 1991 8,849 1,175 13.3 1991 to 1996 736
TOWNSHIP OF LANGLEY, B.C Township of Langley Immigrant Demographics I
 Immigrant demographics TOWNSHIP OF LANGLEY, B.C. - 2018 Township of Langley Immigrant Demographics I Page 1 TOWNSHIP OF LANGLEY IMMIGRANT DEMOGRAPHICS Your quick and easy look at facts and figures around
Ethno-Racial Inequality in Montreal
 Presentation at the Quebec Inter- Centre for Social Statistics Michael Ornstein Institute for Social Research York 1 February 2008 Quantitative and Qualitative Rich description of ethno-racial groups on
Immigration and all-cause mortality in Canada: An illustration using linked census and administrative data
 Immigration and all-cause mortality in Canada: An illustration using linked census and administrative data Seminar presentation, Quebec Interuniversity Centre for Social Statistics (QICSS), November 26,
COMMUNITY PROFILE COQUITLAM. Coquitlam Immigrant Demographics I Page 1
 COMMUNITY PROFILE COQUITLAM Coquitlam Demographics I Page 1 COQUITLAM IMMIGRANT DEMOGRAPHICS Your quick and easy look at facts and figures around immigration. Newcomers are an important and growing part