REGENT PARK NEIGHBOURHOOD NEEDS ASSESSMENT REPORT - COMMUNITY WELL BEING
|
|
|
- Bertina Hensley
- 5 years ago
- Views:
Transcription
 SUI")
1 REGENT PARK NEIGHBOURHOOD NEEDS ASSESSMENT REPORT - COMMUNITY WELL BEING CENTER FOR COMMUNITY LEADERSHIP & DEVELOPMENT IMMIGRANT WOMEN INTEGRATION PROGRAM SHERRY (SHUANGMEI) SUI 1
2 Acknowledgment: I would like to thank all the technical staff who helped with encouragement, guidance and support to make this report possible. Special thanks to Alfred Jean-Baptiste, Executive Director of the Centre for Community Learning and Development (CCL&D) who supported me from the start to the end of the project and who enabled us to develop an understanding of creating, designing and conducting the survey process. Also, I would like to thank to Debra Dineen who works with Regent Park Neighbourhood initiative. While I was handing out surveys in the community, she helped put the survey link on the organization website (Regent Park Neighbourhood Initiative), she also supported me through the process of survey distributing. I would like to thank Sarah Schumacher and Ka Cheong, a UofT student, who gave me his valuable time and support through the report writing process. I would also like to thank CRC`s Housing Manager Phil Nazar and Meal Program Coordinator Rayman, who supported me during survey distribution. Lastly, I would also like to thank my friends Wangying, Linda and the Community Settlement Worker (Women Immigrants and Newcomers in Regent Park) and Hongmei Cai who supported me in survey distribution. 2
3 Content Regent Park Regent Park community profile.9 Regent Park Community Wellbeing Survey analysis What we can do in Regent Park...27 Recommendation 28 Conclusion 29 Theory of Change 30 3


4 Regent Park Regent Park is a neighbourhood located in downtown Toronto in the province of Ontario. It is bounded by Gerrard Street East to the north, River Street to the east, Shuter Street to the south, and Parliament Street to the west.( see Figure 1 & 2 below) ( Figure 1 ) Location of Regent Park within Downtown Toronto (Figure 2) Regent Park s boundary map 4


5 (Figure3) before Regent Park neighbourhood is the centre of Cabbagetown neighbourhood composed mainly of high-rise buildings and townhouses. North Regent Park was built from 1947 to 1957 as a low-rise and townhouse development that occupies the area north of Dundas Street to Gerrard Street. It was designed along British Garden City, ideals to encourage low rise development, limit car use, and provide modern living arrangement. Regent Park is Canada's first public housing project, it was built in Regent Park was expanded in the 1950's to include the area south of Gerrard Street, which came to be known as Regent Park South. The South Regent Park is constructed from 1957 to 1959 in South of Dundas Street which is Regent Park rose from the rubble of what was once the south part of the Cabbagetown neighbourhood. During the 1930's, South Cabbagetown was one of Toronto's worst slums and as such was targeted by Toronto city planners for a grand urban renewal proposal called Regent Park. Figure 4 Regent Park still is Toronto s largest and oldest public housing development. It is home to more than thousand people and is managed by The Metro Toronto Housing Authority. Regent Park's residential dwellings are entirely social housing, and cover all of the 69 acres (280,000 m²) which comprise the community which houses approximately 7,500 residents in 2,083 rent-geared-to-incomes (RGI) units. 5


6 Figure 5 classified as low-income. Regent Park residents come from a wide variety of cultural backgrounds including many new Canadians from Africa, Asia, and Latin America. There are more than sixty different first languages spoken here making Regent Park one of Toronto's most culturally diverse neighbourhoods. The average income for Regent Park residents is around half the average for other Torontonians. A majority of families in Regent Park are Regent Park was originally designed as a transitional community. People were experiencing financial difficulties on housing, for Figure 6 whatever reason. Most residents were on social assistance, and working residents paid rent proportional from their income. In the last two decades Regent Park has also become an immigrant settlement community, as immigrants facing difficulties settling in Canada end up living there. Therefore, the community is always viewed and administrated as a transitional community. This contributed to the concentration of a socially marginalized population, and various social problems of Regent Park. In particular, a transitional community need to generate the awareness, interest, and commitment of its residents to invest in the development and sustainability of a higher quality of life. 6

7 Finally,the city council and the Toronto Community Housing Corporation Figure 7 (TCHC) have decided to fix some past mistakes and tackle these issues, rooted in poverty and social isolation by redeveloping and revitalization. After some community consultation, the Regent Park Revitalization Plan was launched in A promising new section in the history of Regent Park has begun with a revitalization project that is projected to cost $1 billion and take 15 years to complete and will comprise of six phases. Phase one is finished, phase two has launched in April 2009, currently in its second phase of construction (to be completed in 2015). The purpose of this thread is to look at the evolution of the neighbourhood up to its present plans for redevelopment. The new Regent Park will consist of a mix of market condos, affordable housing units and vibrant new retail and community space. (See Figure 7, 8, 9) 7


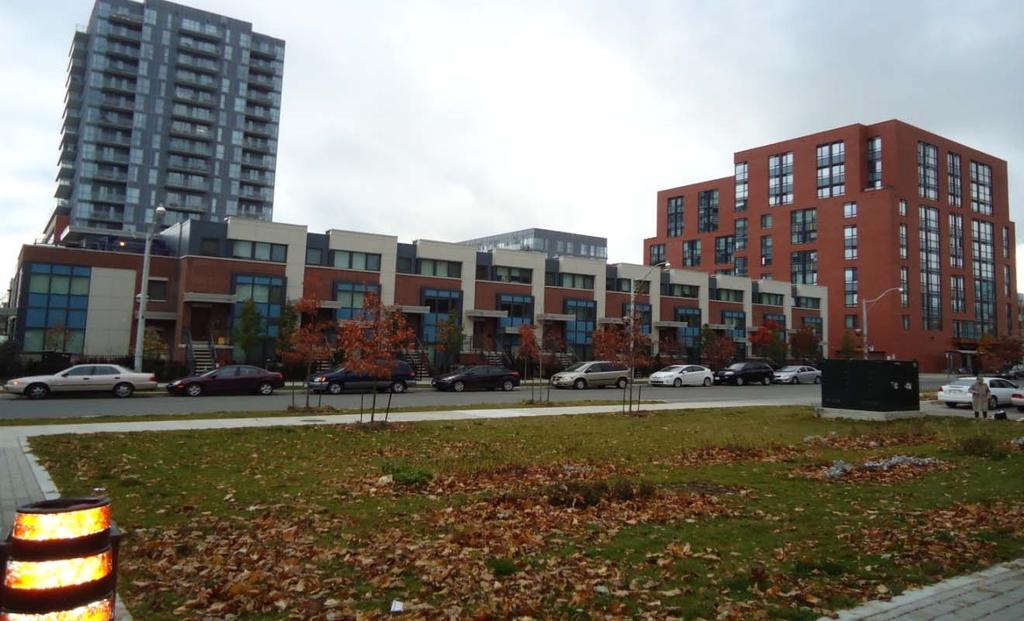
8 Figure 8 Figure 9 8
9 Regent Park community profile Community Services: The Regent Park Community Centre: at 203 Sackville Green, has a gymnasium, a games room, an arts and crafts room, and a weight room. The Regent Park Recreation Centre, at 415 Gerrard Street East, includes a small gymnasium, a meeting room, and an outdoor pool. Parents For Better Beginnings: Early Years Social Work, Prenatal And Postnatal Programs, Family Home Visiting Program, School Readiness and Family Resource Program, Parent and Child Groups, Preschool Speech And Language, Child Development Clinic. Website: There is a unique Children s Book Bank in Toronto downtown. The Children's Book Bank focuses on the literacy needs of children aged 2-12 and works to support and develop each child's interest in and success with reading. In addition to providing books, The Children's Book Bank offers literacy support and programming Christian Resource Centre is place where people do not just get a hand out; they get engaged and form community. Social inclusion happens because people help themselves while helping others whether it is through the provision of food, clothing or shelter and advocacy, each person who is helped, helps another. Libraries: Regent Park is served by two close public libraries. The Toronto Public Library Parliament branch is located at Gerrard and Parliament junction, and houses a special local history archive about Regent Park. The other nearby branch is the Riverdale branch, and it is located at Gerrard and Broadview junction. The Regent Park Neighbourhood Initiative (RPNI) is a social planning body in Regent Park Formerly known as the Regent Park Resident Council, RPNI was formed in 2002 to advocate and protect the interests and assets of residents and to work in partnership through its committees and other means to identify, assess, address and evaluate issues brought forward 9
10 by the community. It is a voice of the residents that provides a vision for the changing community. In 2004 the RPRC changed its focus to be better equipped for the changing community. Now called the Regent Park Neighbourhood Initiative (RPNI), our goal is to work with the whole community to ensure Regent Park is a healthy and vibrant community where everyone belongs, is heard and celebrated. Website at: There are two outdoor artificial ice rinks in Regent Park. The Regent North rink is located north of Dundas Street East, and west of River Street. The Regent South rink is located at Shuter and Sumach Streets. These two single surface rinks have allotted times for pleasure skating, permit hockey, shinny hockey, learn to skate and hockey school programs. Community Health: Regent Park community health centre: Health Services, Chronic Conditions, social work& Community Health Work, Homeless/Outreach/Harm Reduction, Immigrant/Refugee Programs, Infant/Child Development, Youth Programs, Community Development. Regent Park Aquatic Centre: is the newest development in the Toronto/East York District. This stand-alone aquatic facility is located in the heart of Regent Park and features a Lap Pool, Leisure Pool, Warm Water Pool, Tarzan Rope, Diving Board and Water Slide. Our universal change rooms allow for full accessibility for all patrons. Our programs accommodate participants from preschoolers to older adults. This centre is easily accessible by transit, bike, and foot. Community Education: The Pathways program is delivered through local community organizations, all high school aged youth living within the program`s catchment area are eligible to participate. With average sign-up rates over 85%, Pathways is a collective movement of the community for education. In addition, Norman Rowen, Program Manager of The Pathways to Education Program, and researcher Kevin Gosine has published research that documents the success of Pathways in improving academic achievement and reducing the high school dropout rate among Regent Park youth 10
11 Regent Park Community Wellbeing Survey analysis ( ) Demographic Information What age group are you in? Age Range 34.76% 27.29% Regent Park All Neighbourhoods 14.22% 19.16% 18.22% 19.49% 20.17% 4.06% 9.32% 7.20% 10.59% 8.42% 6.68% 0.42% 17 or under or older The age range in Regent Park age group is 9.32%, age group is 34.76%,46-55 age group is 19.49%, age group is 18.22%,56-64 age group is 7.20%, all those age group percentage add together is 85.99%. That means these residents are in the working age range, this shows that the population in Regent Park have the ability to work. There is 19.5% has fulltime jobs, 25.4% has part-time jobs. As well as RP age range group, age range in all neighbourhood residents have ability in work age is 87.52%, in this work age 24.8% has full-time jobs, 23.4% has part-time jobs. Also Compare RP age range employed group with all neighbourhood age range employed group. Percentage of RP fulltime residents is lower than all neighbourhoods 11

12 Highest Level of Schooling What is your highest level of schooling? 18.% 16.% 14.% 12.% 10.% 8.% 6.% 4.% 2.% 0.% 16.53% 16.95% 15.24% 16.26% 15.53% 15.25% 15.68% 13.56% 12.92% 12.43% 15.09% 10.17% 9.32% 9.43% 3.19% 2.54% Regent Park All Neighbourhoods It shows us in RP some university is highest percentage 16.95%, Trade or Technical Certificate is lowest percentage 2.54% and all neighbourhood high school diploma or GED is highest percentage16.26%, also Trade or Technical Certificate is lowest percentage in all neighbourhood, so Trade or Technical certificate level of education is very weak part of both RP and All Neighbourhood. Another similarity percentage part we may need aware that both RP and All Neighbourhood is University Undergraduate Degree. This low University Undergraduate Degree percentage means there is a small number of post-secondary qualified students. Also this will impact Regent Park job market, affecting residents income levels--more than half Regent Park residents have low income. 12


13 Self-Identity Other Middle Eastern Mixed Arab African White Central American Hispanic Black Latin American South American South Asian Southeast Asian West Asian East Asian Caribbean thern European Northern European Eastern European Western European Canadian born Aboriginal 0% 2.18% 1.69% 2.61% 0.42% 2.03% 0.42% 2.61% 0.42% 7.98% 6.36% 4.06% 3.81% 0.29% 0% 0.29% 0% 3.77% 0.42% 1.31% 0% 1.02% 0.42% 6.36% 7.69% 2.18% 0.85% 4.06% 0% 0.73% 0% 0.29% 0% 1.69% 2.61% 1.74% 0.42% 3.05% 3.81% 10% Self identity 26.56% 19.16% 24.58% 16.26% 16.53% 20% 30% 39.41% All Neighbourhoods Regent Park 40% This chart show that RP South Asian residents in highest percentage 39.41%.compare All neighbourhood South Asian residents forms the highest percentage 26.56%. Obviously Regent Park is where most South Asian residents lived. This shows that Regent Park is mainly only one race, which is South Asians. 13

14 English Fluency How well do you speak English, if it is not your first language? English Fluency Basic 26.61% Intermediate 23.73% Advanced 15.25% Regent Park Fluent 39.41% 0.00% 10.00% 20.00% 30.00% 40.00% This chart shows RP residents English speak levels, intermediate and Basic English speaker is 45.34% that mean this group of residents doesn t have the skills to earn high income. The Fluent and advanced English speaker (54.66%) may have priority and more skills to earn a high income. So why more than half Regent Park residents are in low income? English speaking level is one reason. 14
 less than $5,000 (21.18%)+$5,001to$10,000(18.22%)+ 10,001 to $20,000(20.34%) +$20,001to $25,000(16.10%)=75.")
15 Income, Living Household Income What is your annual household income? (RP) Level of Income 25.00% 21.18% 20.34% 20.00% 18.22% 16.10% 15.00% 10.00% 5.00% 9.75% 6.78% 3.39% 3.39% 0.85% Regent Park 0.00% This chart represents people who have income (wage) less than $5,000 (21.18%)+$5,001to$10,000(18.22%)+ 10,001 to $20,000(20.34%) +$20,001to $25,000(16.10%)=75.84% are the majority of Regent Park residents which are considered as low-income family. In this income group, that has53.0%% residents own a housing. This shows that low-income family have difficulties paying mortgage to finance housing. So it will affect the family s quality of life. In those income level: $25,001 to $35,000(9.75%) +$35,001 to $45,000(6.78%) +$45,001 to$55,000(3.39%) +$55,001 - $65,000(3.39%) + $65,001 + (0.85%)=24.16%, 15
 RP residents are renting. Only 7.20% of residents own their housing. In residents renting group70.76%, higher income only has take up 24.")
16 Your Housing What is your housing situation? (RP) Housing Situation 80% 70% 70.76% 60% 50% 40% 30% 20% 10% 0% 7.20% Own 2.97% 2.97% Living with friends 15.25% Shelter Rent Living with family 0.85% No housing Regent Park This chart shows that most (70.76%) RP residents are renting. Only 7.20% of residents own their housing. In residents renting group70.76%, higher income only has take up 24.0%. For this group of residents, government can have an issue or a permit to encourage this group of residents to have their own housing. Why? It can help this group of residents keep economy security 16

17 Day-to-day Involvement What do you do most days? Day to day Involvement Other 11.61% 11.86% Looking for work 13.35% 13.56% In a training program 5.81% 4.24% Unpaid work at home 16.98% 26.69% Local business owner 2.32% 1.27% Volunteering 10.16% 13.14% Employed 38.46% 34.32% In school 27.54% 32.37% 0.00% 10.00% 20.00% 30.00% 40.00% 50.00% All Neighbourhoods Regent Park Compare Regent Park and all neighbourhood day-to-day involvement the biggest different is Unpaid work at home, obviously Regent Park resident with unpaid work at home is higher than all neighbourhoods almost 10%. Schooling required for job School required for job Less than high school 16.53% 4.66% 17.80% High school Some college 38.55% 1.69% 12.29% 2.97% 5.51% Post Graduate Degree University Degree Trade Certificate Not Employed Don't Know This level of education is required to perform their jobs chart shows high school (17.80%) is the most educated Regent Park Residents required to 17


18 perform in their jobs. And 38.55% Regent Park residents not employed. This is a problem in Regent Park, the government and community should create more job opportunities, training and development programs to increase the resident s ability to obtain a job and reduce the unemployment rate. Only 5.51% have University Degree and 2.97% have Post Graduate Degree required to perform in their job. That s why many RP residents do not earn income in high range. Number of jobs Number of job 53.39% 4.24% 2.12% 25.42% 19.49% Full time Part time More than one job Temporary work Not Applicable This chart shows those RP residents 19.49% have Full-time job.25.42% residents have Part-time job. The part-time residents more 5.93% than fulltime residents in Regent Park. 18
19 Looking for work If you are not working, is it for any of the following reasons? (Pick all that apply) The Reason not Working Not Applicable New to the country Not yet started looking Believe no jobs available Don't want/need employment Retired frome paid work Looking after family/home Temporarily sick or injured Long term sick or disabled Student I am in training/employment program 2.97% 3.39% 5.51% 1.69% 7.20% 14.83% 0.42% 3.81% 14.41% 5.08% 49.15% Regent Park 0% 20% 40% 60% This chart show that most residents are not working because they are looking after family/home. Some of those residents are immigration from other countries. If they are immigration, and no family member or relatives to support (looking after family/home) them, they can t look for work. So who can help them with this situation? They may ask your friends and neighbours to help, but if you don t have any friend and neighbours to help, it will have a difficult time to look for help. So we need to build strong relationship with friends and neighbours, and the community needs to help each other too. 19
 Satisfaction With Standar of Living Very Satisfied Satisfied Somewhat Satisfied Dissatisfied 37% 17% 34% 12% The chart demonstrate more than 50% RP residents are not satisfied with standard of")

20 Satisfaction with standard of living Overall, how would you rate your level of satisfaction with your standard of living?(rp) Satisfaction With Standar of Living Very Satisfied Satisfied Somewhat Satisfied Dissatisfied 37% 17% 34% 12% The chart demonstrate more than 50% RP residents are not satisfied with standard of living, those residents probably have a reasonable reason to say so, whatever what kind of reasons they give, this is an issue that will let people think about it. Dissatisfaction is due to low income, unemployment, lack of skills and knowledge, insecure with the neighborhood s safety, inadequate services for assistance, and lack of confidence in our government. So what the government and community should do is to provide more training and development programs, employment services, more regulation or police in the neighborhood to improve the neighborhood s safety, and the government should develop and create new policies that are beneficial to Regent Park which will then improve resident s satisfaction. How happy am I I don t feel particularly pleased with the way I am Pleased with way I am 40% 30% 26.38% 23.40% 35.75% 20% 10% 5.53% 8.94% Regent Park 0% Disagree Strongly Disagree Whatever Agree Agree Strongly This chart shows that RP resident only 45% pleased with way I am, 55% can`t pleased with way I am. 20


21 Sense of Belonging Length of Residency How long have you lived in your neighbourhood? Length of Residency Percetag of living 35.00% 30.00% 25.00% 20.00% 15.00% 10.00% 5.00% 0.00% 25.20% 5.51% Less than a year 19.07% 1to 2 years 33.05% 14.29% 15.97% 2 to 5 years 25.21% 24.15% 5 to 10 years 15.13% 12.29% 11 to20 years 5.93% 4.20% 20+ years Regent Park Regent Park This chart show that residents who live in RP for less than one year is decreasing 19.65% compared to the residents report, why is this result? This report shows that percentage of length of residency is decreasing because of the revitalization. Revitalization has its advantages and disadvantage. The advantage is that it attracts more population into the neighborhood, but the disadvantage is that it may displace the population into other neighborhoods. This community revitalization planer and government should think about the issues that revitalization will cause. 21

22 Groups and organizations In the past 12 months, how often did you participate in the activities of any group or organization in your community? Rate You Participation in community 30.93% 19.92% At least once a week 15.68% 14.83% 18.64% At least once a month At least three times Once or twice Not at all This survey result shows how often you have participated in the activities of your community. The data shows that most residents have participated, but 30.93% of the residents did not participate at all. This shows that not a lot of the residents are involved within the community. This will create lack of cohesion, lack of community sense of belonging. As a result, residents will lack support and assistance for each other, due to resident s low connection within the community. 22


23 Level of Satisfaction with Community Thinking about your neighbourhood, how satisfied are you with this area as a place to live? Satisfaction with Community Level of Satisfaction with Community Very dissatisfied 4.66% Slightly dissatisfied 17.80% Neither satisfied nor 21.19% Fairly Satisfied 35.16% Very Satisfied 21.19% 0% 10% 20% 30% 40% Percentage of satisfacton Regent Park This chart shows that more than half of RP residents are satisfied with the community. This shows that Regent Park is providing the services and assistance for the residents. However, the community will require more assistance from the government in order for the residents to achieve full satisfaction. Sense of belonging How would describe your sense of belonging in your community? Sense of Belonging 17.80% 13.56% 25.85% Strong Somewhat Strong 42.79% Weak Don't feel like I belong Survey result shows Regent Park residents have a strong sense of belonging in their community 25.85%.That mean the rest not verily feel be-longing their community. This is a big problem we are facing in RP neighbourhood; because it is multi-ethnic mix community and multicultural community, and so there are language barriers etc. 23

24 Speaking to neighbours How often do you speak to neighbours (face-to-face?) Rate Speaking to Neighbours 50% 49.16% 40% 30% 20% 10% 22.03% 14.83% 8.05% 5.93% Regent Park 0% On most days Once or twice a week Once or twice a month Less often than once a month Never This chart shows only 5.93% of RP residents never speak to neighbours (face-toface), this result needs improvement. Lack of communication with neighbors will create lack of cohesion and lack of community sense of belonging. However, most residents in RP are speaking to neighbours on most days. This is good as it creates a good relationship with other neighbors, and so this should be maintained. 24


25 Change in Services In the past few years, how has provision of the following changed in your neighbourhood? Change in Services TTC:This chart shows 25% of residents said provision of TTC in RP has gotten worse in the past few years, most reason by residents saying that because take TTC s price is getting more expensive. This shows that public transit in the community needs to be improved. Affordable Housing: This chart shows 37.29% residents saying provision of Affordable Housing has stayed the same in the past few years. The data shows that 28.39% of residents said it has gotten worse. Government needs to put more effort on affordable housing provision. This result shows us Regent Park resident s real regard on Affordable Housing. Low income and unemployment are the reasons RP residents need rely on Affordable Housing. Employment Service: This chart demonstrates 36.43% residents don t know about the Employment Services in RP, which means Employment Services worker, need do more advertisement. This shows that employment services are required to publicize and make their service available for residents in Regent Park. Service and programs for immigrants: This chart demonstrates 39.41% residents don t know about the service and programs for Immigrants in RP. A reason for this is because residents in Regent Park are not involved or not participating in community activities and so residents will not be aware of the 25 Services for people with disabilities Programs and services for immigrants Improved Programs and services for families Stayed the Same Got Worse Don`t Know Programs for seniors Services for women Services for children and youth Employment services Community spirit Availability of organic food Daycare Policing Affordable housing TTC 19.92% 10.59% 19.92% 18.64% 20.76% 13.56% 26.27% 27.12% 17.37% 29.66% 29.66% 30.08% 30.93% 15.68% 6.36% 18.64% 5.51% 21.19% 21.19% 30.93% 37.29% 27.97% 24.58% 25.85% 23.73% 28.39% 26.69% 7.63% 45.34% 3.81% 3.81% 3.39% 6.78% 22.46% 4.24% 5.93% 11.86% 28.39% 58.04% 65.26% 41.95% 41.95% 41.10% 52.54% 39.41% 40.25% 25.00% 36.43% 36.45% 36.45% 20.76% 12.29% 0% 20% 40% 60% 80% 100%

26 services. This also means that services and programs for Immigrant workers need to do more advertisement. This charts shows that most residents have no idea about how these services change, and the services are stayed the same are the second high number of the participators answers. These results indicate that the social service sectors should improve their service programs to reach and involve more residents and more engagement programs should be provided in future. This graph shows that residents are suffering from teenagers hanging around and misbehaving with 57% said very big problem. This result shows us Teenagers need Parents conduct, encourage, and educate in right methods. And also parents need communicate or connect with school teacher, been known your kids build strong relationship with them, talk to them often, give them right direction. This will affect their whole life. 26
27 Service for Youth 41.10% Service For Youth 29.66% Improved Stayed the same Got worse 3.39% 25.85% We need to develop more learning programs for youth to encourage and engage them to build up team work skills, leadership, and knowledge. Volunteer opportunities should be created to enhance the sense of learning, so that youths can gain more opportunities and knowledge for a bright future. However, we need to create action plans to engage the youth to participate in those programs. What we can do in Regent Park? Through completing the survey experience I understand that Regent Park represents as low-income neighbourhood, it has a high unemployment in neighbourhood, higher refugees and immigrants neighbourhood, a low educated rate in the neighbourhood, Regent Park also has community housing and a subsidising housing neighbourhood. It is a multicultural and diverse neighbourhood. Residents in Regent Park struggle with those entire external factors which influence the community wellbeing. 27
28 Recommendations 1. sense of belonging: as I talked about the key finding the most RP residents not satisfy to feel sense of belonging of RP neighbourhood, now I would like to suggest certain organizations how to enhance sense of belonging of RP neighbourhood. First I would like to suggest our organization to create a community kitchen program(cooking Culture Club), to Motivate and inspire RP residents to join together, also give them example how this program works (every week we will have different kitchen program from each country, like first week Canada food, we will have invited one person who familiar with Canadian food or cooker in Canadian restaurants and give a lesson how to prepare one easy dish of traditional Canadian food.) mentor and coach them, give them right vision, work as a team and get feedback. We can enrich our diet; feel the sense of belonging of our community. 2. According to the key finding, need to increase service for youth by Create action plans to engage youth and their parents to join learning programs, enhance the sense of learning& foster youth study interests, school & parents make connections, increase parents and youth relationship and mentor youth & educate in right methods to target future goals. Example creates a Reading Corner, engage youth and their parents to join together, each youth and their parents will read a book depend on their knowledge and understanding share their ideas, after youth present by telling a story about the books, have to make sure to connected with the school teacher to know what their children learn and behaviour in school. Integrate with this program, and help youth to find out the future goals. 28
29 Conclusion This survey illustrated that Regent Park is a known low-income neighbourhood with more than half of its population being immigrants. Regent Park residents are mostly are living in poverty condition in which the main issues are unemployment, level of education, and language barrier based on the survey findings. In addition, almost half of the population living in this neighbourhood are children who need recreation programs, and social activities. The poverty in Regent Park directly influenced family members especially young people such as teenagers, and youth. The government should provide more job opportunity for Regent Park residents. They should help and guide residents gain social independence by providing financial support to start their own business in the area. In addition, there needs to be a development of recreational programs to build capacity and partnership for youth. Also can encourage and engage youth people to build self-confidence, leadership, skill training, and job development. Also public communication is needed in Regent Park. Community centres should provide programs and activities that would benefit residents, increase community engagement and public communication. Lastly, who, how and what the community centre can do I would recommend the theory of change for youth and decreasing poverty in Regent Park neighbourhood. 29
30 Theory of Change for Increasing employment in Regent Park Strategic and Activities Focus: Teach some Canadian cultural related their occupation. Occupation related language training New comer training in their expectation workplace. An assessment and enhancement of their related technical skills for their background job. Formation to using present program curriculum delivered in an instructor lead. Need a family supporter centre for immigrate or refugees family( like if immigration or refugees residents find a job, nobody take care children and they don t have extra money pay the child care) More variety training program for suitable resident s employment require. Establish job opportunities for all employment levels. Do outreach as much as possible. (example creating all racial new year celebration) 30 Contextual Analysis: causing for unemployment Lack high level of education. English barrier of Immigrate residents. Lack literacy. No family supporter for immigration family. Some residents not have specialty skills(no background) The most new immigrate first priority place to live is downtown area( Regent Park) Lack training programs and services for residents need. Less job opportunities. Need have more the community engagement and the public communication Shorter outcome: New comers will have work experience placement, occupational skills to abtain employment, become self sufficient. Newcomers develop the technical cultural and language related skills to help them get better jobs. Long term outcome: The most Regent Park residents has been employed Decreasing poverty Decreasing RP residents apply Affordable Housing. Improve quality of life All racial people have gotten to know each other, known their cultures and getting involved in our community.
31 Theory of Change for Youth Strategic and Activities Focus: Plan workshop for parents Forepart youthhood instruction class Parents properly restricted their kids or engage themselves to less touch on computer School gives proper homework depend on youth`s study ability Give monthly object Youth need to be encouraged and given opportunities that engage them into programs and enjoyed programs( better to have a program youth and their parents participate together, like story telling) Parents need to make connection with youth s school teacher. Contextual Analysis: Regent Park youth problems causing. Short term Outcomes: Parents might not conduct, encourage and educate in right methods. Fall in love at an early age (puppy love). Too often or early contact with computer. No study pressure. No clear study target. Not enough facilities and Recreation programs. Increase self management, know yourself better, understanding more study essentiality. Increase parents and youth relationship. Increase self esteem. Find problem in time. Long term Outcomes: Foster youth study interest. Become Self knowledgement. Youth share their knowledge with their community. Youth get well relationship with their parents and get along with others. 31


32 Theory of Change for Sense of belonging Sense of belonging 32
Regent Park Neighbourhood Needs Assessment Report
 2014-2015 Regent Park Neighbourhood Needs Assessment Report Toronto Centre for Community Learning & Development - Immigrant Women Integration Program Irum Siddiqui 1 2014-2015 Acknowledgements This Community
Community Resources & Needs Assessment Report of Regent Park. By Fahmida Hossain
 Community Resources & Needs Assessment Report of Regent Park By Fahmida Hossain The Centre for Community Learning & Development March, 2012 0 Executive Summary The purpose of this report is to provide
Moss Park Neighborhood Needs Assessment Report- Community Well Being ( ) Toronto Centre for Community Learning & Development.
 Toronto Centre for Community Learning & Development.") Moss Park Neighborhood Needs Assessment Report- Community Well Being (2012-2013) Toronto Centre for Community Learning & Development Fatma Bafagih Friday February 15 th, 2013 Acknowledgements I would like
Moss Park Neighborhood Needs Assessment Report- Community Well Being (2012-2013) Toronto Centre for Community Learning & Development Fatma Bafagih Friday February 15 th, 2013 Acknowledgements I would like
Regina City Priority Population Study Study #2 - Immigrants. August 2011 EXECUTIVE SUMMARY
 Regina City Priority Population Study Study #2 - Immigrants August 2011 EXECUTIVE SUMMARY Executive Summary The City of Regina has commissioned four background studies to help inform the development of
London & Middlesex Local Immigration Partnership: Community Capacity and Perceptions of the LMLIP
 Community Capacity and Perceptions of the LMLIP 1 London & Middlesex Local Immigration Partnership: Community Capacity and Perceptions of the LMLIP Prepared by: Amanda DeVaul-Fetters, Kelly Barnes, and
Survey Community Index of Wellbeing Report: Regent Park
 2010-2011 Survey Community Index of Wellbeing Report: Regent Park BY: Uttara Chowdhury Introduction:- Survey Community index of wellbeing 2010 is done by a group of newcomer women from community across
An Equity Profile of the Southeast Florida Region. Summary. Foreword
 An Equity Profile of the Southeast Florida Region PolicyLink and PERE An Equity Profile of the Southeast Florida Region Summary Communities of color are driving Southeast Florida s population growth, and
NEIGHBORHOOD GATHERING PLACE A Multicultural Center REPORT & RECOMMENDATIONS
 NEIGHBORHOOD GATHERING PLACE A Multicultural Center REPORT & RECOMMENDATIONS INTRODUCTION Many recent immigrants and refugees are making Hartford their new home. The city s Asylum Hill Neighborhood, located
The Province of Prince Edward Island Food Insecurity Poverty Reduction Action Plan Backgrounder
 The Province of Prince Edward Island Food Insecurity Poverty Reduction Action Plan Backgrounder 5/17/2018 www.princeedwardisland.ca/poverty-reduction Food Insecurity SUMMARY Access to sufficient quantities
Demographic Change: The Changing Character of Toronto s Inner City, 1961 to 2001
 Demographic Change: The Changing Character of Toronto s Inner City, 1961 to 2001 SERIES 2 Maps based on the Canadian Census, using Census Tract level data The CURA Study Area: Bathurst St, Bloor St., Roncesvales
BLACK-WHITE BENCHMARKS FOR THE CITY OF PITTSBURGH
 BLACK-WHITE BENCHMARKS FOR THE CITY OF PITTSBURGH INTRODUCTION Ralph Bangs, Christine Anthou, Shannon Hughes, Chris Shorter University Center for Social and Urban Research University of Pittsburgh March
Increasing the Participation of Refugee Seniors in the Civic Life of Their Communities: A Guide for Community-Based Organizations
 Increasing the Participation of Refugee Seniors in the Civic Life of Their Communities: A Guide for Community-Based Organizations Created by Mosaica: The Center for Nonprofit Development & Pluralism in
Immigrant Women s Health Project Research Findings Workshop Tues, June 4, 2013 (12pm-5pm)
") Immigrant Women s Health Project Research Findings Workshop Tues, June 4, 2013 (12pm-5pm) SUGGESTIONS FOR IMPROVEMENT Break out discussion group summaries NVRC = North Vancouver Recreation Commission NSMS
Immigrant Women s Health Project Research Findings Workshop Tues, June 4, 2013 (12pm-5pm) SUGGESTIONS FOR IMPROVEMENT Break out discussion group summaries NVRC = North Vancouver Recreation Commission NSMS
Appendix A: Economic Development and Culture Trends in Toronto Data Analysis
 Appendix A: Economic Development and Culture Trends in Toronto Data Analysis Introduction The proposed lenses presented in the EDC Divisional Strategy Conversation Guide are based in part on a data review.
Our Story: Putting Community Perspectives Into Action. engaging knowledgeable strengthening 1/26/2015. Compiled by Huda Hussein
 LMLIP LMLIP LMLIP LMLIP communitydeveloper issue-oriented strategic committed planner visionary accountable connector welcoming inclusive issue catalyst supporting facilitating London engage & Middlesex
Chairman and Members of the Planning and Development Committee. Thomas S. Mokrzycki, Commissioner of Planning and Building
 CD.15.DAT DATE: TO: FROM: SUBJECT: Chairman and Members of the Planning and Development Committee Thomas S. Mokrzycki, Commissioner of Planning and Building Mississauga: A City of Many Cultures MEETING
Black and Minority Ethnic Group communities in Hull: Health and Lifestyle Summary
 Black and Minority Ethnic Group communities in Hull: Health and Lifestyle Summary Public Health Sciences Hull Public Health April 2013 Front cover photographs of Hull are taken from the Hull City Council
LOUISVILLE METRO POLICE DEPARTMENT
 LOUISVILLE METRO POLICE DEPARTMENT CITIZENS ATTITUDE SURVEY Deborah G. Keeling, Ph.D. Kristin M. Swartz, Ph.D. Department of Justice Administration University of Louisville April 2014 INTRODUCTION It is
Corporate. Report COUNCIL DATE: April 28, 2008 NO: R071 REGULAR COUNCIL. TO: Mayor & Council DATE: April 28, 2008
 Corporate NO: R071 Report COUNCIL DATE: April 28, 2008 REGULAR COUNCIL TO: Mayor & Council DATE: April 28, 2008 FROM: General Manager, Planning and Development FILE: 6600-01 SUBJECT: 2006 Census Information
Social and Demographic Trends in Burnaby and Neighbouring Communities 1981 to 2006
 Social and Demographic Trends in and Neighbouring Communities 1981 to 2006 October 2009 Table of Contents October 2009 1 Introduction... 2 2 Population... 3 Population Growth... 3 Age Structure... 4 3
Release of 2006 Census results Labour Force, Education, Place of Work and Mode of Transportation
 Backgrounder Release of 2006 Census results Labour Force, Education, Place of Work and Mode of Transportation On March 4, 2008 Statistics Canada released further results from the 2006 census focusing on
The Changing Face of Canada s Public Education System. Discussion Paper for the Pan-Canadian Consultation Process. By Laura Eggertson.
 The Changing Face of Canada s Public Education System Discussion Paper for the Pan-Canadian Consultation Process By Laura Eggertson Fall 2006 Produced by The Learning Partnership with funding from TD Bank
Spryfield Highlights. Household Living Arrangements. The following are highlights from the 2016 Census.
 Highlights The following are highlights from the 2016 Census., as defined for United Way's Action for Neighbourhood Change, had a Census population of 11,700 in 2016. The outline shown to the right, and
3.13. Settlement and Integration Services for Newcomers. Chapter 3 Section. 1.0 Summary. Ministry of Citizenship and Immigration
 Chapter 3 Section 3.13 Ministry of Citizenship and Immigration Settlement and Integration Services for Newcomers Chapter 3 VFM Section 3.13 1.0 Summary In the last five years, more than 510,000 immigrants
UTS:IPPG Project Team. Project Director: Associate Professor Roberta Ryan, Director IPPG. Project Manager: Catherine Hastings, Research Officer
 IPPG Project Team Project Director: Associate Professor Roberta Ryan, Director IPPG Project Manager: Catherine Hastings, Research Officer Research Assistance: Theresa Alvarez, Research Assistant Acknowledgements
A Social Profile of the Halton Visible Minority Population
 Halton Social Planning Council and Volunteer Centre A Social Profile of the Halton Visible Minority Population December 2000 Prepared by Ted Hildebrandt Senior Planner Lyn Apgar - Research Associate December
THE UNIVERSITY OF HONG KONG FACULTY OF SOCIAL SCIENCES. Non-Local Internship Summer
 Update: March 7, 0 Non-Local Internship - 0 Summer * Remarks: CSR/ CM: Corporate Social Responsibility/ Corporate Management CSS: Community or Social Services PG: Politics and Governance RPA: Research
Regina City Priority Population Study Study #1 - Aboriginal People. August 2011 EXECUTIVE SUMMARY
 Regina City Priority Population Study Study #1 - Aboriginal People August 2011 EXECUTIVE SUMMARY Executive Summary The City of Regina has commissioned four background studies to help inform the development
Central Alberta Immigrant Women s Association ANNUAL GENERAL MEETING September 16, 2013
 Central Alberta Immigrant Women s Association ANNUAL GENERAL MEETING September 16, 2013 1 Central Alberta Immigrant Women s Association (CAIWA) #110 5017 49 Street, Red Deer, Alberta T4N 1V4 Tel: (403)
NOVEMBER visioning survey results
 NOVEMBER 2016 visioning survey results 2 Denveright SECTION 1 SURVEY INTRODUCTION OVERVIEW Our community is undertaking an effort that builds upon our successes and proud traditions to design the future
The Better the Start the Better the Future
 The Better the Start the Better the Future OUR MISSION Delivering quality, innovative Immigration and Settlement Services in Manitoba. OUR VISION Manitoba's community leader in providing Immigration and
TOWNSHIP OF LANGLEY, B.C Township of Langley Immigrant Demographics I
 Immigrant demographics TOWNSHIP OF LANGLEY, B.C. - 2018 Township of Langley Immigrant Demographics I Page 1 TOWNSHIP OF LANGLEY IMMIGRANT DEMOGRAPHICS Your quick and easy look at facts and figures around
KEY FINDINGS FROM THE 2016 EAST METRO PULSE SURVEY
 EAST METRO PULSE KEY FINDINGS FROM THE 2016 EAST METRO PULSE SURVEY ABOUT THE SAINT PAUL FOUNDATION The Saint Paul Foundation is a community foundation with more than 75 years of history in investing in
Working Group on Resettlement Geneva, February Measuring resettlement outcomes by looking at integration indicators
 Working Group on Resettlement Geneva, 24-25 February 2009 Measuring outcomes by looking at integration indicators Resettlement is protection plus. 1 It involves more than the relocation of refugees to
Employment, Education and Income
 This is one in a series of fact sheets that provide a profile of immigrants in. Understanding the makeup of our community is important for planning programs and services. Between 2006 and 2011, 15,465
The Economic and Social Outcomes of Children of Migrants in New Zealand
 The Economic and Social Outcomes of Children of Migrants in New Zealand Julie Woolf Statistics New Zealand Julie.Woolf@stats.govt.nz, phone (04 931 4781) Abstract This paper uses General Social Survey
BACKGROUNDER The Making of Citizens: A National Survey of Canadians
 BACKGROUNDER The Making of Citizens: A National Survey of Canadians Commissioned by The Pierre Elliott Trudeau Foundation in collaboration with Dalhousie University Purpose Prior to the eighth annual Pierre
R Eagleton Institute of Politics Center for Public Interest Polling
 2002 SURVEY OF NEW BRUNSWICK RESIDENTS Conducted for: Conducted by: R Eagleton Institute of Politics Center for Public Interest Polling Data Collection: May 2002 02-02 EXECUTIVE SUMMARY TABLE OF CONTENTS
Survey of Edmontonians 2016 : Draft Report. June 2014
 Survey of Edmontonians 2016 : Draft Report June 2014 Methodology Leger was contracted by the Edmonton Community Foundation (ECF) to conduct a survey with Edmontonians regarding various aspects of life
Appendix B: Input Survey Results
 Appendix B: Input Survey Results Introduction As part of the public participation process, a Public Input Survey and Student Input Survey were created to gather community and student input. The public
Information for Immigration Levels, Settlement and Integration Consultation
 Information for Immigration Levels, Settlement and Integration Consultation 2017 Information for Immigration Levels, Settlement and Integration Consultation Purpose Last year s national effort to resettle
St. James Town Need Assessment Report. A Partial requirement for the fulfillment of Immigrant Women Leadership Training Program
 St. James Town Need Assessment Report A Partial requirement for the fulfillment of Immigrant Women Leadership Training Program Sheela Bhandari 2011/2012 Acknowledgement This study is one the community
Social Indicators and Trends 2014
 Social Indicators and Trends 2014 Healthy City for All Targets By 2025: all Vancouverites report they have at least four people in their network that they can rely on for support in times of need. By 2025:
Social Profile of Oakville An Overview
 Social Profile of Oakville An Overview Prepared by Community Development Halton Funding support provided by the United Way of Oakville 2004 Community Development Halton, all rights reserved. Copies of
Le Sueur County Demographic & Economic Profile Prepared on 7/12/2018
 Le Sueur County Demographic & Economic Profile Prepared on 7/12/2018 Prepared by: Mark Schultz Regional Labor Market Analyst Southeast and South Central Minnesota Minnesota Department of Employment and
COMMUNITY PROFILE TOWNSHIP OF LANGLEY. Township of Langley Immigrant Demographics I Page 1
 COMMUNITY PROFILE TOWNSHIP OF LANGLEY Township of Langley Demographics I Page 1 TOWNSHIP OF LANGLEY IMMIGRANT DEMOGRAPHICS Your quick and easy look at facts and figures around immigration. Newcomers are
STRENGTHENING RURAL CANADA: Fewer & Older: The Coming Population and Demographic Challenges in Rural Newfoundland & Labrador
 STRENGTHENING RURAL CANADA: Fewer & Older: The Coming Population and Demographic Challenges in Rural Newfoundland & Labrador An Executive Summary 1 This paper has been prepared for the Strengthening Rural
Refocusing Express Entry July Stakeholder Consultations
 Refocusing Express Entry July 26 2016 Stakeholder Consultations Express Entry: purpose and objectives Since launch on January 1, 2015, Express Entry has represented a major shift in the way Canada selects,
COMMUNITY PERCEPTIONS OF MIGRANTS AND IMMIGRATION
 COMMUNITY PERCEPTIONS OF MIGRANTS AND IMMIGRATION 3 1 EXECUTIVE SUMMARY 4 1.1 EXECUTIVE SUMMARY INTRODUCTION This report presents the findings from a Community survey designed to measure New Zealanders
Community Social Profile Cambridge and North Dumfries
 Community Trends for 2013 in Cambridge, North Dumfries, Wellesley, Wilmot and Woolwich Community Social Profile - Cambridge and North Dumfries Published December 2014 Community Social Profile Cambridge
Introduction... i. Population Family Structure Education Mobility Status... 7
 Table of Contents Introduction... i Population... 2 Family Structure... 5 Education... 6 Mobility Status... 7 ward two Ethnicity, Language, Immigrants and Visible Minority... 9 Labour Force Characteristics...13
T H E P I T T S B U R G H Q U A L I T Y O F L I F E
 U C S U R T H E P I T T S B U R G H Q U A L I T Y O F L I F E introduction In order to understand where we are going, we must first understand where we are. In that spirit, we are pleased to release a
Profile of the New Brunswick Labour Force
 Profile of the New Brunswick Labour Force October 213 213 Profile of the New Brunswick Labour Force Province of New Brunswick PO 6, Fredericton NB E3B 5H1 www.gnb.ca 213.11 ISBN 978-1-465-247-1 (Print
Californians. healthy communities. ppic statewide survey FEBRUARY in collaboration with The California Endowment CONTENTS
 ppic statewide survey FEBRUARY 2011 Californians & healthy communities Mark Baldassare Dean Bonner Sonja Petek Nicole Willcoxon CONTENTS About the Survey 2 Press Release 3 Residents Perceptions & Attitudes
Central Alberta Immigrant Women s Association ANNUAL GENERAL MEETING September 26, 2016
 Central Alberta Immigrant Women s Association ANNUAL GENERAL MEETING September 26, 2016 CAIWA S VISION The vision of CAIWA is to make sure that immigrant women and their families are empowered to achieve
Belonging begins at home : Housing, social inclusion and health and wellbeing for people from refugee and asylum seeking backgrounds
 Belonging begins at home : Housing, social inclusion and health and wellbeing for people from refugee and asylum seeking backgrounds This research project examined the experience of refugees and asylum
CENSUS RESULTS NATIONAL HOUSEHOLD SURVEY
 2011 CENSUS RESULTS NATIONAL HOUSEHOLD SURVEY INTRODUCTION The inaugural National Household Survey (NHS) was a voluntary survey which replaced the mandatory long-form census questionnaire. The NHS was
TAKING STOCK for TAKING ACTION. Capacity for Newcomer Settlement and Integration in Saskatoon
 for Capacity for Newcomer Settlement and Integration in Saskatoon INTRODUCTION All newcomers to Saskatoon have something to offer our city, and at times they need help finding ways to use their knowledge
Global Immigration Consultancy Services. Immigration, Study and Work temporarily in Canada
 1 GICS Global Immigration Consultancy Services A quality professional Immigration, Education & Recruitment Service provider to our clients for Canada Immigration, Study and Work temporarily in Canada A
BRITISH COLUMBIA S CHANGING FAMILIES. Family Roots. January 2011
 BRITISH COLUMBIA S CHANGING FAMILIES Family Roots January 2011 TABLE OF CONTENTS BRITISH COLUMIA S CHANGING FAMILIES.................... 4 RISING INCOMES, INCREASING CHALLENGES..... 5 Increasing Incomes;
How To Become an Ally: Skills for Change. Presented by Sherene Nichol and Jade Shortte
 How To Become an Ally: Skills for Change Presented by Sherene Nichol and Jade Shortte About Us: First inception in 1982 Provided office training to a group of Southeast Asian women to achieve full-time
Socio- Spatial Inequality What to Focus Research On and Why?
 Socio- Spatial Inequality What to Focus Research On and Why? Armine Yalnizyan Preamble: Methodology Issues Data limitations now that reliable information from Census long form not available Past and present
REPORT HALTON COMMUNITY CONVERSATION ON POVERTY REDUCTION: MPP CONSULTATION
 REPORT HALTON COMMUNITY CONVERSATION ON POVERTY REDUCTION: MPP CONSULTATION June 27, 2008 Halton Community Conversation on Poverty Reduction June 27, 2008 1 Report on the Halton Community Conversation
The Community Progress Report
 Imagine Inform Invest Inspire Working together to build a stronger community now and forever The Community Progress Report MEASURING THE WELLBEING OF GREATER 641,472 residents live in The Community Foundation
An Equity Assessment of the. St. Louis Region
 An Equity Assessment of the A Snapshot of the Greater St. Louis 15 counties 2.8 million population 19th largest metropolitan region 1.1 million households 1.4 million workforce $132.07 billion economy
Crescent Town & Oakridge NEIGHBOURHOOD PROFILE: TAYLOR MASSEY
 & NEIGHBOURHOOD PROFILE: TAYLOR MASSEY February 2017 Neighbourhood Profile: Taylor Massey Located within the inner suburbs of, the Taylor Massey neighbourhood 1 is rich in its ethnic and cultural diversity.
Post-Secondary Education, Training and Labour September Profile of the New Brunswick Labour Force
 Post-Secondary Education, Training and Labour September 2018 Profile of the New Brunswick Labour Force Contents Population Trends... 2 Key Labour Force Statistics... 5 New Brunswick Overview... 5 Sub-Regional
Middle Eastern Students. Aboriginal Students. South Asian Students. Black Students. Southeast Asian Students. East Asian Students.
 Aboriginal Students Black Students East Asian Students Latin American Students Middle Eastern Students South Asian Students Southeast Asian Students White Students White Southeast Asian South Asian Middle
LONDON S ANTI-POVERTY STRATEGY: LITERATURE REVIEW
 LONDON S ANTI-POVERTY STRATEGY: LITERATURE REVIEW Prepared by: Social Research and Planning for Discussion Purposes April 17, 2008. 1 EXECUTIVE SUMMARY London, like Ontario, is embarking on a formal poverty
AHR SURVEY: NATIONAL RESULTS
 AHR SURVEY: NATIONAL RESULTS Survey conducted by MES December 2017 If you would like a localised benchmarking report so you can see how your own Electoral Services Department compares to this nationwide
City of Richmond Mayor s Anti-Poverty Commission
 City of Richmond Mayor s Anti-Poverty Commission Presentation to Mayor Dwight C. Jones Final Report and Recommendations Richmond, VA January 18, 2013 DEFINING AND MEASURING POVERTY Poverty is usually defined
Artists and Cultural Workers in Canadian Municipalities
 Artists and Cultural Workers in Canadian Municipalities Based on the 2011 National Household Survey Vol. 13 No. 1 Prepared by Kelly Hill Hill Strategies Research Inc., December 2014 ISBN 978-1-926674-36-0;
CRESCENT TOWN EAST YORK
 CRESCENT TOWN EAST YORK COMMUNITY NEEDS ASSESSMENT REPORT 2014-2015 TORONTO CENTRE FOR COMMUNITY LEARNING AND DEVELOPMENT IMMIGRANT WOMEN INTEGRATION PROGRAM (IWIP) Presented by: NIPA KAR January 16th,
Snapshots of the past
 OVERVIEW State of Ohio, City of Dayton and Dayton area counties immigration patterns: not a site of immigrant destination until recently 9 Focus Groups comprised of 1st gen 6 of Latinos Interviews with
Ontario Council of Agencies Serving Immigrants (OCASI) Roundtable Report for Social Assistance Review 2011
 Roundtable Report for Social Assistance Review 2011") Ontario Council of Agencies Serving Immigrants (OCASI) Roundtable Report for Social Assistance Review 2011 Introduction This report by the Ontario Council of Agencies Serving Immigrants (OCASI) is based
Ontario Council of Agencies Serving Immigrants (OCASI) Roundtable Report for Social Assistance Review 2011 Introduction This report by the Ontario Council of Agencies Serving Immigrants (OCASI) is based
Resident Panels. Primary Community Represented Latinx African American Youth of color Hmong
 Resident Panels For the Imagine Madison Comprehensive Plan Update process, the City is trying a new program called Resident Panels to better engage with residents who have historically been underrepresented
Poverty in Buffalo-Niagara
 Cornell University ILR School DigitalCommons@ILR Buffalo Commons Centers, Institutes, Programs 9-2014 Poverty in Buffalo-Niagara Partnership for the Public Good Follow this and additional works at: http://digitalcommons.ilr.cornell.edu/buffalocommons
Provincial Labour Consultation Changing Workplaces Review. Peel Poverty Reduction Strategy Committee Response
 Provincial Labour Consultation Response sherona.hollman@peelregion.ca September 2015 Peel Poverty Reduction Strategy (2012-2015) The (PPRSC) thanks the Ministry of Labour for the opportunity to respond
Introduction... i. Population Family Structure Education Mobility Status... 7
 Table of Contents Introduction... i Population... 2 Family Structure... 5 Education... 6 Mobility Status... 7 Ethnicity, Language, Immigrants and Visible Minority... 9 ward three Labour Force Characteristics...13
Ethnicity. GoWell in the East End: key equalities issues in the baseline survey. Julie Clark & Ade Kearns University of Glasgow
 Ethnicity GoWell in the East End: key equalities issues in the baseline survey Julie Clark & Ade Kearns University of Glasgow February 2016 Preface In 2012, GoWell East conducted a community survey around
Special Eurobarometer 469. Report
 Integration of immigrants in the European Union Survey requested by the European Commission, Directorate-General for Migration and Home Affairs and co-ordinated by the Directorate-General for Communication
AN ANALYSIS OF THE LABOR FORCE OF THE OKMULGEE AREA IN NORTHEAST OKLAHOMA
 LOCAL AREA LABOR FORCE STUDIES AN ANALYSIS OF THE LABOR FORCE OF THE OKMULGEE AREA IN NORTHEAST OKLAHOMA A SUMMARY REPORT PRESENTED TO Okmulgee Area Development Corporation and Oklahoma Department of Commerce
Chapter 8 Ontario: Multiculturalism at Work
 Chapter 8 Ontario: Multiculturalism at Work Ontario is Canada's largest province, home to almost 40 percent of its population (over 13 million people). It has been hit hard by by economic restructuring
If this information is required in an accessible format, please contact ext. 2564
 If this information is required in an accessible format, please contact 1-800-372-1102 ext. 2564 From: Report: Date: Commissioner of Planning and Economic Development #2018-INFO-53 April 13, 2018 Subject:
Rural Pulse 2016 RURAL PULSE RESEARCH. Rural/Urban Findings June 2016
 Rural Pulse 2016 RURAL PULSE RESEARCH Rural/Urban Findings June 2016 Contents Executive Summary Project Goals and Objectives 9 Methodology 10 Demographics 12 Research Findings 17 Appendix Prepared by Russell
Middle Eastern Students. Aboriginal Students. South Asian Students. Black Students. Southeast Asian Students. East Asian Students.
 Aboriginal Students Black Students East Asian Students Latin American Students Middle Eastern Students South Asian Students Southeast Asian Students White Students White Southeast Asian South Asian Middle
STRENGTHENING RURAL CANADA: Summary of Rural Ontario Community Visits
 STRENGTHENING RURAL CANADA: Summary of Rural Ontario Community Visits Prepared for the Strengthening Rural Canada initiative by Essential Skills Ontario and RESDAC INTRODUCTION Strengthening Rural Canada-Renforcer
(Note: These are inititial neighbourhood estimates and are subject to change.) C P R. NEI Score. 600 Female 51%
 C P R. NEI Score. 600 Female 51%") 0-4 5-9 10-14 15-19 20-24 25-29 30-34 35-39 40-44 45-49 50-54 55-59 60-64 65-69 70-74 75-79 80-84 85-89 90-94 95-99 100+ 2011 Neighbourhood Demographic Estimates STEELES AVE W FENMAR DR C P R GARYRAY DR
0-4 5-9 10-14 15-19 20-24 25-29 30-34 35-39 40-44 45-49 50-54 55-59 60-64 65-69 70-74 75-79 80-84 85-89 90-94 95-99 100+ 2011 Neighbourhood Demographic Estimates STEELES AVE W FENMAR DR C P R GARYRAY DR
Headline Results on Ethnicity in Hull from the 2011 Census & Hull BME Survey
 Headline Results on Ethnicity in Hull from the 2011 Census & Hull BME Survey 2011-12 In 2011 the Census 1 found 26,500 of Hull s 244,000 residents (10.3%) were from a Black or Ethnic Minority group (BME
Meeting the needs of Somali residents
 Meeting the needs of Somali residents Final Report April 2012 James Caspell, Sherihan Hassan and Amina Abdi Business Development Team Tower Hamlets Homes For more information contact: James Caspell 020
SUPPORTING OUR DIVERSE AND VIBRANT MULTICULTURAL COMMUNITY
 SUPPORTING OUR DIVERSE AND VIBRANT MULTICULTURAL COMMUNITY A STRONG PLAN FOR REAL CHANGE 1 We re ready. Over the last four years, we ve been working hard developing our vision for the future of South Australia.
KITCHENER: A VIEW TOWARD THE FUTURE ENVIRONICS
 KITCHENER: A VIEW TOWARD THE FUTURE ENVIRONICS Objectives of the Project: Confirm the vision for Kitchener 20+ years into the future. Provide data for a report card on citizen satisfaction with City directions,
FOND DU LAC VISION & STRATEGIC PLAN Community Workshop Tuesday, February 24, 2015
 FOND DU LAC VISION & STRATEGIC PLAN Community Workshop Tuesday, February 24, 2015 On Tuesday, February 24, 2015 at 7 p.m., an Envision Fond du Lac workshop was held with over 90 community members from
ELECTION PROGRAM VELDHOVEN, A PLACE TO BE PROUD OF!
 ELECTION PROGRAM 2018-2022 VELDHOVEN, A PLACE TO BE PROUD OF! PROLOGUE With the elections on March 21 st, comes a new political era. When we look back on the past years, we can deduce that the municipality
Verdun borough HIGHLIGHTS. In 1996, the Verdun borough had a population of 59,714. LOCATION
 Socio-economic profile borough February 2002 HIGHLIGHTS In 1996, the borough had a population of 59,714. LOCATION Between 1991 and 1996, the population of the borough declined by 2.6%. One-person households
Willow dale East Neighborhood
 Willow dale East Neighborhood Community Well-Being Report (2014 2015) By Paridokht Shahcheraghi Toronto Centre for Community Learning & Development 1 Table of content List of Abbreviations 2 Glossary 3
(Note: These are inititial neighbourhood estimates and are subject to change.) 1,000 Female 54%
 1,000 Female 54%") LAWRENCE AVE E 0-4 5-9 10-14 15-19 20-24 25-29 30-34 35-39 40-44 45-49 50-54 55-59 60-64 65-69 70-74 75-79 80-84 85-89 90-94 95-99 100+ 2011 Neighbourhood Demographic Estimates RAILSIDE RD C P R DON RIVER
LAWRENCE AVE E 0-4 5-9 10-14 15-19 20-24 25-29 30-34 35-39 40-44 45-49 50-54 55-59 60-64 65-69 70-74 75-79 80-84 85-89 90-94 95-99 100+ 2011 Neighbourhood Demographic Estimates RAILSIDE RD C P R DON RIVER
Immigrant & Refugee Housing Consultation Report
 Immigrant & Refugee Housing Consultation Report 2016 Housing Consultation Report 2 Table of Contents Introduction... 3 Immigration Partnership... 3 Community Consultation... 3 Key Findings... 4 Housing
Middle Eastern Students. Aboriginal Students. South Asian Students. Black Students. Southeast Asian Students. East Asian Students.
 Aboriginal Students Black Students East Asian Students Latin American Students Middle Eastern Students South Asian Students Southeast Asian Students White Students White Southeast Asian South Asian Middle