Socio-economic profile of the province
|
|
|
- Joella Parsons
- 5 years ago
- Views:
Transcription

1 Socio-economic profile of the province 09 Torino and its province Territory, population and environment Economy and business Employment and education Tourism and quality of life
2 XXXXXXXXXXX Torino and its province 2
3 TORINO AND ITS PROVINCE The province of Torino is the fourth in size in Italy in terms of number of enterprises and the ranks in second place for exports, after Milan. The contribution of the area to national wealth is remarkable: the GDP of the province of Torino in 2008 was comparable to that of countries such as the Slovak Republic and Morocco. This is the result of a well-established industrial tradition in addition to a constantly growing tertiary sector. The crisis that struck the world economy at the end of 2008 has also had repercussions on the Torino economy. The manufacturing production, after a period of considerable reduction, seems to be slowly recovering from this difficult moment. Torino has good potentials for overcoming these difficult times by laying stakes in the most innovative sectors - aerospace, environment and energy, biotechnologies - and by seeking renewed impulse in the traditional automotive and mechanical production sectors. Finally, the province has an excellent undergraduate and postgraduate university education portfolio and increasing tourist potentials. TORINO REPORT CARD* Recorded business 235, , ,067 4 of which women s business 55, , ,267 4 Exports million of euro 18,856 37, ,806 2 Imports million of euro 15,274 28, ,284 3 Unemployment rate 5.6% 5.0% 6.7% 58 of which women 6.6% 6.3% 8.5% 44 men 4.8% 4.0% 5.5% 57 Resident population 2,290,990 4,432,571 60,045,068 4 Investments million of euro 55, ,047 1,607,397 3 Deposits million of euro 35,964 62, ,726 3 GDP (million of euro) 66, ,856 1,572,244 3 * Data related to 2008 Torino Piedmont Italy Torino in the italian standings 3
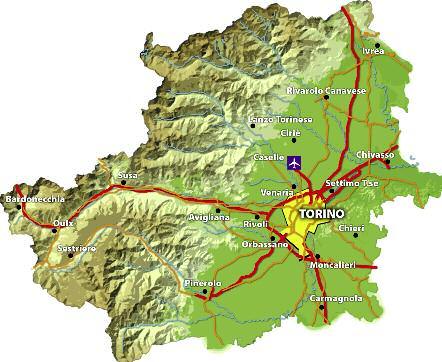
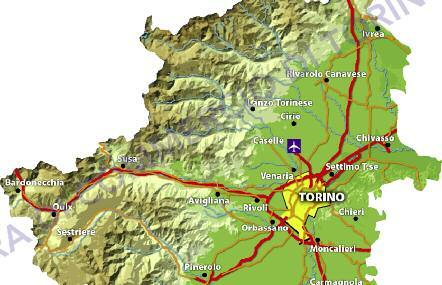
4 Territory, population and environment The province of Torino is the second in size in Piedmont after Cuneo in terms of surface area: nearly half of the 6,829 square kilometres of the province is mountainous and the rest is equally distributed between hills and plains. The province is instead the first in Italy in terms of number of towns: 315, three-quarters of which are located on the hills or in the mountains. The population on 31 December 2008 was 2,290,990, specifically 52% women and 40% resident in the city of Torino. This was a +0.6% increase with respect to the previous year and mainly determined by a foreigners, the growth rate of whom is higher than that of the Italian population: during the year, foreign residents increased by +12.4%, reaching a total of 185 thousand individuals, 8.1% of the total population. The most numerous are rumanians, who alone account for approximately 46% of the foreign population and whose community has grown by +16.7% during the past year. The province has excellent attraction potentials and is competitive also in terms of infrastructures. Despite a minor decline in number of passengers and flights in due to the waning of the effects of the Olympics in 2006, year in which airport traffic reached its peak - Caselle airport has experienced an increase of passengers of over 20% (3.4 million in 2008) and of international flights of 7%, with 268 destinations during the past year. Among the numbers that clearly describe the health of the province of Torino and its environment, some of the most significant are definitely those related to rubbish sorting, which reached 49.1% in 2008, totally 571 thousand tons of waste, with a +5.2% growth with respect to the previous year. Over 60% was organic material and paper. The number of electricity generating plants using renewable sources was also on the rise: during the first semester of 2008, there were 80 plants running in the province of Torino, in view of 66 of the same period of 2007, and 30 were being planned (29 the year before). This is respectively 32% and 34% of those being built or planned in Piedmont. 4


5 TERRITORY, POPULATION AND ENVIRONMENT Chart 1 Distribution of towns in the province of Chart 2 Population residing in the province Torino according to altitude. of Torino by sex and age Province of Torino: 315 towns and 6,829 square kilometres of territory of which: mountain: 3,114.1 square km hill: 1,739.4 square km plain: 1,975.3 square km 26% Plain (<300 m) 82 towns 40% Hill 126 towns 34% Mountain (>900 m) 107 towns Men Women >= 90 13,546 From 80 to 89 74,347 From 70 to ,054 From 60 to ,203 From 50 to ,170 From 40 to ,245 From 30 to ,880 From 20 to ,342 From 10 to 19 92,011 From 0 to 9 97,347 Total population residing on 31/12/2008: 2,290, % compared to 31/12/2007 3,946 39, , ,856 97, , , , , ,054 Source: Istat, Statistic and Administrative Geography Atlas. % by weight and absolute values Fonte: BDDE - Demographic Data Base of the Piemonte Region 31/12/2008 data 5

6 TERRITORY, POPULATION AND ENVIRONMENT Chart 3 Foreign resident population in the province of Table 1 Torino: distribution by gender Airport movement at Torino-Caselle Men Women Romania main Country of provenance of the foreign population resident in the Torino province: 85, % of the total Passengers Goods (t) Mail (t) National International flights flights ,420,833 10,124 1, ,509,253 11,801 1, ,084 86, ,260,974 11,227 1, ,148,807 12,287 1, ,141,888 14,776 1, , ,804,655 17,013 1, , , ,787,091 15,047 1, ,820,762 14,986 2, , ,073 20,000 40,000 60,000 80, , , , , , ,000 Source: BDDE - Demographic Data Base of the Piedmont Region; ISTAT data Source: Sagat 6

 we refer to non fossil energy sources (wind, solar, geothermal, wave motion, sea motion energy, hydraulic energy, biomass, waste dump gas, biogas, residual purification process gas).")
7 TERRITORY, POPULATION AND ENVIRONMENT Chart 4 Nr. of power plants from renewable sources* Chart 5 Rubbish sorting in the province of Torino Torino planned running 31.1% Paper and cardboard Rubbish sorting in the province of Torino Total year 2008: 571,413 t variation 2008/2007: +5.2% 34.1% Organic and green Piedmont North West 525 Italy 963 1,481 WEEE 1.3% 3.2% Large waste 8.1% Wood ,000 Note*: by renewable energy sources (art. 2 Decree 387/03) we refer to non fossil energy sources (wind, solar, geothermal, wave motion, sea motion energy, hydraulic energy, biomass, waste dump gas, biogas, residual purification process gas). 1,200 1,400 1, % Textiles 1.3% Ferrous metals 6.5% Glass/ metal 5.6% 3.5% Glass and aluminium Plastic/ Metal 4.5% Plastic. mono-material Source: GSE (Electricity Service) - 30/06/2008 data Source: Province of Torino data 7
8 Economy and business With a Gross Domestic Product of over 66 billion Euros, the province of Torino generates over 4% of Italy s entire national wealth. This value ideally places the area on the same level as countries such as the Slovak Republic and Morocco. A production base of 235,912 registered enterprises at the end of 2008 contributed to creating this added value: the fabric grown in the service sector has over the past decades while maintaining its traditional industrial calling combined with new production specializations. The result is a network spanning from IT&C to instrumental mechanics, automotive, aerospace, biotechnologies, food and wine, hydrogen and renewable energy sources. Service enterprises (trade, tourism, services for companies and individuals) today amount to approximately 60% of the total enterprises in the province. Trade is first (with over 26% of the total of registered companies), followed by services for enterprises (24%). Constructions and tourism have significantly increased over the past years as a result of the Olympic Games, while the industrial sector has essentially held its former ground. The entrepreneurial vocation of the province is confirmed by the 70% of the value added for 2007 produced by the sector of services and nearly 30% by industry in general. In the specific instance industry in a strict sense produces nearly 25% of the value added of the territory, constructions a few less than 5%. Despite the world-wide recession, the internationalisation process remains a major challenge, a challenge the province in winning as a result of its traditionally strong export propensity. Means of transport are the main export (40% of the total), followed by machines and mechanical apparatuses (21%), machines and electric-electronic devices (10%). France is the main trade partner of the Torino area and sales are developing in new European Union countries, such as Poland, which is today ranks in third place. The province of Torino has always been qualified as an innovative district, and this is witnessed by various indicators, such as the number of filed patent applications: European patent statistics show that the Torino area is a driver in terms of innovative capacity. 8

9 ECONOMY AND BUSINESS Table 2 Registration trends by sector in the province of Torino Chart 6 Number of European patents* published by EPO (European Patent Office). Nr of pro-capita patents per million inhabitants Recorded Registered Terminated % Stock variations Agricolture and fishing 14, Buildings 27,864 1,285 1, Constructions 36,939 3,684 3, Trade 61,904 3,987 5, Hotels and restaurants 11, Services to business 56,033 2,924 3, Education, health and other public, social and personal 11, Total* 235,912 17,993 16, Torino Piedmont Italy European patents in the province of Torino Years : 1, * The total amount includes unclassified companies. Source: InfoCamere, Movimpresa data * Average annual resident population based on ISTAT survey (average at the beginning and end of the period) Source: Unioncamere Patent Observatory and EPO data 9

10 ECONOMY AND BUSINESS Chart 7 Value Added Breakdown in the province of Torino 2007 V.A. in the province of Torino: 58,955 million euro Torino Piedmont Italy Chart 8 Import-export of main products in the province of Torino Totale import = 15,274 mln. euro Totale export = 18,856 mln. euro Trade Balance = +3,582 mln. euro Export Import ,610 2,074 1,645 2,302 1,864 4,044 7,676 5, Agricolture Manufactoring Building Services Industry sector Source: processed by Istituto Guglielmo Tagliacarne based on Istat data Year Wooden products Oil products Leather products Construction material Other manufactured products Textile and clothing Printing and publishing Food and beverages Chemical products Rubber and plastic materials Source: Istat - Provisional data million euro Metal products Electric and electronic machinery Mechanical equipment Means of transport 10


11 ECONOMY AND BUSINESS Chart 9 The top ten destination countries of Torino exports Chart 10 Investments and Deposits in the province of Torino Russia Switzerland Brazil Turkey United States United Kingdom Spain Poland Germany France 2.8% 2.9% 3.2% 4.1% 4.8% 6.8% 7.1% 7.5% 13.7% 14.2% ,275 1,386 1, ,580 2,680 60,000 50,000 40,000 30,000 20,000 10,000 46,942 47,452 25,205 27,330 23,528 48,731 50,083 30,565 33,985 Deposits 1, , ,664 50,836 53,868 32,851 35,964 Investments 141,156 Source: Istat - Provisional data for 2008 expressed in million euro and as % weight on total values Source: Banca d'italia - Data in millions of euro 11
12 Employment and education Since the early 1980s, the province of Torino has been typified by a constant, gradual growth of employment in the service sector: with respect to 2007, employment in the tertiary sector has increased by 30 thousand individuals, now totally 66% of the total (approximately 64% in 2004). The industrial sector is against the current trend and has experienced a contraction from 27.4% 2004 to 25.6%, despite remaining the traditional calling of the district. After years of decline, the number of people employed in agriculture started growing again in The employed rate for population aged from 15 to 64 was equal to 68.8% in 2008: the male employment rate (72.1%) is still much higher than the female rate (61.4%), although the number of employed women and women seeking employment increased by 20 thousand during the past year. The foreign workers employed in 2008 in the Torino area totalled over 76 thousand individuals, with a 1.2% increase with respect to the previous year. The main countries of origin of foreign workers are Romania and Bulgaria, followed by Africa; 32% of all employment contracts are open-ended. Companies run by women increased less in 2008 than in 2007, and now are slightly more than 55 thousand. Other features of the province of Torino are an educational system of excellence: in 2008, over 15 thousand students graduated from the University and Polytechnic. The highest number of students graduated in engineering, economics, medicine and surgery. Women were over half of all graduates and their numbers have constantly grown over the past years, while the number of male graduates has slightly decreased since 2007 (-2.4%). The total students enrolled in first and second level postgraduate courses in 2007/2008 were 1,537, with a 13% increase with respect to the previous academic year. The number of high school graduates increased (+3.6%). The number of foreign students in primary and secondary schools has increased, and now total 28,000 individuals: 56% of foreign students come from Europe - above all Romania. The highest number are found in primary schools (38% of the total). 12

13 EMPLOYMENT AND EDUCATION Table 3 Employment indicators Chart 11 Area of origin of foreign workers employed in province of Torino Employed % Employment in thousands level age Employed in thousands Men Women Total Unemployed % in thousands Unemployment level age Men Women Total Agricolture 16 Industry 249 Buildings 65 Services 643 Total 957 Work % Activity force in level age thousands , Africa America Asia Europe (extra EU) EU 25 2,578 2,099 3,607 3,623 7,472 6,482 8,380 7,358 16,896 17, Total 2008: 76,178 of which 32% open-ended +1.2% total with respect to ,245 Romania, Bulgaria 38, ,000 10,000 15,000 20,000 25,000 30,000 35,000 40,000 45,000 Source: ISTAT, Employed average Source: Piemonte Region, Employment market observatory based on local province administration data - Years


14 3 EMPLOYMENT AND EDUCATION Chart 12 Women - owned companies by sector in the province of Torino Total % of women - owned companies in province of Torino at end of 2008: 55,060; +0.8% with respect to end of % Not classified 3,526 Chart 13 Foreign students enrollments by school type and geographical area in the province of Torino. School year total 2007/2008: 28, % compared to S.Y. 2006/2007 5,965 Education, health and other public, social and personal services 5, % Hotels and restaurant 3, % 7.6% Agricolture and fishing 4,194 Oceania America Africa Asia Europe 1, , , , % Industry 5, % Services 13, , , , % Construction 31.9% Trade 1,995 17,538 Source: InfoCamere, StockView database - Year 2008 Secondary school 2nd Secondary school 1st Primary school Nursery school Source: Piedmont Region, Ires Piemonte, Educational Observatory - School year 2007/

15 EMPLOYMENT AND EDUCATION Chart 14 Bachelor and Master Degrees Table 4 obtained at Torino University and Technological University 3,097 Post-degree educational offer - Torino University and Technological University Bachelor and Master degrees in 2008: 15,098 of which 6,940 males and 8,158 females M W ,054 1,127 1,186 1,201 1,741 Ist level Master 2nd level Master degree degree Athenaeum Technological University Technological University (Torino) University University Iscritti Enrolled Males A.A. A.Y. Females /2008 Iscritti Total Iscritti Males of which Iscritti foreigners Females Iscritti Total Biotechnological sciences Medicine and veterinary Pharmacy Agrarian studies Motor sciences Psycology Interfaculty Foreign languages and literature Education Law Mathematics, phisics and natural sciences Architecture Political sciences Arts and philosophy Medicine and surgery Economics Engineering Source: Ministry for University Education and Scientific Research data Iscritti Males Graduates Iscritti Females Iscritti Total Iscritti Males of which Iscritti foreigners Females Iscritti Total Source: Ministry for University Education and Scientific Research 15
16 Tourism and quality of life Piedmont and the province of Torino have gained major international visibility over the past years, above all as an effect of the Winter Olympics. The city was the first to enjoy the positive effects created by this event: Torino and its environs have become a tourist destination capable of attracting national and international visitors as a result of the urban, architectural and infrastructure renovation projects undertaken over the past years. Visitors from France ranked in first place in 2008, followed by tourists from the UK, Israel and Russia. Congress tourism is a consolidated by economic sector for the province: congresses increased by 5.6% in 2008 in Torino, with over 1.6 million participants and 2 million attendances. The cultural portfolio of Torino and metropolitan area increased in 2008, further witnessing the strong attraction potential of the area: with respect to the previous year, the number of visitors to museums increased by over 13%. Confirming the positive results obtained at end of 2007, Reggia di Venaria ranked first in 2008 for number of visitors, followed by the National Cinema Museum and the Egyptian Museum. Families from Torino maintained their interest in cultural events as a response to the increased offering: on an average spending of 2,586 euro a month, the expenditure for leisure and culture held its ground (7.1% of the total). More in detail, approximately 12% of the total monthly expenditure is dedicated to food, and the remaining 88% to non-food items. Families in Torino are increasingly more technological: the number of satellite navigators and PDAs doubled from 2008 to 2007, and the number of MP3 players increased by 50%. Digital TV decoders and ADSL connections have started becoming very popular. 16


17 TOURISM AND QUALITY OF LIFE Chart 15 Accomodation facilities by type Chart 16 and capacity 563 hotels (residential hotels included) +17% compared to other types of accomodation facilities +105% compared to ,000 Torino metropolitan museum system First 10 by attendance 690, , , , ,952 Total attendance to Torino museums in 2008: 3,6 million +13.5%compared to Non hotel facility 1-2 stars 3 stars 4-5 stars Beds , , , , , , , , , , ,185 69, , , ,353 50, Source: Piedmont Region, Regional Tourist Observatory Reggia di Venaria National Cinema Museum Egyptian Museum Palazzo Madama Palazzo Bricherasio Foundation Racconigi Castle Antiquity Museum Royal Palace Museum of Natural Sciences Rivoli Castle Source: Piedmont Region,Piedmont Cultural Observatory 17


18 TOURISM AND QUALITY OF LIFE Chart 17 Provenance of Foreign Tourists arriving Chart 18 in the province of Torino Arrivals of Italian and foreign tourists in the province of Torino Foreign arrivals: 245 thousand, 16% of all arrivals. Total arrivals: 1 million 483 thousand 25.5% 12.9% Other countries France 12.5% 62,635 31,898 UK 30,664 Total arrivals 2008: 1 million 483 thousand Total stays 2008: 5 milion 272 thousand Italian arrivals Foreign arrivals 1,022,957 1,018,337 1,089,296 1,237, % Belgium 5, % Poland 5, % Netherlands 6, % USA 6, % Brazil 4, % Switzerland and Liechtenstein 8,845 4% China 9, % Romania 11, % Germany 11,756 Source: Piedmont Region, Regional Tourist Observatory - Year % Israel 24, % Russia 12, % Spain 12, , , , , , , , , , , Source: Piedmont Region, Regional Tourist Observatory - Year

19 TOURISM AND QUALITY OF LIFE Chart 19 Breakdown on family spending in Torino Table 5 Congress System in Torino Year 2008 Average total monthly spending in 2008: euro out of which 11,5% food and 88,5% non-food spending Education, leisure time and cultural activities 7.1% 7.8% Health and other services 4.4% Clothing and shoes 11.5% Food and beverages Number of congresses Number of participants Days of participation Average stay Hotels Var.% Congress Var.% congress 08/07 centre 08/07 centre 3, % % 375, % 1,164, % 389, % 1,613, % Other Var.% congress Total 08/07 facilities 14.2% Transport and communications 8.8% Furniture, domestic appliances, home services 35.4% Dwelling, fuels and energy spending Number of congresses Number of participants Days of participation Average stay 419 4, % 114,379 1,655, % 116,339 2,119, % Source: XII Observatory of Torino family spending, Torino Chamber of Commerce, Ascom, Confesercenti -Year 2008 Source: Piedmont Region Tourism Observatory - Year
20
Socio-economic profile of the province
 10 Socio-economic profile of the province Torino Chamber of Commerce, Industries, Crafts and Agriculture All rights reserved. Unauthorised reproduction prohibited Photographs: ANFIA (Associazione Nazionale
Province of Macerata: the economic system. Annalisa Franceschetti Chamber of Commerce of Macerata
 Province of Macerata: the economic system Annalisa Franceschetti Chamber of Commerce of Macerata Main social and economic features Strong social cohesion but also a social community in profound transformation
Albania: Country of Opportunities
 Albania: Country of Opportunities Four reasons to invest in Albania A Export-oriented B Competitive C Promising D Comprehensive Growth Human Capital Sectoral Opportunities Structural Reforms A Export-oriented
1. Economy. Economic Aggregates. Foreign Trade. Prices. Financial Statistics. Government Finance. Wages and Compensation. Foreign Investment
 1. Economy Economic Aggregates Foreign Trade Prices Financial Statistics Government Finance Wages and Compensation Foreign Investment GDP at Current Prices, Abu Dhabi Emirate, 2014* Non-oil GDP 952,676
2018 BAVARIA S ECONOMY FACTS AND FIGURES
 Bavarian Ministry of Economic Affairs, Energy and Technology 2018 BAVARIA S ECONOMY FACTS AND FIGURES wwwstmwibayernde As of August 2018 Area Population (3006) 1) females males age 0-14 (3112) 15-64 65+
The Role of Clusters in Local Economic and Social Development: the Italian Experience Some issues from the Marche Region
 The Role of Clusters in Local Economic and Social Development: the Italian Experience Some issues from the Marche Region Pietro Marcolini Member of the Marche Regional Board for Finance and Planning Santo
RIS 3 Sicily SICILY IN PILLS
 RIS 3 Sicily 2014-2020 SICILY IN PILLS FARO, Portugal, July 4th 2013 Sicily is the largest Italian region, with a surface of 8,5% of the whole national territory. It is the fourth most populated region
THE REGION OF OPPORTUNITY
 SPECIAL ISSUE: PIEMONTE S INTERNATIONALISATION PLAN THE REGION OF OPPORTUNITY As one of Italy s largest and most densely populated regions, Piemonte has a rich legacy of history and tradition, but it has
HIGHLIGHTS. There is a clear trend in the OECD area towards. which is reflected in the economic and innovative performance of certain OECD countries.
 HIGHLIGHTS The ability to create, distribute and exploit knowledge is increasingly central to competitive advantage, wealth creation and better standards of living. The STI Scoreboard 2001 presents the
General Directorate for Economic and Cultural Promotion and Innovation. General Director, Mr. Vincenzo de Luca
 General Directorate for Economic and Cultural Promotion and Innovation General Director, Mr. Vincenzo de Luca STEERING COMMITTEE MINISTRY OF FOREIGN AFFAIRS CO-CHAIRED MINISTRY FOR ECONOMIC DEVELOPMENT
EU exports to Indonesia, Malaysia and Thailand
 EU exports to Indonesia, Malaysia and Note prepared for the Malaysian Palm Oil Council May 2018 EU exports of goods to Indonesia, Malaysia and amounted to EUR 39.5 billion in 2017 and supported at least
Poland s ECONOMIC PERFORMANCE
 Poland s ECONOMIC PERFORMANCE Trade and Investment Promotion Section Embassy of the Republic of Poland in The Hague June 2014 Project co-financed by the European Union from European Regional Development
2 EU exports to Indonesia Malaysia and Thailand across
 1 EU exports to Indonesia Malaysia and In 2017, the EU exported goods to Indonesia Malaysia and worth EUR 39.5 billion. This is equivalent to 2.1 per cent of total EU exports of goods to non-eu countries.
Guangxi Zhuang Autonomous Region 2013
 Guangxi Zhuang Autonomous Region 2013 By Sophie Lu LUP 011.8-3, Dec. 2013 Guangxi is the country s only area in the west which has a coastline and seaports. This region has the geographic advantage of
CHINA INTERNATIONAL INBOUND TRAVEL MARKET PROFILE (2015) 2015 U.S. Travel Association. All Rights Reserved.
 2015 U.S. Travel Association. All Rights Reserved.") CHINA INTERNATIONAL INBOUND TRAVEL PROFILE (2015) 2015 U.S. Travel Association. All Rights Reserved. SUMMARY China is one of the fastest-growing inbound travel markets to the United States; it is consistently
CHINA INTERNATIONAL INBOUND TRAVEL PROFILE (2015) 2015 U.S. Travel Association. All Rights Reserved. SUMMARY China is one of the fastest-growing inbound travel markets to the United States; it is consistently
SCIENCE, INNOVATIONS AND TECHNOLOGIES IN THE REPUBLIC OF BELARUS
 SCIENCE, INNOVATIONS AND TECHNOLOGIES IN THE REPUBLIC OF BELARUS State Committee on Science and Technology of the Republic of Belarus Short Statistical Book 2009 УДК 001 (476) Prepared by: D. Aliokhin,
Europe in Figures - Eurostat Yearbook 2008 The diversity of the EU through statistics
 STAT/08/75 2 June 2008 Europe in Figures - Eurostat Yearbook 2008 The diversity of the EU through statistics What was the population growth in the EU27 over the last 10 years? In which Member State is
Departing tourists: March 2009
 29 April 2009 1100 hrs 074/2009 Tourstat survey data indicate that inbound tourists in were estimated at 71,153, a decrease of 21.4 per cent when compared to the corresponding month last year, and practically
BULGARIAN TRADE WITH EU IN THE PERIOD JANUARY - JUNE 2014 (PRELIMINARY DATA)
") BULGARIAN TRADE WITH EU IN THE PERIOD JANUARY - JUNE 2014 (PRELIMINARY DATA) In the period January - June 2014 Bulgarian exports to the EU increased by 2.8% to the corresponding the year and amounted to
BULGARIAN TRADE WITH EU IN THE PERIOD JANUARY - JUNE 2014 (PRELIMINARY DATA) In the period January - June 2014 Bulgarian exports to the EU increased by 2.8% to the corresponding the year and amounted to
Manufacturing in Mexico
 Manufacturing in Mexico Picture: Flickr: José Luis Ruiz Emilio Cervantes Pacheco, MSc Student February 23 rd, 2016. e.cervantes@cranfield.ac.uk Why Mexico? High-productivity and low-cost center. Productivity
ECONOMY OF SIBIU COUNTY. RESOURCES FOR A FUTURE DEVELOPMENT.
 ECONOMY OF SIBIU COUNTY. RESOURCES FOR A FUTURE DEVELOPMENT. POPESCU Doris-Louise 1 Lucian Blaga University of Sibiu, Romania Abstract: Economically, the County of Sibiu has been characterized, especially
COUNTRY DATA: UNITED KINGDOM: Information from the CIA World INTRODUCTION GEOGRAPHY
 COUNTRY DATA: UNITED KINGDOM: Information from the CIA World INTRODUCTION The United Kingdom has historically played a leading role in developing parliamentary democracy and in advancing literature and
THIS IS AUSTRIA. Facts & Figures. November Austrian Federal Economic Chamber Economic Policy Department
 THIS IS AUSTRIA Facts & Figures November 2016 Austrian Federal Economic Chamber Economic Policy Department wp@wko.at 1 AUSTRIA AT A GLANCE The Federal Republic of Austria is a small and open economy located
Gender effects of the crisis on labor market in six European countries
 Gender effects of the crisis on labor market in six European countries Hélène Périvier Marion Cochard et Gérard Cornilleau OECD meeting, 06-20-2011 helene.perivier@ofce.sciences-po.fr marion.cochard@ofce.sciences-po.fr
Globalisation and the Knowledge Economy the Case of Ireland
 Globalisation and the Knowledge Economy the Case of Ireland Andrew McDowell Chief Economist October 2006 The Development of the Irish Economy 1988 1997 2004 MAY 1997 MAY 1997 2 Ireland s Economic Transformation
Algeria: opportunities and challenges for Maltese companies
 Algeria: opportunities and challenges for Maltese companies Presentation 28 th June 2018 Ministry of foreign Affairs and Trade Promotion MALTA Mahfoud DORBHAN External Consultant TradeMalta Objectives
INVEST IN VIỆT NAM INVEST IN ASEAN
 INVEST IN VIỆT NAM INVEST IN ASEAN ASEAN CONNECTIVITY MINISTRY OF PLANNING AND INVESTMENT http://fia.mpi.gov.vn 1 28 June 2016 Vietnam Family Day ASEAN We are family Viet Nam 95 million people 331.211km2
European Job Day Zagreb, Croatia, 18th October 2017 Tvoje
 LIVING & WORKING CONDITIONS European Job Day Zagreb, Croatia, 18th October 2017 Tvoje BASIC DATA Capital city: Bratislava Official language: Slovak Population: 5.4 million Surface area: 49 035 km 2 Date
CONSTRUCTION IN SPAIN: CRISIS AND FUTURE PROSPECTS
 Int. Journal for Housing Science, Vol.36, No.2 pp.109-121, 2012 Published in the United States CONSTRUCTION IN SPAIN: CRISIS 2007-2010 AND FUTURE PROSPECTS L. Villegas, C. Carrasco, I. Lombillo, C. Liaño
Cambodia s Economy, Sectoral Outlook, Employment, and Skills
 Cambodia s Economy, Sectoral Outlook, Employment, and Skills Chab Dai Bi-Annual Member Meeting 23 November 2017 Emerging Markets Consulting This presentation will cover the following topics: Contents Economic
Austrian Competitiveness
 Austrian Competitiveness Karl Hartleb Deputy Director General ADVANTAGEAUSTRIA Austrian Federal Economic Chamber io. io. Austria: the ideal access point to Europe markets 760 mio. customers 0,7% 1,7% 1,2%
Global Trends in Location Selection Final results for 2005
 Global Business Services Plant Location International Global Trends in Location Selection Final results for 2005 September, 2006 Global Business Services Plant Location International 1. Global Overview
COUNTRY DATA: Belgium : Information from the CIA World Factbook
 COUNTRY DATA: Belgium : Information from the CIA World Factbook INTRODUCTION Belgium became independent from the Netherlands in 1830; it was occupied by Germany during World Wars I and II. The country
CHANGES OF PRIVATE CONSUMPTION PATTERNS IN ROMANIA AND THE EU: EVIDENCE BEFORE, DURING AND AFTER THE CRISIS
 International Journal of Economics, Commerce and Management United Kingdom Vol. III, Issue 10, October 2015 http://ijecm.co.uk/ ISSN 2348 0386 CHANGES OF PRIVATE CONSUMPTION PATTERNS IN ROMANIA AND THE
Perspective on India - Germany Trade Relations and the way forward
 Perspective on India - Germany Trade Relations and the way forward Ajay Durrani 04.10.2018 covestro.com Forward-looking statements This presentation may contain forward-looking statements based on current
China and India:Convergence and Divergence
 China and India:Convergence and Divergence I. "What China is good at, India is not and vice versa. The countries are inverted mirror of each other».. «very real possibility that China and India will in
March 2016 Potential and Outlook for the
 March 2016 Potential and Outlook for the Pacific Alliance Outline 1 Pacific Alliance: aiming for integration into the global economy 2 Pacific Alliance: outlook and challenges Page 2 China United States
SURVEY TO CONGRESS PARTICIPANTS
 SURVEY TO CONGRESS PARTICIPANTS 2018 SURVEY TO CONGRESS PARTICIPANTS INTRODUCTION Bearing in mind the relevancy of the Meetings Industry segment in the positioning of Lisbon as a tourism destination, and
The EU s external projection: some interpretations based on the Elcano Global Presence Index
 ARI 21/2018 16 February 2018 The EU s external projection: some interpretations based on the Elcano Global Presence Index Iliana Olivié Senior Analyst, Elcano Royal Institute @iolivie Manuel Gracia Analyst
Introduction. International Traveler Trips. Significance of International Travel. Figure 1: International Traveler Trips by years
 Introduction This report presents basic characteristics of international travel to Georgia for the period of year 2016. The data is provided by National Statistics Office of Georgia. The sphere of the
Objective Indicator 27: Farmers with other gainful activity
 3.5. Diversification and quality of life in rural areas 3.5.1. Roughly one out of three farmers is engaged in gainful activities other than farm work on the holding For most of these farmers, other gainful
NOI ITALIA. 100 STATISTICS TO UNDERSTAND THE COUNTRY WE LIVE IN
 03 May 2012 Data publication office tel. +39 06 4673.3105 Press office tel. +39 06 4673.2243-44 ufficiostampa@istat.it 2012 Edition NOI ITALIA. 100 STATISTICS TO UNDERSTAND THE COUNTRY WE LIVE IN Noi Italia.
24 Negocios infographics oldemar. Mexico Means
 2 Negocios infographics oldemar Mexico Means Mexico s Means Partner opportunity enersave OPPORTUNITY 2 Negocios INFOGRAPHICS OLDEMAR MEET MEXICO MEXICO IS A big country Mexico is part of North America,
Migration, Employment, and Food Security in Central Asia: the case of Uzbekistan
 Migration, Employment, and Food Security in Central Asia: the case of Uzbekistan Bakhrom Mirkasimov (Westminster International University in Tashkent) BACKGROUND: CENTRAL ASIA All four countries experienced
Dirk Pilat:
 Note: This presentation reflects my personal views and not necessarily those of the OECD or its member countries. Research Institute for Economy Trade and Industry, 28 March 2006 The Globalisation of Value
Belgium s foreign trade
 Belgium s FIRST 9 months Belgium s BELGIAN FOREIGN TRADE AFTER THE FIRST 9 MONTHS OF Analysis of the figures for (first 9 months) (Source: eurostat - community concept*) After the first nine months of,
1.3. Rankings: imports, exports and overall trade volume Philippines trade with EU Member States Structure and trends by product
 Front Cover Contents 1 Overview 2 1. Trade Relations 1.1. Trade in goods: main trends 1.2. Trade in services 1.3. Rankings: imports, exports and overall trade volume 1.4. Comparison of EU-Philippines
The Global Economic Crisis Sectoral coverage
 Working Paper No. 271 The Global Economic Crisis Sectoral coverage Trends in Employment and Working Conditions by Economic Activity Statistical Update Third quarter 2009 Sectoral Activities Department
Summary of the Results
 Summary of the Results CHAPTER I: SIZE AND GEOGRAPHICAL DISTRIBUTION OF THE POPULATION 1. Trends in the Population of Japan The population of Japan is 127.77 million. It increased by 0.7% over the five-year
2014 BELGIAN FOREIGN TRADE
 2014 BELGIAN FOREIGN TRADE 2 3 01 \\ EXPORTS 6 1.1 Geographical developments 1.2 Sectoral developments 02 \\ IMPORTS 14 2.1 Geographical developments 2.2 Sectoral developments 03 \\ GEOGRAPHICAL TRADE
TRIPS OF BULGARIAN RESIDENTS ABROAD AND ARRIVALS OF VISITORS FROM ABROAD TO BULGARIA IN AUGUST 2015
 TRIPS OF BULGARIAN RESIDENTS ABROAD AND ARRIVALS OF VISITORS FROM ABROAD TO BULGARIA IN AUGUST 2015 In August 2015, the number of the trips of Bulgarian residents abroad was 512.0 thousand (Annex, Table
Issues in Education and Lifelong Learning: Spending, Learning Recognition, Immigrants and Visible Minorities
 Issues in Education and Lifelong Learning: Spending, Learning Recognition, Immigrants and Visible Minorities Dr. Michael Bloom Executive Director, Strategic Projects, & Director, Education and Learning
South Africa: Country Report
 South Africa: Country Report Erika, Helena, Jo, Josephilda & Rasigan Presentation to GLOBELICS Workshop on Learning, Innovation, & Competencebuilding Systems in Brazil, Russia, India, China & South Africa
TRIPS OF BULGARIAN RESIDENTS ABROAD AND ARRIVALS OF VISITORS FROM ABROAD TO BULGARIA IN MARCH 2016
 TRIPS OF BULGARIAN RESIDENTS ABROAD AND ARRIVALS OF VISITORS FROM ABROAD TO BULGARIA IN MARCH 2016 In March 2016, the number of the trips of Bulgarian residents abroad was 354.7 thousand (Annex, Table
TRIPS OF BULGARIAN RESIDENTS ABROAD AND ARRIVALS OF VISITORS FROM ABROAD TO BULGARIA IN MAY 2017
 TRIPS OF BULGARIAN RESIDENTS ABROAD AND ARRIVALS OF VISITORS FROM ABROAD TO BULGARIA IN MAY 2017 In May 2017, the number of the trips of Bulgarian residents abroad was 653.3 thousand (Annex, Table 1) or
TRIPS OF BULGARIAN RESIDENTS ABROAD AND ARRIVALS OF VISITORS FROM ABROAD TO BULGARIA IN AUGUST 2016
 TRIPS OF BULGARIAN RESIDENTS ABROAD AND ARRIVALS OF VISITORS FROM ABROAD TO BULGARIA IN AUGUST 2016 In August 2016, the number of the trips of Bulgarian residents abroad was 590.6 thousand (Annex, Table
TRIPS OF BULGARIAN RESIDENTS ABROAD AND ARRIVALS OF VISITORS FROM ABROAD TO BULGARIA IN SEPTEMBER 2015
 TRIPS OF BULGARIAN RESIDENTS ABROAD AND ARRIVALS OF VISITORS FROM ABROAD TO BULGARIA IN SEPTEMBER 2015 In September 2015, the number of the trips of Bulgarian residents abroad was 450.9 thousand (Annex,
TRIPS OF BULGARIAN RESIDENTS ABROAD AND ARRIVALS OF VISITORS FROM ABROAD TO BULGARIA IN FEBRUARY 2017
 TRIPS OF BULGARIAN RESIDENTS ABROAD AND ARRIVALS OF VISITORS FROM ABROAD TO BULGARIA IN FEBRUARY 2017 In February 2017, the number of the trips of Bulgarian residents abroad was 366.8 thousand (Annex,
GEORGIA - AT A GLANCE
 FACTS AND FIGURES GEORGIA - AT A GLANCE Area: Population: 69,7 km 2 3.7 mln Vilnius Life expectancy: 75 years Literacy: 1% National Currency: GEL (Georgian Lari) Calling code: +995 Average Air Temperature:
The statistical regions of Europe as delineated by the United Nations as: Northern, Western,
 Regional Economy Paper: Geography The statistical regions of Europe as delineated by the United Nations as: Northern, Western, Eastern and Southern Europe. Western Europe has a long history of trade, free
GROW WITH POLAND. 25 years. 10th Inhabitants 6 th in EU. without recession. The only such country in the EU
 The City of Warsaw GROW WITH POLAND 38.4 MLN 4.5% 25 years 8 th largest 10th Inhabitants 6 th in EU GDP growth forecast in 2018 without recession economy in EU most attractive destination for international
TRIPS OF BULGARIAN RESIDENTS ABROAD AND ARRIVALS OF VISITORS FROM ABROAD TO BULGARIA IN DECEMBER 2016
 TRIPS OF BULGARIAN RESIDENTS ABROAD AND ARRIVALS OF VISITORS FROM ABROAD TO BULGARIA IN DECEMBER 2016 In December 2016, the number of the trips of Bulgarian residents abroad was 397.3 thousand (Annex,
SURVEY TO CONGRESS PARTICIPANTS
 SURVEY TO CONGRESS PARTICIPANTS 2017 SURVEY TO CONGRESS PARTICIPANTS INTRODUCTION Bearing in mind the relevancy of the Meetings Industry segment in the positioning of Lisbon as a tourism destination, and
STOCKHOLM. Yearbook: Summary Results 232
 STOCKHOLM Stockholm is the capital city of Sweden, located on 15 islands where Lake Mälaren enters the Baltic Sea. Stockholm is the centre of an urban region with a population of approximately 1,760,000,
Italian Firms, Global Markets 22 May 2012 CCIAA Parma
 Italian Firms, Global Markets 22 May 2012 CCIAA Parma Fabio Sdogati fabio.sdogati@polimi.it 1 Table of Contents 1. The Global Scenario 1.1. The Great Recession 1.2. Great Divergences 2. Internationalization
Selected macro-economic indicators relating to structural changes in agricultural employment in the Slovak Republic
 Selected macro-economic indicators relating to structural changes in agricultural employment in the Slovak Republic Milan Olexa, PhD 1. Statistical Office of the Slovak Republic Economic changes after
Monthly Inbound Update June th August 2017
 Monthly Inbound Update June 217 17 th August 217 1 Contents 1. About this data 2. Headlines 3. Journey Purpose: June, last 3 months, year to date and rolling twelve months by journey purpose 4. Global
7th Grade First Semester Test
 7th Grade First Semester Test 2013-2014 Multiple Choice Identify the choice that best completes the statement or answers the question. 1 Study the map below and use it to answer the following question.
Citizens awareness and perceptions of EU regional policy
 Flash Eurobarometer 298 The Gallup Organization Flash Eurobarometer European Commission Citizens awareness and perceptions of EU regional policy Fieldwork: June 1 Publication: October 1 This survey was
Provincial Review 2016: Western Cape
 Provincial Review 2016: Western Cape The Western Cape s real economy is dominated by manufacturing and commercial agriculture. As a result, while it did not benefit directly from the commodity boom, it
Proposal to the General Shareholder Meeting Regarding the Approval of Vietinbank s strategy in expanding oversea networks
 VIETNAM JOINT STOCK COMMERCIAL BANK FOR INDUSTRY AND TRADE 108 Tran Hung Dao, Hoan Kiem, Hanoi Tel: 043.9421030 Fax: 043.9421032 Certificate for the business registration No 0100111948 issued on 14/05/2013
1.1. Trade in goods: main trends Rankings: imports, exports and overall trade volume Philippines trade with EU Member States
 Front Cover Contents Message from the EU Trade Commissioner 2 Overview 3 1. Trade Relations 1.1. Trade in goods: main trends 1.2. Trade in services 1.3. Rankings: imports, exports and overall trade volume
Magdalena Bonev. University of National and World Economy, Sofia, Bulgaria
 China-USA Business Review, June 2018, Vol. 17, No. 6, 302-307 doi: 10.17265/1537-1514/2018.06.003 D DAVID PUBLISHING Profile of the Bulgarian Emigrant in the International Labour Migration Magdalena Bonev
Palestine in Figures 2011
 Palestine in Figures 2011 March, 2012 This document is prepared in accordance with the standard procedures stated in the Code of Practice for Palestine Official Statistics 2006. March, 2012 All rights
Unions operate as affiliates of Prime Ministry Underscretariat of Foreign Trade, under the roof of Turkish Exporters Assembly
 Exporters Unions are sectoral entities which aim to develop trading capacity and the competitiveness of their member companies Unions operate as affiliates of Prime Ministry Underscretariat of Foreign
Regional Migration Trends
 Regional Migration Trends Auckland Overview 2015/16 immigration.govt.nz For more information www.immigration.govt.nz www.mbie.govt.nz Publishing date: December 2017 ISSN 2538-0303 Crown Copyright 2017
The Israeli Economy: Current Trends, Strength and Challenges
 The Israeli Economy: Current Trends, Strength and Challenges Dr. Karnit Flug Governor of the Bank of Israel 30.06.2017 1 GDP per capita Growth Rates 8 GDP per capita annual % change (2000-2018F) 6 4 2
9HSTCQE*cihdij+ OECD Tourism Trends and Policies Highlights. OECD Tourism Trends and Policies 2018
 OECD Tourism Trends and Policies 2018 Building on the work of the OECD Tourism Committee, within the OECD Centre for Entrepreneurship, SMEs and Local Development, this periodic report is an international
Public consultation on the EU s labour migration policies and the EU Blue Card
 Case Id: a37bfd2d-84a1-4e63-8960-07e030cce2f4 Date: 09/07/2015 12:43:44 Public consultation on the EU s labour migration policies and the EU Blue Card Fields marked with * are mandatory. 1 Your Contact
EU- V I E T N A M B U S I N E S S N E T W O R K. This project is co-funded by the European Union
 EU- V I E T N A M B U S I N E S S N E T W O R K A LITTLE WARM-UP How many motorbikes roamed Vietnam s streets in 2016? a) 45 million b) 10 million c) 60 million How many motorbikes roamed Vietnam s streets
Ignacio Molina and Iliana Olivié May 2011
 Ignacio Molina and Iliana Olivié May 2011 What is the IEPG? The Elcano Global Presence Index (IEPG after its initials in Spanish) is a synthetic index that orders, quantifies and aggregates the external
INTERNATIONAL COOPERATION IN URBAN DEVELOPMENT POLICY
 INTERNATIONAL COOPERATION IN URBAN DEVELOPMENT POLICY DIRECTORATE GENERAL FOR REGIONAL AND URBAN POLICY EUROPEAN COMMISSION 25 May 2015 The background: the EU as an opportunity for international cooperation
Japanese External Policies and the Asian Economic Developments
 Japanese External Policies and the Asian Economic Developments Ken-ichi RIETI, Japan June 2002 5th GTAP Annual Conference Table of Contents Economic Developments of Japan and Asia Trends in the Japanese
Youth labour market overview
 0 Youth labour market overview Turkey is undergoing a demographic transition. Its population comprises 74 million people and is expected to keep growing until 2050 and begin ageing in 2025 i. The share
Section A: Europe: countries and borders
 Chapter 2: Europe Section A: Europe: countries and borders 1. There is only one correct answer for each of these multi choice questions (7 marks) What percentage of the world s land does Europe occupy?
General Assembly Twenty-second session Chengdu, China, September 2017 Provisional agenda item 4
 General Assembly Twenty-second session Chengdu, China, 11-16 September 2017 Provisional agenda item 4 A/22/4 Madrid, 9 September 2017 Original: English Statement by the Secretary-General I. Tourism at
London Measured. A summary of key London socio-economic statistics. City Intelligence. September 2018
 A summary of key socio-economic statistics September 2018 People 1. Population 1.1 Population Growth 1.2 Migration Flow 2. Diversity 2.1 Foreign-born ers 3. Social Issues 3.1 Poverty & Inequality 3.2 Life
Canadians as Global Citizens Unit 4
 Canadians as Global Citizens Unit 4 Interconnections: From Local to Global We are connected to other people and places in a number of ways "A Global Morning" p.385 Global Village - the concept that people
Cup-o-nomics Business opportunities in Poland and Ukraine
 ING Cup-o-nomics June 2012 Cup-o-nomics Business opportunities in and Euro 2012 is not only set to provide many great football moments but also business opportunities. Due in part to Euro 2012 and will
BULGARIAN TRADE WITH THIRD COUNTRIES IN THE PERIOD JANUARY - SEPTEMBER 2017 (PRELIMINARY DATA)
") BULGARIAN TRADE WITH THIRD COUNTRIES IN THE PERIOD JANUARY - SEPTEMBER 2017 (PRELIMINARY DATA) In the period January - September 2017 Bulgarian exports to third countries increased by 15.0% in comparison
BULGARIAN TRADE WITH THIRD COUNTRIES IN THE PERIOD JANUARY - SEPTEMBER 2017 (PRELIMINARY DATA) In the period January - September 2017 Bulgarian exports to third countries increased by 15.0% in comparison
The Austrian export industry has been incredibly successful in recent years. In 2004 our country even captured the title of European Export Champion!
 WKO 2005_engl->Gerin 01.12.2005 14:12 Uhr Seite 1 Dear Teachers and Pupils! The Austrian export industry has been incredibly successful in recent years. In 2004 our country even captured the title of European
The Scope for Attracting Foreign Investors to Eastern Germany
 The Scope for Attracting Foreign Investors to Eastern Germany As eastern Germany seeks to catch up economically with the West of the country, the region must expand its economic base and overcome its structural
Trade Creates Jobs for Pennsylvania
 Trade Creates Jobs for Pennsylvania Creating and preserving quality U.S. jobs is a goal shared by all Americans. With 95 percent of the world s consumers living outside of the United States, it makes sense
CHAPTER TITLE MAIN INDICATORS OF THE VISEGRÁD GROUP COUNTRIES
 CHAPTER TITLE MAIN INDICATORS OF THE VISEGRÁD GROUP COUNTRIES MAIN INDICATORS OF THE VISEGRÁD GROUP COUNTRIES Hungarian Central Statistical Office, 218 Czech Statistical Office, 218 Statistics Poland,
The application of quotas in EU Member States as a measure for managing labour migration from third countries
 The application of quotas in EU Member States as a measure for managing labour migration from third countries 1. INTRODUCTION This EMN Inform 1 provides information on the use of quotas 2 by Member States
How the world views Britain 2017
 How the world views Britain 2017 Foresight issue 158 VisitBritain Research November 2017 1 Contents 1. Introduction and study details 2. Headline findings 3. Tourism, Culture and Welcome rankings 4. Tourism
CANARY ISLANDS HEADLINE ECONOMIC INDICATORS
 29/07/2014 CANARY ISLANDS HEADLINE ECONOMIC INDICATORS 6 6 May 2016 Viceconsejería de Economía y Asuntos Económicos con la UE Department for Economy and European Economic Affairs CANARY ISLANDS HEADLINE
THE EFFECTS OF LABOUR FORCE MIGRATION IN ROMANIA TO THE COMUNITY COUNTRIES-REALITIES AND PERSPECTIVES-
 THE EFFECTS OF LABOUR FORCE MIGRATION IN ROMANIA TO THE COMUNITY COUNTRIES-REALITIES AND PERSPECTIVES- Szarka Arpad University of Oradea Faculty of Economical Sciences, Oradea, 1. Universitatii St., postal
Eurostat Yearbook 2006/07 A goldmine of statistical information
 25/2007-20 February 2007 Eurostat Yearbook 2006/07 A goldmine of statistical information What percentage of the population is overweight or obese? How many foreign languages are learnt by pupils in the
How many students study abroad and where do they go?
 1. EDUCATION LEVELS AND STUDENT NUMBERS How many students study abroad and where do they go? More than 4.1 million tertiary-level students were enrolled outside their country of citizenship in 2010. Australia,