The Impact of Visa-Free Entry on the Determinants of Inbound Tourism. Demand in Indonesia
|
|
|
- Magnus Cannon
- 5 years ago
- Views:
Transcription

1 IDEC DP DP 2 Series Vol.5 Vol.6 No.3 No.5 The Impact of Visa-Free Entry on the Determinants of Inbound Tourism Demand in Indonesia Ferika Pujiharini Graduate School for International Development and Cooperation, Hiroshima University Masaru Ichihashi Graduate School of International Development and Cooperation, Hiroshima University Department of Development Policy Division of Development Science Graduate School for International Development and Cooperation (IDEC) Hiroshima University Kagamiyama, Higashi-Hiroshima JAPAN
2 The Impact of Visa-Free Entry on the Determinants of Inbound Tourism Demand in Indonesia Ferika Pujiharini* and Masaru Ichihashi September, 2016 Department of Development Policy Division of Development Science Graduate School for International Development and Cooperation, Hiroshima University, Kagamiyama, Higashi-Hiroshima, Hiroshima , JAPAN
3 The Impact of Visa-Free Entry on the Determinants of Inbound Tourism Demand in Indonesia Ferika Pujiharini 1 and Masaru Ichihashi 2 September, 2016 Graduate School for International Development and Cooperation, Hiroshima University, Kagamiyama, Higashi-Hiroshima, Hiroshima, , Japan Abstract Many countries have applied a new visa-free policy to boost the number of international tourist. In 2003, the Presidential Decree of the Republic of Indonesia No. 18/2003 concerning the Exemption from Brief Visit Visa for citizens from 11 countries was enacted. Further the revised on Presidential Decree of the Republic of Indonesia No. 43/2011, the latest exemption regarding brief visa-free visit, was implemented for 15 countries. In this study, a panel data set that covers 25 years ( ) for a group from 20 of 30 main export destination countries was used. The number of inbound international visitor arrivals was employed as a dependent variable in this research. The impact of visa-free entry will be measured in this research. Other variables that determine the dependent variables are the real GDP per capita of the source countries; the trade value between Indonesia and the source country, the population levels of the source country, the total number of rooms in hotels available in Indonesia; the export value for the iron metal, steel, machinery, and automotive sector, and the palm oil processing sectors; the relative CPI of Indonesia; the number of world heritage sites in Indonesia; the distance between the capital city of the source country to Indonesia; dummy variables for the Bali bombings, Aceh tsunami, and Economic Crisis in 1998; and the geographical characteristic of Indonesia and the source country, such as whether there are neighboring regions, and whether they practice the same language as Indonesia, and whether they practice the same religion as Indonesia. The results show that the new visa-free entry policy has a positive impact on the number of tourist arrivals. The new visa policy positive significantly can boost the number of tourist arrivals. Keywords: Indonesia; Inbound tourist; Visa-free entry; Panel analysis 1 ferikaph@gmail.com 2 ichi@hiroshima-u.ac.jp 1
4 1. Introduction Indonesia, as one of the main of Asian destination tourists from the world, is trying to increase the number of international tourists. Some programs had been set up during To attract more tourists Indonesia s government, try to find another way to attract tourists. Start in 2003 new policy regulation was issued by Ministry of Law and Human Rights of Indonesia regarding some exemption for brief visit tourists in Indonesia. Based on the Presidential Decree of the Republic of Indonesia No. 18/2003 concerning the Exemption from Brief Visit Visa for citizens from 11 countries were enacted. Further the revised on Presidential Decree of the Republic of Indonesia No. 43/2011, the latest exemption regarding brief visafree visit, was implemented for 15 countries. This paper examines the impact of visa-free entry policy to the number of inbound tourist. It also examines the factors that influencing inbound tourism demands in Indonesia for the period Tourism is defined as the activities of persons identified as visitors. A visitor is someone who is making a visit to a main destination outside his/her usual environment for less than a year for any main purpose including holidays, leisure, recreation, business, health, education or other purposes (UNWTO, Concepts, Definitions, and classifications for Tourism Statistics, 1995). Today, many countries consider the tourism sector to be one of important sectors for foreign exchange earnings. An ever-increasing number of destinations worldwide have opened up to, and invested in tourism, turning it into a key driver of socio-economic progress through the creation of jobs and enterprises. Further, despite occasional shocks, tourism has shown virtually uninterrupted growth (UNWTO, Tourism Highlights, 2015). Inbound tourism is defined as the activities of non-resident visitors in a given area outside their usual environment for not more than one consecutive year for leisure, business and other purposes. Further, inbound tourism is defined as the activities of temporary visitors staying in a place outside their usual place of residence for a continuous period of at least 24 hours but less than one year, for leisure, business or other purposes that are not related to the exercise of an activity remunerated from within the place visited (UNWTO, 1995). Inbound tourism has the following economic advantages: a. It is a source of hard currency for the country. b. It creates jobs for people. c. It represents a tool for development and progress for the nation. d. It is an encouraging and promising field for the investors. e. It is a source for taxes to the country. It also has social advantages: a. It makes commodities available to the people though the enjoyment of a good standard of living, and in particular it helps to develop rural areas where tourist attractions are located. b. It acquaints people with modern technology and facilities life
5 c. It removes obstacles between nations and thus bridges the gap between them. 2015): The travelers have many purposes in their trips that divide into 2 main groups (UNWTO, a. Personal purposes, which includes holidays, leisure and recreation; visits with friends and relatives; education and training; health and medical care; religion and pilgrimages; shopping; transit; and other. b. Business and professional purposes, which includes tourism (also referred to as Travel and Tourism or T&T by the UNWTO), both domestic and international, that is seen as a major driving force of economic recovery and growth. Microeconomic theory states that tourism demand is the amount of any product or service that people are willing and able to buy at each specific price within a set of possible prices during a specified period of time. Faruk Balli et al. (2013) noted that tourism is widely considered a form of international trade flow between the source and destination countries by assuming an increase in the size of the population, GDP per capita and market capitalization at the economic level. Tourism demand is measured based on the natural logarithm of tourist inflows from the source country to destination country. From a reviews of 100 published studies to classify explanatory variables, Lim (1997) concluded that tourism demand is affected income level, relative prices, transportation costs, exchange rates between the currencies of the source and destination countries, dynamics, trends, and qualitative factors (i.e., tourist attributes such as gender, age, education level, attractiveness, political, social status in the destination country). According to Song, Wong and Chon (2003), based on the standard economic theory, the most importance factors that affect for tourist demand are consumer price, income level of the origin country, and price substitution. Applying an autoregressive distributed lag model (ADLM) to capture the dynamics of economics activities and to introduce tourism forecasting in Hong Kong, the most influential determinant of the demand for Hong Kong tourism is the effect of the behavioral persistence of tourists (World of mouth), followed by the cost of tourism, and income elasticity, whereas the price of tourism has a lesser effect on the tourism demand. International tourist arrivals have increased from 25 million globally in 1950 and to 1133 million in 2014 (UNWTO, Tourism Highlights, 2015). Likewise, international tourism receipts earned by destinations worldwide have surged from US$ 2 billion in 1950 to US$ 1245 billion in For the UNWTO region, prospects for 2015 are strongest for Asia and the Pacific and the Americas followed by Europe, the Middle East and Africa 3. 3 UNWTO, Highlight, 2015: a. UNWTO stated that over half of visit for tourists in the world is leisure. As reported by UNWTO that Travel for holidays, recreation and other forms of leisure accounted for just over half of all international tourist arrivals (53% or 598 million) in Some 14% of international tourists reported travelling for business and professional purposes, and another 27% travelled for other reasons such as visiting friends and relatives (VFR), religious reasons and pilgrimages, health treatment, etc. The purpose of visit for the remaining 6% of arrivals was not specified. For the international tourist arrivals, market share, change, and average growth rate can see in 3
6 Based on UNWTO (Tourism Highlights, 2015) compare with other countries, the competitiveness and index ranking of Indonesia is still 50 th among 141 countries with an index of 4.04 (World Economic Forum, 2015), it is 4 th place among ASEAN countries. Figure 1. International Tourist Arrivals in ASEAN Source: UNWTO, Highlights, 2015 The Indonesia tourism sector makes a large contribution to the foreign exchange earnings, with 11, Million USD, even if it was lower than the crude oil, coal, crude palm oil sectors in The paper is organized as follows: Section 2 provides visa-free entry regulation in Indonesia. Section 3 reviews a Recent Research and Conceptual for tourism. It provides some previous literature reviews regarding variables that affect the number of tourist arrivals. Section 4 Methodology, the data that conducted for this research and what method is used. Section 5 Empirical Result. Some estimation approach are used to analyze the data such as FEM, DID and Dynamic panel data. Conclusion and Policy Implication are briefly summarized in Section 6. b. The classification based on the International Monetery Fund (IMF); see the Statistical Annex of IMF World Economic Outlook of April 2015, page See appendix 1 Rank of Indonesia Tourism Sector 4
7 2. Visa-Free Entry Indonesia s government tried to waive the number of International tourists arriving in Indonesia by making a new policy in 2003 regarding visa-free entry into Indonesia. Through visa-free entry, foreign visitors can get a 30-day free visa that is non-extendable or converted to be a different type of visa to pursue government, educational, social and cultural, tourism, business, family, journalistic or transit purposes, and they may enter Indonesia through any immigration border or checkpoint. This definition is based on the following: a. The Presidential Decree of the Republic of Indonesia No. 18/2003 concerning the Exemption from Brief Visit Visa for citizens from 11 countries. b. The Presidential Regulation of the Republic of Indonesia No.16/2008 concerning the Exemption from Brief Visit Visa for citizens from 12 countries. c. The Presidential Regulation of the Republic of Indonesia No.43/2011 concerning the Exemption from Brief Visit Visa for citizens from 15 countries. Table1. Countries with Visa-free Entry Presidential Regulation No No. 18/2003 No.16/2008 No. 43/ Thailand Thailand Thailand 2 Malaysia Malaysia Malaysia 3 Singapore Singapore Singapore 4 Brunei Darussalam Brunei Darussalam Brunei Darussalam 5 Philippines Philippines Philippines 6 Hong Kong Hong Kong Hong Kong 7 Macau Macau Macau 8 Chile Chile Chile 9 Morocco Morocco Peru 10 Turkey Peru Morocco 11 Peru Vietnam Vietnam 12 Ecuador Ecuador 13 Cambodia 14 Lao 15 Myanmar 5
8 By issuing the visa-free entry policy, the government assumed that many tourists will be able to easily do business and vacation as regular citizen. Based on the Presidential Decree no 43/2011 only those 15 countries have special exemption to do business in Indonesia without any visa requirements 5. Figure 2 shows the change in the number of tourist arrivals after visa policy was issued. The increasing number of tourist is in line with the increasing number heritage sites in Indonesia. We need consider the increase of heritage sites will be in line or not with expanding the number of countries with visa-free entry. Figure 2. Comparison of the Number of Tourist Arrivals with World Heritage International Tourist Visa-Free International Tourist World Heritage Source: BPS, UNESCO (2015) World Heritage Trade is one of important determinant of tourism and tourism demand, and there is twoway causality running between trade and tourism (Wilson (2001), N. K. Wilson (2000), and Wai Hong Kan Tsui (2016)). In the tourism demand analysis, trade openness represents bilateral trade between the source country and the destination country. Kim (2007) stated that a better relationship between Laos and the source country is associated with a positive and significant value of trade for tourism. Trade openness can foster a greater understanding between countries and attract more tourists from trading countries. Although the main reason for visitors come to Indonesia for holiday, regarding the second reason leads for business, it needs include the trade 5 Revising presidential Decree in 2015: a. Presidential Regulation of the Republic of Indonesia No. 69/2015 concerning on The Exemption from Brief Visit Visa for 30 countries b. Presidential Regulation of the Republic of Indonesia No. 104/2015 concerning on The Exemption from Brief Visit Visa for 75 countries However, the new presidential decree only for leisure and holiday is not for visa-free entry for doing business. Although the new revised policy issued, the exemption for doing business for 15 countries as Presidential Decree No. 43/2011 still prevail. 6
9 openness as one of main variable that affect the number of tourists. Based on the profile of international tourists, tourists who visit Indonesia 29.78% visit for business rather than leisure/holiday 6. As shown in figure 3, export as part of trade openness, has considerable contribution to the GDP of Indonesia. The fluctuation of this contribution from 1994 until 2014 is affected by many economic and social conditions in Indonesia, such as the economic crisis 1998, Bali bombings in 2002 and 2005, Aceh tsunami in 2004; however, the share of the export sector remained 24% of the Indonesian GDP Figure 3. Share of Indonesian GDP (Expenditure Approach) in % Year Consumption Government expenditure Gross fixed capital formation Exports of goods and services Imports of goods and services Source: BPS (2015) The Ministry of Industry has grouped Indonesia s manufacturing into 31 sectors. The manufacturing sector makes the largest contribution to the sector of exportation 7. The two largest manufacturing export sectors are the palm oil processing sector, and iron metal, steel, machinery, automotive sector. Both sectors contributed more than 30% to the total manufacturing sectors in 2015 (Ministry of Industry, 2016). All 31 manufacturing commodities are exported to many countries around the world. The 30 main destination countries of Indonesia s manufacturing commodities are the USA, China, Japan, Singapore, India, Malaysia, Thailand, South Korea, the Netherlands, Australia, the Philppines, Germany, Vietnam, Taiwan, Saudi Arabia, the United Emirates, Pakistan, Italy, Hong Kong, the United 6 There are 5 reasons why tourists come to Indonesia: Holiday/Leisure, Business, Official Mission, Invention, and other. See appendix 2 Profile of International Tourist in Indonesia. 7 Ministry of Industry of Indonesia listing 31 manufacturing products. The trend of Manufacturing Sectors of Export put the the palm oil processing sector, and iron metal, steel, machinery, automotive sector as two largest commodities export from Indonesia. 7
10 of Kingdom, Spain, Bangladesh, Brazil, Egypt, Turkey, Switzerland, Belgium, France, Russia, and Mexico 8. Political, social and sporting events in a destination (e.g.. the threat of terrorism, political unrest, economy crisis) with respect to policy should be investigated as significant determinants of tourism (Lim, 1997). Based on Bruce Prideaux (2003), there are some events that disrupt the tourism industry; (1) trends, indicating a range of possible future trends that can be identified in the present and that, unless remedial action is taken, will cause some magnitude of disruption in the future; (2) crisis, including the financial crisis that happened in 1998, and terrorism, such as the Bali bombing; and (3) disasters, describing unpredictable catastrophic change that can normally only be responded to after the event, such as the Aceh tsunami. According to Chin-Hai Yang (2010), world heritage sites are significant enough to explain the number of international tourist, and they have a betterr tourist-enhancing effect. In the case of China, cultural rather than natural sites attract more interest for international tourists. According Li, Wu, & Cai (2008), although the World Heritage List resulted from an international agreement aimed at identifying, recognizing, and protecting those sites with global value, the World Heritage sites have become increasingly used as a tool for national tourism marketing campaigns. Dritsakis (2004) stated that tourist destinations have a prior concentration of tourism-related raw materials. These raw materials refer to a combination of natural, cultural, and man-made elements that are closely related to the demand for tourism. Among those factors, scenic spots included on the list of World Heritage Sites attract more global tourists. Since 1991, 8 sites in Indonesia have been recognized as Cultural and Natural World Heritage Sites. Those sites are Borobudur Temple Compounds, Prambanan Temple Compounds, Komodo National Park and Ujung Kulon National Park (listed in 1991), Sangiran Early Man Site (1996), Lorentz National Park (1999), Tropical Rainforest Heritage of Sumatra (2004) and the Subak System in Bali (2012) (UNESCO, 2015). 3. Recent Research and Conceptual Zhang and Jensen (2006) focused primarily in the income changes in the source countries, transportation cost, exchange rates. One of the benefits from this model is that it can capture for a short-run forecasting for the demand in the destination country. Other explanatory variables that affect tourism demand are the population, GDP, hotel capacity, FDI in hotels and restaurants, stock of FDI, trade openness, and PPP. Followed on Faruk Balli et.al (2013), tourism demand is determined by the total number of rooms in the destination country, distance between original and destination country, GDP, population of the source country, export, trade openness, visa, geographic characteristics (border, colony, common language, religion), and certain natural condition explanatory variables that determine tourism demand. Lim (1997) stated that income is the most crucial factor based on 100 published articles among tourism factors. Discretionary income is a subjective variable and that cannot be precisely measured. Song, Wong and Chon (2003) use the GDP in their study because data 8 Ministry of Industry of Indonesia listing the top 30 Export Destination Countries for Manufacturing Products. 8
11 tourist arrivals contain a relatively large proportion of business travelers (18-20%). Therefore, the proxy of GDP per capita was used to represent the income level of the source country. In this study, GDP per capita is utilized as a proxy for income. Phakdisoth and Kim (2007) stated that bilateral trade can reflect the source-destination economic relationship between Laos and origin countries, which has a positive impact on the number of international tourists. Trade openness can be measured by sum of trade in both countries. Kulendran and Wilson (2000) found the evidence for Interest and Awareness, where the international trade leads to international travel. Assuming that a larger population from the origin country leads to larger into the destination country, population can be considered a qualitative factor that influences decisions regarding international tourism (Lim, 1997). Zhang and Jensen (2006) stated that the size of destination countries can be controlled by using their population. Faruk Balli et al. (2013), Deluna and Jeon (2014) proved that population has a significantly effect on the number of tourists. Following the literature and using room availability in the destination country, the more rooms there are, the higher the capacity, and the more competitive the tourism sector (cheaper prices as a result of competition) (Seetanah, et al., 2011). Indeed infrastructure positively contributes to tourist arrivals, particularly from Europe/America and Asia. The most frequently used explanatory variable for the cost of goods and services that tourists are likely to pay in the destination country is measured by Consumer Price Index (CPI) (Lim, 1997). The CPI ratio is often adjusted for differences in the exchange rates of currencies between the origin and destination countries. Faruk Balli et al. (2013) adjusted the CPI of Turkey by the exchange rate of the USD, and found that the changes in the real exchange rate over time as well as the cross-sectional variation in travel costs affect the fluctuation of the number of tourists flowing to Turkey. Visa-free entry has been an important policy to attract a number of international tourists. However, research on this issues is still limited. Lawrence, Chong-Ki and Hak-Jun (2010) showed that visa-free entry from Korean to Japan was statistically significant with respect to the increase in the number of Korean tourist to Japan and receipts from the tourism sector. Faruk Balli et al. (2013) stated that the Turkish government has eliminated visa requirements for ordinary foreign visitors from many countries from Central and Northern Africa, Central and East Asia, the Middle East and Latin America. The results showed that the visa-waiving agreements have boosted tourist inflows to Turkey for regular citizens. Soap operas as export commodities from Turkey already boost the number of tourists flowing to Turkey (Faruk Balli et al., 2013). Each destination countries always offers a partially naturally determined and partially augmented or created tourism product, and the destination can be consumed in either raw or increasingly sophisticated forms through investments in created asset such as technology and infrastructure. This industry requires sophisticated technological inputs and adequate social planning to successful attract tourism (Zhang and Jensen, 2006). Bilateral variables that are widely used to model bilateral trade, investment and immigration volumes, such as sharing the same border, sharing the same language, and practicing the same religion. It shows that geographic characteristics are highly significant in facilitating an easier trip to Turkey (Faruk Balli et al, 2013). 9
12 Lim (1997) stated that destination attractiveness (climate, culture, history, and natural environment) influence the demand for international tourism. As one of attractiveness in culture and natural environment is world heritage. The World Heritage List from UNESCO has been used by many countries to promote tourism in their countries and to attract more tourists. Chin-hai Yang (2010), and Mimi, Bihu and Liping (2008) found that WHL used as tools for tourism campaigns, even though the accreditation of the WHL was meant to identify, recognize, and protect those sites with global value. This results shows that the WHL can positively boost attractiveness of tourism. In contrast, the results from Huang, Tsaur and Yang (2012) showed that there is no significant effect of WHL on promoting tourism other than possibly a short-run tourism enhancin impact. Furthermore, the promotion and design of WHL are more important for attracting more tourists (Wang, Yang, Wall, Xu, & Han, 2015). The 26 th December 2004 tsunami after the Indian Ocean earthquake was an undersea mega thrust earthquake that occurred at 00:58:53 UTC with an epicentre off the west coast of Sumatra, Indonesia. Because of this tsunami, almost over 250,000 people were killed. Kelman, Spence, Palmer, Petal, and Saito (2008) found that the nature of tourism after a disaster is important, when tourists travel to see disaster memorials or disaster sites. The returning international tourists aim to remember their experiences or the deceased. The threat of terrorism as a qualitative factor can affect the flow of tourists coming to a destination country (Lim, 1997). In 2002, a terrorist group exploded a large car bomb in a popular night club district in Kuta Beach Bali killing an estimated 190 people. The impact on the Indonesian economy will be determined by the success of the government in arresting perpetrators, eliminating terrorist cells and convincing the governments of Indonesia s major generating countries that security conditions have improved to the extent that adverse travel advisory warnings can be lifted (Bruce Prideaux, 2003). Crises can be described as the possible but unexpected result of management failures that are concerned with the future course of events set in motion by human action or inaction appreciating the event (Bruce Prideaux, 2003). The Asian financial crisis led to a rapid fall in the Indonesian rupiah, which affected the number of tourism arrivals. Transportation costs, which determine the number of tourist flows, are important for the transportation of tourist to destination countries. In Lim (1997), the transportation cost variable included the real economy airfare, real air travel cost, real average airfare, excursion airfare, cheapest airfare, distance, and real revenue per passenger-kilometer/mile of scheduled airfare. To measure the transportation cost variable (Song and Witt (2000) in Phakdisoth & Kim, 2007), we use distance as a proxy to capture geographical relationship between origin and destination countries (CEPII, 2016). 4. Methodology 4.1 Data A panel data set was employed for 20 origin countries for the period Based on the characteristic tourist that flows to Indonesia, it shows that business travel is the second reason for tourists to come to Indonesia. Given the finding of Wilson et al. (2001) regarding two-way Granger causality between international travel and international trade flows in the 10
13 case in China, this study uses 20 of the 30 of main destination countries of Indonesia s manufacturing commodities as the objects of study. Until the last Presidential Decree No.43/2011 the country that has visa-free entry (treatment group) from 20 countries are Singapore, Malaysia, Thailand, Philippines, and Hong Kong. The countries do not have visa-free entry as control group are China, USA, Japan, India, South Korea, Netherlands, Australia, Germany, Italy, United Kingdom, Spain, France, Pakistan, Bangladesh, Saudi Arabia. Figure 4.Share of International Tourist Arrivals by Country of Origin P e r c e n t a g e Source: BPS, 2015 Singapore offered the greatest contribution to the number inbound tourists to Indonesia during the period , with 22.41% of total arrivals, followed by Malaysia (12.41%), Japan (9.73%), Australia (8.85%), South Korea (4.26%), China (4.01%), the United States (3.30%), the United Kingdom (3.27%), Germany (2.89%), the Netherlands (2.37%), France (2.15%), Philippines (2.12%), India (1.60%), Thailand (1.14%), Italy (0.96%), Saudi Arabia (0.84%), Hong Kong (0.80%), Spain (0.53%), Pakistan (0.13%), Bangladesh (0.11%), and the rest of the world (16.10%). The number of inbound tourists from the observation countries represent 83.90% of total international visitors from The volume of inbound tourists from origin countries that flows to Indonesia as the dependent variable will be employed in the tourism demand model. International tourists that flow to Indonesia cover all foreign visitors directly arriving in Indonesia through airports, ports or land. Indonesia has 93 ports of entry, covering the whole area, which includes 65 ports, 24 airports and the rest through land. The four main airports are Soekarno-Hatta (Jakarta), Ngurah Rai (Bali), Polonia (Medan) and Sekupang (Batam) (BPS, 2016). Faruk Balli et al. (2013) employed factor inducing tourist demand such as accommodations, borders, colonization, common language, CPI, distance, GDP, population, religion, export of soap opera, trade, and visa policy. In supply-side factors of International tourism demand (Zhang & Jensen, 2006) explained that the support from natural endowments, technology, and infrastructure. Their study also employed annual income earned from tourists, 11
14 population, GDP per capita, hotel accommodations, FDI in hotel and restaurant sectors, stock of FDI, trade openness, and PPP to represent price competitiveness. Adapted to the geographical conditions of Indonesia, some independent variables must be adjusted to determine the determinants of inbound tourism flows to Indonesia. Such variables may include trade openness between Indonesia and the origin country (UNcomtrade, 2015), population of the origin country (Worldbank, 2015), accommodations (i.e., the number of hotels available in Indonesia; BPS, 70 Tahun Indonesia Merdeka, 2015), CPI of Indonesia (Worldbank, 2015), visa policy for entering Indonesia, palm oil sector exports (UNcomtrade, 2015), automotive sector (UNcomtrade, 2015), number world heritage sites, economy crisis in 1998, Aceh tsunami in 2004 (BNPB, 2015), distance between Indonesia and the origin country (CEPII, 2016), Bali bombing in 2001 (BNPB, 2015), and geographic factors (e.g., whether the same language, and religion are shared and whether there are neighboring borders) Method The proposed demand models for Inbound tourism demand for Indonesia is modified from the model of Faruk Balli et al (2013) as below: LogTourist ij, t Visa 0 1 ij, t βx l 1 l m 1 m ij, t (1) LotTourist Year VisaTreatment Year VisaTreatment φx ij, t l m l 1 m 1,where Visaij,t is treatment variable of visa-free policy, X is control variable vector which includes GDP in counterpart countries, population in counterpart countries, accommodation in Indonesia, CPI in Indonesia, exports of palm oil, automotive related products and trade openness of bilateral trade between Indonesia and counterpart countries. α is dummy variables for some events in Indonesia such as registration of Indonesia s World Heritage sites to UNESCO, bombing in Bali in 2002 and 2005 and Tsunami in Aceh in 2004 and Economy Crisis, γ is the similarity of geographic characteristics between Indonesia and origin countries such as distance, language and religion 10. Year is dummy variable which visa-free entry policy issued in 2003 and then this is one after 2003 and zero before Visa Treatment is dummy variable for holding visa-free entry between Indonesia and counterpart countries. Model (1) is fixed effects model (FEM) and model (2) is difference-in-difference model (DID). (2) u ij, t Table 2. Descriptive Statistics 9 a. Faruk Balli et al. (2013) stated that GDP, Trade, Accommodation, CPI, Visa-free entry, Soap opera export, geographical characteristic influence the number of tourist arrivals in Turkey. b. Jie Zhang et al. (2006) stated that GDP, Trae, Population, Accommodation, FDI are significantly affected the number of tourist arrivals. 10 These geographic dummy variables are omitted in actual estimation below. 12
15 Variable Observation Mean Std. Dev. Min Max Number of Inbound Tourist in Indonesia , ,10 964, ,00 GDP Per Capita of the Source Country , ,69 323, ,25 Population Level of the Source Country , , , ,00 Accommodations in Indonesia , , , ,00 Trade , ,37 0, ,60 CPI of Indonesia ,23 36,13 12,65 124,39 Palm Oil Sector ,26 426,33 0, ,60 Automotive Sector ,49 710,84 0, ,11 Visa 500 0,10 0, Heritage Sites in Indonesia 500 5,80 1, DBali Bombing 500 0,08 0, DAceh Tsunami 500 0,04 0, DEconomic Crisis 500 0,04 0, DReligion 500 0,20 0, DLanguage 500 0,10 0, Distance , ,38 886, ,12 DRegions 500 0,30 0, Notes: dependent variable, Tourist ij,t is the number of tourist flows from origin countries (i) to Indonesia (j). GDP i,t is Real GDP per capita of the origin country (i) (constant 2005) in thousands of USD. Trade ij,t, is Trade value (exports + imports) between Indonesia and 20 export destination countries in billions of USD. Population i,t is Population level of the source country (in thousand). Accomodation j,t, is total number of the rooms in hotels available in Indonesia. Automotive ij,t, is Exports of the Iron Metal and Steel, Machinery, and Automotive sector from Indonesia to 20 Countries in millions of USD, the total number of product from the iron metal, steel, machinery and automotive sector is 2599 products, in 6 digits of HS. CPI j,t is relative CPI of Indonesia adjusted to USD. Visa ij,t is Binary variable that takes the value of 1 if ordinary passport holders from 20 countries are able to enter to Indonesia without any visa requirements and 0 otherwise. PalmOil ij,t is Exports of the Palm Oil Processing sector from Indonesia to 20 Countries in millions of USD, the total number of products from the palm processing sector is 58 products, in 6 digits of HS. WorldHeritage j,t is Indonesia s World Heritage sites from UNESCO. Distance ij is Physical distance between the capital city of source country (i) to Indonesia (j) (in kilometers). Bali Bombing is Dummy variable for the Bali bombing,aceh Tsunami is Dummy Variable for the Aceh tsunami, and Economic Crisis are Dummy Variable for the Economic Crisis that happen in Indonesia. Region is Dummy Variable for the Neighboring Region Countries of Indonesia. Language is Dummy Variable for almost 70% of the population practicing the same language as Indonesia. Religion is Dummy Variable for almost 70% of the population practicing the same religion as Indonesia. 5. Empirical Result Following the earlier literature, the number of inbound tourist in Indonesia as the dependent variable, Touristij,t is the natural logarithm of the number tourist flows from origin countries (i) to Indonesia (j). Treatment variable, Visaij,t is binary variable that takes the value of 1 if ordinary passport holders from 20 countries are able to enter to Indonesia without any visa requirements and 0 otherwise. Vector X include GDPi,t are Real GDP per capita, 13
16 Accomodationj,t,, total number of the rooms in hotels available in Indonesia., Populationi,t, population level of the source country (in thousand) in logaritimic terms, respectively. Tradeij,t, is Trade value between Indonesia and 20 export destination countries in billions of USD. Automotiveij,t, is Exports of the Iron Metal and Steel, Machinery, and Automotive sector from Indonesia to 20 Countries in millions of USD. CPIj,t is relative CPI of Indonesia adjusted to USD. PalmOilij,t is Exports of the Palm Oil Processing sector from Indonesia to 20 Countries in millions of USD. World Heritagej,t is Indonesia s World Heritage sites from UNESCO. Bali Bombing is Dummy variable for the Bali bombing that happen in 2002 and Aceh Tsunami is Dummy Variable for the Aceh tsunami in Economic Crisis is Dummy Variable for the Economic Crisis in Distanceij is Physical distance between the capital city of source country (i) to Indonesia (j) (in kilometers). Region is Dummy Variable for the Neighboring Region Countries of Indonesia. Language is Dummy Variable for almost 70% of the population practicing the same language as Indonesia. Religion is Dummy Variable for almost 70% of the population practicing the same religion as Indonesia. Panel data from 20 countries for the period were analyzed to find the factor that influence the number of inbound tourist arrivals in Indonesia. An appropriate model was needed for unbiased estimation. For the Breusch and Pagan Lagrangian Multiplier Test, the null hypothesis (H0) of this test is OLS, while H1 is a Random Effect Model (REM). If the p- value of the Chi-Square statistic is significant (< 5%), the null hypothesis can be rejected. Such a result shows that the Random Effect Model is a better model than the OLS. This study uses the REM. However, if the Hausman test suggests that FEM is more appropriate than REM, FEM will be used in this research. Table 3. Hausman and Pagan Test Breusch and Pagan Lagrangian Multiplier Test Hausman Test Var(u) = 0 chi2(9) = (b-b)'[(v b-v_b)^(-1)](b-b) chibar2(01) = Prob > chibar2 = Prob>chi2 = The results of the Breusch and Pagan Lagrangian Multiplier Test in Table 5 shows that the Chi-square statistic is significant (p-value < 5%); therefore, the null hypothesis H0 can be rejected, and H1 is accepted; the REM model is better than the OLS model. The further test is the Hausman Test, and the p-value is <0.05; therefore, instead of REM, it is more appropriate to choose FEM. Thus, FEM is employed. The best model has been selected, and the estimation for Equation 1 can be accomplished with the Fixed-effect method. The results for simultaneous data for FEM is presented in Table 6 below. To show the difference for country characteristics effect that vary over time will influence the number of tourist arrivals, with the differences across countries that have same influence on tourist arrivals. The data for geographical characteristics reflect time-invariant variables. Even though those variables are omitted, in the FEM, all the stable characteristics of the individual observations have already been controlled for. In 2014, visa-free entry policy only covers for 15 countries. From 20 countries observation only 5 countries have visa-free entry. The impact of visa-free entry for each 14
17 country will affect differently. Thus, to see the difference impact of each country because they have their own characteristics, fixed-effect model is appropriate to estimate the model. Table 4. Estimation Results for Aggregate Data (1) FEM (2) DID Visa * (0.0586) Year * (0.0527) VisaTreatment_Year ** (0.0623) LogGDPi *** (0.4086) *** (0.4022) LogPopulationi (0.8055) (0.8217) LogAccomodationj *** (0.3451) ** (0.3719) CPI *** (0.0012) * (0.0016) Bombbali (0.0307) (0.0372) Tsunami (0.052) *** (0.1228) Economic Crisis (0.0309) (0.0311) PalmOil ( ) ( ) Automotive ** ( ) *** ( ) Trade *** ( ) *** ( ) Herritage ** (0.1027) (0.0091) _cons ** (3.7484) ** (3.8383) N Note: ***, **, and * denote that the coefficients are significant at 1%, 5%, and 10% statistical level, respectively. Robust standard errors are reported in parentheses. See Table 1 for the variable definitions. Dependent variable: the logarithm of the number of tourist flows from origin countries to Indonesia. Year in DID estimation is dummy variable for before 2003 and after 2003 which visa-free entry policy issued. Visa Treatment as variable for treatment group country and control group country for country that hold visa-free entry. Visa treatment as timeinvariant variable will be omitted. Regarding additional information to see the difference for including time-fixed dummy variable for whole period from , see in the appendix N means observation numbers. The results for the simultaneous estimation data based on Fixed-effect model can be described as follows; the new visa-free entry policy issued in 2003 that was gradually revised until 2014 has had significant impact in increasing international tourism. Faruk Balli et al (2013) stated that visa-free entry policy has boost the number of tourist arrivals to Turkey. The visa-free entry policy has increased the number of international tourist by about 10.44%. Other control variables that control the number of tourist arrivals such as GDP per capita affects international tourist arrivals by , meaning that if the GDP per capita the in origin country increases by 1%, the visitor arrivals increase by 2.3%. This value is line with expected sign: if the GDP per capita increases in the origin country, tourist will have more money to spend. The high coefficient of GDP per capita implies that the inbound visitors to Indonesia are income elastic. As a result, it can be considered that tourism demands in Indonesia are dependent on the economic situation of the origin country. There is not enough evidence to say that the population of the origin country will significantly affect the number of inbound tourist arrivals 11 See appendix 3 Fixed Effect Model Estimation including time-fixed effect, and excluding year dummy of Bali bombings, Aceh tsunami, and economic crisis 12 See appendix 4 Random-effect Model Estimation including time-fixed effect, and excluding year dummy of Bali bombings, Aceh tsunami, and economic crisis 15
18 in Indonesia. Regarding the amount of infrastructure adjusted for the number of room of Hotel in Indonesia, the increasing every 1% number of room will increase tourist %. The change in Indonesia prices significantly affects the number of tourist arrivals in Indonesia. An increase of 1 unit of prices will decrease the number of tourist arrivals by 0.45%. In line with law of demand, whenever the price rises, it will make demands fall. There is not enough evidence to say that Bali bombings in 2002 and 2005 have significantly affected the inbound tourism demand. Although the Aceh tsunami happened in the end of the year in 2004, the impact of tourist arrival measured in However, from the estimation we do not have enough evidence to say that the Aceh tsunami in 2004 will significantly affect the number of tourist arrivals. Economic crises that happened in 1998, it does not give enough evidence to say that this crises will significantly affect the number of tourist arrivals. The export of palm oil sector to the origin countries does not significant effect on the tourist demand in Indonesia. The increasing number of palm oil sector to the origin countries, does not give enough evidence for affecting tourist arrivals. Export the automotive commodities from Indonesia to origin countries significantly affecting the number of tourist arrivals. The increasing each 1 unit of the automotive commodities sector will increase the number of tourist 0.006%. Trade openness between Indonesia and origin countries significantly increases the number of tourist arrivals. Every increase 1 unit of trade openness for Indonesia and origin countries will increase tourist arrivals by 0.004%. This result regarding a positive relation between trade openness and international tourist demand is in line with those of Kulendran & Wilson (2000), and Shan & Wilson (2001). The visa-free entry for other reason except leisure, for business in 15 countries encourages the number of tourist arrivals. As expected, the increase in the number of heritage sites in Indonesia will attract more people to enjoy the beauty of the natural/cultural sites, in line with Chin-hai Yang et al. (2010). However, the increase in the number of heritage sites in Indonesia significantly decreasing on tourist demand. Wang, Yang, Wall, Xu, & Han (2015) argue that the promotion of heritage sites leads to more awareness of the acquisition of world heritage sites. 16
19 The long-run impact of direct visa-free entry policy has been estimated a using Difference-in-Differences approach. After the visa-free entry policy was issued, in long-term effect has been a significantly positive increase in the number of tourist arrivals. The strong impact of the policy is the same regardless of whether a Fixed-effect model or Difference-in- Differences approach is used. The robust results show that visa-free entry policy increased the number of inbound tourist arrivals 13. The results from Fixed-effect model, and Difference-in- Differences have different significant level for some variables. It shows that the data is not robust, the significant variables weakly supported by data. Therefore, further research regarding impact on visa-free entry policy need to be continuing. Based on the Persistence and Reputation effect, Naudee & Sayman (2005) (in Faruk Balli and Cebeci, 2013) and H. Song et al. (2003) measured the stable behavior pattern in international tourist demand. The pattern of tourism expectation and habit persistence (stable behavior patterns) is usually incorporated in tourism demand models through of a laggeddependent variable. Once people have been on holiday to a particular destination and liked it, they tend to return visiting the same country again in the next year, to avoid the risk of ruining their holiday by visiting unknown places. The results from a dynamic panel data analysis show that 64.47% of total tourist arrivals reflect returns to the country after an experience from the previous year Conclusion and Policy Implication 6.1 Conclusion The number of inbound tourist arrivals in Indonesia is determined by the GDP of the origin country, number of accommodation in Indonesia, trade openness, exports of automotive sector, CPI of Indonesia, number of heritage sites in Indonesia, and visa-free entry. There is not enough evidence to say that the population levels of origin country, exports form the palm oil, Bali bombings, Aceh tsunami, economic crisis in Indonesia determine the number of international arrivals in Indonesia. The visa-free entry policy seems to be good policy to boost the number of tourist arrivals. The results show a significant effect between the periods before policy was issued in 2003 and after the policy was issued in period Although only 5 of 12 countries were included in the free-visa policy until 2014, the impact of increasing tourism is significant. The visa-policy has significant and positive coefficient ( SE of ) with respect to the number of tourist arrivals, suggesting an increase in tourist flows from the source country where visa requirements have recently been waived for regular citizens. The observation on countries was only until 2014, and the number of countries with visa-free entry already increased in Therefore, future research needs to focus more on the policy of visa-free entry, as the government intends to expand the number of countries that have visa-free entry in Difference-in-difference model is used to see the impact of before and after policy. Visa_Treatment as binary variable which is 1 for a group of country that have visa-free entry, otherwise is 0. Year variable as year before 2003 and after policy was applied. 14 See appendix 4 Dynamic Panel Data Estimation. 17
20 Further research regarding the impact of visa-free entry for business needs to be concerned. 15 countries that have visa-free entry for business have more advantage than other countries that do not have visa-free entry for doing business in Indonesia. The estimation results using fixed-effect model, difference-in-differences, and dynamic panel data have different significant level for some variables. It shows that the data is not robust. The significant level of some variables is weakly supported data. Therefore, further research regarding the impact on visa-free entry policy need to be continuing. 6.2 Policy Implications The positive impacts of visa-free entry policy still needs to be increased by expand the number of countries with visa-free entry to Indonesia. Indeed, even though there were only 5 of 12 countries with visa-free entry until 2014, the impact of the policy succeeded in increasing the number of international tourists. Therefore, the Indonesian government needs to revise the visa-free entry policy and increase the number of countries with visa-free entry to increase the number of tourist arrivals. Visa-free entry for doing business that only allow for 15 countries including some South East Asia countries, need to be expand more. It will give benefit for trade and tourism sector. As tourists are one of the main sources of foreign exchange, the government of Indonesia should cooperate with all stakeholders, to innovate on new kinds of promotion that will effectively attract visitors from other countries. REFERENCES Baltagi, B. H. (2005). Econometric Analysis of Panel Data. West Sussex: John Wiley & Sons Ltd. BNPB. (2015, November 25). Badan Nasional Penanggulangan Bencana. Retrieved from Data dan Informasi Bencana Indonesia: Bo Peng, H. S. (2014). A meta-analysis of international tourism demand forecasting and implications for practice. Tourism Management. BPS. (2015, August). 70 Tahun Indonesia Merdeka. 70 Tahun, p BPS. (2015). Biro Pusat Statistik Indonesia. Retrieved May 23, 2016, from BPS. (2016, Juni 26). Biro Pusat Statistik Republik Indonesia. Retrieved from Biro Pusat Statistik: accordion-daftarsubjek2 18
21 Bruce Prideaux, E. L. (2003). Events in Indonesia: exploring the limits to formal tourism trends forecasting methods in complex crisis situations. Tourism Management, Vol. 24, CEPII. (2016, June 28). Retrieved from The CEPII gravity dataset: Chin-hai Yang, H.-l. L.-C. (2010). Analysisi of international tourist arrivals in China: The role of World Heritage Sites. Tourism Management, Vol. 31, Deluna, R., & Jeon, N. (2014). Determinants of International Tourism Demand for the Philippines: An Augmented Gravity Model Approach. Munich Personal RePEc Archive. Dritsakis, N. (2004). Cointegration analysis of German and British tourism. Tourism Management, Vol.25, Faruk Balli, H. O. (2013). Impacts of exported Turkish soap operas and visa-free entry on inbound tourism to Turkey. Tourism Management, Vol. 37, Hsiao, C. (1986). Analysis of panel data. New York: Cambridge University Press. Huang, C.-H., Tsaur, J.-R., & Yang, C.-H. (2012). Does worl heritage list really induce more tourists? Evidence from Macau. Tourism Management, Vol.33, Kelman, I., Spence, R., Palmer, J., Petal, M., & Saito, K. (2008). Tourists and disasters: lessons from the 26 December 2004 tsunamis. Journal of Coastal Conservation, Vol. 12, Kulendran, N., & Wilson, K. (2000). Is there a arelationship between international trade and international travel? Applied Economics, Lawrence, J., Chong-Ki, L., & Hak-Jun, S. (2010). The Impact of Visa-free Entry on Outbound Tourism: A Case Study of South Korean Travellers Visiting Japan. Tourism Geographies, Vol. 12, No. 2, Lim, C. (1997). Review of international tourism demand models. Annals of Tourism Research, Vol.24, Mimi, L., Bihu, W., & Liping, C. (2008). Tourism development of World Heritage Sites in China: A geographic perspective. Tourism Management, Vol. 29, Ministry of Industry of Indonesia. (2016). Ministry of Industry of Indonesia. Retrieved April 14, 2016, from Ministry of Law and Human Rights of Indonesia. (2015, November 6). Ditjen Imigrasi Republik Indonesia. Retrieved from Ministry of Tourism and Economy Creative. (2015). Kementerian Pariwisata Republik Indonesia. Retrieved November 16, 2015, from 19
22 Phakdisoth, L., & Kim, D. (2007). The Determinants of inbound tourism in Laos. ASEAN Economic Bulletin Vol. 24, Seetanah, B. (2010). Assessing the dynamic economic impact of tourism for island economies. Annals of tourism research, vol. 38, Seetanah, B., Juwaheer, T., Lamport, M., Rojid, S., Sannassee, R., & Subadar, A. (2011). Does Infrastructure Matter in Tourism Development? University of Mauritius Research Journal, Vol.17, Shan, J., & Wilson, K. (2001). Causality between trade and tourism: empirical evidence from China. Applied Economics Letters, Song, H., Wong, K., & Chon, K. (2003). Modelling and forecasting the demand for Hong Kong tourism. Hospitality Management, Vol.22, Tsui, W. H., & Fung, M. K. (2016). Causality between business travel and trade volumes: Empirical evidence from Hong Kong. Tourism Management, Vol.52, UNcomtrade. (2015, November 12). United Nations. Retrieved from UN Comtrade Database: UNESCO. (2015). United Nations Educational, Scientific and Cultural Organization. Retrieved November 24, 2015, from UNWTO. (1995). Concepts, Definitions, and classifications for Tourism Statistics. World Tourism Organization, 21. UNWTO. (2015). Methodological Notes to The Tourism Database. Madrid, Spain: World Tourism Organization. UNWTO. (2015). Tourism Highlights Wang, Z., Yang, Z., Wall, G., Xu, X., & Han, F. (2015). Is it better for a tourist destination to be a World Heritage Site Visitors' perspectives on the inscription of Kanas on the World Heritage List in China. Journal for Nature Conservation, Vol.23, Worldbank. (2015, November 11). The World bank. Retrieved from The World Bank Data: Zhang, J., & Jensen, C. (2006). Comparative Advantage Explaining Tourism Flows. Annals of Tourism Research, Vol. 34,
23 APPENDIX Appendix 1. Rank of Indonesia Tourism Sector Rank Value Value Value Value Commodi Commoditi Commodities (Million Commodities (Million (Million (Million ties es US$) US$) US$) US$) 1 Crude oil 41, Crude oil 36, Crude oil 32, Crude oil 32, Coal 27, Coal 26, Coal 24, Coal 20, Crude Palm Crude Palm Crude Crude 17, , , Oil Oil Palm Oil Palm Oil 17, Rubber and Rubber and 14, , Tourism 10, Tourism Products Products 11, Tourism 8, Tourism 9, Rubber and 9, Garment Products 7, Garment 7, Garment 7, Garment 7, Rubber and 7 Electronics 7, Electronics 6, Textile 5, Textile 5, Food products Chemical Materials and product Pulp and Paper products Wood products 4, , , , Food products Pulp and Paper products Chemical Materials and product Wood products Source: Ministry of Tourism and Economy Creative, 2015 Electronic s Food products 6, Products 7, Food products 6, , Electronics 5, Textile 5, Textile 3, , , Pulp and Paper products Wood products Chemical Materials and product 3, , , , , Wood products 3, Chemical Materials and product 3, Pulp and Paper products 3,780.00
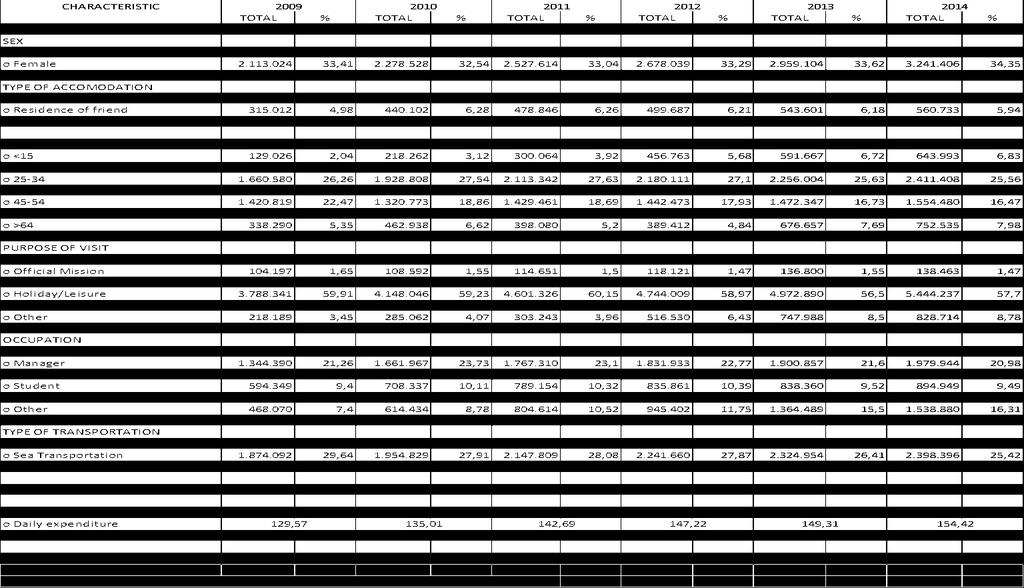
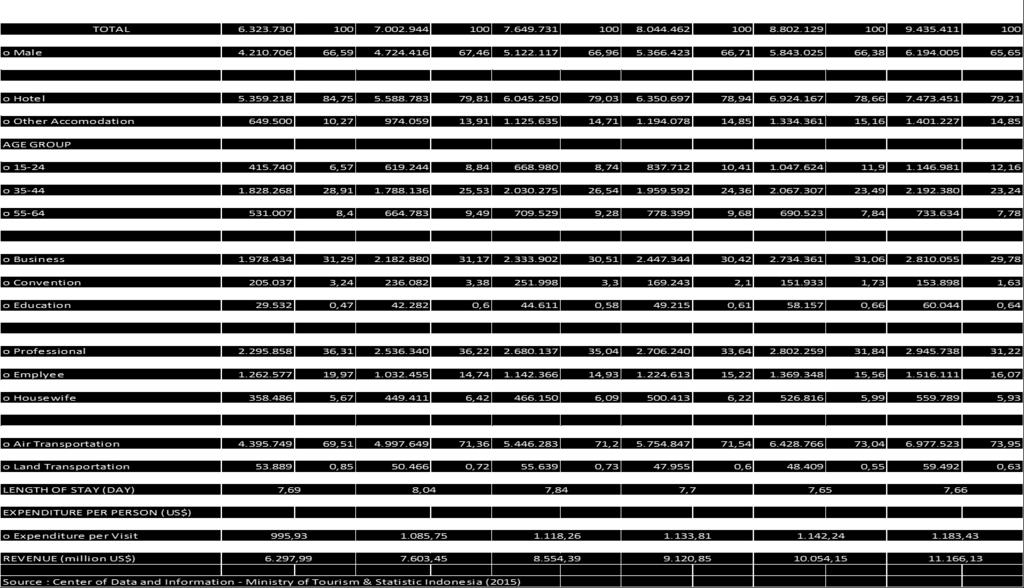
24 Appendix 2. International Tourist Profile
Charting Indonesia s Economy, 1H 2017
 Charting Indonesia s Economy, 1H 2017 Designed to help executives interpret economic numbers and incorporate them into company s planning. Publication Date: January 3 rd, 2017 Next Issue: To be published
Charting South Korea s Economy, 1H 2017
 Charting South Korea s Economy, 1H 2017 Designed to help executives interpret economic numbers and incorporate them into company s planning. Publication Date: January 3 rd, 2017 Next Issue: To be published
KINGDOM OF CAMBODIA NATION RELIGION KING 3 TOURISM STATISTICS REPORT. September 2010
 KINGDOM OF CAMBODIA NATION RELIGION KING 3 TOURISM STATISTICS REPORT September 2010 MINISTRY OF TOURISM Statistics and Tourism Information Department No. A3, Street 169, Sangkat Veal Vong, Khan 7 Makara,
CHINA INTERNATIONAL INBOUND TRAVEL MARKET PROFILE (2015) 2015 U.S. Travel Association. All Rights Reserved.
 2015 U.S. Travel Association. All Rights Reserved.") CHINA INTERNATIONAL INBOUND TRAVEL PROFILE (2015) 2015 U.S. Travel Association. All Rights Reserved. SUMMARY China is one of the fastest-growing inbound travel markets to the United States; it is consistently
CHINA INTERNATIONAL INBOUND TRAVEL PROFILE (2015) 2015 U.S. Travel Association. All Rights Reserved. SUMMARY China is one of the fastest-growing inbound travel markets to the United States; it is consistently
Charting Cambodia s Economy
 Charting Cambodia s Economy Designed to help executives catch up with the economy and incorporate macro impacts into company s planning. Annual subscription includes 2 semiannual issues published in June
Charting Singapore s Economy, 1H 2017
 Charting Singapore s Economy, 1H 2017 Designed to help executives interpret economic numbers and incorporate them into company s planning. Publication Date: January 3 rd, 2017 Next Issue: To be published
Charting Philippines Economy, 1H 2017
 Charting Philippines Economy, 1H 2017 Designed to help executives interpret economic numbers and incorporate them into company s planning. Publication Date: January 3 rd, 2017 Next Issue: To be published
KINGDOM OF CAMBODIA NATION RELIGION KING 3 TOURISM STATISTICS REPORT. March 2010
 KINGDOM OF CAMBODIA NATION RELIGION KING 3 TOURISM STATISTICS REPORT March 2010 MINISTRY OF TOURISM Statistics and Tourism Information Department No. A3, Street 169, Sangkat Veal Vong, Khan 7 Makara, Phnom
International Journal of Humanities & Applied Social Sciences (IJHASS)
") Governance Institutions and FDI: An empirical study of top 30 FDI recipient countries ABSTRACT Bhavna Seth Assistant Professor in Economics Dyal Singh College, New Delhi E-mail: bhavna.seth255@gmail.com
Governance Institutions and FDI: An empirical study of top 30 FDI recipient countries ABSTRACT Bhavna Seth Assistant Professor in Economics Dyal Singh College, New Delhi E-mail: bhavna.seth255@gmail.com
Charting Australia s Economy
 Charting Australia s Economy Designed to help executives catch up with the economy and incorporate macro impacts into company s planning. Annual subscription includes 2 semiannual issues published in June
Chapter 5: Internationalization & Industrialization
 Chapter 5: Internationalization & Industrialization Chapter 5: Internationalization & Industrialization... 1 5.1 THEORY OF INVESTMENT... 4 5.2 AN OPEN ECONOMY: IMPORT-EXPORT-LED GROWTH MODEL... 6 5.3 FOREIGN
Tourism Highlights International Tourist Arrivals, Average Length of Stay, Hotels Occupancy & Tourism Receipts Years
 KINGDOM OF CAMBODIAA NATION RELIGION KING 3 TOURISM STATISTICS REPORT Oct tober 2013 MINISTRY OF TOURISM Statisticss and Tourism Information Department No. A3, Street 169, Sangkat Veal Vong, Khann 7 Makara,
BBVA EAGLEs. Emerging And Growth Leading Economies Economic Outlook. Annual Report 2014 Cross-Country Emerging Markets, BBVA Research March 2014
 BBVA EAGLEs Emerging And Growth Leading Economies Economic Outlook Annual Report 2014 Cross-Country Emerging Markets, BBVA Research March 2014 Index Key takeaways in 2013 Rethinking EAGLEs for the next
Determining factors of inbound travel to Japan A stronger yen matters more for the NIEs than China
 Mizuho Economic Outlook & Analysis February 19, 216 Determining factors of inbound travel to Japan A stronger yen matters more for the NIEs than < Summary > To analyze the sustainability of inbound travel
Trans-Pacific Trade and Investment Relations Region Is Key Driver of Global Economic Growth
 Trans-Pacific Trade and Investment Relations Region Is Key Driver of Global Economic Growth Background The Asia-Pacific region is a key driver of global economic growth, representing nearly half of the
Competitiveness and Value Creation of Tourism Sector: In the Case of 10 ASEAN Economies
 Competitiveness and Value Creation of Tourism Sector: In the Case of 10 ASEAN Economies Apirada Chinprateep International Science Index, Economics and Management Engineering waset.org/publication/10003096
Analysis of China s Import from & Direct Investment in ASEAN Based on Gravity Models
 Technology and Investment, 2013, 4, 13-21 http://dx.doi.org/10.4236/ti.2013.41003 Published Online February 2013 (http://www.scirp.org/journal/ti) Analysis of China s Import from & Direct Investment in
STUDENT VISA HOLDERS WHO LAST HELD A VISITOR OR WHM VISA Student Visa Grant Data
 STUDENT VISA HOLDERS WHO LAST HELD A VISITOR OR WHM VISA 2013-14 Student Visa Grant Data Over 40,000 or 14% of all student visa grantees in 2013-14 last held a visitor or WHM visa Visa grants by sector
Determinants of International Migration
 1 / 18 Determinants of International Migration Evidence from United States Diversity Visa Lottery Keshar M Ghimire Temple University, Philadelphia. DEMIG Conference 2014, Oxford. Outline 2 / 18 Motivation/objective
Human Development Index: Enhancing Indonesian Competitiveness in ASEAN Economic Community (AEC)
") Human Development Index: Enhancing Indonesian Competitiveness in ASEAN Economic Community (AEC) Wilson Bangun Faculty of Economics, Maranatha Christian University, Indonesia Jl. Taman Saturnus 1 No. 14,
Human Development Index: Enhancing Indonesian Competitiveness in ASEAN Economic Community (AEC) Wilson Bangun Faculty of Economics, Maranatha Christian University, Indonesia Jl. Taman Saturnus 1 No. 14,
International Education in the Comox Valley: Current and Potential Economic Impacts
 International Education in the Comox Valley: Current and Potential Economic Impacts FINAL REPORT March 2012 Prepared by: Vann Struth Consulting Group Inc. Vancouver, BC www.vannstruth.com Prepared for:
Discussion Papers In Economics And Business
 Discussion Papers In Economics And Business Benefit and Cost of Visa relaxation -Empirical Analysis on the Impact of Visa waiver- Tsuyoshi Goto and Nobuo Akai Discussion Paper 17-10 Graduate School of
CHILE NORTH AMERICA. Egypt, Israel, Oman, Saudi Arabia and UAE. Barge service: Russia Federation, South Korea and Taiwan. USA East Coast and Panama
 EUROPE Bulgaria, Greece, Italy, Netherlands and Turkey Belgium, Denmark, France, Germany, Malta, Netherlands, Poland, Slovenia, Spain and UK Belgium, Germany, Gibraltar, Greece, Italy, Malta, Netherlands,
Global Trends in Location Selection Final results for 2005
 Global Business Services Plant Location International Global Trends in Location Selection Final results for 2005 September, 2006 Global Business Services Plant Location International 1. Global Overview
Assessing Barriers to Trade in Education Services in Developing ESCAP Countries: An Empirical Exercise WTO/ARTNeT Short-term Research Project
 Assessing Barriers to Trade in Education Services in Developing ESCAP Countries: An Empirical Exercise WTO/ARTNeT Short-term Research Project Ajitava Raychaudhuri, Jadavpur University Kolkata, India And
Value Creation of Tourism Sector: In the case of 10 ASEAN Economies, applies to Jamaica
 1 Value Creation of Tourism Sector: In the case of 10 ASEAN Economies, applies to Jamaica Apirada Chinprateep, School of Development Economics National Institute of Development Administration Bangkok,
Mizuho Economic Outlook & Analysis
 Mizuho Economic Outlook & Analysis The 18th Questionnaire Survey of Japanese Corporate Enterprises Regarding Business in Asia (February 18) - Japanese Firms Reevaluate China as a Destination for Business
An Empirical Analysis of Pakistan s Bilateral Trade: A Gravity Model Approach
 103 An Empirical Analysis of Pakistan s Bilateral Trade: A Gravity Model Approach Shaista Khan 1 Ihtisham ul Haq 2 Dilawar Khan 3 This study aimed to investigate Pakistan s bilateral trade flows with major
The Gravity Model on EU Countries An Econometric Approach
 European Journal of Sustainable Development (2014), 3, 3, 149-158 ISSN: 2239-5938 Doi: 10.14207/ejsd.2014.v3n3p149 The Gravity Model on EU Countries An Econometric Approach Marku Megi 1 ABSTRACT Foreign
Emerging Market Consumers: A comparative study of Latin America and Asia-Pacific
 Emerging Market Consumers: A comparative study of Latin America and Asia-Pacific Euromonitor International ESOMAR Latin America 2010 Table of Contents Emerging markets and the global recession Demographic
The Relationship of Thailand Tourism Demand and Supply towards Direct and Indirect Economic Determinants
 The Relationship of Thailand Tourism Demand and Supply towards Direct and Indirect Economic Determinants Presented by Etaya Rattanacheevorn Student ID: 538 57112 29 Master of Arts in Labor Economics and
Proliferation of FTAs in East Asia
 Proliferation of FTAs in East Asia Shujiro URATA Waseda University and RIETI April 8, 2005 Contents I. Introduction II. Regionalization in East Asia III. Recent Surge of FTAs in East Asia IV. The Factors
General Directorate for Economic and Cultural Promotion and Innovation. General Director, Mr. Vincenzo de Luca
 General Directorate for Economic and Cultural Promotion and Innovation General Director, Mr. Vincenzo de Luca STEERING COMMITTEE MINISTRY OF FOREIGN AFFAIRS CO-CHAIRED MINISTRY FOR ECONOMIC DEVELOPMENT
05 Remittances and Tourism Receipts
 5 Remittances and Tourism Receipts 58 n Economic Integration Report 217 Remittances and Tourism Receipts Remittance Flows to Remittances are an important and stable source of external finance. Along with
The BIGGEST in South East Asia!
 The BIGGEST in South East Asia! FACTS : 1. Total area (including EEZ): around 7.9 million km 2 2. In a strategic location along major sea lanes from Indian Ocean to Pacific Ocean 3. The world s fourth
Does Korea Follow Japan in Foreign Aid? Relationships between Aid and FDI
 Does Korea Follow Japan in Foreign Aid? Relationships between Aid and FDI Japan and the World Economy (Forthcoming) Sung Jin Kang, Korea Univ. Hongshik Lee, Korea Univ. Bokyeong Park, KIEP 1 Korea and
International Travel to the U.S.
 University of Massachusetts Amherst ScholarWorks@UMass Amherst Travel and Tourism Research Association: Advancing Tourism Research Globally 2013 Marketing Outlook Forum - Outlook for 2014 International
GENDER EQUALITY IN THE LABOUR MARKET AND FOREIGN DIRECT INVESTMENT
 THE STUDENT ECONOMIC REVIEWVOL. XXIX GENDER EQUALITY IN THE LABOUR MARKET AND FOREIGN DIRECT INVESTMENT CIÁN MC LEOD Senior Sophister With Southeast Asia attracting more foreign direct investment than
APPENDIXES. 1: Regional Integration Tables. Table Descriptions. Regional Groupings. Table A1: Trade Share Asia (% of total trade)
") 1: Regional Integration Tables The statistical appendix is comprised of 10 tables that present selected indicators on economic integration covering the 48 regional members of the n Development Bank (ADB).
1: Regional Integration Tables The statistical appendix is comprised of 10 tables that present selected indicators on economic integration covering the 48 regional members of the n Development Bank (ADB).
Monthly Inbound Update June th August 2017
 Monthly Inbound Update June 217 17 th August 217 1 Contents 1. About this data 2. Headlines 3. Journey Purpose: June, last 3 months, year to date and rolling twelve months by journey purpose 4. Global
2010/SOM1/EC/WKSP/004 Session 1. Starting a Business. Submitted by: World Bank
 2010/SOM1/EC/WKSP/004 Session 1 Starting a Business Submitted by: World Bank Workshop on Reducing Start-up and Establishment Time of Businesses Hiroshima, Japan 1-2 March 2010 Starting a Business : Asia
Asia-Pacific to comprise two-thirds of global middle class by 2030, Report says
 Strictly embargoed until 14 March 2013, 12:00 PM EDT (New York), 4:00 PM GMT (London) Asia-Pacific to comprise two-thirds of global middle class by 2030, Report says 2013 Human Development Report says
ARANGKADA PHILIPPINES 2010: A BUSINESS PERSPECTIVE. Figure 10: Share in world GDP,
 Living in the High Growth Neighborhood The Philippines is located in the world s fastest growing region. Figure 10 shows that the ASEAN-6 plus 4 (China, India, Japan, and Korea) in 2009 had about the same
Economic Development: Miracle, Crisis and Regionalism
 Economic Development: Miracle, Crisis and Regionalism Min Shu School of International Liberal Studies Waseda University 18 Dec 2017 IR of Southeast Asia 1 Outline of the Lecture Southeast Asian economies
How the world views Britain 2017
 How the world views Britain 2017 Foresight issue 158 VisitBritain Research November 2017 1 Contents 1. Introduction and study details 2. Headline findings 3. Tourism, Culture and Welcome rankings 4. Tourism
Trends in international higher education
 Trends in international higher education 1 Schedule Student decision-making Drivers of international higher education mobility Demographics Economics Domestic tertiary enrolments International postgraduate
Japan s Policy to Strengthen Economic Partnership. November 2003
 Japan s Policy to Strengthen Economic Partnership November 2003 1. Basic Structure of Japan s External Economic Policy -Promoting Economic Partnership Agreements with closely related countries and regions
Charting Cambodia s Economy, 1H 2017
 Charting Cambodia s Economy, 1H 2017 Designed to help executives interpret economic numbers and incorporate them into company s planning. Publication Date: January 3 rd, 2017 HELPING EXECUTIVES AROUND
SECTION THREE BENEFITS OF THE JSEPA
 SECTION THREE BENEFITS OF THE JSEPA 1. Section Two described the possible scope of the JSEPA and elaborated on the benefits that could be derived from the proposed initiatives under the JSEPA. This section
REMITTANCE PRICES W O R L D W I D E
 Public Disclosure Authorized Public Disclosure Authorized Public Disclosure Authorized Public Disclosure Authorized REMITTANCE PRICES W O R L D W I D E PAYMENT SYSTEMS DEVELOPMENT GROUP FINANCIAL AND PRIVATE
Toward Inclusive Growth in Indonesia : Improving Trade and Employment
 Toward Inclusive Growth in Indonesia : Improving Trade and Employment Guntur Sugiyarto*) Asian Development Bank Conference on Trade and Employment in a Globalized World. Jakarta, Indonesia, 1-11 Desember
VIETNAM FOCUS. The Next Growth Story In Asia?
 The Next Growth Story In Asia? Vietnam s economic policy has dramatically transformed the nation since 9, spurring fast economic and social development. Consequently, Vietnam s economy took off booming
24 Negocios infographics oldemar. Mexico Means
 2 Negocios infographics oldemar Mexico Means Mexico s Means Partner opportunity enersave OPPORTUNITY 2 Negocios INFOGRAPHICS OLDEMAR MEET MEXICO MEXICO IS A big country Mexico is part of North America,
THAILAND SYSTEMATIC COUNTRY DIAGNOSTIC Public Engagement
 THAILAND SYSTEMATIC COUNTRY DIAGNOSTIC Public Engagement March 2016 Contents 1. Objectives of the Engagement 2. Systematic Country Diagnostic (SCD) 3. Country Context 4. Growth Story 5. Poverty Story 6.
Population. C.4. Research and development. In the Asian and Pacific region, China and Japan have the largest expenditures on R&D.
 Statistical Yearbook for Asia and the Pacific 2013 C. Education and knowledge C.4. (R&D) is a critical element in the transition towards a knowledgebased economy. It also contributes to increased productivity,
UNWTO Commission for the Middle East Thirty-ninth meeting Cairo, Egypt, 14 September 2014 Provisional agenda item 3
 UNWTO Commission for the Middle East Thirty-ninth meeting Cairo, Egypt, 14 September 2014 Provisional agenda item 3 CME/39/3 Madrid, 20 June 2014 Original: English 3. Report of the Secretary-General Introduction
Consumer Travel Perceptions & Spending Patterns. Paul Wilke Director Corporate Relations Visa International Asia Pacific Guilin, China 29 June 2007
 Consumer Travel Perceptions & Spending Patterns Paul Wilke Director Corporate Relations Visa International Asia Pacific Guilin, China 29 June 2007 Keeping Asia s tourism industry informed Presentation
Business Data For Engaging in International Real Estate Transactions in California. National Association of REALTORS Research Division
 Business Data For Engaging in International Real Estate Transactions in National Association of REALTORS Research Division November 2016 Table of Contents Introduction 1 Table 1. Population by Place of
Tourist Arrivals in the APEC Region: Determinants and Inclusive Impacts By Emmanuel A. San Andres 1
 Tourist Arrivals in the APEC Region: Determinants and Inclusive Impacts By Emmanuel A. San Andres 1 The Asia-Pacific Economic Cooperation (APEC), founded in 1989, is a regional forum dedicated to promoting
China and India:Convergence and Divergence
 China and India:Convergence and Divergence I. "What China is good at, India is not and vice versa. The countries are inverted mirror of each other».. «very real possibility that China and India will in
UNDERSTANDING TRADE, DEVELOPMENT, AND POVERTY REDUCTION
 ` UNDERSTANDING TRADE, DEVELOPMENT, AND POVERTY REDUCTION ECONOMIC INSTITUTE of CAMBODIA What Does This Handbook Talk About? Introduction Defining Trade Defining Development Defining Poverty Reduction
MEGA-REGIONAL FTAS AND CHINA
 Multi-year Expert Meeting on Enhancing the Enabling Economic Environment at All Levels in Support of Inclusive and Sustainable Development (2nd session) Towards an enabling multilateral trading system
Indonesia and The Implementation of ASEAN Economic Community
 Indonesia and The Implementation of ASEAN Economic Community International Business Management Esther Kezia Simanjuntak 3099190 ABSTRACT Asean Economic Community (AEC) 2015 is a free market realization
A Note on International Migrants Savings and Incomes
 September 24, 2014 A Note on International Migrants Savings and Incomes Supriyo De, Dilip Ratha, and Seyed Reza Yousefi 1 Annual savings of international migrants from developing countries are estimated
AKHILESH TRIVEDI PREPAREDNESS OF SMES TOWARDS AEC : A CASE STUDY OF TRAVEL AGENTS IN BANGKOK
 AKHILESH TRIVEDI Faculty of Hospitality Industry, Dusit Thani College, Thailand PREPAREDNESS OF SMES TOWARDS AEC : A CASE STUDY OF TRAVEL AGENTS IN BANGKOK Abstract: This paper is a survey research conducted
This page of visa application requirements is available from by special permission of the Consulate concerned.
 VIETNAM Address of the Consulate General of the S.R. Vietnam: * 15/F, Great Smart Tower, 230 Wan Chai Road, Wan Chai, Hong Kong; (Left turning from Exit A3, Wanchai Station) * Tel: (852) 25914517; 25914510;
Guangxi Zhuang Autonomous Region 2013
 Guangxi Zhuang Autonomous Region 2013 By Sophie Lu LUP 011.8-3, Dec. 2013 Guangxi is the country s only area in the west which has a coastline and seaports. This region has the geographic advantage of
EXECUTIVE SUMMARY. Shuji Uchikawa
 EXECUTIVE SUMMARY Shuji Uchikawa ASEAN member countries agreed to establish the ASEAN Economic Community by 2015 and transform ASEAN into a region with free movement of goods, services, investment, skilled
Statistical Yearbook. for Asia and the Pacific
 Statistical Yearbook for Asia and the Pacific 2015 Statistical Yearbook for Asia and the Pacific 2015 Sustainable Development Goal 1 End poverty in all its forms everywhere 1.1 Poverty trends...1 1.2 Data
Prospects for future economic cooperation between China and Belt & Road countries
 www.pwccn.com Prospects for future economic cooperation between China and Belt & Road countries Top ten Belt & Road (B&R) economies account for 64% of overall GDP of B&R countries Content 1 Overview of
INVEST IN VIỆT NAM INVEST IN ASEAN
 INVEST IN VIỆT NAM INVEST IN ASEAN ASEAN CONNECTIVITY MINISTRY OF PLANNING AND INVESTMENT http://fia.mpi.gov.vn 1 28 June 2016 Vietnam Family Day ASEAN We are family Viet Nam 95 million people 331.211km2
English Australia. Survey of major ELICOS regional markets in 2014
 English Australia Survey of major ELICOS regional markets in 2014 May 2015 Executive Summary of a report prepared for English Australia by Environmetrics May 2015 English Australia contact: Sue Blundell
ASEAN: THE AEC IS HERE, FINALLY 2030: NOMINAL GDP USD TRILLION US CHINA EURO AREA ASEAN JAPAN UK $20.8 $34.6 IN IN
 14: NOMINAL GDP USD TRILLION US EURO AREA CHINA JAPAN UK $2.9 $4.6 : THE AEC IS HERE, FINALLY $1.4 $13.4 $17.4 3: NOMINAL GDP USD TRILLION US CHINA EURO AREA JAPAN UK $6.8 $6.4 $8.5 $.8 $34.6 $33.6 $2.5
Charting Singapore s Economy, 1Q 2016 Publication Date: December 8 th, 2015 Number of pages: 58
 Charting Singapore s Economy, 1Q 2016 Publication Date: December 8 th, 2015 Number of pages: 58 Attribution-NonCommercial-NoDerivatives 4.0 International (CC BY-NC-ND 4.0) You are free to: Share copy and
The Impacts of Cultural Values on Bilateral International Tourism Flows
 University of Massachusetts Amherst ScholarWorks@UMass Amherst Tourism Travel and Research Association: Advancing Tourism Research Globally 2015 ttra International Conference The Impacts of Cultural Values
Pakistan 2.5 Europe 11.5 Bangladesh 2.0 Japan 1.8 Philippines 1.3 Viet Nam 1.2 Thailand 1.0
 173 People Snapshots Asia and the Pacific accounts for nearly 55% of global population and 6 of the world s 10 most populous economies. The region s population is forecast to grow by almost 1 billion by
TOURISM CRISES AND STATE LEVEL TOURISM DEMAND IN MALAYSIA
 International Journal of Business and Society, Vol. 14 No. 3, 2013, 376-389 TOURISM CRISES AND STATE LEVEL TOURISM DEMAND IN MALAYSIA Chai-Aun Ooi Universiti Sains Malaysia Chee-Wooi Hooy Universiti Sains
Launch of the UK Built Environment Advisory Group
 Launch of the UK Built Environment Advisory Group supporting humanitarian action 19 October 2016, Quito, Ecuador Habitat III, Quito, Ecuador, 2016 Opening address by Joan Clos, UN Habitat RIBA international
UPDATE. Asia at the Crossroads: 5 forces transforming Asia-Pacific region Fraser Thompson, AlphaBeta
 UPDATE Asia at the Crossroads: 5 forces transforming Asia-Pacific region Fraser Thompson, AlphaBeta Email: fraser.thompson@alphabeta.com Website: www.alphabeta.com 0 9 8 7 6 Million USD 500,000 USD 00,000
Ethnic networks and trade: Intensive vs. extensive margins
 MPRA Munich Personal RePEc Archive Ethnic networks and trade: Intensive vs. extensive margins Cletus C Coughlin and Howard J. Wall 13. January 2011 Online at https://mpra.ub.uni-muenchen.de/30758/ MPRA
9HSTCQE*cihdij+ OECD Tourism Trends and Policies Highlights. OECD Tourism Trends and Policies 2018
 OECD Tourism Trends and Policies 2018 Building on the work of the OECD Tourism Committee, within the OECD Centre for Entrepreneurship, SMEs and Local Development, this periodic report is an international
New York County Lawyers Association Continuing Legal Education Institute 14 Vesey Street, New York, N.Y (212)
") New York County Lawyers Association Continuing Legal Education Institute 14 Vesey Street, New York, N.Y. 10007 (212) 267-6646 Who is Who in the Global Economy And Why it Matters June 20, 2014; 6:00 PM-6:50
New York County Lawyers Association Continuing Legal Education Institute 14 Vesey Street, New York, N.Y. 10007 (212) 267-6646 Who is Who in the Global Economy And Why it Matters June 20, 2014; 6:00 PM-6:50
GLOBAL RISKS OF CONCERN TO BUSINESS WEF EXECUTIVE OPINION SURVEY RESULTS SEPTEMBER 2017
 GLOBAL RISKS OF CONCERN TO BUSINESS WEF EXECUTIVE OPINION SURVEY RESULTS SEPTEMBER 2017 GLOBAL RISKS OF CONCERN TO BUSINESS Results from the World Economic Forum Executive Opinion Survey 2017 Survey and
The International Investment Index Report IIRC, Wuhan University
 The International Investment Index Report -14, Wuhan University The International Investment Index Report for to 14 Make international investment simple Introduction International investment continuously
FORECASTING THE INTERNATIONAL TOURISM DEMAND FROM EAST ASIA TO JAPAN
 FORECASTING THE INTERNATIONAL TOURISM DEMAND FROM EAST ASIA TO JAPAN Naohisa OKAMOTO Associate Professor University of Tsukuba Graduate School of Systems and Information Engineering 1-1-1, Tennodai, Tsukuba,
Asian Development Bank
 Asian Development Bank October 2015 President Takehiko Nakao Azerbaijan ADB Regional Members(48 economies) Uzbekistan Kazakhstan Georgia Armenia Turkmenistan Afghanistan Pakistan Kyrgyz Republic Mongolia
The Challenge of Inclusive Growth: Making Growth Work for the Poor
 2015/FDM2/004 Session: 1 The Challenge of Inclusive Growth: Making Growth Work for the Poor Purpose: Information Submitted by: World Bank Group Finance and Central Bank Deputies Meeting Cebu, Philippines
Overview of East Asia Infrastructure Trends and Challenges
 Overview of East Asia Infrastructure Trends and Challenges Christian Delvoie. Director, Knowledge Strategy Group, The World Bank Until September 28: Director, Sustainable Development, East Asia and Pacific
The Impact of China on the Global Economy
 Paths through the Crisis: Can enhanced financial integration provide the way forward for Asia and Europe The Impact of China on the Global Economy Dr. Liming Wang Director, UCD Confucius Institute for
Advanced Passenger Information: Sharing Data for Effective Border Control that Support Tourism Growth in the Asia-Pacific
 2013/HLPD-TF/010 Session 2 Advanced Passenger Information: Sharing Data for Effective Border Control that Support Tourism Growth in the Asia-Pacific Purpose: Information Submitted by: Philippines High
Impacts of Exported Turkish Soap Operas and Visa-free Entry on Inbound Tourism to Turkey
 Impacts of Exported Turkish Soap Operas and Visa-free Entry on Inbound Tourism to Turkey January 24, 2013 Abstract We examine the main determinants of the recent boost in the number of tourist inflows
Inclusive Growth: Challenges For The East Asia Region
 Inclusive Growth: Challenges For The East Asia Region ADFIAP International CEO Forum XI New World Makati Hotel, Makati City, Dec 8, 2015 Rogier van den Brink Lead Economist and Program Leader World Bank
Higher education global trends and Emerging opportunities to 2020
 0 Get informed. Seize challenges. Engage with the future. The shape of things to come: Higher education global trends and Emerging opportunities to 2020 www.aiec.idp.com 1 0 Research Topic Forecast the
Markets in higher education
 Markets in higher education Simon Marginson Institute of Education (IOE) Conference on The State and Market in Education: Partnership or Competition? The Grundtvig Study Centre Aarhus University and LLAKES,
General Assembly Twenty-second session Chengdu, China, September 2017 Provisional agenda item 4
 General Assembly Twenty-second session Chengdu, China, 11-16 September 2017 Provisional agenda item 4 A/22/4 Madrid, 9 September 2017 Original: English Statement by the Secretary-General I. Tourism at
CHINA MARKET PROFILE. The Demographics
 CHINA MARKET PROFILE The Demographics In 2004, China, the most populous country in the world, had a total population of 1,298,847,624 (July 2004) one-fifth of the world s total. The population density
geography Bingo Instructions
 Bingo Instructions Host Instructions: Decide when to start and select your goal(s) Designate a judge to announce events Cross off events from the list below when announced Goals: First to get any line
Major Determinants of Intra-Regional Tourism Demand for Malaysia: A Study
 Major Determinants of Intra-Regional Tourism Demand for Malaysia: A Study Evelyn Kwan Green, MBA, MS Instructor and PhD Candidate University of Southern Mississippi, USA Babu P George, PhD Assistant Professor
Forecast for International Travel to the United States
 Forecast for International Travel to the United States Presented by: JULIE HEIZER National Travel and Tourism Office International Trade Administration U.S. Department of Commerce February 2014 1 U.S.
The Philippines: The New Tiger of Asia
 The Philippines: The New Tiger of Asia Dr. Bernardo M. Villegas Ph.D. (Harvard) University Professor, University of Asia and the Pacific Manila, Philippines The Philippine Economy: Reaching the Tipping