Diversity Initiative March 06, 2008
|
|
|
- John Parrish
- 5 years ago
- Views:
Transcription

1 Diversity Initiative March 06, 2008
2 Content The Face Of Our Landscape Psychographics Media Landscape Cases
3 The Changing Landscape Percentage of foreign born Canadians is rising 18.4% in % in will see up to 8.5 million immigrants Currently 70% of net labour force growth accounted by immigration By % of growth Toronto among the most immigrant-based cities in the world Toronto 46%, Miami 40%, Vancouver 38%, Sydney 31% In Toronto, 25% of school aged children are foreign born
4 Countries Of Origin Of New Immigrants Africa 8% Other 7% Europe 16% C&S. America Caribbean 11% Asia including Middle East 58% The Top countries of origin among recent immigrants to Canada are: 1. China 2. India 3. Philippines 4. Pakistan
5 Chinese And South Asians Remain The Largest Visible Minority Groups In Canada 1,820 1, , , Chinese South Asians Black Filipino Latin - American Southwest Asian Arab West Asian Korean Japanese (Visible Minorities in Thousands) Source: Statistics Canada Census Projections based on reference scenarios.
6 Immigration Is Primary Driver Of Population Growth In Ontario 140, ,000 Ontario Population Growth , , ,000 80,000 60,000 40,000 42,225 20, ,000 NET Inter- Provincial Migration NET Natural Growth NET International Immigration NET O NT Growth -40,000-21,391
7 In The GTA, The Visible Minority Will Soon Be The Visible Majority In Less Than 5 Years GTA Population, 2006 Projected GTA Population, 2011 Immigrants 2.5 Million 48% Canadian Born 2.67 Million 52% Immigrants 3 Million 52% Canadian Born 2.72 Million 48% Total Population: 5.17 Million Total Population: 5.72 Million

8 Almost Half Of Chinese And Just Over Half Of South Asians Have Been In Canada For Less Than 10 Yrs. Years living in Canada Source: Diversity in Canada, Fast Forward Research, 2006

9 Demographics New Immigrants Are Significantly More Likely To Have More Children % of families with children under 18yrs at home Importance of family is very much in line with ethnic profile Source: Diversity in Canada, Fast Forward Research, 2006
10 Are Educated And Twice As Likely To Hold A University Degree Than The Canadian Born Population > Over half (56%) of new immigrants hold a college / university degree Source: Recent Immigrants in Metropolitan Areas, Statistics Canada Census. 2001

11 Demographics 9 Out 10 Recent Immigrants Speak A Non-Official Language And Almost 2/3 Speak It At Home Source: Statistics Canada, 2001 *Source: Longitudinal Survey of Immigrants to Canada.
12 Demographics Top 10 Non-Official Mother Tongues Source: Statistics Canada, Census of Population, 2006.
13 Demographics Languages Spoken At Home (Chinese & South Asians) Toronto CMA SOUTH ASIAN Population age 18 years and over 377,914 Language Spoken Most Often At Home English 116,519 Hindi 17,301 Punjabi 78,070 Urdu 36,788 Other 129,236 CHINESE Population age 18 years and over 331,279 Language Spoken Most Often At Home English 42,389 Cantonese 107,217 Mandarin and other Chinese dialects 161,983 Other 19,690 Importance of communication in-language
14 Psychographics
15 Understanding Cultural Drivers It is more than demographics and ethnicity It s cultural Cultural norms: Behaviour Education: Importance and level Economic: Financial position Symbolism: Meaning of objects, events or relationships Social: Interactions Political: Attitudes toward government Religious: Beliefs that guide actions and attitudes Historical: Events that impact attitudes and actions
16 Likely State Of Mind Of Immigrants Disorientation Isolation Fear of the unknown Adapting & Acceptance A new identity An immigrant s world can be extremely fragmented and disorganized Accommodation Learning to be a smart consumer from scratch Employment & Skills Transfer Prejudice Culture Shock Holding on to Ethnic roots Language
17 Ethnic Consumers Some Insights Chinese Cantonese Style conscious Educated Family oriented Entrepreneurial Location: Markham, Richmond Hill Mandarin Value conscious Educated Family oriented White collar Location: Scarborough, North York, Downtown South Asian Languages: Punjabi, Urdu, Tamil, Gujarati, Hindi Value conscious Educated Family oriented White collar/small Business Location: Mississauga, Brampton, Scarborough, Etobicoke, North York
18 Research Sources/Applications Client research Lexis-Nexis Published information WARC EuroMonitor Syndicated research PMB ACNielsen Economic Research Council of Canada Environics/Manifold Solutions Research Group; Leger Marketing, etc. Publicis Context Analysis, Knowledge Group & Streetviews Online Diaries & Panels Opinion Leader Interviews ZenithOptimedia Touchpoints
19 Media Landscape
20 Key Summary How Can We Best Reach Them? Connect with the ethnic community through Targeted communications and in-language, where they believe you are talking to them In media that reaches them best: Adults Print TV Radio Community centre, Grocery stores, Places of worship Events Youth Print Youth magazines/section TV Radio On Line Cinema Malls Events
21 Media Habits Chinese and South Asians are heavy consumers of in-language media 75% of Chinese and South Asians 15+ have used at least one ethnic Radio/TV station or newspaper in the last 7 days Only 50% of Chinese and 57% of South Asians are reached by English language newspapers 88% use the Internet (slightly above market benchmark), and average time spent per day is 1.8 hours (market benchmark 1.7 hours) 80% of Chinese use Internet at home (market average 68%) Source: Solutions Research Group Media habits


22 Television In Canada Television There are 4 major television stations/networks in Canada that are dedicated to full time Ethnic Groups in their languages; APTN Fairchild Telelatino Vision TV Aboriginal Cantonese & Mandarin Italian & Spanish Arabic, South Asian There are 12 major television stations/networks in Canada that carry part-time coverage of various ethnic groups; CHEX, CHFD, CHIN-TV, CHMI, CHMN, CJNT CKAL, CKEM, Omni 1, Omni 2, Punjabi World TV, TV Deutsch
23 Television in Canada Over and above the full and part time ethnic stations approximately 25 digital stations offer an even greater variety of cultural programming. Abu Dhabi - Arabic Mabuhay Channel - Tagalog All TV - Korean Odyssey - Greek Alpha Punjabi - Punjabi Persian Vision - Persian ART America - Arabic RTVI - Russian ART Digital - Urdu SBTN - Vietnamese B4U Hindi Movies- South Asian SSTV - South Asian Centre TV - Russian Talent Vision - Mandarin FPTV - Portuguese Tamil TV - Tamil GTV - German Tamil Vision - Tamil Inter TV - Ukrainian WMNB - Russian TVP Polonia - Polish TV Japan - Japanese Fairchild HDTV - Cantonese & Mandarin

24 Radio In Canada Radio There are over 47 radio stations that program a portion of their airtime to ethnic communities. The 47 stations cover over 70 different ethnic groups. The largest stations are; Toronto CHIN AM & FM Edmonton & Calgary Fairchild Vancouver CJVB AM Montreal CFMB AM


 Other papers are published weekly,")
25 Print In Canada Newspaper & Magazines There are over 195 newspapers and magazines printed for 44 different cultural groups in Canada. Daily newspaper are available in many languages; Chinese (5) Italian (1) Korean (1) Spanish (1) Other papers are published weekly, bi-weekly or monthly.
26 Online Canada has one of the highest usage rate in the world 84% have daily access 75% have access at home 74% have high speed access Online is now the preferred media source for information Internet Magazine Newspaper Radio TV Financial Information 37% 6% 8% 1% 4% Health Information 52% 13% 2% 1% 6% Product Reviews 52% 20% 5% 1% 5% Family Information 26% 22% 3% 1% 3% General News 25% 1% 17% 2% 52% Search engine optimization is a key way of looking up information 20 25% of searches done on Google each day are new


27 Online Chinese Access sites both Canadian and from homeland South Asian Access site both Canadian and from homeland Key Canadian sites include:
28 Social Networking Many sites exist globally with varying leadership positions*: Facebook - Canada, U.K., South Africa and Norway MySpace - U.S., Australia, Mexico and Italy Orkut India, Brazil and Paraguay Friendster Philippines, Singapore and Indonesia Cyworld South Korea Need to be aware of new immigrants connections to homeland social networking sites Entrepreneurial sites such as Linked-In or Facebook are attracting adults 37% of online adults in the U.S. used internet social-networking tools at least once a month in 2007** Given high propensity of online usage among ethnic communities suggests networking sites to be attractive * thetyee.ca Aug ** Rick Spence at Financial Post Feb. 2008
29 Word Of Mouth References matter 92% of consumers cite word of mouth as one of the best sources for info. about new products (up from 68% a generation ago) (Source: National Opinion Pole) 80% of consumers trust recommendations from family, friends and influential persons over all other forms of advertising (Source: National Opinion Pole) 60% of consumers trust recommendations from on-line discussion groups (Source: Forrester)


30 Events Grassroots opportunities to connect face to face Demonstrates community support
31 Media Watch-Outs Audited vs. sworn distribution Recognized 3 rd party auditing organization Analysis of distribution by geography and place of distribution If bulk distribution are returns accounted for in circulation claims Paid versus free distribution Paid distribution generates more readers Independent owners Sensitive to editorial content Ensure adaptation aligns with preferred language of media selected Solid rationale for media selection or rejection
32 Case Studies

33 Creating Opportunity
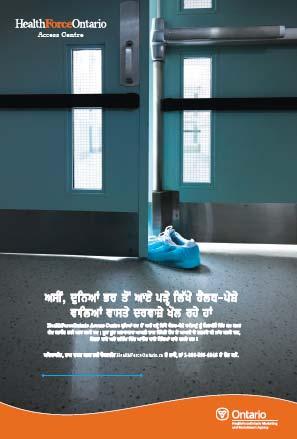
34 Targeting International Health Professionals Original Creation concept testing execution communications planning

35 Geo-Targeting


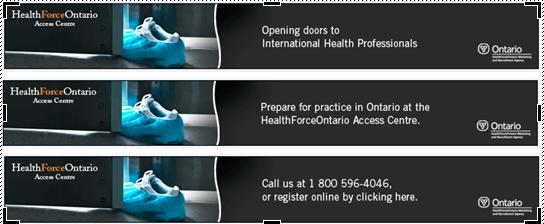
36 BANNER ADS, TELEVISION & RADIO

37 LANDING PAGE
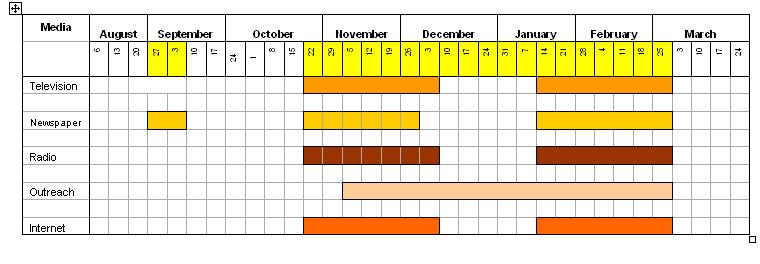
38 COMMUNICATIONS PLAN


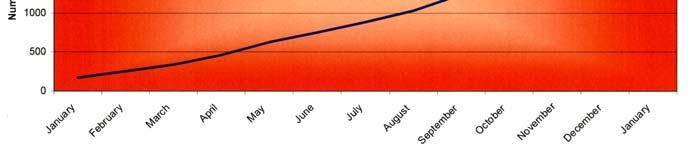
39 Results Total New Clients by Month Total Clients by Month Campaign Launch Campaign Launch
40 Culturally Relevant Adaptations Original Cultural Recognition


41 ROGERS Transit Test Using an ethnic family image in the Metro resulted in 50% increase in call volume


42 ROGERS Promotion


43 ROGERS Promotion


44 ROGERS Festival Acknowledgement
45 Creative Best In Class Go beyond reflecting talent only Ensure copy adaptation reflects: Appropriate language (eg. Brazilian Portuguese or Portugal Portuguese) Appropriate font e.g. Latin vs. Cyrillic Cultural expressions - hinglish Original creative has opportunity to be culturally relevant

46 Dankie Faleminderit Thank you Shukran Grazie Toda Shenorhagal em Webale Mhuway su' Efcharisto Köszönöm Dhanyawaad Xie xie Domo arigato Dziekujemy Merci Miharbaanee Jag tackar Shukriya Ngiyabonga
2011 National Household Survey Profile on the Town of Richmond Hill: 1st Release
 2011 National Household Survey Profile on the Town of Richmond Hill: 1st Release Every five years the Government of Canada through Statistics Canada undertakes a nationwide Census. The purpose of the Census
DEMOGRAPHICS IN CANADIAN SOCIETY. Unit 2
 DEMOGRAPHICS IN CANADIAN SOCIETY Unit 2 WHAT I M LEARNING TODAY Explore how Canada s diversity impacts how society functions Understand how money and power influence who is in control of society Explore
Visit our Publications and Open Data Catalogue to find our complete inventory of our freely available information products.
 Welcome to Mississauga Data This report and other related documents can be found at www.mississauga.ca/data. Mississauga Data is the official City of Mississauga website that contains urban planning related
Immigrant Seniors in British Columbia
 Immigrant Seniors in British Columbia December 2010 Immigrant Seniors in British Columbia Most people who immigrate as seniors come to B.C. to reunite with their families. In fact, 86.2% of the 5,733 new
IMMIGRANTS AND VISIBLE MINORITIES IN PEEL
 THE SOCIAL PLANNING COUNCIL OF PEEL ISSN #1198-5976 I n f o S h a r e VOLUME 11, NUMBER 1 MAY 2003 IMMIGRANTS AND VISIBLE MINORITIES IN PEEL Information on cultural diversity within a population is important
2011 CENSUS & NATIONAL HOUSEHOLD SURVEY CITY OF BRAMPTON - WARD 3 PROFILE
 2011 CENSUS & NATIONAL HOUSEHOLD SURVEY CITY OF BRAMPTON WARD 3 PROFILE WARD HIGHLIGHTS Population 47,500 2011 Population 50.7% Females 2011 Population by Age Group 13% 18% 014 9.07% of total population
CENSUS BULLETIN #5 Immigration and ethnocultural diversity Housing Aboriginal peoples
 CENSUS BULLETIN #5 Immigration and ethnocultural diversity Housing Aboriginal peoples October 25, 217 Bulletin Highlights: 86.1 per cent of the Brampton s 216 surveyed population held a Canadian citizenship
2011 CENSUS & NATIONAL HOUSEHOLD SURVEY CITY OF BRAMPTON - WARD 1 PROFILE
 CENSUS & NATIONAL HOUSEHOLD SURVEY CITY OF BRAMPTON WARD 1 PROFILE WARD HIGHLIGHTS Population 53,130 Population 51.0% Females Population by Age Group 9% 20% 014 10.14% of total population 36 Median Age
Study Area Maps. Profile Tables. W Broadway & Cambie St, Vancouver, BC Pitney Bowes 2016 Estimates and Projections. W Broadway & Cambie St
 Powered by PCensus Page 1 Study Area Maps Profile Tables 2016 Demographic Snapshot Population Trends Household Trends Population by Age and Sex Comparison Population by Age and Sex Household Maintainers
2011 CENSUS & NATIONAL HOUSEHOLD SURVEY CITY OF BRAMPTON - WARD 10 PROFILE
 2011 CENSUS & NATIONAL HOUSEHOLD SURVEY CITY OF BRAMPTON WARD 10 PROFILE WARD HIGHLIGHTS Population 10.72% of total population 56,185 2011 Population 33 Median Age 50.1% Females 49.9% Males 2011 Population
2011 CENSUS & NATIONAL HOUSEHOLD SURVEY CITY OF BRAMPTON - WARD 4 PROFILE
 2011 CENSUS & NATIONAL HOUSEHOLD SURVEY CITY OF BRAMPTON WARD 4 PROFILE WARD HIGHLIGHTS Population 9.51% of total population 49,850 2011 Population 34 Median Age 50.5% Females 49.5% Males 2011 Population
TABLE OF CONTENTS. Settlement in the City of Whitehorse by Migration Stream - July to June
 TABLE OF CONTENTS City of Whitehorse Department of Immigration and Citizenship Settlement Database Settlement in the City of Whitehorse by Migration Stream - July 1 2002 to June 30 2007 Settlement by Country
Immigrant DELTA, B.C Delta Immigrant Demographics I
 Immigrant demographics DELTA, B.C. - 2018 Immigrant Demographics I Page 1 DELTA IMMIGRANT DEMOGRAPHICS Your quick and easy look at facts and figures around immigration. Newcomers are an important and growing
CITY OF MISSISSAUGA. Overview 2-1. A. Demographic and Cultural Characteristics
 Portraits of Peel Overview 2-1 A. Demographic and Cultural Characteristics Population: Size, Age and Growth 2-2 Immigrants 2-3 Visible Minorities 2-4 Language 2-5 Religion 2-6 Mobility Status 2-7 B. Household
Keelesdale-Eglinton West
 BLACK CREEK DR 0-4 5-9 10-14 15-19 20-24 25-29 30-34 KEELE ST 35-39 40-44 45-49 50-54 -59 KANE AVE 60-64 65-69 70-74 75-79 80-84 85-89 90-94 95-99 100+ 2011 Neighbourhood Demographic Estimates EGLINTON
F e b r u a r y Simplified Understanding
 New Consumer Insights & Best Practices For Reaching the Ethnic Market in BC F e b r u a r y 2013 Simplified Understanding Key Insights Secondary Research British Columbia s growth is coming from international
Social and Demographic Trends in Burnaby and Neighbouring Communities 1981 to 2006
 Social and Demographic Trends in and Neighbouring Communities 1981 to 2006 October 2009 Table of Contents October 2009 1 Introduction... 2 2 Population... 3 Population Growth... 3 Age Structure... 4 3
Saanich A District Municipality in Capital Regional District
 Produced by Stats for Population Total Immigrants Change in Change in Immigrants Population Number Percent Population Number Percent 1991 95,583 20,285 21.2 1991 to 1996 5,805 755 3.7 1996 101,388 21,040
TOWNSHIP OF LANGLEY, B.C Township of Langley Immigrant Demographics I
 Immigrant demographics TOWNSHIP OF LANGLEY, B.C. - 2018 Township of Langley Immigrant Demographics I Page 1 TOWNSHIP OF LANGLEY IMMIGRANT DEMOGRAPHICS Your quick and easy look at facts and figures around
Nanaimo A City in Nanaimo Regional District
 A City in Regional District Produced by Stats for Population Total Immigrants Change in Change in Immigrants Population Number Percent Population Number Percent 1991 6,129 8,885 14.8 1991 to 1996,1 2,44
North Vancouver, City of A City in Greater Vancouver Regional District
 Global Non-Response Rate: 25.8 Population Total Immigrants Change in Change in Immigrants Population Number Percent Population Number Percent 1991 38,436,8 28.2 1991 to 1996 3,39 2,46 22.7 1996 41,475
CENSUS RESULTS WARD 3 PROFILE
 2011 CENSUS RESULTS WARD 3 PROFILE Town of Halton Hills City of Brampton Hwy. 407 Finch Ave. Town of Milton Hwy. 407 ETR Ninth Line 10 Derry Rd. Winston Churchill Blvd. 9 Erin Mills Pkwy. Mississauga Rd.
(Note: These are inititial neighbourhood estimates and are subject to change.) NEI Score. 1,000 Female 52%
 NEI Score. 1,000 Female 52%") 0-4 5-9 10-14 15-19 20-24 25-29 30-34 35-39 40-44 45-49 50-54 55-59 60-64 65-69 70-74 75-79 80-84 85-89 90-94 95-99 100+ 2011 Neighbourhood Demographic Estimates EGLINTON AVE E C P R DON VALLEY PARKWAY
0-4 5-9 10-14 15-19 20-24 25-29 30-34 35-39 40-44 45-49 50-54 55-59 60-64 65-69 70-74 75-79 80-84 85-89 90-94 95-99 100+ 2011 Neighbourhood Demographic Estimates EGLINTON AVE E C P R DON VALLEY PARKWAY
View Royal A Town in Capital Regional District
 Produced by Stats for Global NonResponse Rate: 18.4 Population Total Immigrants Change in Change in Immigrants Population Number Percent Population Number Percent 1991 5,996 9 15.6 1991 to 1996 445 315
Immigrant PORT COQUITLAM, B.C Port Coquitlam Immigrant Demographics I
 Immigrant demographics PORT COQUITLAM, B.C. - 2018 Immigrant Demographics I Page 1 PORT COQUITLAM IMMIGRANT DEMOGRAPHICS Your quick and easy look at facts and figures around immigration. Newcomers are
Immigrant. coquitlam, B.C Coquitlam Immigrant Demographics I
 Immigrant demographics coquitlam, B.C. - 2018 Immigrant Demographics I Page 1 coquitlam IMMIGRANT DEMOGRAPHICS Your quick and easy look at facts and figures around immigration. Newcomers are an important
Ward 4 Etobicoke Centre City of Toronto Ward Profiles 2016 Census
 Bar Chart showing the rate of population growth between the years 2006 and 2016 for the Ward compared to the City of based on the 2006 and data. For more information, please contact Michael Wright at 416-392-7558
Changing Faces Profile of Burlington Newcomers. November 2010
 Changing Faces Profile of Burlington Newcomers November 2010 2010 Community Development Halton, all rights reserved. Copies of this document may be reproduced non-commercially for the purpose of community
(Note: These are inititial neighbourhood estimates and are subject to change.) SCARBOROUGH SHORELINE. NEI Score. 1,500 Female 53%
 SCARBOROUGH SHORELINE. NEI Score. 1,500 Female 53%") 0-4 5-9 10-14 15-19 20-24 25-29 30-34 35-39 40-44 45-49 50-54 55-59 60-64 65-69 70-74 75-79 80-84 85-89 90-94 95-99 100+ 2011 Neighbourhood Demographic Estimates HIGHLAND CREEK WEST HIGHLAND CREEK KINGSTON
0-4 5-9 10-14 15-19 20-24 25-29 30-34 35-39 40-44 45-49 50-54 55-59 60-64 65-69 70-74 75-79 80-84 85-89 90-94 95-99 100+ 2011 Neighbourhood Demographic Estimates HIGHLAND CREEK WEST HIGHLAND CREEK KINGSTON
Canada s Visible Minorities: Andrew Cardozo and Ravi Pendakur
 Canada s Visible Minorities: 1967-2017 Andrew Cardozo and Ravi Pendakur Introduction Introductory remarks Demographic overview Labour market outcomes Policy initiatives Some defining moments Demographic
Welcome. Luc Wauters
 Welcome Luc Wauters Who am I Luc Wauters Nationality: Belgian / Canadian Lived in: Vancouver BC 2yrs Kingston, ON 10 yrs Married with 2 children Ontario / Canada - Go East 10 Provinces and 3 Territories
The Future of North West Sydney
 The Future of North West Sydney AUGUST 2018 2 Contents Demographic & Education Trends in Sydney s North West 5 Methodology 7 Sydney s North West 8 Population growth 8 Age profile 9 Student enrolments 12
MONITORING THE METROS: A MUCH-AWAITED 2011 UPDATE
 THE METRO BEAT TD Economics MONITORING THE METROS: A MUCH-AWAITED 211 UPDATE The 211 National Household Survey release on May 8 th provides a demographic and diversity update across Canada. This is the
Chairman and Members of the Planning and Development Committee. Thomas S. Mokrzycki, Commissioner of Planning and Building
 CD.15.DAT DATE: TO: FROM: SUBJECT: Chairman and Members of the Planning and Development Committee Thomas S. Mokrzycki, Commissioner of Planning and Building Mississauga: A City of Many Cultures MEETING
Castlegar A City in Central Kootenay Regional District
 Produced by Stats for Population Total Immigrants Change in Change in Immigrants Population Number Percent Population Number Percent 1991 6,579 885 13.5 1991 to 1996 448 45 5.1 1996 7,27 93 13.2 1996 to
new westminster, B.C New Westminster Immigrant Demographics I
 Immigrant demographics new westminster, B.C. - 2018 Immigrant Demographics I Page 1 new westminster IMMIGRANT DEMOGRAPHICS Your quick and easy look at facts and figures around immigration. Newcomers are
CENSUS RESULTS WARD 8 PROFILE
 2011 CENSUS RESULTS WARD 8 PROFILE Town of Halton Hills City of Brampton Hwy. 407 Finch Ave. Town of Milton Hwy. 407 ETR Ninth Line 10 Derry Rd. Winston Churchill Blvd. 9 Erin Mills Pkwy. Mississauga Rd.
Skeena-Queen Charlotte A Regional District in British Columbia
 Global NonResponse Rate: 34.7 Population Total Immigrants Change in Change in Immigrants Population Number Percent Population Number Percent 1991 24,287 3,125 12.9 1991 to 1996 58 27 8.6 1996 24,795 2,855
North Okanagan A Regional District in British Columbia
 Population Total Immigrants Change in Change in Immigrants Population Number Percent Population Number Percent 1991 61,744 7,855 12.7 1991 to 1996 9,863 685 8.7 1996 71,67 8,54 11.9 1996 to 1 1,6-28 -
The Chinese Community in Canada
 Catalogue no. 89-621-XIE No. 001 ISSN: 1719-7376 ISBN: 0-662-43444-7 Analytical Paper Profiles of Ethnic Communities in Canada The Chinese Community in Canada 2001 by Colin Lindsay Social and Aboriginal
CENSUS RESULTS WARD 7 PROFILE
 2011 CENSUS RESULTS WARD 7 PROFILE Town of Halton Hills City of Brampton Hwy. 407 Finch Ave. Town of Milton Hwy. 407 ETR Ninth Line 10 Derry Rd. Winston Churchill Blvd. 9 Erin Mills Pkwy. Mississauga Rd.
Strathcona A Regional District in British Columbia
 Produced by Stats for Population Total Immigrants Change in Change in Immigrants Population Number Percent Population Number Percent 1991 - - - 1991 to 1996 - - - 1996 - - - 1996 to 1 - - - 1 - - - 1 to
BRAMALEA. Overview A. Demographic and Cultural Characteristics
 The Social Planning Council of Peel Portraits of Peel BRAMALEA Overview 13-1 A. Demographic and Cultural Characteristics Population: Size, Age and Growth 13-2 Immigrants 13-3 Visible Minorities 13-4 Language
CENSUS RESULTS WARD 10 PROFILE
 2011 CENSUS RESULTS WARD 10 PROFILE Town of Halton Hills City of Brampton Hwy. 407 Finch Ave. Town of Milton Hwy. 407 ETR Ninth Line 10 Derry Rd. Winston Churchill Blvd. 9 Erin Mills Pkwy. Mississauga
Immigration and Ethno-Cultural Diversity
 2016 London Census: Fact Sheet 7 Immigration and Ethno-Cultural Diversity On October 25, 2017 Statistics Canada released the 2016 Census data on Immigration and Ethno-Cultural Diversity. This summary highlights
Salmon Arm A City in Columbia-Shuswap Regional District
 Produced by Stats for Global NonResponse Rate: 22.8 Population Total Change in Change in Population Number Percent Population Number Percent 1991 12,115 1,365 11.3 1991 to 1996 2,549 25 18.3 1996 14,664
Ward 17 Davenport City of Toronto Ward Profiles 2016 Census
 Bar Chart showing the rate of population growth between the years 2006 and 2016 for the Ward compared to the City of based on the 2006 and data. For more information, please contact Michael Wright at 416-392-7558
CENSUS RESULTS WARD 9 PROFILE
 2011 CENSUS RESULTS WARD 9 PROFILE Town of Halton Hills City of Brampton Hwy. 407 Finch Ave. Town of Milton Hwy. 407 ETR Ninth Line 10 Derry Rd. Winston Churchill Blvd. 9 Erin Mills Pkwy. Mississauga Rd.
East Kootenay A Regional District in British Columbia
 Produced by Stats for Global Non-Response Rate: 35.5 Population Total Immigrants Change in Change in Immigrants Population Number Percent Population Number Percent 1991 52,368 5,9 11.3 1991 to 1996 3,998-55
Victoria A City in Capital Regional District
 Produced by Stats for Global Non-Response Rate: 24.6 Population Total Immigrants Change in Change in Immigrants Population Number Percent Population Number Percent 1991 71,228 14,665 20.6 1991 to 1996
North York City of Toronto Community Council Area Profiles 2016 Census
 Bar Chart showing the rate of population growth between the years 2006 and 2016 for the Ward compared to the City of based on the 2006 and data. For more information, please contact Michael Wright at 416-392-7558
CENSUS RESULTS WARD 6 PROFILE
 2011 CENSUS RESULTS WARD 6 PROFILE Town of Halton Hills City of Brampton Hwy. 407 Finch Ave. Town of Milton Hwy. 407 ETR Ninth Line 10 Derry Rd. Winston Churchill Blvd. 9 Erin Mills Pkwy. Mississauga Rd.
Burnaby A City in Greater Vancouver Regional District
 Produced by Stats for Global Non-Response Rate: 23.6 Population Total Change in Change in Population Number Percent Population Number Percent 1991 158,858 49,5 31.2 1991 to 1996,351 24,5 49.1 1996 179,9
Quesnel A City in Cariboo Regional District
 Produced by Stats for Global NonResponse Rate:.4 Population Total Immigrants Change in Change in Immigrants Population Number Percent Population Number Percent 1991 8,8 1,35 16.4 1991 to 1996 26 5.4 1996
Dufferin Grove: Neighbourhood Profile
 I. Population and Age Population 21 Neighbourhood Population: 12693 12% of Catchment Area Population: Change in population growth (1996-21): # 145 % 1% same as pop change in the catchment area Population
Lake Country A District Municipality in Central Okanagan Regional District
 Produced by Stats for Population Total Immigrants Change in Change in Immigrants Population Number Percent Population Number Percent 1991 1991 to 1996 1996 9,7 1,275 14.2 1996 to 1 26 7 5.5 1 9,267 1,345
Ward 14 Parkdale-High Park City of Toronto Ward Profiles 2016 Census
 Bar Chart showing the rate of population growth between the years 2006 and 2016 for the Ward compared to the City of based on the 2006 and data. For more information, please contact Michael Wright at 416-392-7558
Toronto, Ontario, Canada. Innovations Systems Research Network (ISRN) April
 April") Toronto, Ontario, Canada Innovations Systems Research Network (ISRN) April 30 2008 Agenda Context/Process Key Messages Background Data Strategic Directions Engagement Strategy Mandate Context: Advisory
Toronto, Ontario, Canada Innovations Systems Research Network (ISRN) April 30 2008 Agenda Context/Process Key Messages Background Data Strategic Directions Engagement Strategy Mandate Context: Advisory
Ministry of Jobs, Tourism and Skills Training and Minister Responsible for Labour
 Formal Apology to Chinese Canadians The Government of BC formally apologized in the Legislature for the provincial government s historical wrongs towards Chinese Canadians. Premier Christy Clark expressed
(Note: These are inititial neighbourhood estimates and are subject to change.) C P R. NEI Score. 600 Female 51%
 C P R. NEI Score. 600 Female 51%") 0-4 5-9 10-14 15-19 20-24 25-29 30-34 35-39 40-44 45-49 50-54 55-59 60-64 65-69 70-74 75-79 80-84 85-89 90-94 95-99 100+ 2011 Neighbourhood Demographic Estimates STEELES AVE W FENMAR DR C P R GARYRAY DR
0-4 5-9 10-14 15-19 20-24 25-29 30-34 35-39 40-44 45-49 50-54 55-59 60-64 65-69 70-74 75-79 80-84 85-89 90-94 95-99 100+ 2011 Neighbourhood Demographic Estimates STEELES AVE W FENMAR DR C P R GARYRAY DR
(Note: These are inititial neighbourhood estimates and are subject to change.) C P R. NEI Score. Female 52%
 C P R. NEI Score. Female 52%") 0-4 5-9 10-14 15-19 20-24 25-29 30-34 JANE ST 35-39 40-44 45-49 50-54 55-59 60-64 65-69 70-74 75-79 80-84 85-89 90-94 95-99 100+ 2011 Neighbourhood Demographic Estimates EGLINTON AVE W JANE ST WESTON RD
0-4 5-9 10-14 15-19 20-24 25-29 30-34 JANE ST 35-39 40-44 45-49 50-54 55-59 60-64 65-69 70-74 75-79 80-84 85-89 90-94 95-99 100+ 2011 Neighbourhood Demographic Estimates EGLINTON AVE W JANE ST WESTON RD
TABLE OF CONTENTS. Department of Immigration and Citizenship Settlement Database
 TABLE OF CONTENTS Eastern Region Department of Immigration and Citizenship Settlement Database Settlement in the Eastern Region by Migration Stream - July 1 2002 to June 30 2007 Settlement in the Eastern
Self-Employment and Employment in Quebec s English-speaking Cultural Communities and Visible Minorities: Prospects and Problems.
 Self-Employment and Employment in Quebec s English-speaking Cultural Communities and Visible Minorities: Prospects and Problems For Youth Employment Services September 2006 With the Support of the Department
Planning Study Area 1 Burnaby Heights
 Neighbourhood Profiles 2006 Census Planning Study Area 1 Heights is bounded by Burrard Inlet to the north, Willingdon Avenue to the east, Hastings Street to the south and Boundary Road to the west. PLANNING
(Note: These are inititial neighbourhood estimates and are subject to change.) 1,000 Female 54%
 1,000 Female 54%") LAWRENCE AVE E 0-4 5-9 10-14 15-19 20-24 25-29 30-34 35-39 40-44 45-49 50-54 55-59 60-64 65-69 70-74 75-79 80-84 85-89 90-94 95-99 100+ 2011 Neighbourhood Demographic Estimates RAILSIDE RD C P R DON RIVER
LAWRENCE AVE E 0-4 5-9 10-14 15-19 20-24 25-29 30-34 35-39 40-44 45-49 50-54 55-59 60-64 65-69 70-74 75-79 80-84 85-89 90-94 95-99 100+ 2011 Neighbourhood Demographic Estimates RAILSIDE RD C P R DON RIVER
COMMUNITY PROFILE BURNABY
 COMMUNITY PROFILE BURNABY Burnaby Demographics I Page 1 BURNABY IMMIGRANT DEMOGRAPHICS Your quick and easy look at facts and figures around immigration. Newcomers are an important and growing part of your
people/hectare Ward Toronto
 Bar Chart showing the rate of population growth between the years 2006 and 2016 for the Ward compared to the City of based on the 2006 and data. For more information, please contact Michael Wright at 416-392-7558
Grand Forks A City in Kootenay-Boundary Regional District
 A City in KootenayBoundary Regional District Produced by Stats for Global NonResponse Rate: 45.8 Population Total Immigrants Change in Change in Immigrants Population Number Percent Population Number Percent
Nelson A City in Central Kootenay Regional District
 Produced by Stats for Global NonResponse Rate: 28.3 Population Total Immigrants Change in Change in Immigrants Population Number Percent Population Number Percent 1991 8,849 1,175 13.3 1991 to 1996 736
(Note: These are inititial neighbourhood estimates and are subject to change.) C N R. NEI Score. Female 54%
 C N R. NEI Score. Female 54%") 0-4 5-9 10-14 15-19 20-24 25-29 30-34 35-39 40-44 45-49 50-54 55-59 60-64 65-69 70-74 75-79 80-84 85-89 90-94 95-99 100+ 2011 Neighbourhood Demographic Estimates STANSBURY CRES MIDLAND AVE CITADEL DR WEST
0-4 5-9 10-14 15-19 20-24 25-29 30-34 35-39 40-44 45-49 50-54 55-59 60-64 65-69 70-74 75-79 80-84 85-89 90-94 95-99 100+ 2011 Neighbourhood Demographic Estimates STANSBURY CRES MIDLAND AVE CITADEL DR WEST
2016 Census: Release 5 Immigration and ethnocultural diversity, Housing and the Aboriginal population
 2016 Census: Release 5 Immigration and ethnocultural diversity, Housing and the Aboriginal population Dr. Doug Norris Senior Vice President and Chief Demographer November 2, 2017 Today s presenter Dr.
The changing face of Britain
 The changing face of Britain Multicultural Britain 2011 census 19.5% of the population of England and Wales now comes from a non-white British background White British (80.5%) Any Other White (5.4%) Irish
Scarborough City of Toronto Community Council Area Profiles 2016 Census
 Bar Chart showing the rate of population growth between the years 2006 and 2016 for the Ward compared to the City of based on the 2006 and data. For more information, please contact Michael Wright at 416-392-7558
Immigrant and Temporary Resident Children in British Columbia
 and Temporary Resident Children in British Columbia January 2011 During the five-year period from 2005 to 2009, on average, approximately 40,000 immigrants arrived in B.C. annually and approximately 7,900
SURVEY ON SWEDISH LANGUAGE AMONG FOREIGN-LANGUAGE COMMUNITY IN FINLAND
 SURVEY ON SWEDISH LANGUAGE AMONG FOREIGN-LANGUAGE COMMUNITY IN FINLAND Helsinki Times newspaper and SixDegrees monthly conducted a survey among the foreign-language community in Finland about their perception,
Powell River A City in Powell River Regional District
 A City in Regional District Produced by Stats for Population Total Immigrants Change in Change in Immigrants Population Number Percent Population Number Percent 1991 12,991 1,965 15.1 1991 to 1996 14 4
2016 Census: Housing, Immigration and Ethnocultural Diversity, Aboriginal peoples
 October 26, 2017 Backgrounder 2016 Census: Housing, Immigration and Ethnocultural Diversity, Aboriginal peoples The 2016 Census Day was May 10, 2016. On October 25, 2017, Statistics Canada released data
BBC BBC World Service Long-Term Tracking
 In total 28,619 citizens in 27 countries, were interviewed face-to-face, or by telephone December 2, 2010 and February 4, 2011. Countries were rated by half samples in all countries polled. Polling was
Harrison Hot Springs A Village in Fraser Valley Regional District
 Global NonResponse Rate: 42.4 Population Total Immigrants Change in Change in Immigrants Population Number Percent Population Number Percent 1991 655 17 26. 1991 to 1996 243 3 17.6 1996 898 2 22.3 1996
Culturally and Linguistically Diverse People Living in NSW: Selected characteristics
 Culturally and Linguistically Diverse People Living in NSW: Selected characteristics Contents Introduction 3 Countries people were born in 4 Most common ethnic groups 6 Trends in the number of arrivals
Osoyoos A Town in Okanagan-Similkameen Regional District
 A Town in OkanaganSimilkameen Regional District Produced by Stats for Global NonResponse Rate: 38.5 Population Total Immigrants Change in Change in Immigrants Population Number Percent Population Number
Canada at 150 and the road ahead A view from Census 2016
 Canada at 150 and the road ahead A view from Census 2016 Dr. Doug Norris Senior Vice President and Chief Demographer 2017 Environics Analytics User Conference November 8, 2017 Canada continues to lead
COMMUNITY PROFILE TOWNSHIP OF LANGLEY. Township of Langley Immigrant Demographics I Page 1
 COMMUNITY PROFILE TOWNSHIP OF LANGLEY Township of Langley Demographics I Page 1 TOWNSHIP OF LANGLEY IMMIGRANT DEMOGRAPHICS Your quick and easy look at facts and figures around immigration. Newcomers are
COMMUNITY PROFILE COQUITLAM. Coquitlam Immigrant Demographics I Page 1
 COMMUNITY PROFILE COQUITLAM Coquitlam Demographics I Page 1 COQUITLAM IMMIGRANT DEMOGRAPHICS Your quick and easy look at facts and figures around immigration. Newcomers are an important and growing part
Measuring Identities, Diversity and Inclusion: Results from the 2016 Census
 Measuring Identities, Diversity and Inclusion: Results from the 2016 Census www.statcan.gc.ca Telling Canada s story in numbers Jane Badets Assistant Chief Statistician Social, Health and Labour Statistics
Port McNeill A Town in Mount Waddington Regional District
 Produced by Stats for Global NonResponse Rate: 35.1 Population Total Immigrants Change in Change in Immigrants Population Number Percent Population Number Percent 1991 2,641 225 8.5 1991 to 1996 284 5
Who are the Strangers? A Socio-Demographic Profile of Immigrants in Toronto. Cliff Jansen and Lawrence Lam. York University
 , ' DRAFT Who are the Strangers? A Socio-Demographic Profile of Immigrants in Toronto By Cliff Jansen and Lawrence Lam York University A paper presented at the Fourth National Metropolis Conference, March
ADMISSIONS SURVEY FALL 2017 ENTERING CLASS
 ADMISSIONS SURVEY FALL 2017 ENTERING CLASS Response to Survey: 100% represents 1% or less Gender Male 44% 46% Female 55% 52% Trans - Gender non-conforming - Choose not to answer - 2% Language Most Comfortable
FECCA s Submission to the ABC and SBS Towards a Digital Future Discussion Paper
 FECCA s Submission to the ABC and SBS Towards a Digital Future Discussion Paper November 2008 1: The role of national broadcasting The ABC and SBS discussion paper and the 2020 Summit statement canvass
Verdun borough HIGHLIGHTS. In 1996, the Verdun borough had a population of 59,714. LOCATION
 Socio-economic profile borough February 2002 HIGHLIGHTS In 1996, the borough had a population of 59,714. LOCATION Between 1991 and 1996, the population of the borough declined by 2.6%. One-person households
Creston A Town in Central Kootenay Regional District
 Produced by Stats for Global NonResponse Rate: 32.4 Population Total Immigrants Change in Change in Immigrants Population Number Percent Population Number Percent 1991 4,27 655 15.6 1991 to 1996 69 175
Enderby A City in North Okanagan Regional District
 Produced by Stats for Global NonResponse Rate: 44.3 Population Total Immigrants Change in Change in Immigrants Population Number Percent Population Number Percent 1991 2,128 23.8 1991 to 1996 626 3 13.
Immigration and Ethnocultural Diversity in Quebec
 Immigration and Ethnocultural Diversity in Quebec The National Household Survey (NHS) Regional analysis January 2014 Immigration and Ethnocultural Diversity in Canada was part of the first release of data
YORK REGION. Let s Talk Inclusion: Creating Strong, Caring, Safe Communities. Your Insights on York Region s Diverse Communities
 YORK REGION Creating Strong, Caring, Safe Communities Let s Talk Inclusion: Your Insights on York Region s Diverse Communities LEADING CHANGE FOR A STRONGER COMMUNITY LET S TALK INCLUSION WORKBOOK We want
Parksville A City in Nanaimo Regional District
 Produced by Stats for Global NonResponse Rate: 2.3 Population Total Immigrants Change in Change in Immigrants Population Number Percent Population Number Percent 1991 7,381 1,27 17.2 1991 to 1996 2,91
Responding to Cultural Diversity: Approaches and Alternatives
 Responding to Cultural Diversity: Approaches and Alternatives A Presentation Prepared for the Newcomer Organizations Network (NCON) For Peel, Halton and Dufferin January 24, 2008 Paula DeCoito, Ph.D. The
Chinese Ethnic Economy in Toronto
 Chinese Ethnic Economy in Toronto Preliminary Report By Eric Fong University of Toronto and Ambrose Ma President, South East Asians Services Centre Overview Ethnic economy is an alternative avenue of economic
Corporate. Report COUNCIL DATE: April 28, 2008 NO: R071 REGULAR COUNCIL. TO: Mayor & Council DATE: April 28, 2008
 Corporate NO: R071 Report COUNCIL DATE: April 28, 2008 REGULAR COUNCIL TO: Mayor & Council DATE: April 28, 2008 FROM: General Manager, Planning and Development FILE: 6600-01 SUBJECT: 2006 Census Information
Catholic School Board Services Association
 Catholic School Board Services Association The Demographic Landscape Thursday, March 5, 2015 Jack Ammendolia Director, Education Division The Baby Boom Post WWII in Canada, the population and especially
Immigrants Economic Integration: Successes and Challenges
 Social Planning Council of Ottawa REPORT SUMMARY Immigrants Economic Integration: Successes and Challenges A Profile of Immigrants in Ottawa Based on the 2006 Census June 2009 Suggested Donation: $20.00