National Assembly for Wales Elections: 2011
|
|
|
- Baldric Hensley
- 6 years ago
- Views:
Transcription
1 National Assembly for Wales Elections: 2011 RESEARCH PAPER 11/40 19 May 2011 This Research Paper provides summary and detailed results of the fourth elections to the National Assembly for Wales, which took place on 5 May The paper provides data on voting trends and electoral turnout for constituencies, electoral regions and for Wales as a whole. This paper is a companion volume to Library Research Papers 11/41 Scottish Parliament Elections: 2011, 11/42 Northern Ireland Assembly Elections: 2011, 11/43 Local Elections: 2011 and 11/44 Alternative Vote Referendum. Oliver Hawkins
2 Recent Research Papers 11/35 Economic Indicators, May /36 Energy Bill [HL] [Bill 167 of ] /37 Education Bill: Committee Stage Report /38 Social Indicators /39 Legislation (Territorial Extent) Bill: Committee Stage Report /41 Scottish Parliament Elections: /42 Northern Ireland Assembly Elections: /43 Local Elections: /44 Alternative Vote Referendum /45 Unemployment by Constituency, May Research Paper 11/40 Contributing Authors: Oliver Hawkins, Social and General Statistics Jeremy Hardacre, Statistics Resource Unit This information is provided to Members of Parliament in support of their parliamentary duties and is not intended to address the specific circumstances of any particular individual. It should not be relied upon as being up to date; the law or policies may have changed since it was last updated; and it should not be relied upon as legal or professional advice or as a substitute for it. A suitably qualified professional should be consulted if specific advice or information is required. This information is provided subject to our general terms and conditions which are available online or may be provided on request in hard copy. Authors are available to discuss the content of this briefing with Members and their staff, but not with the general public. We welcome comments on our papers; these should be ed to papers@parliament.uk. ISSN
3 Contents Summary 1 1 Introduction Labour Conservatives Plaid Cymru Liberal Democrats United Kingdom Independence Party Green Party British National Party Turnout Composition of the Assembly Note on data sources 5 Map: Seat winners 6 Map: Turnout 6 2 Summary of Results 7 Table 1: Election Results, 5 May Table 2: Election Results, 3 May Table 3: Share of the vote 9 Map: Conservative share of the constituency vote 10 Map: Labour share of the constituency vote 10 Map: Liberal Democrat share of the constituency vote 11 Map: Plaid Cymru share of the constituency vote 11 Party Summary: Conservatives 12 Party Summary: Labour 12 Party Summary: Liberal Democrats 13 Party Summary: Plaid Cymru 13 3 Constituency Ballot 14 Table 4: Votes and turnout by constituency 14 Table 5: Seats by majority from highest to lowest percentage majority 15 Table 6: Share of the vote by constituency 16 Table 7: Change in share of the vote and turnout by constituency 17 Table 8: Votes and shares by region 18 Table 9: Change in share of the vote by region 18
4 4 Regional Ballot 19 Table 10: Votes and turnout by constituency 19 Table 11: Share of the vote by constituency 20 Table 12: Change in share of the vote and turnout by constituency 21 Table 13: Votes and turnout by region 22 Table 14: Share of the vote by region 22 Table 15: Change in share of the vote by region 22 Table 16: Difference in share between constituency and regional ballots by region 22 Table 17: Seats won by seat type and region 23 Appendix 24 Table A1: Constituencies with highest and lowest turnout in each region 24 Table A2: Largest and smallest constituency majorities by party 25 Table A3: Highest and lowest shares of the constituency vote by party 26 Table A4: Assembly Members elected, May
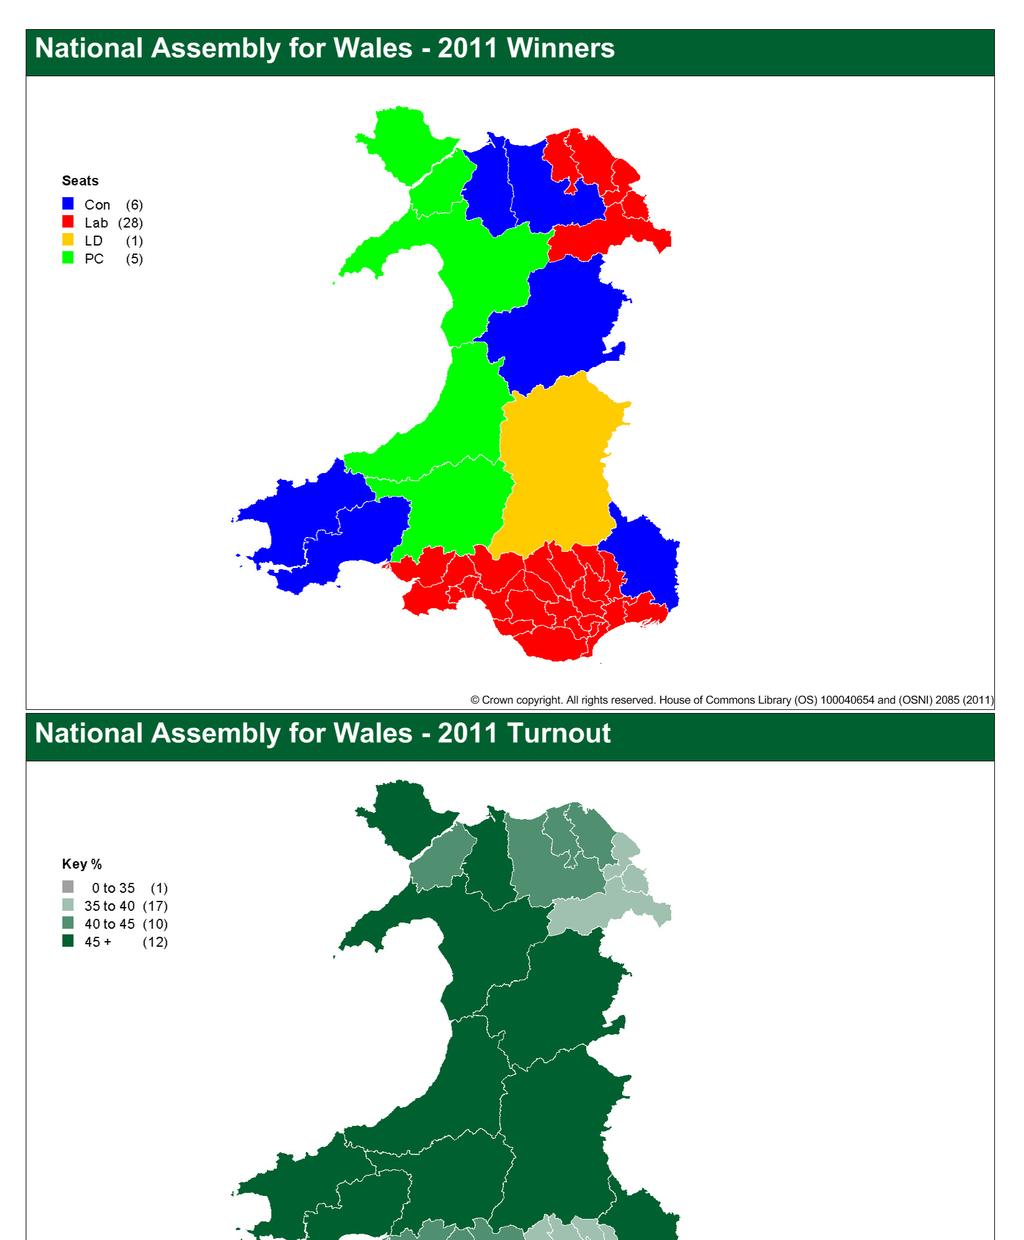
5 Summary Labour won half of the 60 seats in the National Assembly. The seats won by each party were as follows. Conservatives 14 Labour 30 Liberal Democrats 5 Plaid Cymru 11 Labour secured the highest share of the vote with 39.6%, up from 30.9% in The Conservatives polled 23.8%, up from 21.9%. Plaid Cymru s share of the vote fell to 18.6% from 21.7%, and the Liberal Democrats fell to 9.3% from 13.3%. Measured by share of the vote, this was the best performance for both Labour and the Conservatives in any National Assembly election so far. It was the worst performance for Plaid Cymru and the Liberal Democrats. Average turnout across all the constituencies and regions was 41.4%, down 2.0% points from The highest turnout was in Brecon and Radnorshire, where 52.9% of the electorate cast valid ballots. The lowest turnout was in Swansea East, where 31.4% of eligible voters participated. Following the elections, the composition of the Assembly is 36 men and 24 women. The number of women is four fewer than in the 2007 elections and six fewer than in the 2003 election, when there was an equal number of men and women elected. The number of minority ethnic Assembly Members grew from one to two. Vaughan Gething (Labour) is the second minority ethnic candidate to be elected to the Assembly. Mohammad Asghar was elected for Plaid Cymru in 2007 and was re-elected for the Conservatives in Results in Brief Votes (Constituency + Regional) Conservative 427, % 451, % Labour 603, % 751, % Liberal Democrat 258, % 176, % Plaid Cymru 423, % 352, % Others 238, % 166, % Change Seats Conservative Labour Liberal Democrat Plaid Cymru Others Turnout 43.4% 41.4% -2.0% 1
6 National Assembly for Wales seats and share of the vote by party, 1999 to 2011 Conservative Seats Constituency Regional Share 16.2% 19.6% 21.9% 23.8% Constituency 15.8% 19.9% 22.4% 25.0% Regional 16.5% 19.2% 21.5% 22.5% Labour Seats Constituency Regional Share 36.5% 38.3% 30.9% 39.6% Constituency 37.6% 40.0% 32.2% 42.3% Regional 35.4% 36.6% 29.6% 36.9% Liberal Democrat Seats Constituency Regional Share 13.0% 13.4% 13.3% 9.3% Constituency 13.5% 14.1% 14.8% 10.6% Regional 12.5% 12.7% 11.7% 8.0% Plaid Cymru Seats Constituency Regional Share 29.5% 20.5% 21.7% 18.6% Constituency 28.4% 21.2% 22.4% 19.3% Regional 30.5% 19.7% 21.0% 17.9% 2
7 1 Introduction The fourth set of elections to the National Assembly for Wales took place on Thursday, 5 May 2011, simultaneously with elections to the Scottish Parliament, elections to the Northern Ireland Assembly, local authority elections in England, and a referendum on changing the voting system in UK parliamentary elections. The system for electing members to the National Assembly is known as the Additional Member System. Voters are given two ballot papers. The first is used to elect each of 40 constituency Assembly Members (AMs) under the traditional first-past-the-post system. The second ballot paper is used to elect four AMs from each of five electoral regions. These additional members are elected so that the total representation from each geographical area, including those members elected under first-past-the-post, corresponds more closely to the share of the votes cast for each political party in the region. The fourth Assembly elections followed a referendum on extending the law-making powers of the National Assembly 1, held on 3 March The referendum asked the question: "Do you want the Assembly now to be able to make laws on all matters in the 20 subject areas it has powers for? 63.5% of voters voted Yes. The turnout was 35.2%. The outcome of the referendum means the National Assembly can legislate on a larger number of issues than before, though still contained within the same 20 broad headings. The referendum was delivered as part of a coalition deal between Labour and Plaid Cymru, which had governed together in Wales since the last Assembly elections in The fourth Assembly elections were the first to take place since the fall of the Labour Government that had introduced devolved government to Wales in The circumstances of the elections were novel in several respects. It was the first time the Welsh Labour Party faced elections without a Labour government in Westminster, the first time Plaid Cymru faced Assembly elections as a party of government, and the first time the Conservatives and Liberal Democrats faced elections as members of a coalition government in Westminster. Prior to these elections there was an interesting symmetry between the balance of power in the UK Parliament and the Welsh Assembly. Of the four major political parties in Wales, the two that were in government in the Assembly were in opposition in Westminster, and the two that were in government in Westminster were in opposition in the Assembly. In both coalition partnerships it was the major partner that gained votes and seats in the 2011 Assembly elections, while the minor partner lost electoral support. Measured by share of the vote, it was the most successful Assembly election so far for both Labour and the Conservatives, and the worst so far for Plaid Cymru and the Liberal Democrats Labour Labour gained the highest share of the vote with 39.6% of the total vote, 42.3% of the constituency vote and 36.9% of the regional vote. Labour also won the highest number of seats (30), up four compared with the 2007 election. Labour s share of the vote increased by 10.1% points in the constituency ballot and by 7.3% points in the regional ballot. Labour s highest share of the vote in any region was in South Wales West, where their share of the constituency vote increased by 13.6% points, from 41.5% in 2007 to 55.1%. Labour s highest share of the vote in any constituency was in Aberavon, where they won 64.1% of the constituency ballot. 1 Further information relating to the referendum on extending the law-making powers of the National Assembly can be found in House of Commons Library Standard Note SN/PC/05897, Referendum in Wales: 2 This is true for every measure of share of the vote. See historical results on page 2. 3
8 Labour s electoral support is concentrated in the south east of Wales. Labour won all of the constituencies in South Wales Central and South Wales West, and seven of the eight constituencies in South Wales East. However, Labour s strong performance in the constituency ballot diluted the strength of their regional vote in the allocation of regional list seats under the Additional Member system. They won only two regional list seats, both in the Mid and West Wales electoral region. 1.2 Conservatives The Conservatives polled 23.8% of the total vote, 25.0% of the constituency vote and 22.5 % of the regional vote. They gained two seats, taking their total representation in the Assembly to 14 AMs, making them the second largest party in the Assembly for the first time. The Conservatives highest share of the vote in any region was in North Wales, where their share of the constituency vote increased by 5.6% points, from 25.1% in 2007 to 30.7%. The Conservatives share of the constituency vote increased most significantly in Ynys Mon, where it rose by 16.2% points, from 13.0% to 29.2%. The Conservatives are the only party in the Assembly to have consistently increased their share of the vote in subsequent Assembly elections. Their share of the total vote has increased at every Assembly election since 1999 by an average of 2.5% points. At this election their share of the total vote increased by 1.9% points. The growth in support for the Conservatives at this election was not consistent across Wales however. In South Wales East their share of the total vote increased by less than a fifth of one percentage point and their share of the regional vote fell slightly. 1.3 Plaid Cymru Plaid Cymru polled 18.6% of the total vote, 19.3% of the constituency vote and 17.9 % of the regional vote; their lowest share of the vote in any Assembly election so far and a fall of 3.1% points from their position in They won 11 seats in total, four fewer than in The largest reductions in their share of the vote took place in constituencies in which they have strong support: Dwyfor Meirionnydd (-13.1%), Aberconwy (-12.3%), and Llanelli (-10.7%). Plaid increased their support in some constituencies, notably in Arfon (+4.3%), where they won their highest share of the vote in any constituency, polling 56.7%. 1.4 Liberal Democrats The Liberal Democrats polled 9.3% of the total vote, 10.6% of the constituency vote and 8.0% of the regional vote, winning 5 seats. Overall, this is 4.0% points less and one seat fewer than in 2007, the worst performance for the Liberal Democrats in any Assembly election so far. It is a notable change from their long-term position in Wales, which had been relatively stable. In previous Assembly elections the Liberal Democrats consistently polled between 13.0% and 13.5% of the total vote. The largest reduction in the Liberal Democrats share of the vote took place in Cardiff Central (a constituency with a large student population) where their share of the constituency vote fell by 13.4% points, from 51.2% in 2007 to 37.7% 3. Across the whole of the South Wales Central region, which includes the four Cardiff constituencies, the Liberal Democrats share of the constituency vote by fell 7.7% points. The Liberal Democrats gained support in only three constituencies: Aberconwy, Clwyd South and Clwyd West. Their largest gain was in Aberconwy, where their share of the vote increased by 4.9% points, from 9.3% in 2007 to 14.2%. 3 The apparent discrepancy here is due to rounding. 4
9 1.5 United Kingdom Independence Party The UK Independence Party (UKIP) did not field any constituency candidates and instead invited voters to support them in the regional ballot. UKIP increased their share of the regional ballot in every region. Their share across Wales increased from 3.9% in 2007 to 4.6%. Their strongest regional performance was in South Wales East, where they polled 5.3% of the regional vote. 1.6 Green Party The Green Party s share of the regional vote was unchanged at around 3.5% 4. However their share of the vote increased notably in Cardiff Central and Cardiff West. In Cardiff Central they polled 9.1%, compared with 5.5% in In Cardiff West they polled 8.6%, compared with 5.3% in Across the whole of the South Wales Central region they polled 5.2% of the regional vote, their highest share in any region. 1.7 British National Party The British National Party s (BNP) share of the regional vote declined, from 4.3% in 2007 to 2.4%. Their highest share of the regional vote was in Blaenau Gwent, where they polled 4.9%. Their strongest regional performance was in South Wales East, where they polled 3.6% of the regional vote. 1.8 Turnout The overall turnout across Wales in both the constituency and regional ballots was 41.4%, down 2.0% points from Turnout was highest in Brecon and Radnorshire (52.9%) and lowest in Swansea East (31.4%). The region with the highest turnout was Mid and West Wales, with a turnout of 48.6%. The region with the lowest turnout was South Wales West, where turnout was 37.9%. 1.9 Composition of the Assembly The composition of the Assembly is 36 men and 24 women. The number of women is four fewer than in the 2007 elections and six fewer than in the 2003 elections, when there was an equal number of men and women elected The number of minority ethnic Assembly Members grew from one to two. Vaughan Gething (Labour) is the second minority ethnic candidate to be elected to the Assembly. Mohammad Asghar was first elected for Plaid Cymru in 2007 and was re-elected for the Conservatives in 2011, having become the first AM to cross the floor of the Assembly in December Note on data sources Data in this research paper for the number of votes cast in each ballot and for the electorates in each constituency and region has been provided by local authorities and may differ from figures reported in the media. Turnout is measured as the number of valid votes divided by the electorate. Some Returning Officers include rejected ballots in their calculation of turnout, leading to higher measures of turnout than those reported here. 4 The Green Party s share of the regional vote was 3.47% in 2007 and 3.44% in
10
11 2 Summary of Results Table 1: Election Results, 5 May 2011 Constituency ballot Candidates Votes % of total Seats won Change Conservative , % 6 +1 Labour , % Liberal Democrat , % 1-2 Plaid Cymru , % 5-2 Others 16 27, % 0-1 Total , % 40 Regional ballot Candidates Votes % of total Seats won Change Conservative , % 8 +1 Labour , % 2 0 Liberal Democrat 25 76, % 4 +1 Plaid Cymru , % 6-2 Others , % 0 0 Total , % 20 Total Candidates Votes % of total Seats won Change Conservative , % Labour , % Liberal Democrat , % 5-1 Plaid Cymru , % 11-4 Others , % 0-1 Total 398 1,898, % 60 7
12 Table 2: Election Results, 3 May 2007 Constituency ballot Candidates Votes % of total Seats won Conservative , % 5 Labour , % 24 Liberal Democrat , % 3 Plaid Cymru , % 7 Others 37 80, % 1 Total , % 40 Regional ballot Candidates Votes % of total Seats won Conservative , % 7 Labour , % 2 Liberal Democrat , % 3 Plaid Cymru , % 8 Others , % 0 Total , % 20 Total Candidates Votes % of total Seats won Conservative , % 12 Labour , % 26 Liberal Democrat , % 6 Plaid Cymru , % 15 Others , % 1 Total 487 1,952, % 60 8
13 Table 3: Share of the vote 2011 Assembly election Constituency Region All votes Conservative 25.0% 22.5% 23.8% Labour 42.3% 36.9% 39.6% Liberal Democrat 10.6% 8.0% 9.3% Plaid Cymru 19.3% 17.9% 18.6% Others 2.8% 14.7% 8.7% Total 100.0% 100.0% 100.0% 2007 Assembly election Constituency Region All votes Conservative 22.4% 21.5% 21.9% Labour 32.2% 29.6% 30.9% Liberal Democrat 14.8% 11.7% 13.3% Plaid Cymru 22.4% 21.0% 21.7% Others 8.3% 16.1% 12.2% Total 100.0% 100.0% 100.0% Change Constituency Region All votes Conservative +2.6% +1.1% +1.9% Labour +10.1% +7.2% +8.7% Liberal Democrat -4.2% -3.7% -4.0% Plaid Cymru -3.1% -3.1% -3.1% Others -5.4% -1.5% -3.5% 9
14
15
16 Conservative Seats won Share of the vote Constituency Regional Total Constituency Regional Total Mid and West Wales % 25.2% 26.0% North Wales % 26.8% 28.7% South Wales Central % 22.0% 23.2% South Wales East % 19.6% 20.5% South Wales West % 17.8% 19.0% Total % 22.5% 23.8% Change in share of the vote between 2007 and 2011 by region Mid and West Wales North Wales South Wales Central South Wales East South Wales West Constituency ballot Regional ballot All regions 6% 4% 2% 0% +2% +4% +6% Labour Seats won Share of the vote Constituency Regional Total Constituency Regional Total Mid and West Wales % 22.5% 23.0% North Wales % 32.2% 35.1% South Wales Central % 41.0% 45.5% South Wales East % 45.7% 47.5% South Wales West % 46.5% 50.8% Total % 36.9% 39.6% Change in share of the vote between 2007 and 2011 by region Mid and West Wales North Wales South Wales Central South Wales East South Wales West Constituency ballot Regional ballot All regions 15% 10% 5% 0% +5% +10% +15% 12
17 Liberal Democrats Seats won Share of the vote Constituency Regional Total Constituency Regional Total Mid and West Wales % 12.8% 15.0% North Wales % 5.9% 6.9% South Wales Central % 7.9% 9.2% South Wales East % 6.0% 6.8% South Wales West % 6.9% 7.7% Total % 8.0% 9.3% Change in share of the vote between 2007 and 2011 by region Mid and West Wales North Wales South Wales Central South Wales East South Wales West Constituency ballot Regional ballot All regions 10% 5% 0% +5% +10% Plaid Cymru Seats won Share of the vote Constituency Regional Total Constituency Regional Total Mid and West Wales % 26.8% 28.0% North Wales % 21.4% 22.2% South Wales Central % 13.7% 14.2% South Wales East % 12.1% 12.4% South Wales West % 13.8% 14.4% Total % 17.9% 18.6% Change in share of the vote between 2007 and 2011 by region Mid and West Wales North Wales South Wales Central South Wales East South Wales West Constituency ballot Regional ballot All regions 10% 5% 0% +5% +10% 13
18 3 Constituency Ballot Table 4: Votes and turnout by constituency CON LAB LD PC Others Total Electorate Turnout Majority Mid and West Wales Brecon and Radnorshire 9,444 4,797 12,201 1, ,348 53, % 2,757 Carmarthenshire East and Dinefwr 5,635 8,353 1,339 12, ,828 54, % 4,148 Carmarthen West and South Pembrokeshire 10,095 8,591 1,097 8, ,156 58, % 1,504 Ceredigion 2,755 2,544 10,243 12,020 1,514 29,076 56, % 1,777 Dwyfor Meirionnydd 4,239 2,623 1,000 9,656 3,225 20,743 44, % 5,417 Llanelli 2,880 10, ,279 2,004 26,070 58, % 80 Montgomeryshire 10,026 2,609 7,702 2, ,933 48, % 2,324 Preseli Pembrokeshire 11,541 9,366 2,085 4, ,218 57, % 2,175 North Wales Aberconwy 6,888 5,206 2,873 5, ,288 44, % 1,567 Alyn and Deeside 6,397 11,978 1,725 1, ,769 61, % 5,581 Arfon 2,209 4, , ,664 41, % 5,394 Clwyd South 5,841 8,500 1,977 3, ,037 54, % 2,659 Clwyd West 10,890 6,642 1,846 5, ,153 57, % 4,248 Delyn 7,814 10,695 1,767 2, ,194 53, % 2,881 Vale of Clwyd 7,680 11,691 1,088 2, ,056 56, % 4,011 Wrexham 5,031 8,368 2,692 2, ,687 53, % 3,337 Ynys Mon 7,032 6, , ,067 49, % 2,937 South Wales Central Cardiff Central 3,559 8,954 8,916 1, ,628 64, % 38 Cardiff North 14,602 16,384 1,595 1, ,431 66, % 1,782 Cardiff South and Penarth 7,555 13,814 2,786 3, ,479 75, % 6,259 Cardiff West 7,167 13,067 1,942 5, ,727 64, % 5,900 Cynon Valley 1,531 11, , ,760 52, % 6,515 Pontypridd 3,659 11,864 4,170 3, ,333 60, % 7,694 Rhondda , , ,027 52, % 6,739 Vale of Glamorgan 11,971 15,746 1,513 4, ,254 71, % 3,775 South Wales East Blaenau Gwent 1,066 12, ,098 4,754 20,211 53, % 9,120 Caerphilly 3,368 12,521 1,062 7,597 1,022 25,570 62, % 4,924 Islwyn 2,497 12, ,527 1,115 20,908 54, % 7,589 Merthyr Tydfil and Rhymney 1,224 10,483 2,480 1,701 3,432 19,320 55, % 7,051 Monmouth 15,087 8,970 2,937 2, ,001 64, % 6,117 Newport East 4,500 9,888 3,703 1, ,460 55, % 5,388 Newport West 7,791 12,011 1,586 1, ,014 63, % 4,220 Torfaen 3,306 10, ,716 5,136 22,328 61, % 6,088 South Wales West Aberavon 2,704 12,104 1,278 2, ,879 50, % 9,311 Bridgend 6,724 13,499 1,736 2, ,035 59, % 6,775 Gower 8,002 12,866 2,656 3, ,773 61, % 4,864 Neath 2,780 12, ,346 1,004 23,849 57, % 6,390 Ogmore 2,945 12, , ,264 55, % 9,576 Swansea East 2,754 11,035 1,673 2,346 1,102 18,910 60, % 8,281 Swansea West 5,231 9,885 3,654 3, ,805 62, % 4,654 14
19 Table 5: Seats by majority from highest to lowest percentage majority Majority 1st 2nd Votes Rank % Rank Aberavon David Rees LAB PC 9, % 1 Ogmore Janice Gregory LAB PC 9, % 2 Blaenau Gwent Alun Davies LAB IND 9, % 3 Swansea East Mike Hedges CON CON 8, % 4 Merthyr Tydfil and Rhymney Huw Lewis LAB IND 7, % 5 Islwyn Gwyn Price LAB PC 7, % 6 Cynon Valley Christine Chapman LAB PC 6, % 7 Rhondda Leighton Andrews LAB PC 6, % 8 Pontypridd Mick Antoniw LAB LD 7, % 9 Arfon Alun Ffred Jones PC LAB 5, % 10 Bridgend Carwyn Jones LAB CON 6, % 11 Newport East John Griffiths LAB CON 5, % 12 Torfaen Lynne Neagle LAB IND 6, % 13 Neath Gwenda Thomas LAB PC 6, % 14 Dwyfor Meirionnydd Dafydd Elis-Thomas PC CON 5, % 15 Alyn and Deeside Carl Sargeant LAB CON 5, % 16 Cardiff South and Penarth Vaughan Gething LAB CON 6, % 17 Swansea West Julie James LAB CON 4, % 18 Cardiff West Mark Drakeford LAB CON 5, % 19 Monmouth Nick Ramsay CON LAB 6, % 20 Caerphilly Jeff Cuthbert LAB PC 4, % 21 Newport West Rosemary Butler LAB CON 4, % 22 Gower Edwina Hart LAB CON 4, % 23 Wrexham Lesley Griffiths LAB CON 3, % 24 Vale of Clwyd Ann Jones LAB CON 4, % 25 Clwyd West Darren Millar CON LAB 4, % 26 Carmarthenshire East and Dinefwr Rhodri Glyn Thomas PC LAB 4, % 27 Clwyd South Ken Skates LAB CON 2, % 28 Delyn Sandy Mewies LAB CON 2, % 29 Ynys Mon Ieuan Wyn Jones PC CON 2, % 30 Vale of Glamorgan Jane Hutt LAB CON 3, % 31 Montgomeryshire Russell George CON LD 2, % 32 Brecon and Radnorshire Kirsty Williams LD CON 2, % 33 Preseli Pembrokeshire Paul Davies CON LAB 2, % 34 Aberconwy Janet Finch-Saunders CON PC 1, % 35 Ceredigion Elin Jones PC LD 1, % 36 Carmarthen West and South Pembrokeshire Angela Burns CON LAB 1, % 37 Cardiff North Julie Morgan LAB CON 1, % 38 Llanelli Keith Davies LAB PC % 39 Cardiff Central Jenny Rathbone LAB LD % 40 15
20 Table 6: Share of the vote by constituency CON LAB LD PC Others Total Majority Mid and West Wales Brecon and Radnorshire 33.3% 16.9% 43.0% 6.7% 0.0% 100.0% 9.7% Carmarthenshire East and Dinefwr 20.2% 30.0% 4.8% 44.9% 0.0% 100.0% 14.9% Carmarthen West and South Pembrokeshire 35.9% 30.5% 3.9% 29.7% 0.0% 100.0% 5.3% Ceredigion 9.5% 8.7% 35.2% 41.3% 5.2% 100.0% 6.1% Dwyfor Meirionnydd 20.4% 12.6% 4.8% 46.6% 15.5% 100.0% 26.1% Llanelli 11.0% 39.7% 2.1% 39.4% 7.7% 100.0% 0.3% Montgomeryshire 43.7% 11.4% 33.6% 11.3% 0.0% 100.0% 10.1% Preseli Pembrokeshire 42.4% 34.4% 7.7% 15.5% 0.0% 100.0% 8.0% North Wales Aberconwy 34.0% 25.7% 14.2% 26.2% 0.0% 100.0% 7.7% Alyn and Deeside 28.1% 52.6% 7.6% 7.5% 4.2% 100.0% 24.5% Arfon 12.5% 26.2% 4.5% 56.7% 0.0% 100.0% 30.5% Clwyd South 29.2% 42.4% 9.9% 18.6% 0.0% 100.0% 13.3% Clwyd West 43.3% 26.4% 7.3% 23.0% 0.0% 100.0% 16.9% Delyn 33.7% 46.1% 7.6% 12.6% 0.0% 100.0% 12.4% Vale of Clwyd 33.3% 50.7% 4.7% 11.3% 0.0% 100.0% 17.4% Wrexham 26.9% 44.8% 14.4% 13.9% 0.0% 100.0% 17.9% Ynys Mon 29.2% 26.2% 3.2% 41.4% 0.0% 100.0% 12.2% South Wales Central Cardiff Central 15.1% 37.9% 37.7% 7.2% 2.2% 100.0% 0.2% Cardiff North 42.4% 47.6% 4.6% 5.4% 0.0% 100.0% 5.2% Cardiff South and Penarth 27.5% 50.3% 10.1% 12.1% 0.0% 100.0% 22.8% Cardiff West 25.8% 47.1% 7.0% 20.0% 0.0% 100.0% 21.3% Cynon Valley 8.2% 62.0% 2.6% 27.2% 0.0% 100.0% 34.7% Pontypridd 15.7% 50.8% 17.9% 13.5% 2.1% 100.0% 33.0% Rhondda 4.8% 63.2% 2.5% 29.5% 0.0% 100.0% 33.6% Vale of Glamorgan 36.0% 47.4% 4.5% 12.1% 0.0% 100.0% 11.4% South Wales East Blaenau Gwent 5.3% 64.0% 1.8% 5.4% 23.5% 100.0% 45.1% Caerphilly 13.2% 49.0% 4.2% 29.7% 4.0% 100.0% 19.3% Islwyn 11.9% 57.9% 3.1% 21.7% 5.3% 100.0% 36.3% Merthyr Tydfil and Rhymney 6.3% 54.3% 12.8% 8.8% 17.8% 100.0% 36.5% Monmouth 50.3% 29.9% 9.8% 7.5% 2.5% 100.0% 20.4% Newport East 23.1% 50.8% 19.0% 7.0% 0.0% 100.0% 27.7% Newport West 33.9% 52.2% 6.9% 7.1% 0.0% 100.0% 18.3% Torfaen 14.8% 46.2% 3.8% 12.2% 23.0% 100.0% 27.3% South Wales West Aberavon 14.3% 64.1% 6.8% 14.8% 0.0% 100.0% 49.3% Bridgend 28.0% 56.2% 7.2% 8.6% 0.0% 100.0% 28.2% Gower 29.9% 48.1% 9.9% 12.1% 0.0% 100.0% 18.2% Neath 11.7% 53.4% 4.1% 26.6% 4.2% 100.0% 26.8% Ogmore 14.5% 63.9% 4.9% 16.7% 0.0% 100.0% 47.3% Swansea East 14.6% 58.4% 8.8% 12.4% 5.8% 100.0% 43.8% Swansea West 24.0% 45.3% 16.8% 13.9% 0.0% 100.0% 21.3% 16
21 Table 7: Change in share of the vote and turnout by constituency Turnout Change in share of vote Change CON LAB LD PC Others Mid and West Wales Brecon and Radnorshire 52.9% 51.9% +1.1% -0.3% +8.2% -9.2% +1.2% 0.0% Carmarthenshire East and Dinefwr 51.3% 55.7% -4.4% +4.3% +5.5% -1.2% -8.6% 0.0% Carmarthen West and South Pembrokeshire 48.2% 49.7% -1.5% +5.8% +0.8% -2.4% +0.5% -4.7% Ceredigion 51.0% 55.6% -4.6% +1.6% +3.7% -0.9% -7.9% +3.5% Dwyfor Meirionnydd 46.4% 47.4% -0.9% +0.8% +0.2% -3.5% -13.1% +15.5% Llanelli 44.3% 49.2% -4.8% +1.1% +3.7% -1.7% -10.7% +7.7% Montgomeryshire 47.1% 46.1% +1.0% +13.6% +4.5% -5.4% -2.5% -10.1% Preseli Pembrokeshire 47.1% 50.9% -3.8% +3.8% +7.0% -1.6% -9.2% 0.0% North Wales Aberconwy 45.1% 46.9% -1.8% +3.6% +3.9% +4.9% -12.3% 0.0% Alyn and Deeside 36.9% 35.5% +1.3% +5.2% +13.8% -2.3% +0.9% -17.5% Arfon 43.0% 49.1% -6.1% +3.0% -0.6% -2.7% +4.3% -4.0% Clwyd South 36.8% 37.6% -0.8% -0.2% +7.4% +0.4% -1.4% -6.2% Clwyd West 43.4% 45.7% -2.3% +9.3% -1.5% +0.8% -4.4% -4.3% Delyn 43.0% 41.1% +1.9% +1.4% +11.5% -4.7% -2.1% -6.1% Vale of Clwyd 41.0% 40.3% +0.7% -2.7% +14.3% -5.5% -6.2% 0.0% Wrexham 34.9% 38.5% -3.6% +9.7% +16.0% -2.3% +4.3% -27.7% Ynys Mon 48.7% 52.1% -3.4% +16.2% +8.8% -0.2% +1.7% -26.5% South Wales Central Cardiff Central 36.7% 36.2% +0.5% +1.1% +16.0% -13.4% -1.1% -2.5% Cardiff North 51.4% 51.6% -0.2% -2.8% +16.7% -8.1% -2.0% -3.7% Cardiff South and Penarth 36.6% 37.7% -1.1% -0.0% +12.5% -10.2% -2.2% 0.0% Cardiff West 43.2% 41.9% +1.3% +1.0% +8.5% -8.2% -1.2% 0.0% Cynon Valley 36.0% 38.5% -2.5% -2.2% +5.3% -2.5% -0.6% 0.0% Pontypridd 38.9% 40.6% -1.8% +2.8% +9.0% -9.6% -4.3% +2.1% Rhondda 38.1% 42.2% -4.1% -0.3% +4.9% -4.0% -0.6% 0.0% Vale of Glamorgan 46.4% 48.9% -2.5% +2.1% +13.2% -6.6% -1.8% -6.9% South Wales East Blaenau Gwent 38.0% 44.5% -6.6% +1.2% +32.6% -3.9% +0.6% -30.6% Caerphilly 41.2% 42.2% -1.0% +1.9% +14.4% -2.0% +3.9% -18.2% Islwyn 38.1% 43.1% -5.0% +4.3% +20.3% -1.7% +0.1% -23.0% Merthyr Tydfil and Rhymney 35.1% 38.9% -3.8% +0.9% +17.2% -2.4% -3.2% -12.5% Monmouth 46.3% 47.4% -1.1% -1.8% +6.5% -5.0% +0.5% -0.2% Newport East 35.3% 37.5% -2.2% +0.5% +18.7% -8.7% -1.5% -9.0% Newport West 36.4% 40.3% -3.9% -0.7% +11.7% -5.0% -3.3% -2.7% Torfaen 36.5% 37.8% -1.3% -4.7% +3.5% -7.6% +0.3% +8.6% South Wales West Aberavon 37.2% 39.8% -2.6% +4.6% +14.8% -0.3% -2.5% -16.6% Bridgend 40.7% 41.3% -0.6% -1.9% +15.9% -8.0% -6.0% 0.0% Gower 43.2% 45.0% -1.7% +0.1% +13.9% -0.7% -6.4% -6.9% Neath 41.5% 43.4% -2.0% -0.1% +10.0% -5.1% -9.1% +4.2% Ogmore 36.5% 40.1% -3.6% +2.8% +12.3% -4.6% -0.3% -10.3% Swansea East 31.4% 35.2% -3.8% +4.8% +16.9% -8.7% -3.1% -9.9% Swansea West 35.0% 37.3% -2.4% +4.9% +13.0% -9.0% -1.7% -7.2% 17
22 Table 8: Votes and shares by region CON LAB LD PC Others Total Electorate Turnout Mid and West Wales 56,615 49,242 36,215 61,557 6, , , % North Wales 59,782 74,017 15,528 44, , , % South Wales Central 51, ,105 21,911 30,600 1, , , % South Wales East 38,839 89,233 13,640 22,897 16, , , % South Wales West 31,140 85,080 12,965 23,224 2, , , % All regions 237, , , ,907 27, ,253 2,290, % Mid and West Wales 26.9% 23.4% 17.2% 29.3% 3.2% 100.0% North Wales 30.7% 38.0% 8.0% 22.9% 0.5% 100.0% South Wales Central 24.5% 49.9% 10.5% 14.7% 0.5% 100.0% South Wales East 21.5% 49.4% 7.5% 12.7% 9.0% 100.0% South Wales West 20.2% 55.1% 8.4% 15.0% 1.4% 100.0% All regions 25.0% 42.3% 10.6% 19.3% 2.8% 100.0% Table 9: Change in share of the vote by region CON LAB LD PC Others Mid and West Wales +3.8% +4.2% -2.9% -6.4% +1.3% North Wales +5.6% +8.6% -1.2% -2.6% -10.4% South Wales Central +0.4% +11.0% -7.7% -2.0% -1.7% South Wales East +0.8% +14.8% -4.3% -0.2% -11.0% South Wales West +2.1% +13.6% -5.1% -4.4% -6.3% All regions +2.6% +10.1% -4.2% -3.1% -5.4% 18
23 4 Regional Ballot Table 10: Votes and turnout by constituency CON LAB LD PC Others Total Electorate Turnout Mid and West Wales Brecon and Radnorshire 9,181 5,091 8,271 2,071 3,652 28,266 53, % Carmarthenshire East and Dinefwr 4,941 7,419 1,085 11,129 3,273 27,847 54, % Carmarthen West and South Pembrokeshire 9,113 7,769 1,076 6,975 3,232 28,165 58, % Ceredigion 3,718 3,049 7,789 10,596 3,899 29,051 56, % Dwyfor Meirionnydd 4,665 3, ,465 2,593 20,763 44, % Llanelli 3,036 10, ,045 3,183 26,065 58, % Montgomeryshire 8,478 2,489 5,501 2,865 3,572 22,905 48, % Preseli Pembrokeshire 9,773 8,353 1,462 4,238 3,464 27,290 57, % North Wales Aberconwy 6,153 4,905 1,653 4,948 2,625 20,284 44, % Alyn and Deeside 6,018 9,749 1,290 2,042 3,671 22,770 61, % Arfon 1,994 4, ,402 2,313 17,689 41, % Clwyd South 4,853 7,525 1,600 3,435 2,647 20,060 54, % Clwyd West 9,194 5,827 1,356 5,732 3,069 25,178 57, % Delyn 6,819 8,690 1,420 3,044 3,155 23,128 53, % Vale of Clwyd 6,847 9, ,015 3,086 22,950 56, % Wrexham 4,448 6,954 2,127 2,463 2,695 18,687 53, % Ynys Mon 5,875 5, ,620 3,451 24,052 49, % South Wales Central Cardiff Central 3,820 7,778 6,130 1,738 4,241 23,707 64, % Cardiff North 12,471 12,846 2,060 2,836 4,178 34,391 66, % Cardiff South and Penarth 6,467 11,452 2,033 2,973 4,791 27,716 75, % Cardiff West 6,187 10,413 1,523 4,581 5,062 27,766 64, % Cynon Valley 1,378 9, ,254 2,357 18,226 52, % Pontypridd 3,313 10,561 2,435 3,196 3,839 23,344 60, % Rhondda , ,906 2,874 19,996 52, % Vale of Glamorgan 11,254 11,746 1,390 4,122 4,675 33,187 71, % South Wales East Blaenau Gwent 1,404 12, ,869 3,551 20,032 53, % Caerphilly 3,016 11, ,717 3,659 25,560 62, % Islwyn 2,161 10, ,640 3,675 20,937 54, % Merthyr Tydfil and Rhymney 1,554 10,779 1,374 2,363 3,229 19,299 55, % Monmouth 12,717 8,173 2,361 1,891 4,945 30,087 64, % Newport East 4,226 8,691 2,398 1,209 3,072 19,596 55, % Newport West 6,751 9,759 1,303 1,546 3,865 23,224 63, % Torfaen 3,630 10,675 1,147 2,615 4,222 22,289 61, % South Wales West Aberavon 2,030 10, ,391 2,703 18,655 50, % Bridgend 6,184 10,135 1,536 2,281 3,736 23,872 59, % Gower 7,479 10,234 2,027 3,369 3,706 26,815 61, % Neath 2,578 11, ,733 3,148 23,921 57, % Ogmore 2,455 10, ,733 3,283 20,137 55, % Swansea East 2,196 9,902 1,572 2,158 3,216 19,044 60, % Swansea West 4,535 8,418 2,966 2,593 3,425 21,937 62, % 19
24 Table 11: Share of the vote by constituency CON LAB LD PC Others Total Mid and West Wales Brecon and Radnorshire 32.5% 18.0% 29.3% 7.3% 12.9% 100.0% Carmarthenshire East and Dinefwr 17.7% 26.6% 3.9% 40.0% 11.8% 100.0% Carmarthen West and South Pembrokeshire 32.4% 27.6% 3.8% 24.8% 11.5% 100.0% Ceredigion 12.8% 10.5% 26.8% 36.5% 13.4% 100.0% Dwyfor Meirionnydd 22.5% 14.7% 4.7% 45.6% 12.5% 100.0% Llanelli 11.6% 38.8% 2.6% 34.7% 12.2% 100.0% Montgomeryshire 37.0% 10.9% 24.0% 12.5% 15.6% 100.0% Preseli Pembrokeshire 35.8% 30.6% 5.4% 15.5% 12.7% 100.0% North Wales Aberconwy 30.3% 24.2% 8.1% 24.4% 12.9% 100.0% Alyn and Deeside 26.4% 42.8% 5.7% 9.0% 16.1% 100.0% Arfon 11.3% 24.5% 3.7% 47.5% 13.1% 100.0% Clwyd South 24.2% 37.5% 8.0% 17.1% 13.2% 100.0% Clwyd West 36.5% 23.1% 5.4% 22.8% 12.2% 100.0% Delyn 29.5% 37.6% 6.1% 13.2% 13.6% 100.0% Vale of Clwyd 29.8% 39.9% 3.7% 13.1% 13.4% 100.0% Wrexham 23.8% 37.2% 11.4% 13.2% 14.4% 100.0% Ynys Mon 24.4% 23.1% 2.3% 35.8% 14.3% 100.0% South Wales Central Cardiff Central 16.1% 32.8% 25.9% 7.3% 17.9% 100.0% Cardiff North 36.3% 37.4% 6.0% 8.2% 12.1% 100.0% Cardiff South and Penarth 23.3% 41.3% 7.3% 10.7% 17.3% 100.0% Cardiff West 22.3% 37.5% 5.5% 16.5% 18.2% 100.0% Cynon Valley 7.6% 53.4% 2.8% 23.3% 12.9% 100.0% Pontypridd 14.2% 45.2% 10.4% 13.7% 16.4% 100.0% Rhondda 4.3% 54.6% 2.2% 24.5% 14.4% 100.0% Vale of Glamorgan 33.9% 35.4% 4.2% 12.4% 14.1% 100.0% South Wales East Blaenau Gwent 7.0% 62.7% 3.2% 9.3% 17.7% 100.0% Caerphilly 11.8% 44.0% 3.6% 26.3% 14.3% 100.0% Islwyn 10.3% 51.6% 3.1% 17.4% 17.6% 100.0% Merthyr Tydfil and Rhymney 8.1% 55.9% 7.1% 12.2% 16.7% 100.0% Monmouth 42.3% 27.2% 7.8% 6.3% 16.4% 100.0% Newport East 21.6% 44.4% 12.2% 6.2% 15.7% 100.0% Newport West 29.1% 42.0% 5.6% 6.7% 16.6% 100.0% Torfaen 16.3% 47.9% 5.1% 11.7% 18.9% 100.0% South Wales West Aberavon 10.9% 57.2% 4.6% 12.8% 14.5% 100.0% Bridgend 25.9% 42.5% 6.4% 9.6% 15.7% 100.0% Gower 27.9% 38.2% 7.6% 12.6% 13.8% 100.0% Neath 10.8% 48.1% 4.0% 24.0% 13.2% 100.0% Ogmore 12.2% 54.1% 3.8% 13.6% 16.3% 100.0% Swansea East 11.5% 52.0% 8.3% 11.3% 16.9% 100.0% Swansea West 20.7% 38.4% 13.5% 11.8% 15.6% 100.0% 20
25 Table 12: Change in share of the vote and turnout by constituency Turnout Change in share of vote Change CON LAB LD PC Others Mid and West Wales Brecon and Radnorshire 52.8% 51.7% +1.0% -0.5% +5.3% -2.2% -0.6% -2.0% Carmarthenshire East and Dinefwr 51.3% 55.7% -4.3% +3.1% +5.2% -0.4% -4.4% -3.5% Carmarthen West and South Pembrokeshire 48.2% 49.6% -1.4% +3.8% +2.4% -1.9% -1.7% -2.7% Ceredigion 51.0% 55.4% -4.4% +0.3% +2.7% +0.9% -5.1% +1.2% Dwyfor Meirionnydd 46.5% 47.2% -0.7% +3.9% +1.4% -0.5% -4.1% -0.6% Llanelli 44.3% 48.9% -4.6% +1.6% +6.4% -0.9% -5.8% -1.3% Montgomeryshire 47.1% 46.1% +1.0% +4.7% +2.8% +1.1% -3.3% -5.3% Preseli Pembrokeshire 47.2% 50.9% -3.6% +1.3% +6.7% -1.2% -6.7% +0.0% North Wales Aberconwy 45.1% 46.7% -1.6% +1.4% +4.3% +1.0% -8.2% +1.5% Alyn and Deeside 36.9% 35.3% +1.5% +0.3% +6.9% -5.0% +0.8% -3.0% Arfon 43.0% 48.9% -5.9% +1.5% +1.2% -1.7% -3.9% +2.9% Clwyd South 36.8% 37.6% -0.8% -1.9% +8.1% -0.8% -1.4% -4.1% Clwyd West 43.4% 45.6% -2.1% +2.9% +0.9% -0.9% -4.3% +1.4% Delyn 42.8% 41.0% +1.8% -0.4% +7.6% +0.4% -5.6% -2.0% Vale of Clwyd 40.8% 40.1% +0.7% -3.0% +10.3% -3.9% -4.4% +0.9% Wrexham 34.9% 38.2% -3.2% +4.5% +6.9% -6.7% +1.3% -5.9% Ynys Mon 48.7% 51.7% -3.0% +3.3% +3.5% -0.4% -6.2% -0.2% South Wales Central Cardiff Central 36.8% 36.2% +0.6% +0.6% +11.2% -11.1% -1.8% +1.2% Cardiff North 51.4% 51.5% -0.1% -2.8% +10.2% -6.8% -0.8% +0.2% Cardiff South and Penarth 36.9% 37.8% -0.8% -0.2% +10.2% -9.0% -1.2% +0.1% Cardiff West 43.2% 41.6% +1.6% +0.6% +5.6% -6.0% -1.9% +1.7% Cynon Valley 35.0% 38.7% -3.7% +0.4% +2.2% -3.5% +1.8% -0.9% Pontypridd 38.9% 40.5% -1.6% +1.7% +7.5% -6.6% -4.5% +1.9% Rhondda 38.1% 42.2% -4.1% -0.2% +1.7% -2.2% -0.7% +1.4% Vale of Glamorgan 46.3% 48.9% -2.6% +0.8% +7.5% -4.9% -2.3% -1.1% South Wales East Blaenau Gwent 37.6% 43.8% -6.2% +0.2% +18.9% -5.2% -4.0% -9.9% Caerphilly 41.2% 42.0% -0.8% -0.3% +6.7% -2.6% +2.1% -6.0% Islwyn 38.1% 42.9% -4.8% +0.6% +9.3% -3.2% -4.1% -2.6% Merthyr Tydfil and Rhymney 35.1% 38.9% -3.8% +0.4% +13.7% -6.9% -4.6% -2.6% Monmouth 46.4% 47.5% -1.1% -4.0% +6.5% -3.5% +0.3% +0.6% Newport East 35.6% 37.4% -1.8% -0.1% +13.7% -10.6% -2.4% -0.5% Newport West 36.8% 40.4% -3.6% -1.7% +9.0% -5.0% -1.5% -0.9% Torfaen 36.5% 37.8% -1.3% -1.1% +7.5% -6.0% +0.6% -1.0% South Wales West Aberavon 36.8% 39.7% -2.9% +0.8% +11.7% -4.1% -4.8% -3.6% Bridgend 40.4% 41.2% -0.8% +2.3% +10.9% -8.9% -2.0% -2.3% Gower 43.3% 43.9% -0.6% +0.4% +9.8% -2.2% -4.6% -3.4% Neath 41.6% 43.1% -1.5% +0.7% +10.6% -3.2% -5.2% -2.9% Ogmore 36.3% 39.8% -3.5% +1.7% +7.3% -4.3% -2.5% -2.2% Swansea East 31.6% 35.2% -3.6% +2.6% +14.4% -8.8% -4.2% -4.0% Swansea West 35.2% 37.4% -2.2% +2.3% +12.6% -7.9% -4.0% -3.0% 21
26 Table 13: Votes and turnout by region CON LAB LD PC Others Total Electorate Turnout Mid and West Wales 52,905 47,348 26,847 56,384 26, , , % North Wales 52,201 62,677 11,507 41,701 26, , , % South Wales Central 45,751 85,445 16,514 28,606 32, , , % South Wales East 35,459 82,699 10,798 21,850 30, , , % South Wales West 27,457 71,766 10,683 21,258 23, , , % All regions 213, ,935 76, , , ,888 2,290, % Table 14: Share of the vote by region CON LAB LD PC Others Total Mid and West Wales 25.2% 22.5% 12.8% 26.8% 12.8% 100.0% North Wales 26.8% 32.2% 5.9% 21.4% 13.7% 100.0% South Wales Central 22.0% 41.0% 7.9% 13.7% 15.4% 100.0% South Wales East 19.6% 45.7% 6.0% 12.1% 16.7% 100.0% South Wales West 17.8% 46.5% 6.9% 13.8% 15.0% 100.0% All regions 22.5% 36.9% 8.0% 17.9% 14.7% 100.0% Table 15: Change in share of the vote by region CON LAB LD PC Others Mid and West Wales +2.3% +4.1% -0.5% -4.2% -1.7% North Wales +1.2% +5.8% -1.9% -4.3% -0.8% South Wales Central +0.3% +7.0% -6.1% -1.7% +0.5% South Wales East -0.4% +9.9% -5.1% -1.6% -2.9% South Wales West +1.7% +10.7% -5.5% -3.9% -3.1% All regions +1.1% +7.2% -3.7% -3.1% -1.5% Table 16: Difference in share between constituency and regional ballots by region CON LAB LD PC Others Turnout Mid and West Wales +1.8% +0.9% +4.5% +2.5% -9.6% +0.0% North Wales +3.9% +5.8% +2.1% +1.5% -13.2% +0.0% South Wales Central +2.5% +8.9% +2.6% +0.9% -14.9% +0.1% South Wales East +1.9% +3.7% +1.6% +0.6% -7.7% -0.0% South Wales West +2.4% +8.6% +1.5% +1.3% -13.7% +0.0% All regions +2.5% +5.4% +2.5% +1.4% -11.8% +0.0% 22
27 Table 17: Seats won by seat type and region Region Mid & West North South Wales South Wales South Wales Total Wales Wales Central East West Constituency seats Conservative Labour Liberal Democrat Plaid Cymru Independent All parties Regional seats Conservative Labour Liberal Democrat Plaid Cymru Independent All parties All seats Conservative Labour Liberal Democrat Plaid Cymru Independent All parties
28 Appendix Table A1: Constituencies with highest and lowest turnout in each region Region Constituency Turnout Highest turnout Mid and West Wales Brecon & Radnorshire 52.9% North Wales Ynys Mon 48.7% South Wales Central Cardiff North 51.4% South Wales East Monmouth 46.3% South Wales West Gower 43.2% Lowest Turnout Mid and West Wales Llanelli 44.3% North Wales Wrexham 34.9% South Wales Central Cynon Valley 36.0% South Wales East Merthyr Tydfil & Rhymney 35.1% South Wales West Swansea East 31.4% 24
29 Table A2: Largest and smallest constituency majorities by party Constituency Absolute majority Largest Conservative Monmouth 6,117 Labour Ogmore 9,576 Liberal Democrat Brecon and Radnorshire 2,757 Plaid Cymru Dwyfor Meirionnydd 5,417 Smallest Conservative Carmarthen West and South Pembrokeshire 1,504 Labour Cardiff Central 38 Liberal Democrat Brecon and Radnorshire 2,757 Plaid Cymru Ceredigion 1,777 Constituency Percentage majority Largest Conservative Monmouth 20.4% Labour Aberavon 49.3% Liberal Democrat Brecon and Radnorshire 9.7% Plaid Cymru Arfon 30.5% Smallest Conservative Carmarthen West and South Pembrokeshire 5.3% Labour Cardiff Central 0.2% Liberal Democrat Brecon and Radnorshire 9.7% Plaid Cymru Ceredigion 6.1% 25
30 Table A3: Highest and lowest shares of the constituency vote by party Highest Lowest CON Monmouth 50.3% Rhondda 4.8% Montgomeryshire 43.7% Blaenau Gwent 5.3% Clwyd West 43.3% Merthyr Tydfil & Rhymney 6.3% Cardiff North 42.4% Cynon Valley 8.2% LAB Aberavon 64.1% Ceredigion 8.7% Blaenau Gwent 64.0% Montgomeryshire 11.4% Ogmore 63.9% Dwyfor Meirionnydd 12.6% Rhondda 63.2% Brecon & Radnorshire 16.9% LD Brecon & Radnorshire 43.0% Blaenau Gwent 1.8% Cardiff Central 37.7% Llanelli 2.1% Ceredigion 35.2% Rhondda 2.5% Montgomeryshire 33.6% Cynon Valley 2.6% PC Arfon 56.7% Cardiff North 5.4% Dwyfor Meirionnydd 46.6% Blaenau Gwent 5.4% Carmarthen East & Dinefwr 44.9% Brecon & Radnorshire 6.7% Ynys Mon 41.4% Newport East 7.0% 26
31 Table A4: Assembly Members elected, May 2011 Elected Member Constituency Mid and West Wales Brecon and Radnorshire * Kirsty Williams Liberal Democrat Carmarthenshire East and Dinefwr * Rhodri Glyn Thomas Plaid Cymru Carmarthen West and South Pembrokeshire * Angela Burns Conservative Ceredigion * Elin Jones Plaid Cymru Dwyfor Meirionnydd * Dafydd Elis-Thomas Plaid Cymru Llanelli Keith Davies Labour Montgomeryshire Russell George Conservative Preseli Pembrokeshire * Paul Davies Conservative North Wales Aberconwy Janet Finch-Saunders Conservative Alyn and Deeside * Carl Sargeant Labour Arfon * Alun Ffred Jones Plaid Cymru Clwyd South Ken Skates Labour Clwyd West * Darren Millar Conservative Delyn * Sandy Mewies Labour Vale of Clwyd * Ann Jones Labour Wrexham * Lesley Griffiths Labour Ynys Mon * Ieuan Wyn Jones Plaid Cymru South Wales Central Cardiff Central Jenny Rathbone Labour Cardiff North Julie Morgan Labour Cardiff South and Penarth Vaughan Gething Labour Cardiff West Mark Drakeford Labour Cynon Valley * Christine Chapman Labour Pontypridd Mick Antoniw Labour Rhondda * Leighton Andrews Labour Vale of Glamorgan * Jane Hutt Labour South Wales East Blaenau Gwent * Alun Davies Labour Caerphilly * Jeff Cuthbert Labour Islwyn Gwyn Price Labour Merthyr Tydfil and Rhymney * Huw Lewis Labour Monmouth * Nick Ramsay Conservative Newport East * John Griffiths Labour Newport West * Rosemary Butler Labour Torfaen * Lynne Neagle Labour South Wales West Aberavon David Rees Labour Bridgend * Carwyn Jones Labour Gower * Edwina Hart Labour Neath * Gwenda Thomas Labour Ogmore * Janice Gregory Labour Swansea East Mike Hedges Labour Swansea West Julie James Labour Regional List Mid and West Wales * Joyce Watson Labour Mid and West Wales Rebecca Evans Labour Mid and West Wales Simon Thomas Plaid Cymru Mid and West Wales William Powell Liberal Democrat North Wales * Mark Isherwood Conservative North Wales Llyr Gryffudd Plaid Cymru North Wales Antoinette Sandbach Conservative North Wales Aled Roberts Liberal Democrat South Wales Central * David Melding Conservative South Wales Central * Andrew Davies Conservative South Wales Central * Leanne Wood Plaid Cymru South Wales Central John Dixon Liberal Democrat South Wales East * Jocelyn Davies Plaid Cymru South Wales East * William Graham Conservative South Wales East * Mohammad Asghar Conservative South Wales East Lindsay Whittle Plaid Cymru South Wales West Suzy Davies Conservative South Wales West * Bethan Jenkins Plaid Cymru South Wales West Byron Davies Conservative South Wales West * Peter Black Liberal Democrat Party * Assembly Member immediately prior to 2011 election. Of the 60 AMs elected 37 had been been members immediately prior to the 2011 election.
Welsh Assembly. Elections: 6 May MAY 1999
 Welsh Assembly 12 MAY 1999 Elections: 6 May 1999 This paper presents a summary of the results of the first elections to the Welsh Assembly which took place on 6 May 1999. The paper gives information on
Cymru WOMEN IN THE NATIONAL ASSEMBLY STEVE BROOKS & OWAIN AP GARETH APRIL 2016 WITH FOREWORD BY PROF. LAURA MCALLISTER
 Cymru WOMEN IN THE NATIONAL ASSEMBLY STEVE BROOKS & OWAIN AP GARETH APRIL 2016 WITH FOREWORD BY PROF. LAURA MCALLISTER Acknowledgements The Electoral Reform Society Cymru is grateful to all the individuals
Understanding General Election Prof Roger Scully 5 th July 2017
 Understanding General Election 2017 Prof Roger Scully 5 th July 2017 Outline of Session 1. Introduction: What We Know About Elections 2. General Election 2017: the Results 3. The Parties in Wales 4. Why?
MAKING GENDER EQUALITY A REALITY WORKING PARTY
 STAGE ONE REPORT MAKING GENDER EQUALITY A REALITY WORKING PARTY Promoted and printed by Dave Hagendyk for Welsh Labour, both at 1 Cathedral Road, Cardiff CF11 9HA. STAGE ONE REPORT OF THE MAKING GENDER
clickonwales.org / Wales factfile Welsh Democracy 6. Local Government
 Welsh Democracy 6. Local Government The fourth tier of democracy is represented by local government: in Wales, 22 unitary local authorities to which 1,257 councillors are elected by the first past the
Results of the National Assembly for Wales Referendum 2011
 Results of the National Assembly for Wales Referendum 2011 March 2011 This paper provides the results of the National Assembly for Wales Referendum 2011. Including comparisons with results from the 1997
Local Election Results 2008 (updated)
") Local Election Results 2008 (updated) This paper presents the results of the local elections held on 1 May 2008. Figures are provided on overall control of councils and the number of seats won by each
Local Election Results 2008 (updated) This paper presents the results of the local elections held on 1 May 2008. Figures are provided on overall control of councils and the number of seats won by each
Analysis of local election results data for Wales 2004 (including turnout and extent of postal voting)
") Analysis of local election results data for Wales 2004 (including turnout and extent of postal voting) By Professors Michael Thrasher and Colin Rallings of the University of Plymouth Elections Centre Introduction
Analysis of local election results data for Wales 2004 (including turnout and extent of postal voting) By Professors Michael Thrasher and Colin Rallings of the University of Plymouth Elections Centre Introduction
The National Assembly for Wales elections 2003 The official report and results
 November 2003 The National Assembly for Wales elections 2003 The official report and results The Electoral Commission Trevelyan House Great Peter Street London SW1P 2HW Tel 020 7271 0500 Fax 020 7271 0505
Thank you for your request received 27 May in which you asked:
 Resettlement Grants 24 June 2016 Request for Information. Thank you for your request received 27 May in which you asked: Under the Freedom of Information Act, please provide a list of payments to AMs who
Wales: Still a Labour Stronghold but Under Threat?
 Britain Votes (2015) 101 116 JONATHAN BRADBURY* Wales: Still a Labour Stronghold but Under Threat? As analysed elsewhere in this volume, it was not only the Conservative Party, but also territorially-based
MIGRATION TRENDS REPORT
 MIGRATION TRENDS REPORT Migration Flows and Population Trends in Wales AUTHOR: Dr Yvonni Markaki PUBLISHED: February 2017 revision http://www.wrc.wales/migration-information This report is the third of
CARDIFF CAPITAL REGION CITY DEAL REGIONAL CABINET MEETING
 CARDIFF CAPITAL REGION CITY DEAL REGIONAL CABINET MEETING MINUTES REGIONAL CABINET MEETING: 20 NOVEMBER 2017 Regional Cabinet Members Present: Cllr Nigel Daniels, Leader - Blaenau Gwent Council Michelle
Political Dimension of Welsh Identity after Devolution:
 Polish Political Science Yearbook vol. 45 (2016), pp. 353 366 DOI: 10.15804/ppsy2016026 PL ISSN 0208-7375 University of Szczecin (Poland) Political Dimension of Welsh Identity after Devolution: Fact or
The Local Elections Media Briefing. Wednesday 18 th April
 The Local Elections Media Briefing Wednesday 18 th April English Local Elections 2012 Colin Rallings & Michael Thrasher The Elections Centre University of Plymouth 2011 Outcome 1 Con Lab LD 2007 National
Valuation Tribunal for Wales
 Valuation Tribunal for Wales Council Tax Reduction Appeals A guide to our Decision Notice This guide does not cover every point about the Valuation Tribunal. We do not have to follow everything in this
Valuation Tribunal for Wales
 Valuation Tribunal for Wales Council Tax Reduction Appeals A guide to our Acknowledgement Notice This guide does not cover every point about the Valuation Tribunal. We do not have to follow everything
Appointment of the nonexecutive. Wales Audit Office Board
 National Assembly for Wales Finance Committee Appointment of the nonexecutive Members of the Wales Audit Office Board January 2019 www.assembly.wales The National Assembly for Wales is the democratically
Public attitudes to dual candidacy. in elections to the. National Assembly for Wales
 Public attitudes to dual candidacy in elections to the National Assembly for Wales Occasional Paper No.5 The Bevan Foundation Aneurin Bevan House 40 Castle Street Tredegar Blaenau Gwent NP22 3DQ Tel /
COUNCIL TAX VALUATION LIST 2005
 COUNCIL TAX VALUATION LIST 2005 A guide to our NOTICE OF ACKNOWLEDGEMENT OF APPEAL This guide does not cover every point about the Valuation Tribunal. We do not have to follow everything in this guide
How Labour s position on a People s Vote affects its support in Leave-voting marginals. Analysis from Represent Us based on polling from ICM
 How Labour s position on a People s Vote affects its support in Leave-voting marginals Analysis from Represent Us based on polling from ICM Labour will vote against the Prime Minister s deal but its stance
Valuation Tribunal for Wales
 Valuation Tribunal for Wales Non-domestic Rating List 2010 A guide to our NOTICE OF HEARING ISBN 978 0 7504 5590 9 Crown copyright 2011 CMK-22-08-063 F0471011 WHAT IS A NOTICE OF HEARING? The notice of
Active Travel: The Start of the Journey
 National Assembly for Wales Enterprise and Business Committee Active Travel: The Start of the Journey February 2016 The National Assembly for Wales is the democratically elected body that represents the
Gender-based Violence, Domestic Abuse and Sexual Violence (Wales) Bill: Stage 1 Committee Report
 Bill: Stage 1 Committee Report") Communities, Equality and Local Government Committee Gender-based Violence, Domestic Abuse and Sexual Violence (Wales) Bill: Stage 1 Committee Report November 2014 The National Assembly for Wales is the
Communities, Equality and Local Government Committee Gender-based Violence, Domestic Abuse and Sexual Violence (Wales) Bill: Stage 1 Committee Report November 2014 The National Assembly for Wales is the
Welsh Women s Aid Quarter /18 (April-June 2017) Data from Specialist Services in Wales Regional Report. Welsh Women s Aid, August 2017
 Data from Specialist Services in Wales Regional Report. Welsh Women s Aid, August 2017") Welsh Women s Aid Quarter 7/8 (April-June 7) Data from Specialist Services in Wales Regional Report Welsh Women s Aid, August 7 Welsh Women s Aid Who we are Established in 978, Welsh Women s Aid is the
Welsh Women s Aid Quarter 7/8 (April-June 7) Data from Specialist Services in Wales Regional Report Welsh Women s Aid, August 7 Welsh Women s Aid Who we are Established in 978, Welsh Women s Aid is the
NATIONAL ASSEMBLY FOR WALES
 NATIONAL ASSEMBLY FOR WALES REGISTER OF MEMBERS' FINANCIAL AND OTHER INTERESTS AND RECORD OF MEMBERSHIP OF SOCIETIES REPORT OF THE REGISTER OF MEMBERS' FINANCIAL OR OTHER INTERESTS [top] UPDATED 31 MARCH
Equality of Opportunity Committee Report Summary
 Cynulliad Cenedlaethol Cymru National Assembly for Wales Equality of Opportunity Committee Report Summary Issues affecting migrant workers in Wales, their families and the communities in which they live
Why Wales Said Yes The 2011 Referendum. Roger Scully Aberystwyth, 24 th June 2011
 Why Wales Said Yes The 2011 Referendum Roger Scully Aberystwyth, 24 th June 2011 Outline of Seminar 1. Introduction 2. The 2011 Referendum: the Result 3. The 2011 Welsh Referendum Study 4. The Referendum
National Assembly for Wales Finance Committee. Consideration of the consultation on the Draft Public Services Ombudsman (Wales) Bill
 Bill") National Assembly for Wales Finance Committee Consideration of the consultation on the Draft Public Services Ombudsman (Wales) Bill March 16 The National Assembly for Wales is the democratically elected
National Assembly for Wales Finance Committee Consideration of the consultation on the Draft Public Services Ombudsman (Wales) Bill March 16 The National Assembly for Wales is the democratically elected
 www.newsflashenglish.com The 4 page 60 minute ESL British English lesson 15/04/15 Election. Voters will go to the polls on Thursday 7 th May 2015. On the same day local elections will also take There are
Cardiff Capital Region Youth Profile. Lorena Axinte July 2017
 Cardiff Capital Region Youth Profile Lorena Axinte July 2017 THE CASE FOR A REGIONAL YOUTH PROFILE CARDIFF CAPITAL REGION AND ITS FUTURE GENERATIONS This Youth Profile represents an attempt to raise awareness
2017 general election Urban-Rural differences
 2017 general election Urban-Rural differences THE POLITICAL GEOGRAPHY OF THE 2017 GENERAL ELECTION 1 Table of Contents I. Urban-Rural classifications... 3 II. Vote share patterns by Rural-Urban ype...
The sure bet by Theresa May ends up in a hung Parliament
 The sure bet by Theresa May ends up in a hung Parliament Vincenzo Emanuele and Bruno Marino June 9, 2017 The decision by the British Prime Minister, Theresa May, to call a snap election to reinforce her
Wales and the Brexit Vote
 Revue Française de Civilisation Britannique French Journal of British Studies XXII-2 2017 The Brexit Referendum of 23 June 2016 Wales and the Brexit Vote Le pays de Galles et le vote pour le Brexit Moya
Election Statistics: UK
 1 FEBRUARY 2008 Election Statistics: UK 1918-2007 This paper summarises the results of UK elections since 1918. It focuses on elections to Westminster and includes statistics on voting at general and by-elections,
Government and Politics
 General Certificate of Education Advanced Subsidiary Examination January 2010 Government and Politics GOVP1 Unit 1 People, Politics and Participation Thursday 14 January 2010 9.00 am to 10.30 am For this
Easy Read Creating a Parliament for Wales
 Easy Read Creating a Parliament for Wales We want to know what you think Please tell us by 6 April 2018 This is an easy read version of Creating a Parliament for Wales consultation. February 2018 How to
Of the 73 MEPs elected on 22 May in Great Britain and Northern Ireland 30 (41 percent) are women.
 are women.") Centre for Women & Democracy Women in the 2014 European Elections 1. Headline Figures Of the 73 MEPs elected on 22 May in Great Britain and Northern Ireland 30 (41 percent) are women. This represents a
Centre for Women & Democracy Women in the 2014 European Elections 1. Headline Figures Of the 73 MEPs elected on 22 May in Great Britain and Northern Ireland 30 (41 percent) are women. This represents a
Finance Committee. Appointment of the non-executive Members and Chair of the Wales Audit Office Board. July National Assembly for Wales
 Finance Committee Appointment of the non-executive Members and Chair of the Wales Audit Office Board July 2017 National Assembly for Wales Finance Committee The National Assembly for Wales is the democratically
3. Since then there have been significant changes to the Committee s membership. These are attached at Annex 1.
 Agriculture and Rural Development Committee REPORT TO PLENARY UNDER STANDING ORDER 9.9: JUNE 1999 TO MAY 2003 INTRODUCTION 1. The Agriculture and Rural Development Committee is one of the Assembly s seven
Compare the vote Level 3
 Compare the vote Level 3 Elections and voting Not all elections are the same. We use different voting systems to choose who will represent us in various parliaments and elected assemblies, in the UK and
Compare the vote Level 1
 Compare the vote Level 1 Elections and voting Not all elections are the same. We use different voting systems to choose who will represent us in various parliaments and elected assemblies, in the UK and
Towards a hung Parliament? The battleground of the 2017 UK general election
 Towards a hung Parliament? The battleground of the 2017 UK general election June 5, 2017 On the next 8 th June, UK voters will be faced with a decisive election, which could have a profound impact not
Standard Note: SN/SG/1467 Last updated: 3 July 2013 Author: Aliyah Dar Section Social and General Statistics
 Elections: Turnout Standard Note: SN/SG/1467 Last updated: 3 July 2013 Author: Aliyah Dar Section Social and General Statistics This note looks at turnout in UK elections. The extent to which voters turnout
Have women born outside the UK driven the rise in UK births since 2001?
 Have women born outside the UK driven the rise in UK births since 2001? Nicola Tromans, Eva Natamba, Julie Jefferies The number of births 1 in the UK has increased each year since 2001. This article examines
The potential impact of the UK Government s Police Reform and Social Responsibility Bill for community safety in Wales
 Communities and Culture Committee The potential impact of the UK Government s Police Reform and Social Responsibility Bill for community safety in Wales February 2011 The National Assembly for Wales is
freshwater Local election May 2017 results
 freshwater May 2017 Local election results www.freshwater-uk.com @FWpublicaffairs Introduction While the results of local elections do not directly transfer to the same results in a general election, the
After the Scotland Act (1998) new institutions were set up to enable devolution in Scotland.
 new institutions were set up to enable devolution in Scotland.") How does devolution work in Scotland? After the Scotland Act (1998) new institutions were set up to enable devolution in Scotland. The Scottish Parliament The Scottish Parliament is made up of 73 MSPs
How does devolution work in Scotland? After the Scotland Act (1998) new institutions were set up to enable devolution in Scotland. The Scottish Parliament The Scottish Parliament is made up of 73 MSPs
SPICe Briefing European Parliament Election 2014
 The Scottish Parliament and Scottish Parliament Infor mation C entre l ogos. SPICe Briefing European Parliament Election 2014 Andrew Aiton and Iain McIver 30 May 2014 This briefing provides details of
Election 2010: Where the Women Candidates Are
 Election 2010: Where the Women Candidates Are A Report from the Centre for Women & Democracy April 2010 Election 2010: Where the Women Candidates Are This report looks at the numbers and percentages of
Executive Summary The AV Referendum in context The Voter Power Index 6. Conclusion 11. Appendix 1. Summary of electoral systems 12
 Executive Summary 1 Voter Power under First Past the Post 2 The effect of moving to the Alternative Vote 2 The VPI website 2 1. The AV Referendum in context 3 The referendum options 3 First Past the Post
The Local Elections. Media Briefing Pack. 18 th April, 2012
 The Local Elections Media Briefing Pack 18 th April, 2012 Colin Rallings and Michael Thrasher, Professors of Politics, Elections Centre, University of Plymouth John Curtice, Professor of Politics, University
Review of Ofcom list of major political parties for elections taking place on 22 May 2014 Statement
 Review of Ofcom list of major political parties for elections taking place on 22 May 214 Statement Statement Publication date: 3 March 214 1 Contents Section Annex Page 1 Executive summary 3 2 Review of
The Experiences and Aspirations of Young People in Rural Wales
 The Experiences and Aspirations of Young People in Rural Wales 2013 TABLE OF CONTENTS Contents 1 Section 1 Introduction and methods 2 Section 2 Time related and geographical analysis of official data 6
Snap! Crackle... Pop? The UK election's meaning for sterling
 Snap! Crackle... Pop? The UK election's meaning for sterling Jeremy Cook Chief Economist and Head of Currency Strategy Called by Theresa May a little after Easter as a need to heal divisions within Westminster
National Assembly for Wales Europe Matters. Produced by the National Assembly for Wales EU office. Issue 13 May/June
 National Assembly for Wales Europe Matters Produced by the National Assembly for Wales EU office Issue 13 May/June The National Assembly for Wales is the democratically elected body that represents the
Political strategy CONSULTATION REPORT. Public and Commercial Services Union pcs.org.uk
 Political strategy CONSULTATION REPORT Public and Commercial Services Union pcs.org.uk Introduction In 2015, PCS launched a strategic review in response to the new challenges we face. The central aim of
The UK General Election 2010 In-depth
 House of Commons The UK General Election 2010 In-depth Report and Analysis The UK General Election 2010 In-depth Report and Analysis Foreword This report has been produced by the Electoral Reform Society
Elections in Britain
 Elections in Britain Also by Dick Leonard THE BACKBENCHER AND PARLIAMENT (co-editor with Valentine Herman) CROSLAND AND NEW LABOUR (editor) THE ECONOMIST GUIDE TO THE EUROPEAN UNION GUIDE TO THE GENERAL
Local Government Elections 2017
 SPICe Briefing Pàipear-ullachaidh SPICe Local Government Elections 2017 Andrew Aiton and Anouk Berthier This briefing looks at the 2017 local government elections including turnout, results, the gender
Scottish Parliamentary election
 5 MAY Scottish Parliamentary election and Referendum on the voting system used to elect MPs to the House of Commons aboutmyvote.co.uk About this booklet On Thursday 5 May 2011, there will be: an election
REPORT OF THE WELSH POLICY FORUM
 REPORT OF THE WELSH POLICY FORUM Policy Process 2017-2021 Promoted and printed by Dave Hagendyk for Welsh Labour both at 1 Cathedral Road, Cardiff. 1. INTRODUCTION. 1.1 Welsh Labour Conference 2016 agreed
FINAL REPORT. South Wales Central National Assembly for Wales Election 5th May 2016
 FINAL REPORT South Wales Central National Assembly for Wales Election 5th May 2016 Dr John Ault 18 th May 2016 National Assembly for Wales Elections May 5 th 2016 Report on Election Observation South Wales
Sun On Sunday Campaign Poll 4. May-June 2017
 Choice Matters. Sun On Sunday Campaign Poll MayJune 0 Fieldwork dates: st May nd June 0 Interview method: Online Population effectively sampled: All GB adults aged + Online Sampling Method: A nationally
Children, Young People and Education Committee What type of youth service does Wales want? Report of the inquiry into Youth Work
 Children, Young People and Education Committee What type of youth service does Wales want? Report of the inquiry into Youth Work December 2016 National Assembly for Wales Children, Young People and Education
Local elections. Referendum on the voting system used to elect MPs to the House of Commons
 5 MAY Local elections and Referendum on the voting system used to elect MPs to the House of Commons aboutmyvote.co.uk About this booklet On Thursday 5 May 2011, there will be a referendum on the voting
Missing Voices How do people across Wales feel about politics?
 Missing Voices How do people across Wales feel about politics? Jess Blair and Mat Mathias December 2017 1867 direct engagements on social media Participants Male: 331, Female: 468, Other: 1 Focus Group
Standing for office in 2017
 Standing for office in 2017 Analysis of feedback from candidates standing for election to the Northern Ireland Assembly, Scottish council and UK Parliament November 2017 Other formats For information on
YouGovR. YouGov / Sunday Times Survey Results. Sample Size: 1118 Fieldwork: 15th - 17th August 2007 For full results click here
 YouGov / Survey Results Sample Size: 1118 Fieldwork: 15th - 17th August 2007 For full results click here If there were a UK general election tomorrow, which party would you vote for? (excluding Don't Knows
The Guardian. Campaign Poll 8, May 2017
 Choice Matters. The Guardian Campaign Poll, May 0 Fieldwork dates: th May 0 Interview method: Online Population effectively sampled: All GB adults aged + Online Sampling Method: A nationally representative
Electoral franchise: who can vote?
 Electoral franchise: who can vote? Standard Note: SN/PC/2208 Last updated: 1 March 2005 Author: Chris Sear Parliament and Constitution Centre A person can only vote if they are registered to vote and they
D Hondt system for allocation of parliamentary positions 22 March 2016
 L&RS NOTE D Hondt system for allocation of parliamentary positions 22 March 2016 Introduction Named after a Belgian lawyer and mathematician, the D Hondt system is a form of proportional representation
Final Results 2016 GLA ELECTIONS ELECTION OF THE LONDON ASSEMBLY MEMBERS
 ELECTION OF THE LONDON ASSEMBLY MEMBERS Declaration of Results of Poll I hereby give notice as Greater London Returning Officer at the election of the London Wide Assembly held on 5th May 2016 that the
National Assembly for Wales Constitutional and Legislative Affairs Committee. Making Laws in Wales. October 2015
 National Assembly for Wales Constitutional and Legislative Affairs Committee Making Laws in Wales October 2015 The National Assembly for Wales is the democratically elected body that represents the interests
Questions for oral answer on a future day
 Published: Monday 21 January 2019 Questions for oral answer on a future day (Future Day Orals) Questions for oral answer on a future day as of Monday 21 January 2019. T Indicates a topical question. Members
Reading the local runes:
 Reading the local runes: What the 2011 council elections suggest for the next general election By Paul Hunter Reading the local runes: What the 2011 council elections suggest for the next general election
Nomination of Auditor General for Wales
 National Assembly for Wales Finance Committee Nomination of Auditor General for Wales March 2018 www.assembly.wales The National Assembly for Wales is the democratically elected body that represents the
General Election The Election Results Guide
 General Election 2017 The Election Results Guide Contents 1. Overview 2. What It Means 3. Electoral Map 4. Meet the New MPs Overview 320 318 261 Conservatives 270 Labour SNP 220 Liberal Democrats 170 DUP
The Alternative Vote Referendum: why I will vote YES. Mohammed Amin
 The Alternative Vote Referendum: why I will vote YES By Mohammed Amin Contents The legislative framework...2 How the first past the post system works...4 How you vote...5 How the votes are counted...5
4 However, devolution would have better served the people of Wales if a better voting system had been used. At present:
 Electoral Reform Society Wales Evidence to All Wales Convention SUMMARY 1 Electoral Reform Society Wales will support any moves that will increase democratic participation and accountability. Regardless
Government and Politics GOVP1. General Certificate of Education Advanced Subsidiary Examination June People, Politics and Participation
 A Government and Politics General Certificate of Education Advanced Subsidiary Examination June 2015 Unit 1 People, Politics and Participation GOVP1 Monday 1 June 2015 9.00 am to 10.30 am For this paper
Disproportionality and bias in the results of the 2005 general election in Great Britain: evaluating the electoral system s impact
 Disproportionality and bias in the results of the 2005 general election in Great Britain: evaluating the electoral system s impact Ron Johnston School of Geographical Sciences, University of Bristol David
Voting at the Northern Ireland Assembly Election, 2003.
 Voting at the Northern Ireland Assembly Election, 2003. Colin Rallings and Michael Thrasher Local Government Chronicle Elections Centre University of Plymouth This report for the Electoral Commission considers
ELECTORAL REGULATION RESEARCH NETWORK/DEMOCRATIC AUDIT OF AUSTRALIA JOINT WORKING PAPER SERIES
 ELECTORAL REGULATION RESEARCH NETWORK/DEMOCRATIC AUDIT OF AUSTRALIA JOINT WORKING PAPER SERIES ALTERNATIVE VOTING PLUS: A PROPOSAL FOR THE SOUTH AUSTRALIAN HOUSE OF ASSEMBLY 1 Daniel Messemaker (BA (Hons)
The 2004 European Parliamentary elections in the United Kingdom
 December 2004 The 2004 European Parliamentary elections in the United Kingdom The official report Translations and other formats For information on obtaining this publication in another language or in
2010 British Election Study. Technical Report. August Nicholas Howat, Oliver Norden, and Emily Pickering. Controlled Document Issue 3
 2010 British Election Study Technical Report Nicholas Howat, Oliver Norden, and Emily Pickering August 2011 Controlled Document Issue 3 Cert No. 0498 Content 1. Introduction...3 2. Sample...5 2.1 Selection
Statutory guidance in relation to part 7 (Safeguarding) of the Social Services and Well-being (Wales) Act 2014,
 of the Social Services and Well-being (Wales) Act 2014,") Statutory guidance in relation to part 7 (Safeguarding) of the Social Services and Well-being (Wales) Act 2014, Annex F including Adult Protection and Support Orders, the duty to report and enquire, Safeguarding
Statutory guidance in relation to part 7 (Safeguarding) of the Social Services and Well-being (Wales) Act 2014, Annex F including Adult Protection and Support Orders, the duty to report and enquire, Safeguarding
ANNEX TO THE REPORT APPENDIX 1: DETAILS OF ASSMBLY MEMBER INTERVIEWEES APPENDIX 2: LOCAL GOVERNMENT SAMPLE AND STATISTICS
 ANNEX TO THE REPORT APPENDIX 1: DETAILS OF ASSMBLY MEMBER INTERVIEWEES APPENDIX 2: LOCAL GOVERNMENT SAMPLE AND STATISTICS APPENDIX 3: CONFERENCE PROGRAMMES APPENDIX 4: DISSEMINATION CONFERENCE PROGRAMME
A Betrayal in Waiting? Plaid Cymru, the SNP and the Scottish Referendum
 A Betrayal in Waiting? Plaid Cymru, the SNP and the Scottish Referendum The fortunes of the Scottish National Party (SNP) have surely never been better than now. The party has been in government in Scotland
a division of the United Kingdom; a principality forming the south-western part of Great Britain.
 Topic Page: Wales Definition: Wales from The Macquarie Dictionary a division of the United Kingdom; a principality forming the south-western part of Great Britain. 2 20~768 km English and Welsh Cardiff
CURRENT POLICE FORCE STRUCTURE IN WALES. There are four police forces in Wales. These are:
 CURRENT POLICE FORCE STRUCTURE IN WALES There are four police forces in Wales. These are: North Wales Dyfed Powys South Wales Gwent ANNEX 5 Map 1 shows the Police Force areas and the Basic Command Units
Introduction for non-party campaigners
 Introduction Introduction for non-party campaigners This document is for individuals and organisations who are thinking of campaigning in the run-up to elections but who are not standing as a political
TOSCAFUND January 2015
 TOSCAFUND January 2015 Toscafund Discussion Paper The 2015 UK Election Outcome Authors: Professor Richard Rose and Dr Savvas Savouri Toscafund Asset Management LLP 90 Long Acre t: +44 (0) 20 7845 6100
Political Statistics, Devolution and Electoral Systems
 Political Statistics, Devolution and Electoral Systems John Martyn My interest is in obtaining a better understanding of Scottish devolution and how this might impact on the political integrity of the
Who runs Wales? 2011 A century of steps towards gender equality
 Who runs Wales? 2011 A century of steps towards gender equality A century of International Women s Day The International Conference of Working Women in 1910 voted on a proposal to create an International
GOVERNMENT AND POLITICS GOV1
 General Certificate of Education June 2007 Advanced Subsidiary Examination GOVERNMENT AND POLITICS Unit 1 Electoral Systems and Voting Behaviour GOV1 Tuesday 5 June 2007 1.30 pm to 2.30 pm For this paper
The Guardian July 2017 poll
 Choice Matters. The Guardian July 0 poll Fieldwork dates: th July 0 Interview method: Online Population effectively sampled: All GB adults aged + Online Sampling Method: A nationally representative sample
Electoral reform in local government in Wales - Consultation
 Briefing 17-35 September 2017 Electoral reform in local government in Wales - Consultation To: All Chief Executives, Main Contacts and APSE Contacts in Wales Key Options Voting Age Reduced to 16 Current
Party Lists and Preference Voting
 Party Lists and Preference Voting I.D. Hill d.hill928@btinternet.com Abstract Elections by party lists, where voting is just by choosing a single party, can lead to unrepresentative results because of
COUNCIL: 30 JUNE 2016
 CITY & COUNTY OF CARDIFF DINAS A SIR CAERDYDD COUNCIL: 30 JUNE 2016 REPORT OF INTERIM MONITORING OFFICER COMMITTEE MEMBERSHIP Reason for Report 1. To report to Council on the current membership of Committees