European Parliament Elections 2009
|
|
|
- Candace Warner
- 6 years ago
- Views:
Transcription

1 European Parliament Elections 2009 RESEARCH PAPER 09/53 17 June 2009 Elections to the European Parliament were held across the 27 states of the European Union between 4 and 7 June The UK elections were held concurrently with the county council elections in England on 4 June. The UK now has 72 MEPs, down from 78 at the last election, distributed between 12 regions. The Conservatives won 25 seats, both UKIP and Labour 13 and the Liberal Democrats 11. The Green Party held their two seats, while the BNP won their first two seats in the European parliament. Labour lost five seats compared with the comparative pre-election position. The Conservatives won the popular vote overall, and every region in Great Britain except the North East, where Labour won, and Scotland, where the SNP won. UKIP won more votes than Labour. UK turnout was 34.5%. Across Europe, centre-right parties, whether in power or opposition, tended to perform better than those on the centre-left. The exact political balance of the new Parliament depends on the formation of Groups. The UK was not alone in seeing gains for far-right and nationalistic parties. Turnout across the EU was 43%. It was particularly low in some of the newer Member States. Part 1 of this paper presents the full results of the UK elections, including regional analysis and local-level data. Part 2 presents summary results of the results across the EU, together with country-level summaries based on data from official national sources. Adam Mellows-Facer Richard Cracknell Sean Lightbown
2 Recent Research Papers 09/41 Green Energy (Definition and Promotion) Bill [Bill 15 of ] /42 Equality Bill [Bill 85 of ] /43 Unemployment by Constituency, April /44 Election timetables /45 Local Democracy, Economic Development and Construction Bill [HL]: Democracy and involvement aspects [Bill 93 of ] 09/46 Local Democracy, Economic Development and Construction Bill [HL]: Economic, Regional and Construction Aspects [Bill 93 of ] 09/47 Borders, Citizenship and Immigration Bill [HL] [Bill 86 of ] /48 Health Bill [HL] (excluding tobacco provisions) [Bill 97 of ] /49 Health Bill [HL] (tobacco control provisions) [Bill 97 of ] /50 Economic Indicators, June /51 War and Peace in Sri Lanka /52 Autism Bill: Committee Stage Report /54 Local Elections /55 The Departmental Select Committee System /56 Marine and Coastal Access Bill [HL] [Bill 108 of ] Research Paper 09/53 Contributing Authors: Adam Mellows-Facer, Richard Cracknell, and Sean Lightbown, Social and General Statistics This information is provided to Members of Parliament in support of their parliamentary duties and is not intended to address the specific circumstances of any particular individual. It should not be relied upon as being up to date; the law or policies may have changed since it was last updated; and it should not be relied upon as legal or professional advice or as a substitute for it. A suitably qualified professional should be consulted if specific advice or information is required. This information is provided subject to our general terms and conditions which are available online or may be provided on request in hard copy. Authors are available to discuss the content of this briefing with Members and their staff, but not with the general public. We welcome comments on our papers; these should be ed to papers@parliament.uk. ISSN
3 Contents Summary 1 1 Results in the United Kingdom Results summary Turnout The d Hondt system Results at regional level 6 Great Britain summary 7 North East 8 North West 9 Yorkshire and the Humber 10 East Midlands 11 West Midlands 12 East 13 London 14 South East 15 South West 16 Wales 17 Scotland 18 Northern Ireland Results at local level Characteristics of UK MEPs 22 2 Results across the EU Turnout Seats in the European Parliament Women and Men in the European Parliament Country-level analysis 26 Austria 27 Belgium 27 Bulgaria 28 Cyprus 28 Czech Republic 29 Denmark 29
4 Estonia 30 Finland 30 France 31 Germany 31 Greece 32 Hungary 32 Ireland 33 Italy 33 Latvia 34 Lithuania 34 Luxembourg 35 Malta 35 Netherlands 36 Poland 36 Portugal 37 Romania 37 Slovakia 38 Slovenia 38 Spain 39 Sweden 39 United Kingdom 40 3 Appendices 41 Appendix 1: EP election results at local level, Great Britain 41 Appendix 2: UK MEPs by party 51
5 RESEARCH PAPER 09/53 Summary Elections to the European Parliament were held across the 27 states of the European Union between 4 and 7 June Results in the UK The UK elections were held concurrently with county council elections in England on 4 June. The UK now has 72 MEPs, down from 78 at the last election, distributed between 12 regions. The Conservatives won 25 seats, both UKIP and Labour 13 and the Liberal Democrats 11. The Green Party held their two seats, while the BNP won their first two seats in the European Parliament. Labour lost five seats compared with the comparative preelection position. Across Great Britain, the Conservatives were first with 27.7% of the vote. UKIP came second, ahead of Labour and the Liberal Democrats. The Conservatives won the popular vote in Wales, while the SNP came first in Scotland. The Conservatives were first in every English region except the North East, where Labour won the most votes. Sinn Féin won the most first preference votes in Northern Ireland. Labour s vote fell by 6.9% points compared with the 2004 election. The principal beneficiaries were the minor parties, with Conservative, UKIP and Liberal Democrat shares remaining little changed. The Conservatives won the most votes in 280 of the 399 of local areas in Great Britain for which data are available. Labour won in 66, the Liberal Democrats 12 and UKIP 9. The SNP was first in 22 of 32 council areas in Scotland, while Plaid Cymru was first in seven of 40 Welsh constituencies. The Green Party was first in Brighton, Norwich and Oxford. The BNP was second in Barking & Dagenham. UK turnout was 34.5%, down on the 38.4% in 2004, when four regions held all-postal ballots, but higher than in Results across the EU MEPs from different countries are elected from national parties, but in the European Parliament many join political groups; after the 2009 elections the largest of these is likely to remain the centre-right European People s Party. The second largest group is the centre-left Party of European Socialists and this is likely to be smaller than prior to the elections. It is possible that new groups and allegiances may come into place in the new Parliament particularly in the light of the decision for the UK Conservatives to leave their former EPP Group. Across Europe, centre-right parties, whether in power or opposition, tended to perform better than those on the centre-left. The UK was not alone in seeing gains for far-right and nationalistic parties. Turnout across the EU was 43%. It was particularly low in some of the newer Member States. The proportion of women MEPs has continued to rise and in three countries (Latvia, Sweden and Finland) over half of MEPs are women. 1
6 RESEARCH PAPER 09/53 1 Results in the United Kingdom 1.1 Results summary Elections to the European Parliament were held across the UK on 4 June 2009, concurrently with county council elections in England. The first UK results were announced on 9 June 2009, once polls had closed across Europe. UK MEPs by party Conservative (25) UKIP (13) Labour (13) Liberal Democrat (11) Green (2) BNP (2) SNP (2) Plaid Cymru (1) Sinn Féin (1) DUP (1) Ulster Unionist (1) The Conservatives won 25 seats, both UKIP and Labour 13, and the Liberal Democrats 11. Other parties took the remaining 10 seats, including the BNP s first two seats in the European Parliament. UK seats won at European Parliament elections Actual Adjusted to current 72 seats / / Conservative Labour UKIP Liberal Democrat SNP Green BNP Plaid Cymru Sinn Féin DUP Ulster Unionists SDLP Total seats were contested in the UK, down from 87 in 1999 and 78 in 2004 as the EU has grown. Adjusting for the reduction in the UK s allocation compared with 2004, Labour lost five seats, the BNP gained two, and the Conservatives, Liberal Democrats and UKIP each gained one. The table overleaf summarises changes in the number of seats allocated to each UK region. The 72 seats were allocated between regions in proportion to their electorates on 1 December 2006, with each region having a minimum of three seats. 2
7 RESEARCH PAPER 09/53 MEPs by region, UK Change North East North West Yorkshire and the Humber East Midlands West Midlands East London South East South West Wales Scotland Northern Ireland UK The charts below show shares of the vote for each party and changes since both the 2004 European Parliament elections and the 2005 General Election: Share of the vote: Great Britain 30% 20% 10% 0% +20% Change in share: 2009 and 2004 EP elections, GB Percentage points +10% 0-10% -20% -30% +20% Difference in share: 2009 EP and 2005 General, GB Percentage points +10% 0-10% -20% -30% Con UKIP Lab LD Green BNP SNP PC Others 3
8 RESEARCH PAPER 09/53 The Conservatives won the popular vote across Great Britain, polling 4.2 million votes. UKIP were second with 2.5 million votes, Labour third with 2.4 million and the Liberal Democrats fourth with 2.1 million. The Green Party won 1.3 million votes and the BNP nearly 950,000. The Labour share of the vote fell by 6.9% points compared to the 2004 European Parliament elections. The shares for the other larger parties changed very little, with smaller parties including the Greens and the BNP gaining. The comparisons with the last General Election are more marked: the Labour share was more than 20% points lower, while the UKIP share was more then 14% points higher. It should be borne in mind that different electoral systems are used. 1.2 Turnout Turnout across the UK (measured as valid votes as a proportion of the electorate) was 34.5%. This was down on the 38.4% in 2004, when all-postal ballots were held in the four northernmost regions of England, but well above the 24.0% in The chart below shows turnout and change in turnout by region. The changes shown in light green are comparisons with all-postal ballots in Turnout, 2009 Change North East North West Yorks & Humber East Midlands West Midlands East London South East South West Wales Scotland Northern Ireland UK 0% 10% 20% 30% 40% 50% -20% -10% 0 +10% Regional turnouts ranged from 42.4% in Northern Ireland to 28.5% in Scotland. Turnout fell sharply in each of the four regions that held all-postal ballots in It also fell by 10.9% points in Wales, were local elections were held concurrently in Turnout rose slightly in the East, South East and South West regions. The highest local turnouts were in the Isles of Scilly (53.8%) and Gibraltar (52.6%). Turnout in South Lakeland district was 50.0%. The lowest local turnouts were 20.7% in Kingston-upon-Hull council area and 20.9% in Islwyn constituency. 4
9 RESEARCH PAPER 09/ The d Hondt system European Parliament seats in Great Britain are allocated using the d Hondt system of proportional representation at regional level. It operates as follows: Seats are allocated in successive rounds, with one seat allocated in each round In each round, total votes for each party are divided by the number of seats the party has already won, plus one The party with the highest remaining total wins the seat. This is demonstrated below using the results from Scotland: Seat allocation: Scotland SNP Lab Con LD Green UKIP Votes 321, , , ,038 80,442 57,788 Round 1 321, , , ,038 80,442 57,788 Round 2 160, , , ,038 80,442 57,788 Round 3 160, , , ,038 80,442 57,788 Round 4 160, ,927 92, ,038 80,442 57,788 Round 5 107, ,927 92, ,038 80,442 57,788 Round 6 107, ,927 92,897 63,519 80,442 57,788 Seats Scotland returns six MEPs. They are allocated in six rounds as follows: Round 1: Round 2: Round 3: Round 4: Round 5: Round 6: The SNP won the most votes in Scotland, and takes the first seat The SNP vote is divided by two, reflecting their seat won in Round 1. Labour has the highest remaining total and takes the second seat Both the SNP and Labour votes are now divided by two. The Conservative total is now the highest Half the SNP vote exceeds the Liberal Democrat vote, so the SNP takes a second seat The SNP vote is now divided by three, reflecting their two seats won. The Liberal Democrats take the fifth seat Labour takes the final seat This system was used to allocate seats in Great Britain at the 1999 and 2004 European Parliament elections. At the 1979, 1984, 1989 and 1994 elections, there was a first-past-thepost system, like that used for UK general elections but with larger European constituencies. Northern Ireland uses a different system to the rest of the UK for allocating its three MEPs. The single transferable vote system (STV) reallocates the surplus votes of those already elected and the votes of those eliminated to remaining candidates. This system has been used in Northern Ireland at each European Parliament election. 5
10 1.4 Results at regional level Regional summary table Votes Con UKIP Lab LDem PC/ SNP Green BNP Others Total North East 116,911 90, , ,644-34,081 52,700 44, ,862 North West 423, , , , , , ,214 1,651,825 Yorks & Humber 299, , , , , ,139 96,472 1,226,180 East Midlands 370, , , ,428-83, , ,175 1,228,065 West Midlands 396, , , ,246-88, ,967 95,060 1,413,036 East 500, , , , ,016 97, ,991 1,603,340 London 479, , , , ,589 86, ,794 1,751,026 South East 812, , , , , , ,361 2,334,858 South West 468, , , , ,179 60, ,084 1,549,708 Wales 145,193 87, ,852 73, ,702 38,160 37,114 37, ,520 Scotland 185,794 57, , , ,007 80,442 27,174 75,416 1,104,512 Great Britain 4,198,394 2,498,226 2,381,760 2,080, ,709 1,303, ,598 1,282,887 15,136,932 Share of vote North East 19.8% 15.4% 25.0% 17.6% - 5.8% 8.9% 7.5% 100% North West 25.6% 15.8% 20.4% 14.3% - 7.7% 8.0% 8.2% 100% Yorks & Humber 24.5% 17.4% 18.8% 13.2% - 8.5% 9.8% 7.9% 100% East Midlands 30.2% 16.4% 16.9% 12.3% - 6.8% 8.7% 8.7% 100% West Midlands 28.1% 21.3% 17.0% 12.0% - 6.2% 8.6% 6.7% 100% East 31.2% 19.6% 10.5% 13.8% - 8.8% 6.1% 10.1% 100% London 27.4% 10.8% 21.3% 13.7% % 4.9% 11.1% 100% South East 34.8% 18.8% 8.2% 14.1% % 4.4% 8.0% 100% South West 30.2% 22.1% 7.7% 17.2% - 9.3% 3.9% 9.6% 100% Wales 21.2% 12.8% 20.3% 10.7% 18.5% 5.6% 5.4% 5.5% 100% Scotland 16.8% 5.2% 20.8% 11.5% 29.1% 7.3% 2.5% 6.8% 100% Great Britain 27.7% 16.5% 15.7% 13.7% 3.0% 8.6% 6.2% 8.5% 100% Change , % pts North East +1.2% +3.2% -9.1% -0.2% % +2.5% +2.5% - North West +1.5% +3.7% -6.9% -1.6% % +1.6% +0.6% - Yorks & Humber -0.2% +2.9% -7.5% -2.4% % +1.8% +4.5% - East Midlands +3.8% -9.6% -4.1% -0.6% % +2.1% +8.5% - West Midlands +0.7% +3.8% -6.4% -1.7% % +1.1% +3.8% - East +0.4% -0.0% -5.8% -0.2% % +1.7% +1.6% - London +0.6% -1.6% -3.5% -1.6% % +0.9% +7.6% - South East -0.4% -0.7% -5.4% -1.2% % +1.4% +3.1% - South West -1.3% -0.5% -6.8% -1.2% % +0.9% +7.5% - Wales +1.8% +2.3% -12.2% +0.2% +1.1% +2.0% +2.5% +2.9% - Scotland -0.9% -1.5% -5.6% -1.6% +9.4% +0.5% +0.8% -1.1% - Great Britain +1.0% +0.3% -6.9% -1.2% +0.6% +2.4% +1.3% +3.9% - Seats North East North West Yorks & Humber East Midlands West Midlands East London South East South West Wales Scotland Great Britain Change in seats (adjusted for reduction in overall total) North East North West Yorks & Humber East Midlands West Midlands East London South East South West Wales Scotland Great Britain
11 Great Britain: summary MEPs elected by round: Great Britain by region NE NW Y&H EM WM E L SE SW W S Summary: Great Britain Votes % share Change Seats won Change Conservative 4,198, % +1.0% UKIP 2,498, % +0.3% Labour 2,381, % -6.9% 13-5 Liberal Democrat 2,080, % -1.2% Green 1,303, % +2.4% 2 - BNP 943, % +1.3% 2 +2 SNP 321, % +0.7% 2 - Plaid Cymru 126, % -0.1% 1 - Others 1,282, % +2.4% 0 - Total 15,137, % 69 Note: changes in seats won are adjusted for the reduction in the UK's allocation from 78 to 72 The Conservatives won the popular vote across Great Britain by 11.2% points and gained one seat. Labour were beaten into third by UKIP. Labour won 1.3 million fewer votes than in 2004 and lost five MEPs UKIP gained one seat in net terms with a marginally higher share of the vote than in The Liberal Democrats also gained one seat on a comparable basis, despite polling a lower vote share. All four of the major national parties polled fewer votes than in The Greens held their two seats with an improved vote share. The BNP won two seats, their first in the European Parliament. They won 135,000 more votes than in % % Share of vote 35 Seats (adjusted) 40% % 20 20% % 5 0% Electorate: 44,171,778 Turnout: 34.3% 7
12 North East Cleveland Durham Northumberland Tyne and Wear MEPs elected by round: North East 1 Stephen Hughes Labour 2 Martin Callanan Conservative 3 Fiona Hall Liberal Democrat Summary: North East Votes % share Change Seats won Change Labour 147, % -9.1% 1 - Conservative 116, % +1.2% 1 - Liberal Democrat 103, % -0.2% 1 - UKIP 90, % +3.2% 0 - BNP 52, % +2.5% 0 - Green 34, % +1.0% 0 - Others 44, % +2.5% 0 - Total 589, % 3 Note: changes in seats won are adjusted for the reduction in the UK's allocation from 78 to 72 The North East region returned one Labour, one Conservative and one Liberal Democrat MEP, unchanged on This region was the only one where Labour polled the most votes. That was despite a 9.1% point fall in the Labour vote relative to 2004, their largest fall of any English region. Both Labour and the Liberal Democrats polled their highest regional share of the vote in the North East. The 2.5% point increase in the BNP vote since 2004 was the highest of any region. Their 8.9% of the vote was their second highest by region, behind Yorkshire and the Humber. Turnout was 30.4%, the lowest among English regions. 50% % Share of vote 5 Seats (adjusted) 40% 4 30% 3 20% 2 10% 1 0% Electorate: 1,939,709 Turnout: 30.4% 8
13 North West Cheshire Cumbria Greater Manchester Lancashire Merseyside MEPs elected by round: North West 1 Robert Atkins Conservative 2 Arlene McCarthy Labour 3 Paul Nuttall UKIP 4 Chris Davies Liberal Democrat 5 Sajjad Karim Conservative 6 Brian Simpson Labour 7 Jacqueline Foster Conservative 8 Nick Griffin BNP Summary: North West Votes % share Change Seats won Change Conservative 423, % +1.5% 3 - Labour 336, % -6.9% 2-1 UKIP 261, % +3.7% 1 - Liberal Democrat 235, % -1.6% 1 - BNP 132, % +1.6% 1 +1 Green 127, % +2.1% 0 - Others 135, % +0.6% 0 - Total 1,651, % 8 Note: changes in seats won are adjusted for the reduction in the UK's allocation from 78 to 72 The Conservatives won the most votes in the North West region, having been second to Labour in Labour lost 6.9% points and one of their three seats. The last seat went to the BNP, who will be represented by their leader, Nick Griffin. The BNP won a higher share of the vote in four other regions, but benefited from there being eight seats available in the North West. UKIP overtook the Liberal Democrats into third place in the region. 50% % Share of vote 5 Seats (adjusted) 40% 4 30% 3 20% 2 10% 1 0% Electorate: 5,207,282 Turnout: 31.7% 9
14 Yorkshire and The Humber Humberside North Yorkshire South Yorkshire West Yorkshire MEPs elected by round: Yorkshire and the Humber 1 Edward McMillan-Scott Conservative 2 Linda McAvan Labour 3 Godfrey Bloom UKIP 4 Diana Wallis Liberal Democrat 5 Timothy Kirkhope Conservative 6 Andrew Brons BNP Summary: Yorkshire and the Humber Votes % share Change Seats won Change Conservative 299, % -0.2% 2 - Labour 230, % -7.5% 1-1 UKIP 213, % +2.9% 1 - Liberal Democrat 161, % -2.4% 1 - BNP 120, % +1.8% 1 +1 Green 104, % +2.8% 0 - Others 96, % +4.5% 0 - Total 1,226, % 6 Note: changes in seats won are adjusted for the reduction in the UK's allocation from 78 to 72 The Conservatives won the most votes in the Yorkshire and the Humber region, having been second to Labour in Labour lost 7.5% points and one of their two seats. The last seat went to the BNP. Their 9.8% of the vote in Yorkshire and the Humber was their highest regional share. The 2.4% point fall in the Liberal Democrat share of the vote since 2004 was their largest of any region. 50% % Share of vote 5 Seats (adjusted) 40% 4 30% 3 20% 2 10% 1 0% Electorate: 3,792,415 Turnout: 32.3% 10
15 East Midlands Derbyshire Leicestershire Lincolnshire Northamptonshire Nottinghamshire MEPs elected by round: East Midlands 1 Roger Helmer Conservative 2 Glenis Willmott Labour 3 Derek Clark UKIP 4 Emma McClarkin Conservative 5 Bill Newton Dunn Liberal Democrat Summary: East Midlands Votes % share Change Seats won Change Conservative 370, % +3.8% 2 - Labour 206, % -4.1% 1 - UKIP 201, % -9.6% 1-1 Liberal Democrat 151, % -0.6% 1 +1 BNP 106, % +2.1% 0 - Green 83, % +1.4% 0 - Others 107, % +8.5% 0 - Total 1,228, % 5 Note: changes in seats won are adjusted for the reduction in the UK's allocation from 78 to 72 The Conservatives won the East Midlands region by 13.3% points, having very narrowly defeated UKIP in The 3.8% point increase in the Conservative share of the vote was their highest of any region. UKIP lost 9.6% of the vote, by far their worst regional performance by this measure, and fell to third, losing a seat. This was, however, their best region in terms of both vote share and % increase in 2004, which could partly be attributed to Robert Kilroy-Silk s high profile candidacy. The Liberal Democrats gained a seat despite a small fall in their share of the vote. The BNP won 8.7% of the vote, more than in the North West region, where they won a seat. 50% % Share of vote 5 Seats (adjusted) 40% 4 30% 3 20% 2 10% 1 0% Electorate: 3,312,592 Turnout: 37.1% 11
16 West Midlands Hereford and Worcester Shropshire Staffordshire Warwickshire West Midlands (former Metropolitan County) MEPs elected by round: West Midlands 1 Philip Bradbourn Conservative 2 Mike Nattrass UKIP 3 Michael Cashman Labour 4 Malcolm Harbour Conservative 5 Liz Lynne Liberal Democrat 6 Nikki Sinclaire UKIP Summary: West Midlands Votes % share Change Seats won Change Conservative 396, % +0.7% 2 - UKIP 300, % +3.8% 2 +1 Labour 240, % -6.4% 1-1 Liberal Democrat 170, % -1.7% 1 - BNP 121, % +1.1% 0 - Green 88, % +1.1% 0 - Others 95, % +3.8% 0 - Total 1,413, % 6 Note: changes in seats won are adjusted for the reduction in the UK's allocation from 78 to 72 UKIP overtook Labour into second place in the West Midlands, gaining one of Labour s two seats. The 3.8% increase in UKIP s share of the vote relative to 2004 was their highest of any region. The BNP won 8.7% of the vote, more than in the North West region, where they won a seat. Should the Lisbon Treaty be ratified, a further seat could be allocated to the West Midlands region. On the basis of these results, it would be Conservative. 50% % Share of vote 5 Seats (adjusted) 40% 4 30% 3 20% 2 10% 1 0% Electorate: 4,056,370 Turnout: 34.8% 12
17 East Bedfordshire Cambridgeshire Essex Hertfordshire Norfolk Suffolk MEPs elected by round: East 1 Geoffrey Van Orden Conservative 2 David Campbell Bannerman UKIP 3 Robert Sturdy Conservative 4 Andrew Duff Liberal Democrat 5 Richard Howitt Labour 6 Vicky Ford Conservative 7 John Agnew UKIP Summary: East Votes % share Change Seats won Change Conservative 500, % +0.4% 3 - UKIP 313, % -0.0% 2 - Liberal Democrat 221, % -0.2% 1 - Labour 167, % -5.8% 1 - Green 141, % +3.2% 0 - BNP 97, % +1.7% 0 - Others 161, % +1.6% 0 - Total 1,603, % 7 Note: changes in seats won are adjusted for the reduction in the UK's allocation from 78 to 72 The distribution of seats in the East of England region remained the same as that prior to the election. The Conservatives won 31.2% of the vote, their highest regional share outside the South East. Their share of the vote, together with UKIP and the Liberal Democrats, was largely unchanged on Labour came fourth in the region following a 5.8% point fall in their vote. Other parties polled more than 10% of the vote in the region. That includes 2.4% for the United Kingdom First Party. 50% % Share of vote 5 Seats (adjusted) 40% 4 30% 3 20% 2 10% 1 0% Electorate: 4,252,669 Turnout: 37.7% 13
18 London MEPs elected by round: London 1 Charles Tannock Conservative 2 Claude Moraes Labour 3 Sarah Ludford Liberal Democrat 4 Syed Kamall Conservative 5 Jean Lambert Green 6 Gerard Batten UKIP 7 Mary Honeyball Labour 8 Marina Yannakoudakis Conservative Summary: London Votes % share Change Seats won Change Conservative 479, % +0.6% 3 - Labour 372, % -3.5% 2 - Liberal Democrat 240, % -1.6% 1 - Green 190, % +2.5% 1 - UKIP 188, % -1.6% 1 - BNP 86, % +0.9% 0 - Others 193, % +7.6% 0 - Total 1,751, % 8 Note: changes in seats won are adjusted for the reduction in the UK's allocation from 78 to 72 The distribution of seats in London remained the same as that prior to the election. Labour s share of the vote fell by 3.5% points compared with 2004, their smallest regional fall. The Green Party held their London seat with 10.9% of the vote. This moved them ahead of UKIP into fourth place. UKIP s 10.8% was their lowest of any English region. Others won a combined 11.1%. This included 2.9% for both the Christian Party and Independent Jan Jananayagam, who campaigned for Tamil civil rights with support from rapper MIA. 50% % Share of vote 5 Seats (adjusted) 40% 4 30% 3 20% 2 10% 1 0% Electorate: 5,257,624 Turnout: 33.3% 14
19 South East Berkshire Buckinghamshire East Sussex Hampshire Isle of Wight Kent Oxfordshire Surrey West Sussex MEPs elected by round: South East 1 Daniel Hannan Conservative 2 Nigel Farage UKIP 3 Richard Ashworth Conservative 4 Sharon Bowles Liberal Democrat 5 Caroline Lucas Green 6 Nirj Deva Conservative 7 Marta Andreasen UKIP 8 James Elles Conservative 9 Peter Skinner Labour 10 Catherine Bearder Liberal Democrat Summary: South East Votes % share Change Seats won Change Conservative 812, % -0.4% 4 - UKIP 440, % -0.7% 2 - Liberal Democrat 330, % -1.2% 2 - Green 271, % +3.8% 1 - Labour 192, % -5.4% 1 - BNP 101, % +1.4% 0 - Others 186, % +3.1% 0 - Total 2,334, % 10 Note: changes in seats won are adjusted for the reduction in the UK's allocation from 78 to 72 The South East region is the UK s largest in terms of electorate. The distribution of its 10 seats is unchanged. The Conservatives held four of those seats with 34.8% of the vote, their highest regional share. Labour came fifth, having been second in the region in 1999 and fourth in The Green Party won 11.6% of the vote, their highest regional share. The Conservative, Labour, Liberal Democrat and UKIP shares of the vote were all lower than in % % Share of vote 5 Seats (adjusted) 40% 4 30% 3 20% 2 10% 1 0% Electorate: 6,231,875 Turnout: 37.5% 15

20 South West Avon Cornwall Devon Dorset Gibraltar Gloucestershire Somerset Wiltshire MEPs elected by round: South West 1 Giles Chichester Conservative 2 Trevor Colman UKIP 3 Graham Watson Liberal Democrat 4 Julie Girling Conservative 5 William, Earl of Dartmouth UKIP 6 Ashley Fox Conservative Summary: South West Votes % share Change Seats won Change Conservative 468, % -1.3% 3 +1 UKIP 341, % -0.5% 2 - Liberal Democrat 266, % -1.2% 1 - Green 144, % +2.1% 0 - Labour 118, % -6.8% 0-1 BNP 60, % +0.9% 0 - Others 149, % +7.5% 0 - Total 1,549, % 6 Note: changes in seats won are adjusted for the reduction in the UK's allocation from 78 to 72 Labour came fifth in the South West region, having been second in 1999 and fourth in Their 7.7% of the vote was their lowest regional share. Labour lost its one seat in the region. It was won by the Conservatives, despite them winning a lower share of the vote than in The Conservative, Labour, Liberal Democrat and UKIP shares of the vote were all lower than in The BNP won 3.9% of the vote in the South West, their lowest in English regions. The Pensioners Party won 2.4% of the vote in the only region they stood. The turnout of 38.8% was the highest of any region in Great Britain. 50% % Share of vote 5 Seats (adjusted) 40% 4 30% 3 20% 2 10% 1 0% Electorate: 3,998,479 Turnout: 38.8% 16
21 Wales MEPs elected by round: Wales 1 Kay Swinburne Conservative 2 Derek Vaughan Labour 3 Jill Evans Plaid Cymru 4 John Bufton UKIP Summary: Wales Votes % share Change Seats won Change Conservative 145, % +1.8% 1 - Labour 138, % -12.2% 1-1 Plaid Cymru 126, % +1.1% 1 - UKIP 87, % +2.3% 1 +1 Liberal Democrat 73, % +0.2% 0 - Green 38, % +2.0% 0 - BNP 37, % +2.5% 0 - Others 37, % +2.9% 0 - Total 684, % 4 Note: changes in seats won are adjusted for the reduction in the UK's allocation from 78 to 72 The Conservatives came first in Wales, the first time since 1918 that Labour has not come first in a Wales-wide election. The 12.2% point fall in the Labour share of the vote was their highest of any region. Labour lost one of its two seats. That seat went to UKIP, who won a seat outside England for the first time. Both the Liberal Democrat and the Green Party polled their lowest regional shares in Wales, though Wales was the only region where the Liberal Democrat share of the vote rose compared with The BNP s share of the vote in Wales almost doubled compared with % % Share of vote 5 Seats (adjusted) 40% 4 30% 3 20% 2 10% 1 0% Electorate: 2,249,788 Turnout: 30.4% 17
22 Scotland MEPs elected by round: Scotland 1 Ian Hudghton SNP 2 David Martin Labour 3 Struan Stevenson Conservative 4 Alyn Smith SNP 5 George Lyon Liberal Democrat 6 Catherine Stihler Labour Summary: Scotland Votes % share Change Seats won Change SNP 321, % +9.4% 2 - Labour 229, % -5.6% 2 - Conservative 185, % -0.9% 1 - Liberal Democrat 127, % -1.6% 1 - Green 80, % +0.5% 0 - UKIP 57, % -1.5% 0 - BNP 27, % +0.8% 0 - Others 75, % -1.1% 0 - Total 1,104, % 6 Note: changes in seats won are adjusted for the reduction in the UK's allocation from 78 to 72 The SNP overtook Labour into first place in Scotland. The SNP share of the vote rose by 9.4% points compared with 2004, the biggest increase for any party in any region in Great Britain. The Conservative, Labour, Liberal Democrat and UKIP shares of the vote all fell compared with The distribution of Scotland s seats remained unchanged. The Conservatives, UKIP and the BNP all recorded their lowest regional shares of the vote in Scotland. Turnout was 28.8%, the lowest in the UK. 50% % Share of vote 5 Seats (adjusted) 40% 4 30% 3 20% 2 10% 1 0% Electorate: 3,872,975 Turnout: 28.5% 18
23 Northern Ireland MEPs in order of election: Northern Ireland 1 Bairbre de Brun Sinn Fein 2 Jim Nicholson UUP 3 Diane Dodds DUP Summary: Northern Ireland First pref votes % share Change Seats won Change Sinn Féin 126, % -0.3% 1 - DUP 88, % -13.8% 1 - UUP 82, % +0.5% 1 - SDLP 78, % +0.3% 0 - Trad. Unionist Voice 66, % +13.7% 0 - Alliance Party 26, % +5.5% 0 - Others 15, % -5.9% 0 - Total 484, % 3 Note: changes in seats won are adjusted for the reduction in the UK's allocation from 78 to 72 Northern Ireland uses a different system to the rest of the UK for allocating its three MEPs. The single transferable vote system (STV) reallocates the surplus votes of those already elected and the votes of those eliminated to remaining candidates. The distribution of the three seats was unchanged, with one MEP for Sinn Féin, the DUP and the UUP, who stood as Ulster Conservatives and Unionists New Force. Sinn Féin won the most first preference votes, having been second in 2004 and fourth in The DUP first preference vote fell by 13.8%. Traditional Unionist Voice, which is led by former DUP MEP Jim McAllister and campaigns against the St Andrews Agreement, won 13.7%. The shares of the vote for the other main Northern Ireland parties were largely unchanged on Turnout was 42.4%, the highest in the UK. 50% % Share of vote 5 Seats (adjusted) 40% 4 30% 3 20% 2 10% 1 0% Electorate: 1,141,979 Turnout: 42.4% 19
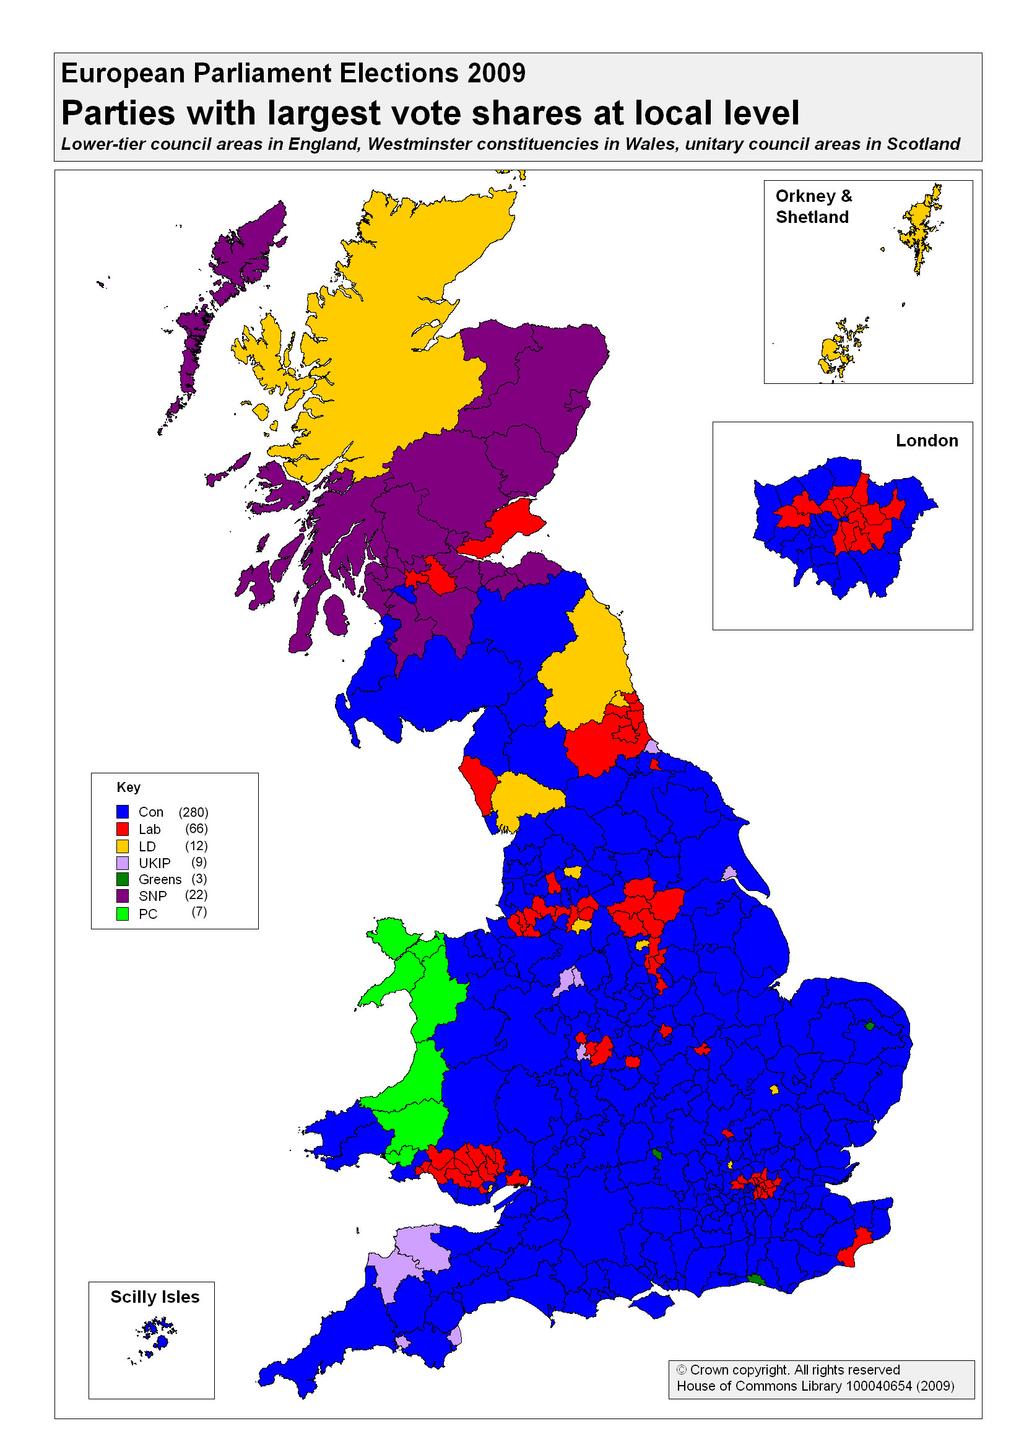
24 RESEARCH PAPER 09/ Results at local level Although the allocation of UK seats to the European Parliament takes place on a regional basis, the results are collected at local level in Great Britain. They are available for the following geographies: England: Wales: Scotland: Lower-tier council areas: districts, unitary authorities, metropolitan boroughs and London boroughs Westminster Parliamentary constituencies Unitary council areas The results have been collected from regional and local returning officers. The table below summarises which parties won the most votes in these areas. It should be noted that they vary enormously in size: Birmingham s electorate is over 700,000 while the Isles of Scilly s is less than 1,700. Local level winners by region Lower-tier council areas in England, Westminster constituencies Wales, unitary council areas in Scotland Con Lab LD UKIP PC SNP Green BNP Total North East North West Yorkshire and the Humber East Midlands West Midlands East London South East South West Wales Scotland Great Britain The Conservatives were the largest party in 280 of the 399 local areas. Gibraltar, where they won 53.3%, was the only area where they won more than half the vote. Labour were the largest party in 66 areas. Their highest percentage share of the vote in any area was 40.6% in Newham. They only won two areas in the South of England outside London: Luton and Shepway. The SNP won the highest share of the vote in 22 Scottish areas. They won more than 40% of the vote in Comhairle Nan Eilean Siar (Western Isles), Angus and Dundee City. The Liberal Democrats were the largest party in 12 areas. Their highest share of the vote was 37.2% in South Lakeland. UKIP were the largest party in 9 local areas. Their greatest share of the vote was 34.4% in Torbay. Plaid Cymru were the largest party in seven Welsh constituencies. Their 49.5% in Caernarfon was the second highest for any party in any local area, after the Conservatives in Gibraltar. 20
25
26 RESEARCH PAPER 09/53 The Green Party took the highest share of the vote in three areas: Brighton, Oxford and Norwich. They polled 31.4% in Brighton, their highest local vote share. Despite winning two seats in the European Parliament, the BNP s highest local area placing was second in Barking & Dagenham, where they gained 19.4%. They won 17.7% in Stoke-on-Trent and 17.6% in Thurrock. The English Democrats received 9.4% per cent of the vote in Doncaster, where the English Democrat candidate was elected Mayor on the same day. They also won 9.4% in Dartford, where they were the fourth largest party. Appendix 1 contains the full results at local level. 1.6 Characteristics of UK MEPs The table below shows UK MEPs by gender and whether they served in the previous Parliament: MEPs by gender, experience, region and party Male Female Previous New Total North East North West Yorkshire and the Humber East Midlands West Midlands Eastern London South East South West Wales Scotland Northern Ireland BNP Conservative DUP Green Labour Liberal Democrat Plaid Cymru Sinn Fein SNP UKIP UUP Total One-third of the UK s MEPs are female, up from less than one-quarter following the 2004 elections. 72% were MEPs immediately prior to the election. Appendix 2 shows a full list of UK MEPs by party. 22
27 RESEARCH PAPER 09/53 2 Results across the EU 2.1 Turnout Turnout in elections to the European Parliament 1979 to 2009 by EU country Prov Belgium Denmark Germany Ireland France Italy Luxembourg Netherlands United Kingdom Greece Spain Portugal Sweden Austria Finland Czech Rep Estonia Cyprus Lithuania Latvia Hungary Malta Poland Slovenia Slovakia Bulgaria Romania EU total Source: European Parliament In Belgium, Luxembourg, Cyprus and Malta voting is compulsory; this was also the case in Italy up to European Election turnout by country Luxembourg Belgium Malta Italy Denmark Cyprus Ireland Latvia Greece Spain Sweden Germany Estonia Austria France Finland Bulgaria Portugal Netherlands Hungary United Kingdom Slovenia Czech Rep Poland Romania Lithuania Slovakia EU average
28 RESEARCH PAPER 09/53 EU-wide turnout 1 continued to decline in 2009 to 43%, from 45% in 2004, 50% in 1999 and 62% when the EU was far smaller in Turnout in the UK at European Parliament elections has consistently been low by comparison with other European countries. Its 43% turnout in 2009 was the lowest of established EU Members, although it was higher than in six of the newer member states, including Slovakia, where fewer than one-in-five electors voted. 2.2 Seats in the European Parliament After the 2009 elections there are 736 Members of the European Parliament. Previously, at the 2004 elections, 732 Members had been elected. The accession of Bulgaria and Romania had increased that to 785 MEPs immediately before the 2009 elections. The smallest country, Malta, now has 5 MEPs. This increases broadly in line with population, up to the largest, Germany, which has 99. The UK, Italy and France have 72 MEPs each. MEPs generally stand for election as representatives of a national party. However, once in the Parliament they can form political groups which draw members from the delegations of a number of countries. Labour MEPs, for example, were in the Party of European Socialists; Conservative MEPs, were in the European People s Party group but have already indicated they will not be in this group in future. Before the 2009 elections there were seven political groups in the Parliament: EPP-ED European People's Party and European Democrats PES Party of European Socialists ALDE Alliance of Liberals and Democrats UEN Union for Europe of Nations GREENS/ EFA Greens/European Free Alliance GUE/ NGL European United Left/Nordic Green Left IND/ DEM Independence/Democracy From July 2009, all political groups must include a total of at least 25 MEPs from at least seven Member States. The following table shows the European Parliament s provisional composition of each country s MEPs in terms of known affiliations to existing political groups. This is subject to agreement when the Parliament first meets in Strasbourg on 14 July 2009, the formation of new groups and possible demise of some of the existing ones. 1 The calculation of turnout here is largely based on total votes (valid and rejected) as a proportion of the electorate as this is the figure that is reported by the European Parliament for consistency between countries. Detailed results elsewhere in this paper show turnout on this basis and using valid votes only. 24
29 RESEARCH PAPER 09/53 MEPs by country and political group 2009 (provisional) EPP-ED PES ALDE UEN GRN/EFA GUE/ NGL IND/ DEM Others Total Austria Belgium Bulgaria Cyprus Czech Rep Denmark Estonia Finland France Germany Greece Hungary Ireland Italy Latvia Lithuania Luxembourg Malta Netherlands Poland Portugal Romania Slovakia Slovenia Spain Sweden United Kingdom All MEPs Source: European Parliament Other /not known, MEPs by provisional political group IND/ DEM, 19 GUE/ NGL, 33 GREENS/ EFA, 52 EPP-ED, 263 UEN, 35 ALDE, 80 PES, 163 Overall, on the basis of the current groups, the EPP remains the largest group, with an increase in its share of seats. The Socialists are the second largest but are reduced from 28% to 22% of MEPs, while the Alliance of Liberals and Democrats also lost seats. However, this position is subject to change when the Parliament meets in July, especially as new groups may be formed and the other/not known category includes 91 MEPs who may subsequently affiliate to groups. 25
30 RESEARCH PAPER 09/ Women and Men in the European Parliament The table below summarises trends in numbers of men and women MEPs. Men and women MEPs Men Women Men Women Men Women Men Women Men Women Men Women Men Women Belgium 92% 8% 83% 17% 83% 17% 68% 32% 72% 28% 67% 33% 68% 32% Denmark 69% 31% 63% 38% 63% 38% 56% 44% 63% 38% 57% 43% 54% 46% Germany 85% 15% 80% 20% 69% 31% 65% 35% 63% 37% 67% 33% 63% 37% Ireland 87% 13% 87% 13% 93% 7% 73% 27% 67% 33% 62% 38% 75% 25% France 78% 22% 79% 21% 77% 23% 70% 30% 60% 40% 55% 45% 56% 44% Italy 86% 14% 90% 10% 88% 12% 87% 13% 89% 11% 79% 21% n/a n/a Luxembourg 83% 17% 50% 50% 50% 50% 50% 50% 67% 33% 50% 50% 67% 33% Netherlands 80% 20% 72% 28% 72% 28% 68% 32% 65% 35% 52% 48% 52% 48% UK 86% 14% 85% 15% 85% 15% 82% 18% 76% 27% 74% 26% 67% 33% Greece 92% 8% 96% 4% 84% 16% 84% 16% 71% 29% 68% 32% Spain 85% 15% 67% 33% 66% 34% 74% 26% 64% 36% Portugal 88% 13% 92% 8% 80% 20% 75% 25% 64% 36% Sweden 59% 41% 53% 47% 44% 56% Austria 62% 38% 72% 28% 65% 35% Finland 56% 44% 57% 43% 38% 62% Czech Rep 79% 21% 82% 18% Estonia 50% 50% 67% 33% Cyprus 100% 0% 67% 33% Lithuania 62% 38% 75% 25% Latvia 67% 33% 37% 63% Hungary 63% 38% 64% 36% Malta 100% 0% 100% 0% Poland 85% 15% 78% 22% Slovenia 57% 43% 71% 29% Slovakia 64% 36% 62% 38% Bulgaria 56% 44% 53% 47% Romania 71% 29% 64% 36% EU 84% 16% 82% 18% 81% 19% 74% 26% 70% 30% 69% 31% n/a n/a Source: European Parliament The proportion of MEPs who are women has grown steadily over recent decades and will reach a record high following the 2009 elections. Final totals will be known once the identities of Italian MEPs are confirmed. 2.4 Country-level analysis The following sections summarise the votes and seats for each of the 27 EU Member states. Political groups have been assigned provisionally by the European Parliament. Changes in the number of MEPs by party show the number of MEPs elected in 2009 compared with the hypothetical number in the previous parliament after adjusting for the change in the number of seats. The data for these tables has been taken primarily from official national authorities, as shown under each country. Additional data are from the European Parliament and BBC. 26
31 RESEARCH PAPER 09/53 Austria MEPs Party EP Group % vote +/- total Österreichische Volkspartei EPP-ED Sozialdemokratische Partei Österreichs PES Hans-Peter Martin für Demokratie, Kontrolle, Gerechtigkeit Ind/Dem Freiheitliche Partei Österreichs Other Die Grünen Die Grüne Alternative Greens Other 6.1 Total votes 2,699,240 Seats 17 Of which valid votes 2,641,387 MEPs Electorate 6,362,633 Male 11 Turnout based on total votes 42.4% Female 6 Turnout based on valid votes only 41.5% 35% Bundesministerium für Inneres Austria: Both parties in partnership in Government lost vote share, although the Social Democratic Party more than the Conservative Peoples Party (Volkspartei), its junior partner in government. The far right Freedom Party won two seats, having campaigned on an anti-islamic platform. Hans-Peter Martin attacked EU waste and corruption and criticized the Lisbon Treaty. His vote share increased and he now has three MEPs. Belgium MEPs Party EP Group % vote +/- total Christen-Democratisch & Vlaams EPP Open Vlaamse Liberalen en Democraten ALDE Parti Socialiste PES Vlaams Belang Others Mouvement Réformateur ALDE Socialistische Partij.Anders PES Ecologistes Confédérés pour l'organisation de Luttes Originales Greens Nieuw-Vlaamse Alliantie EPP Groen! Greens Centre Démocrate Humaniste EPP Lijst Dedecker Others Christlich Soziale Partei EPP Other 4.8 Home Office Belgium Total votes 7,014,415 Seats 22 Of which valid votes 6,571,802 MEPs Electorate 7,760,436 Male 15 Turnout based on total votes 90.4% Female 7 Turnout based on valid votes only 84.7% 32% Governing Christian Democrats and other EPP affiliated parties won six seats with Socialists and Liberals getting five each. Turnout was high in Belgium reflecting the fact that voting is compulsory. Also the European elections coincided with domestic regional elections. 27
32 RESEARCH PAPER 09/53 Bulgaria MEPs Party EP Group % vote +/- total Citizens for European Development of Bulgaria EPP Coalition for Bulgaria PES Movement for Rights and Freedoms ALDE National Union Attack Others National Movement for Stability and Progress ALDE Blue Coalition EPP Other 15.1 Total votes 2,601,677 Seats 17 Of which valid votes 2,576,434 MEPs Electorate 6,684,770 Male 9 Turnout based on total votes 38.9% Female 8 Turnout based on valid votes only 38.5% 47% Official Bulgarian website The governing socialists were overtaken by Boyko Borissov s Citizens Party. He is seen as a potential leader after the next national elections on 5 July. Turnout was up by 8% points on 2007 but remains below the EU average. Cyprus MEPs Party EP Group % vote +/- total Democratic Rally EPP-ED AKEL-Left - New Forces GUE/NGL Democratic Party Other EDEK-Movement of Social Democrats PES Other 7.3 Total votes 312,479 Seats 6 Of which valid votes 306,325 MEPs Electorate 526,060 Male 4 Turnout based on total votes 59.4% Female 2 Turnout based on valid votes only 58.2% 33% Ministry of the Interior: Turnout was below 60%, in spite of compulsory voting in Cyprus. The Democratic Rally opposition party narrowly beat the governing AKEL. 28
33 RESEARCH PAPER 09/53 Czech Republic MEPs Party EP Group % vote +/- total Občanská demokratická strana Other Česká strana sociálně demokratická PES Komunistická strana Čech a Moravy GUE/NGL Křesťanská a demokratická unie Československá strana lidová EPP-ED Other 24.4 Total votes 2,369,137 Seats 22 Of which valid votes 2,358,934 MEPs Electorate 8,401,374 Male 18 Turnout based on total votes 28.2% Female 4 Turnout based on valid votes only 28.1% 18% Czech Statistical Office These elections took place in advance of national elections in October and the Civic Democrats (ODS) beat their rival Social Democrats, who had led in recent opinion polls. The ODS had been a member of the European People s Party before the elections but has confirmed its intention to be part of a new Parliamentary Group with the UK s Conservatives. Denmark MEPs Party EP Group % vote +/- total Socialdemokratiet PES Venstre, Danmarks Liberale Parti ALDE SF - Socialistisk Folkeparti Greens/EFA Dansk Folkeparti UEN Det Konservative Folkeparti EPP-ED Folkebevægelsen mod EU GUE/NGL Other 7.2 Total votes 2,414,482 Seats 13 Of which valid votes 2,341,259 MEPs Electorate 4,056,862 Male 7 Turnout based on total votes 59.5% Female 6 Turnout based on valid votes only 57.7% 46% Statistik Danmarks Turnout was up on previous EP elections; probably because these elections coincided with a national referendum to grant daughters equal rights of succession to the throne. In spite of losing a seat, the current Social Democrat opposition remained the biggest group. 29
Of the 73 MEPs elected on 22 May in Great Britain and Northern Ireland 30 (41 percent) are women.
 are women.") Centre for Women & Democracy Women in the 2014 European Elections 1. Headline Figures Of the 73 MEPs elected on 22 May in Great Britain and Northern Ireland 30 (41 percent) are women. This represents a
Centre for Women & Democracy Women in the 2014 European Elections 1. Headline Figures Of the 73 MEPs elected on 22 May in Great Britain and Northern Ireland 30 (41 percent) are women. This represents a
Standard Note: SN/SG/1467 Last updated: 3 July 2013 Author: Aliyah Dar Section Social and General Statistics
 Elections: Turnout Standard Note: SN/SG/1467 Last updated: 3 July 2013 Author: Aliyah Dar Section Social and General Statistics This note looks at turnout in UK elections. The extent to which voters turnout
European Parliament. Elections 1979 to JUNE 1999
 European Parliament 2 JUNE 1999 Elections 1979 to 1994 This paper presents a summary of direct elections to the European Parliament since 1979, in advance of elections in June 1999. It concentrates on
Election 2010: Where the Women Candidates Are
 Election 2010: Where the Women Candidates Are A Report from the Centre for Women & Democracy April 2010 Election 2010: Where the Women Candidates Are This report looks at the numbers and percentages of
European Parliament Elections: Turnout trends,
 European Parliament Elections: Turnout trends, 1979-2009 Standard Note: SN06865 Last updated: 03 April 2014 Author: Section Steven Ayres Social & General Statistics Section As time has passed and the EU
Election Guidelines. Election Campaigns for: - the European Parliament across the UK - Local Government in England and Northern Ireland
 Election Guidelines Election Campaigns for: - the European Parliament across the UK - Local Government in England and Northern Ireland Polling Day: 22 ND May 2014 1 Introduction 1.1 The Election Period
Police service strength
 Police service strength Standard Note: SN00634 Last updated: 10 September 2012 Author: Gavin Berman Section Social and General Statistics This note summarises police service strength data from the Home
Standard Note: SN/SG/6077 Last updated: 25 April 2014 Author: Oliver Hawkins Section Social and General Statistics
 Migration Statistics Standard Note: SN/SG/6077 Last updated: 25 April 2014 Author: Oliver Hawkins Section Social and General Statistics The number of people migrating to the UK has been greater than the
Migrant population of the UK
 BRIEFING PAPER Number CBP8070, 3 August 2017 Migrant population of the UK By Vyara Apostolova & Oliver Hawkins Contents: 1. Who counts as a migrant? 2. Migrant population in the UK 3. Migrant population
Arrests for Notifiable Offences and the Operation of Certain Police Powers under PACE 12/02 England and Wales, 2001/02
 Arrests for Notifiable Offences and the Operation of Certain Police Powers under PACE 12/02 England and Wales, 2001/02 Margaret Ayres, Dave Perry and Paul Hayward 7 November 2002 MAIN POINTS Arrests Around
Which electoral procedures seem appropriate for a multi-level polity?
 Policy Department C Citizens' Rights and Constitutional Affairs Which electoral procedures seem appropriate for a multi-level polity? CONSTITUTIONAL AFFAIRS PE 408.297 JANUARY 2004 EN Directorate-General
The evolution of turnout in European elections from 1979 to 2009
 The evolution of turnout in European elections from 1979 to 2009 Nicola Maggini 7 April 2014 1 The European elections to be held between 22 and 25 May 2014 (depending on the country) may acquire, according
Q2 Statistical Report 2017
 Q Statistical Report 17 Summary Overall Quarter Observations During this quarter, the Helpline saw a steady increase in number calls rising from 163 in January to 6 in June. Calls were received from all
Q4 Statistical Report 2018 Summary
 f Q Statistical Report 8 Summary Overall Quarter Observations October yielded the highest number monthly calls to the Helpline to date. Quarter four shows a 9% increase in calls in comparison to the previous
POLICE SPORT (UK) (Founded 1928 as the Police Athletic Association) CONSTITUTION AND RULES POLICE SPORT (UK) Patron: HER MAJESTY THE QUEEN
 (Founded 1928 as the Police Athletic Association) CONSTITUTION AND RULES POLICE SPORT (UK) Patron: HER MAJESTY THE QUEEN") POLICE SPORT (UK) (Founded 1928 as the Police Athletic Association) CONSTITUTION AND RULES POLICE SPORT (UK) Patron: HER MAJESTY THE QUEEN Joint Presidents: The Rt. Hon. The Secretary of State for Home
POLICE SPORT (UK) (Founded 1928 as the Police Athletic Association) CONSTITUTION AND RULES POLICE SPORT (UK) Patron: HER MAJESTY THE QUEEN Joint Presidents: The Rt. Hon. The Secretary of State for Home
Race Disproportionality in Stops and Searches,
 Equality and Human Rights Commission Briefing paper 7 Race Disproportionality in Stops and Searches, 2011-12 Karen Hurrell Equality and Human Rights Commission 2013 First published Autumn 2013 ISBN 978-1-84206-491-7
SPICe Briefing European Parliament Election 2014
 The Scottish Parliament and Scottish Parliament Infor mation C entre l ogos. SPICe Briefing European Parliament Election 2014 Andrew Aiton and Iain McIver 30 May 2014 This briefing provides details of
European Union Passport
 European Union Passport European Union Passport How the EU works The EU is a unique economic and political partnership between 28 European countries that together cover much of the continent. The EU was
The proportion of the UK population aged under 16 dropped below the proportion over state pension age for the first time in (Table 1.
 Population In 2007, there were 6.0 million people resident in the UK, an increase of almost 400,000 (0.6 per cent) on 2006, equivalent to an average increase of around,000 people a day. (Table.) Chapter
The 2004 European Parliamentary elections in the United Kingdom
 December 2004 The 2004 European Parliamentary elections in the United Kingdom The official report Translations and other formats For information on obtaining this publication in another language or in
Conservative and Unionist Central Office
 Conservative and Unionist Central Office 32 Smith Square Westminster SW IP 3HH Telephone 01-222 9000 Telegrams Constitute London swl Chairman of the Party: THE RT HON THE LORD THORNEYCROFT CH Vice Chairmen:
National Quali cations
 H 2017 X758/76/11 National Quali cations Politics FRIDAY, 2 JUNE 1:00 PM 3:15 PM Total marks 60 SECTION 1 POLITICAL THEORY 20 marks Attempt Question 1 and EITHER Question 2(a) OR Question 2(b). SECTION
Identification of the respondent: Fields marked with * are mandatory.
 Towards implementing European Public Sector Accounting Standards (EPSAS) for EU Member States - Public consultation on future EPSAS governance principles and structures Fields marked with are mandatory.
Home Office Statistical Bulletin
 Home Office Statistical Bulletin Statistical Bulletins ar e prepared by staff in Home Office Statistics under the National Statistics Code of Practice and can be downloaded from both the UK Statistics
Police complaints. Statistics for England and Wales 2015/16
 Police complaints Statistics for England and Wales 2015/16 Acknowledgements The IPCC would like to thank staff from police force professional standards departments across England and Wales and their IT
The British Parliamentary Constituency Database,
 The British Parliamentary Constituency Database, 1992-2001 Release 1: June 11, 2001 Pippa Norris Publications using the database should reference the source as: Pippa Norris. The British Parliamentary
Firearm crime statistics
 Firearm crime statistics Standard Note: SN/SG/1940 Last updated: 30 January 2012 Author: Gavin Berman Section Social and General Statistics This Standard Note summarises statistics relating to crimes recorded
Options for Romanian and Bulgarian migrants in 2014
 Briefing Paper 4.27 www.migrationwatchuk.com Summary 1. The UK, Germany, France and the Netherlands are the four major countries opening their labour markets in January 2014. All four are likely to be
N o t e. The Treaty of Lisbon: Ratification requirements and present situation in the Member States
 DIRECTORATE-GENERAL FOR INTERNAL POLICIES POLICY DEPARTMENT C CITIZENS' RIGHTS AND CONSTITUTIONAL AFFAIRS 16 January 2008 N o t e The Treaty of Lisbon: Ratification requirements and present situation in
September 2012 Euro area unemployment rate at 11.6% EU27 at 10.6%
 STAT/12/155 31 October 2012 September 2012 Euro area unemployment rate at 11.6% at.6% The euro area 1 (EA17) seasonally-adjusted 2 unemployment rate 3 was 11.6% in September 2012, up from 11.5% in August
2.3 IMMIGRATION: THE NUMBERS
 1964 1966 1968 1970 1972 1974 1976 1978 1980 1982 1984 1986 1988 1990 1992 1994 1996 1998 2000 2002 2004 2006 2008 2010 2012 2014 2016 2.3 IMMIGRATION: THE NUMBERS HOW MANY PEOPLE ARE COMING TO THE UK
Flash Eurobarometer 431. Report. Electoral Rights
 Electoral Rights Survey requested by the European Commission, Directorate-General for Justice and Consumers and co-ordinated by the Directorate-General for Communication This document does not represent
2017 general election Urban-Rural differences
 2017 general election Urban-Rural differences THE POLITICAL GEOGRAPHY OF THE 2017 GENERAL ELECTION 1 Table of Contents I. Urban-Rural classifications... 3 II. Vote share patterns by Rural-Urban ype...
Euro area unemployment rate at 9.9% EU27 at 9.4%
 STAT/11/76 April 2011 Euro area unemployment rate at 9.9% EU27 at 9.4% The euro area 1 (EA17) seasonally-adjusted 2 unemployment rate 3 was 9.9% in April 2011, unchanged compared with March 4. It was.2%
Election Statistics: UK
 1 FEBRUARY 2008 Election Statistics: UK 1918-2007 This paper summarises the results of UK elections since 1918. It focuses on elections to Westminster and includes statistics on voting at general and by-elections,
Fertility rate and employment rate: how do they interact to each other?
 Fertility rate and employment rate: how do they interact to each other? Presentation by Gyula Pulay, general director of the Research Institute of SAO Changing trends From the middle of the last century
European patent filings
 Annual Report 07 - European patent filings European patent filings Total filings This graph shows the geographic origin of the European patent filings. This is determined by the country of residence of
European Parliament Eurobarometer (EB79.5) ONE YEAR TO GO UNTIL THE 2014 EUROPEAN ELECTIONS Institutional Part ANALYTICAL OVERVIEW
 ONE YEAR TO GO UNTIL THE 2014 EUROPEAN ELECTIONS Institutional Part ANALYTICAL OVERVIEW") Directorate-General for Communication Public Opinion Monitoring Unit Brussels, 21 August 2013. European Parliament Eurobarometer (EB79.5) ONE YEAR TO GO UNTIL THE 2014 EUROPEAN ELECTIONS Institutional
Directorate-General for Communication Public Opinion Monitoring Unit Brussels, 21 August 2013. European Parliament Eurobarometer (EB79.5) ONE YEAR TO GO UNTIL THE 2014 EUROPEAN ELECTIONS Institutional
2. The table in the Annex outlines the declarations received by the General Secretariat of the Council and their status to date.
 Council of the European Union Brussels, 10 June 2016 (OR. en) 9603/16 COPEN 184 EUROJUST 69 EJN 36 NOTE From: To: Subject: General Secretariat of the Council Delegations Council Framework Decision 2008/909/JHA
Sentence THE SENTENCING GUIDELINES NEWSLETTER MAY 2005 ISSUE 02
 the Sentencing Guidelines Council MAY 2005 ISSUE 02 The Sentencing Guidelines Council is acutely aware of the growing need for research and statistical information about sentencing as sentencers and local
SCHEDULED MONUMENT CONSENT (SMC)
") SCHEDULED MONUMENT CONSENT (SMC) NOTES FOR APPLICANTS On 1 st October 2009 the procedure for applying for Scheduled Monument Consent changed. Scheduled Monument Consent (SMC) applications are still decided
SCHEDULED MONUMENT CONSENT (SMC) NOTES FOR APPLICANTS On 1 st October 2009 the procedure for applying for Scheduled Monument Consent changed. Scheduled Monument Consent (SMC) applications are still decided
Population and Migration Estimates
 An Phríomh-Oifig Staidrimh Central Statistics Office 21 September 2010 Components of population growth Population and Migration Estimates April 2010 Natural increase Net migration 80 60 40 20 0 Year ending
CONSTITUTION OF THE NATIONAL FRONT
 CONSTITUTION OF THE NATIONAL FRONT 24th Nov 07 (Minor revision 2009) This Constitution completely replaces and supersedes all earlier Constitutions (revised Jan 2002 also includes amendment to 4A passed
EUROPEAN UNION CITIZENSHIP
 Flash Eurobarometer EUROPEAN UNION CITIZENSHIP REPORT Fieldwork: November 2012 Publication: February 2013 This survey has been requested by the European Commission, Directorate-General Justice and co-ordinated
The Party of European Socialists: Stability without success
 The Party of European Socialists: Stability without success Luca Carrieri 1 June 2014 1 In the last European elections, the progressive alliance between the Socialists and the Democrats (S&D) gained a
Analysis of cases of alleged electoral fraud in the UK in 2017
 Analysis of cases of alleged electoral fraud in the UK in 2017 Summary of data recorded by police forces 2018 1 Translations and other formats For information on obtaining this publication in another language
Research Report local elections postpolling. research. Prepared for: Electoral Commission
 Research Report 2013 local elections postpolling public opinion research Prepared for: Electoral Commission 2013 local elections post-polling public opinion research Prepared for: Electoral Commission
UK resident population by country of birth
 UK resident population by country of birth Amy Ellis ONS Centre for Demography In August 2008, estimates of the Population by country of birth and nationality were published for the first time by the Office
Police Complaints: Statistics for England and Wales 2005/06
 Police Complaints: Statistics for England and Wales 2005/06 Emily Gleeson and Helen Dady IPCC Research and Statistics Series: Paper 5 Police Complaints: Statistics for England and Wales 2005/06 Emily Gleeson
Flash Eurobarometer 364 ELECTORAL RIGHTS REPORT
 Flash Eurobarometer ELECTORAL RIGHTS REPORT Fieldwork: November 2012 Publication: March 2013 This survey has been requested by the European Commission, Directorate-General Justice and co-ordinated by Directorate-General
The UK General Election 2010 In-depth
 House of Commons The UK General Election 2010 In-depth Report and Analysis The UK General Election 2010 In-depth Report and Analysis Foreword This report has been produced by the Electoral Reform Society
European Elections in the UK Media Briefing
 European Elections in the UK Media Briefing 7 th May 214 UKIP and the 214 European Parliament elections Dr Philip Lynch (PLL3@le.ac.uk) & Dr Richard Whitaker (rcw11@le.ac.uk) University of Leicester UKIP
Introduction to the European Agency. Cor J.W. Meijer, Director. European Agency for Development in Special Needs Education
 Introduction to the European Agency Cor J.W. Meijer, Director European Agency for Development in Special Needs Education The Agency 17th year of operations 1996 - established as an initiative of the Danish
Brexit. Alan V. Deardorff University of Michigan. For presentation at Adult Learning Institute April 11,
 Brexit Alan V. Deardorff University of Michigan For presentation at Adult Learning Institute April 11, 2017 Brexit Defined: The exit of the United Kingdom from the European Union What that actually means
Europe divided? Attitudes to immigration ahead of the 2019 European elections. Dr. Lenka Dražanová
 Europe divided? Attitudes to immigration ahead of the 2019 European elections Dr. Lenka Dražanová Europe divided? Europeans, overall, becoming more positive to immigration BUT country differences matter!
Home Office Statistical Bulletin
 Home Office Statistical Bulletin Motoring Offences and Breath Test Statistics 05/06 England and Wales 2004 Ransford Fiti and Liza Murray 30 March 2006 The Research, Development and Statistics Directorate
BRIEFING. Migrants in the UK: An Overview.
 BRIEFING Migrants in the UK: An Overview AUTHOR: DR CINZIA RIENZO DR CARLOS VARGAS-SILVA PUBLISHED: 21/02/2017 NEXT UPDATE: 21/02/2018 6th Revision www.migrationobservatory.ox.ac.uk This briefing provides
The sure bet by Theresa May ends up in a hung Parliament
 The sure bet by Theresa May ends up in a hung Parliament Vincenzo Emanuele and Bruno Marino June 9, 2017 The decision by the British Prime Minister, Theresa May, to call a snap election to reinforce her
Home Office Statistical Bulletin
 Home Office Statistical Bulletin Motoring Offences and Breath Test Statistics 06/05 England and Wales 2003 Ransford Fiti, Dave Perry & Liza Murray 26 April 2005 The Research, Development and Statistics
Local Elections 2009
 Local Elections 2009 Colin Rallings and Michael Thrasher September 2009 LGC Elections Centre University of Plymouth Drake Circus Plymouth PL4 8AA Introduction Local elections took place in 34 local authorities
Romania's position in the online database of the European Commission on gender balance in decision-making positions in public administration
 Romania's position in the online database of the European Commission on gender balance in decision-making positions in public administration Comparative Analysis 2014-2015 Str. Petofi Sandor nr.47, Sector
Flash Eurobarometer 430. Report. European Union Citizenship
 European Union Citizenship Survey requested by the European Commission, Directorate-General for Justice and Consumers and co-ordinated by the Directorate-General for Communication This document does not
Exploring Local Areas, Skills and Unemployment
 Exploring Local Areas, Skills and Unemployment Exploratory Data Analysis at Local Area Level Anne E. Green David Owen Anne E. Green Institute for Employment Research University of Warwick Coventry CV4
Party Lists and Preference Voting
 Party Lists and Preference Voting I.D. Hill d.hill928@btinternet.com Abstract Elections by party lists, where voting is just by choosing a single party, can lead to unrepresentative results because of
In 2012, million persons were employed in the EU
 countries: Latvia (2.3 pps) and Estonia (+2.0 pps). On the other hand, the employment rate fell by more than 2 pps in Spain (-2.3 pps), Portugal (-2.4 pps), Cyprus (-3.0 pps) and Greece (-4.3pps). The
EU Main economic achievements. Franco Praussello University of Genoa
 EU Main economic achievements Franco Praussello University of Genoa 1 EU: the early economic steps 1950 9 May Robert Schuman declaration based on the ideas of Jean Monnet. He proposes that France and the
Missing Persons: Data and Analysis 2011/2012
 Missing Persons: Data and Analysis 2011/2012 This document can be provided in alternative formats. Please contact missingpersonsbureau@soca.x.gsi.gov.uk if you require an alternative format. - SOCA (Serious
BRIGADE REGULATIONS. Registered Company: Registered Charity:
 Registered Company: 145122 Registered Charity: 305969 Version: 1.2 September 2018 NB: Amendments The following amendments to were agreed at Brigade Council in Edinburgh on 1 st September 2018. (i) (ii)
Flash Eurobarometer 430. Summary. European Union Citizenship
 European Union Citizenship Survey requested by the European Commission, Directorate-General for Justice and Consumers and co-ordinated by the Directorate-General for Communication This document does not
Population and Migration Estimates
 22 September 2009 Components of population growth Population and Migration Estimates April 2009 Natural increase Net migration 80 60 40 20 0 Year ending April 2008 April 2009 Natural increase 44,600 45,100
CLASSIFICATION/CATEGORISATION SYSTEMS IN AGENCY MEMBER COUNTRIES
 CLASSIFICATION/CATEGORISATION SYSTEMS IN AGENCY MEMBER COUNTRIES The use of different systems of classification/categorisation of needs is currently being debated in a number of ways in almost all European
D Hondt system for allocation of parliamentary positions 22 March 2016
 L&RS NOTE D Hondt system for allocation of parliamentary positions 22 March 2016 Introduction Named after a Belgian lawyer and mathematician, the D Hondt system is a form of proportional representation
Revisiting and Extending Peter Mair: The Impact of Europe on National Parties and Party Systems in the Times of Economic Crisis
 Revisiting and Extending Peter Mair: The Impact of Europe on National Parties and Party Systems in the Times of Economic Crisis Ilke TOYGUR Universidad Autonoma de Madrid (UAM) European University Institute
Special Eurobarometer 464b. Report
 Europeans attitudes towards security Survey requested by the European Commission, Directorate-General for Migration and Home Affairs and co-ordinated by the Directorate-General for Communication This document
Electoral rights of EU citizens
 Flash Eurobarometer 292 The Gallup Organization Flash EB No 292 Electoral Rights Flash Eurobarometer European Commission Electoral rights of EU citizens Fieldwork: March 2010 Publication: October 2010
Local Elections 2007
 Local Elections 2007 Colin Rallings and Michael Thrasher August 2007 LGC Elections Centre University of Plymouth Drake Circus Plymouth PL4 8AA Introduction Local elections took place in England and Scotland
BRIGADE REGULATIONS. Registered Company: Registered Charity:
 Registered Company: 145122 Registered Charity: 305969 Date of Version: 15 September 2012 This page is intentionally blank Page 2 TABLE OF CONTENTS Regulation Section Introduction 1 Mission Statement 2
* * * * * * States. The data have been made, but the current administration divisionsfor the member
 Revista Română de Geografie Politică Year XIII, no. 2, November 2011, pp. 198-209 ISSN 1454-2749, E-ISSN 2065-1619 Article no. 132107-229 ELECTORAL BEHAVIOR OF EUROPEAN ELECTORS IN THE EUROPEAN ELECTIONS
Eurostat Yearbook 2006/07 A goldmine of statistical information
 25/2007-20 February 2007 Eurostat Yearbook 2006/07 A goldmine of statistical information What percentage of the population is overweight or obese? How many foreign languages are learnt by pupils in the
City of Bradford Metropolitan District Council Intelligence Bulletin. population update
 Understanding Bradford District City of Bradford Metropolitan District Council Intelligence Bulletin 5 July 2018 At a glance: Bradford District population update Bradford s population has increased by
Evolution of the European Union, the euro and the Eurozone Sovereign Debt Crisis
 Evolution of the European Union, the euro and the Eurozone Sovereign Debt Crisis Brexit? Dr. Julian Gaspar, Executive Director Center for International Business Studies & Clinical Professor of International
Extended Findings. Finland. ecfr.eu/eucoalitionexplorer. Question 1: Most Contacted
 Extended Findings Finland Preferences Question 1: Most Contacted Finland (2%) is not amongst the most contacted countries within the EU: Germany (22%), France (13%), the UK (11%), Poland (7%), Italy (6%),
Asylum decisions in the EU28 EU Member States granted protection to asylum seekers in 2013 Syrians main beneficiaries
 STAT/14/98 19 June 2014 Asylum decisions in the EU28 EU Member States granted to 135 700 asylum seekers in 2013 Syrians main beneficiaries The EU28 Member States granted to 135 700 asylum seekers in 2013,
Standard Eurobarometer 89 Spring Report. European citizenship
 European citizenship Fieldwork March 2018 Survey requested and co-ordinated by the European Commission, Directorate-General for Communication This document does not represent the point of view of the European
Letter prices in Europe. Up-to-date international letter price survey. March th edition
 Letter prices in Europe Up-to-date international letter price survey. March 2014 13th edition 1 Summary This is the thirteenth time Deutsche Post has carried out a study, drawing a comparison between letter
After the Scotland Act (1998) new institutions were set up to enable devolution in Scotland.
 new institutions were set up to enable devolution in Scotland.") How does devolution work in Scotland? After the Scotland Act (1998) new institutions were set up to enable devolution in Scotland. The Scottish Parliament The Scottish Parliament is made up of 73 MSPs
How does devolution work in Scotland? After the Scotland Act (1998) new institutions were set up to enable devolution in Scotland. The Scottish Parliament The Scottish Parliament is made up of 73 MSPs
EMPLOYMENT OF PERSONS WHO DO NOT MEET CIVIL SERVICE NATIONALITY REQUIREMENTS
 Human Resources Silvan House Edinburgh HUMAN RESOURCES MEMORANDUM No. 2 EMPLOYMENT OF PERSONS WHO DO NOT MEET CIVIL SERVICE NATIONALITY REQUIREMENTS Scope and Purpose 1. Civil Service Nationality Requirements
MIGRATION IN CAMBRIDGESHIRE: 2011 CENSUS MARCH 2015
 MIGRATION IN CAMBRIDGESHIRE: 2011 CENSUS MARCH 2015 Cambridgeshire Research Group is the brand name for Cambridgeshire County Council s Research & Performance Function. As well as supporting the County
Voting at the Northern Ireland Assembly Election, 2003.
 Voting at the Northern Ireland Assembly Election, 2003. Colin Rallings and Michael Thrasher Local Government Chronicle Elections Centre University of Plymouth This report for the Electoral Commission considers
The European emergency number 112
 Flash Eurobarometer The European emergency number 112 REPORT Fieldwork: December 2011 Publication: February 2012 Flash Eurobarometer TNS political & social This survey has been requested by the Directorate-General
NEGOTIATIONS ON ACCESSION BY BULGARIA AND ROMANIA TO THE EUROPEAN UNION
 NEGOTIATIONS ON ACCESSION BY BULGARIA AND ROMANIA TO THE EUROPEAN UNION Brussels, 31 March 2005 AA 1/2/05 REV 2 TREATY OF ACCESSION: TABLE OF CONTENTS DRAFT LEGISLATIVE ACTS AND OTHER INSTRUMENTS Delegations
IMMIGRATION, ASYLUM AND NATIONALITY ACT 2006 INFORMATION FOR CANDIDATES
 Morecambe and Heysham Grosvenor Park Primary School Roeburn Drive, Morecambe. Lancashire. LA3 3RY www.grosvenorpark.lancs.sch.uk (01524) 845708 Headteacher : Mr. Kevin Kendall head@grosvenorpark.lancs.sch.uk
Q&A on the European Citizens' Initiative
 Q&A on the European Citizens' Initiative From 1 April onwards, EU citizens will be able to ask the European Union to introduce new legislation - provided the organisers can muster one million signatures.
Women in the EU. Fieldwork : February-March 2011 Publication: June Special Eurobarometer / Wave 75.1 TNS Opinion & Social EUROPEAN PARLIAMENT
 EUROPEAN PARLIAMENT Women in the EU Eurobaromètre Spécial / Vague 74.3 TNS Opinion & Social Fieldwork : February-March 2011 Publication: June 2011 Special Eurobarometer / Wave 75.1 TNS Opinion & Social
Proportional representation and local government Lessons from Europe. Colin Rallings, Michael Thrasher and Gerry Stoker
 Proportional representation and local government Lessons from Europe Colin Rallings, Michael Thrasher and Gerry Stoker The Joseph Rowntree Foundation has supported this project as part of its programme
Gender pay gap in public services: an initial report
 Introduction This report 1 examines the gender pay gap, the difference between what men and women earn, in public services. Drawing on figures from both Eurostat, the statistical office of the European
PUBLIC OPINION IN THE EUROPEAN UNION
 Standard Eurobarometer 81 Spring 2014 PUBLIC OPINION IN THE EUROPEAN UNION FIRST RESULTS Fieldwork: June 2014 Publication: July 2014 This survey has been requested and co-ordinated by the European Commission,
INTERNAL SECURITY. Publication: November 2011
 Special Eurobarometer 371 European Commission INTERNAL SECURITY REPORT Special Eurobarometer 371 / Wave TNS opinion & social Fieldwork: June 2011 Publication: November 2011 This survey has been requested
Flash Eurobarometer 431. Summary. Electoral Rights
 Survey requested by the European Commission, Directorate-General for Justice and Consumers and co-ordinated by the Directorate-General for Communication This document does not represent the point of view
Baseline study on EU New Member States Level of Integration and Engagement in EU Decision- Making
 Key findings: The New Member States are more optimistic about the EU, while the Old Member States are more engaged in EU matters. Out of 4 NMS Bulgaria, Czech Republic, Latvia, Poland the citizens of Bulgaria