2014 Citizen Satisfaction Survey
|
|
|
- Hope Maxwell
- 5 years ago
- Views:
Transcription


1 Loveland Police Department 2014 Citizen Satisfaction Survey Results Analysis & Presentation Prepared by: Mark Rudolph Crime Analyst December 2014
2 Contents Introduction... 4 Purpose... 4 Methodology... 4 Comparisons to 2011 survey... 5 Acknowledgements... 6 Executive summary... 7 Demographics of the survey respondents... 9 Residency demographics Years Lived in Loveland... 9 Residency demographics Police District of Residency... 9 Age demographic: Gender Demographics Summary and Analysis of Survey Question Responses Question 4 - Satisfaction with services Quick Response to emergency situation Crime control in neighborhood Help with nuisance issues Providing crime prevention advice Understanding community concerns Providing fair and equal treatment to all Handling citizen s complaints Question 5 Formal Contact with the Department in last 36 months Questions 6 - Satisfaction with employee contact Phone (Dispatch) Uniformed Patrol Contact Records Personnel Contact CSO Contact Detective Contact Traffic Officer Contact Chief/Captains Contact Admin Personnel Contact Question 7 - Officer Response time to calls for service Question 8 Circumstances of contact Telephone contact
3 Animal problem Parking problem Traffic stop or ticket Victim of or witness to a crime Witness to a traffic accident Arrested by police Informal contact Question 9 - What we are doing well Question 10 - Quality of service Question 11 - Use of Police Department web site Question 12 - Satisfaction with police services in neighborhood Question 13 - Satisfaction with police services in City as a whole Question 14 Characteristics/qualities of police officers Professional Courteous Knowledgeable Trustworthy Hard working Easy to approach Fair Question 15 (1) - LPD should make use of Social Media to interact with the public Question 15 (2) Comfort with contacting LPD to file a complaint against a police employee Question 15 (3) Improving public safety/quality of life are responsibilities of both citizens and police Question 15 (4) Police have adequate ethnic/cultural awareness training to perform duties/responsibilities Question 15 Agreement Levels Chart Question 16 - Importance of police programs Neighborhood Watch Gang Prevention Underage Liquor Enforcement Illegal Drug Use Enforcement School Resource Officers Crime Prevention Santa Cops Fishing Derby
4 Citizen s Police Academy Department Accreditation Loveland Community Night Sexual Harassment/Rape Prevention Question 17 - Sources of information Question 18 - Basis of opinions Question 19 - Most important issues Comments from Survey Question 9: Comments from What do you feel the Loveland Police Department is doing especially well? Question 19: Comments from What is the most important issue the Loveland Police Department should be addressing? ADDITIONAL WRITTEN COMMENTS FROM 2014 SURVEY
5 Introduction Purpose The primary purpose for conducting the Loveland Police Department's 2014 Community Satisfaction Survey was to determine Loveland's citizen s perceptions of the overall quality of police services in the community. In addition to determining the levels of satisfaction with current police services provided, we also wanted to assess community opinions and desires concerning programs currently provided by the Loveland Police Department. Citizen's perceptions of the quality and importance of police services and delivery in Loveland should serve to inform the public as well as the City Council and police administrators who make management decisions regarding priorities, budgets, staffing and general or operational planning. The survey provides an opportunity for the Loveland Police Department to identify areas in which it is performing well along with areas needing improvement. The Department values communication, organizational excellence, the people we serve, and citizen input to assure an informed and balanced perspective in delivery of police services. Where possible, information obtained from this survey may be compared to responses from the year 2011 survey and from future surveys to possibly identify trends and gauge progress toward meeting the needs of Loveland's citizens for police services. Methodology The Loveland Police Department's 2014 Community Satisfaction Survey was mailed to 2587 residences in October The names of 2587 residents were randomly drawn from the City of Loveland utility billing database in proportion to the population of the Police Department's five Patrol Districts. The survey was developed internally and reviewed by police command staff. The goal for the survey was to obtain enough responses such that a 95% confidence level with a ± 5% error window for statistical accuracy could be claimed. Based on Loveland s estimated 2014 population of 71,985 1, to meet this standard a minimum of 382 survey responses were needed. Statistical formulas/survey tools 2 were used to calculate this. Using a conservative 15% response rate based on the 2014 estimated population number (the 2011 survey had an 18.9% response rate), the statistical formulas dictated that the survey be sent out to a minimum of 2547 people in order to achieve at least 382 responses (assuming a 15% response rate or higher). By mailing out 2587 surveys, we met/exceeded the minimum number of surveys sent out to achieve this goal and could tolerate a slightly lower response rate. A total of 386 surveys were returned out of the 2587 mailed out which was a response rate of 14.9%. The response rate ranged from 7.5% to 26.9% among the five patrol districts. Responses from the returned surveys were compiled for analysis with no attempt made to identify respondents from the responses made on the surveys. The identity of those Loveland citizens who may have inadvertently made themselves known on the returned survey or envelopes will remain anonymous. While the number of respondents represents only a small fraction of the total number of households in the City, the random sampling procedure used to select the survey mailing list ensures that results are statistically reliable within a 5% confidence interval at the 95% confidence level. These two concepts work together to determine how accurate survey results are. For example, if you have 95% confidence with an error of 5%, you are saying that if you were to 1 Population figures from City of Loveland Community and Strategic Planning Data Assumptions Report. Revised August
6 conduct the same survey 100 times, that 95 times out of 100, the subsequent results would be within ± 5% of the initial survey results. Another way to look at this is as follows: If 62% of the survey respondents "feel comfortable contacting the Loveland Police Department to make suggestions", then 95 out of every 100 times that this survey might be administered to Loveland residents, the percentage of the entire population that "feel comfortable contacting the Loveland Police Department to make suggestions" will fall between 57% and 67% (62% ± 5%). The reader should keep in mind that any comparative differences that are less than 10% are not statistically significant due to ± 5% sampling error. This is especially so for comparisons involving small sample size. Comparisons to 2011 survey Some results from this survey will be compared to the results from the 2011 survey. It should be noted that the 2011 survey was statistically valid at a 95% confidence level but with a ± 5.3% confidence interval (error rate), which just means the window of error was slightly larger than the results of the 2014 survey. But the methodology for selecting the random sample was done the same for both survey years. The information obtained from this survey may help evaluate citizen concerns and assist the Loveland Police Department in development of specific strategies for particular patrol districts in the City. The survey items/questions (dependent variables) considered in the analysis included: 1. Respondent satisfaction with several categories of police services. 2. Respondent satisfaction with the attitude, behavior and competence of police personnel with whom they came into contact. 3. Respondent satisfaction with the quality of service received relative to their expectations. 4. Respondent satisfaction with general police services provided in their neighborhood or in the City as a whole. 5. Agreement or disagreement with several statements regarding police services in Loveland. 6. The relative importance of various Loveland Police Department programs. 7. Gender, age, years of residency in Loveland, and patrol districts were the independent variables in most of the analyses. Detailed data regarding responses to specific survey questions is available upon request. 5
7 Acknowledgements Being the first survey I have had the pleasure of doing for the Loveland Police Department in my tenure as Crime Analyst, I would like to thank several City of Loveland employees for their contributions to this effort. Kim Pals, Records Manager, for her assistance and help in providing me information on resources and people I needed to contact/involve to accomplish this survey project as well as general guidance when I had questions. Delora Dixon, from IT, for her help in obtaining the random sample of residences for the survey. Janice Szallar, from Facilities Support Services, for her work with the mailing of the surveys. Barbara Wolf, Senior GIS Specialist from the City of Loveland s GIS Department, for assistance with the census population breakdown by police district. I would also like to acknowledge and thank the following Members of the Loveland Police Department Senior Volunteers for their help in preparing the survey mailing (folding inserts, and stuffing, sealing, and stamping the envelopes): Sue Barger, Bob Charovano, Lupe Espindola, Les Keeney, John Kindred, Pam Pellizarri, and Sherell Swartzendruber. Additional thanks goes to Lucie Blanchard - Admin volunteer, and Cathy McDaniel Admin volunteer for their work in doing the bulk of the data entry of the received responses. Most importantly, I thank the citizens of Loveland who took the time to complete and return surveys for analysis. All citizen responses and comments were noted and will be considered thoughtfully and carefully. Mark Rudolph Crime Analyst 6
8 Executive summary Significant findings of this survey and some comparisons with previous surveys include: 94.9% of respondents agreed that improving public safety and the quality of life in Loveland are responsibilities of both citizens and police (up from 91.8% in 2011). 95.1% of respondents are satisfied with the general level of police services in the entire City (up from 93.1% in 2011). 91.3% of respondents are satisfied with the general level of police services in their neighborhood (down slightly from 91.9% in 2011). 77.5% of respondents were satisfied with the Police Department's quick response to emergency situations (up slightly from 77.1% in 2011). However, respondents were less satisfied with the Police Department's provision of crime control in their neighborhood (76.7%), fair and equal treatment to all (71.0%), handling of citizen s complaints (65.3%), understanding of community concerns (66.9%), provision of crime prevention advice (64.9%) and help with nuisance issues (64.1%). Respondents stated that the Police Department does especially well with having a visible presence on the streets of the City, around schools and in their neighborhoods; having professional and helpful interactions with citizens; ensuring public safety and gang prevention/control. These were mentioned in both specific comment oriented questions as well as in general comments. The levels of competence of traffic officers and detectives were rated good, very good or excellent by 84.9% and 92.5% of respondents (up from 83% and 82.8% in 2011) respectively, while their attitudes and behaviors were rated good, very good or excellent by 81.8% and 97.1% of respondents (up from 80.3% and 80% in 2011) respectively. Victims were less satisfied with the competence of traffic officers than were all other respondents (68.8% vs. 84.9%). Among respondents who had formal contact with the Police Department, 41.6% indicated that the quality of service which they received was higher than expected and 49.3% indicated that the quality of service was as expected. From 87.1% to 91.6% of all respondents agreed that Loveland police officers were easy to approach, trustworthy, fair, courteous, hardworking, knowledgeable or professional. 16.5% of respondents would not feel comfortable about contacting the Police Department to file a complaint against a police employee, 22.9% were undecided and 60.6% would feel comfortable about filing a complaint. 67.7% of respondents indicated that the police have adequate ethnic and cultural awareness training (down slightly from 69.9% in 2011). The 30 to 39 year old age group and the residents who had lived here 11 to 15 years often exhibited significant differences in their ratings in various program or service/satisfaction categories than the other groups within their demographic category. This is noted in the specific question/category areas in the report on later pages. 7
9 The importance to the community of Loveland Police Department programs and percent change from the 2011 survey are as follows: 2014 survey Change from 2011 survey o Gang prevention 94.3% -0.2% o Sexual harassment/rape prevention 93.4% 1.8% o Illegal drug-use enforcement 89.1% -2.7% o Crime prevention 87.4% 1.5% o Neighborhood Watch 83.7% -1.0% o Police Department accreditation 83.2% 1.9% o School resource officers 82.3% 5.3% o Underage liquor enforcement 78.5% -2.3% o Community Night Out 67.1% 10.8% o Citizens Police Academy 58.9% 5.2% o Santa Cops 57.1% 0.3% o Police Fish Derby 51.7% 3.9% School resource officers and Santa Cops police programs were more important to females than they were to males. 63.5% of respondents indicated that the Loveland Reporter-Herald newspaper was their primary source of information about the Police Department. 52.5% of respondents based their opinions in the survey on personal experience with the Police Department. Respondents stated that the most important issues that the Police Department should be addressing are gang prevention/issues followed by illegal drug use, enforcement of traffic laws, and public safety, crime prevention. 8
10 Demographics of the survey respondents Residency demographics Years Lived in Loveland Respondents that answered: N = 370 Average (mean): years Median: 21.5 years Mode: 1 year Range: 0 years to 97 Years Over half (51.4%) have lived in Loveland for more than 20 years and 79.1% have lived in Loveland for 8 years or longer. Respondents were assigned to a group for determination of the effects of length of residency in Loveland on survey responses. Years in Loveland 2014 Survey 2011 Survey 0-5 years 65 (17.6%) 17.8% 6-10 years 40 (10.8%) 17.5% years 51 (13.8%) 16.3% years 24 ( 6.5%) 9.9% More than 20 years 190 (51.4%) 38.6% Residency demographics Police District of Residency Respondents that answered: N = 369 The percentage of Loveland s population that lives in each Patrol district is based off of US Census data from 2010 (est. population 69,666). % (#) of Respondents % of Population (2010 Census) District % (78) 16.2% (11,268) District % (63) 19.0% (13,245) District % (104) 31.3% (21,771) District % (95) 28.7% (20,018) District 5 7.9% (29) 4.8% (3,364) Response rate by Police District District 5 7.9% District % District % District % District % 9
11 Age demographic: Respondents that answered: N = 378 Average (mean): years Median: 63 years Mode: 66 years Range: 21 to 97 years Respondents were assigned to one of seven age range groups (see the Demographic Data graph) for determination of age effects on survey responses. The age group had the largest percentage at 28.6%. Age range group years old 16 (4.2%) years old 31 (8.2%) years old 41 (10.8%) years old 66 (17.5%) years old 108 (28.6%) years old 74 (19.6%) years old 42 (11.1%) years old 6 ( 1.6%) 120 Surveys Returned by Age Group # of Surveys to to to to to to to to 99 Age Group 10
12 Gender Demographics Respondents that answered: N = 381 The percent of males and females who returned a completed survey was essentially the same as the 2011 survey Females 198 (52.0%) 52.5% Males 183 (48.0%) 47.5% Response rate by Gender Males 48.0% Females 52.0% 11
13 Summary and Analysis of Survey Question Responses Any significant differences due to gender, age, years of residency in Loveland, patrol districts, or type of contact involvement with the Loveland Police Department among respondents to any questions in the survey are specifically noted in the question/categories that follow. Question 4 - Satisfaction with services Quick Response to emergency situation N = 334 A total of 77.5% of respondents were satisfied with the Loveland Police Department s quick response to emergency situations. Only 2.4% were dissatisfied. The remaining 20.1% were indifferent in their response. Victims/Witnesses of a crime reported lower satisfaction at 69.6% with 30.4% being indifferent. 76.1% of respondents whose involvement was related to a traffic stop or ticket reported being satisfied with the Loveland Police Department s quick response to emergency situations with 23.9% being indifferent. Crime control in neighborhood N = 348 A total of 76.7% of respondents were satisfied with the Loveland Police Department s control of crime in their neighborhood. 6.1% were dissatisfied and the remaining 17.2% were indifferent in their response. 72.3% of Victims/Witnesses of a crime and 81.3% of those involved in a traffic stop/ticket were satisfied regarding crime control in their neighborhood. Help with nuisance issues N = 332 This garnered the lowest satisfaction rate of the service categories with 64.1% of respondents being satisfied. 9.6% were dissatisfied with Loveland Police Department s help with nuisance issues. The remaining 26.2% were indifferent in their response. Providing crime prevention advice N = % of respondents were satisfied, 7.3% were not satisfied, and the remaining 27.7% were indifferent. Respondents who have lived in Loveland for 11 to 15 years differed significantly as follows, 48.8% were satisfied, 43.9% were neutral/indifferent, and 7.3% were not satisfied. Similarly, respondents in the 30 to 39 year old age group differed as follows: 44.8% were satisfied (21.4% lower than all other respondents), 31% were neutral, and 24.1% were dissatisfied. Understanding community concerns N = % of respondents were satisfied, 6.6% were not satisfied, and 26.4% indifferent in regards to how they felt regarding the Loveland Police Department s understanding of community concerns. Significant differences were seen in the following demographic groups: 11 to 15 years lived in Loveland: 58.1% satisfied, 34.9% neutral, and 7% dissatisfied. 30 to 39 year olds: 44.8% satisfied, 34.5% neutral, and 20.7% dissatisfied. Providing fair and equal treatment to all N = % satisfied, 6.6% not satisfied, 22.4% indifferent. Victims/Witnesses of a crime reported lower satisfaction at 62.8% as did respondents involved in a traffic stop/ticket at 64.4% satisfied. 30 to 39 year olds again displayed significant difference in their ratings as compared to the entire survey group as follows: Only 48.3% were satisfied, with 31% being neutral and 20.7% being dissatisfied. 12
14 Handling citizen s complaints N = % were satisfied, 8.7% were not satisfied, while 26.0% of respondents were indifferent. The following demographic groups showed significant differences in their ratings compared to the rest of the survey group. 11 to 15 years lived in Loveland: 57.1% satisfied, 33.3% neutral, and 9.5% dissatisfied. 30 to 39 year olds: 43.3% satisfied, 30% neutral, and 26.7% dissatisfied. 13

15 Question 4 Chart: 14
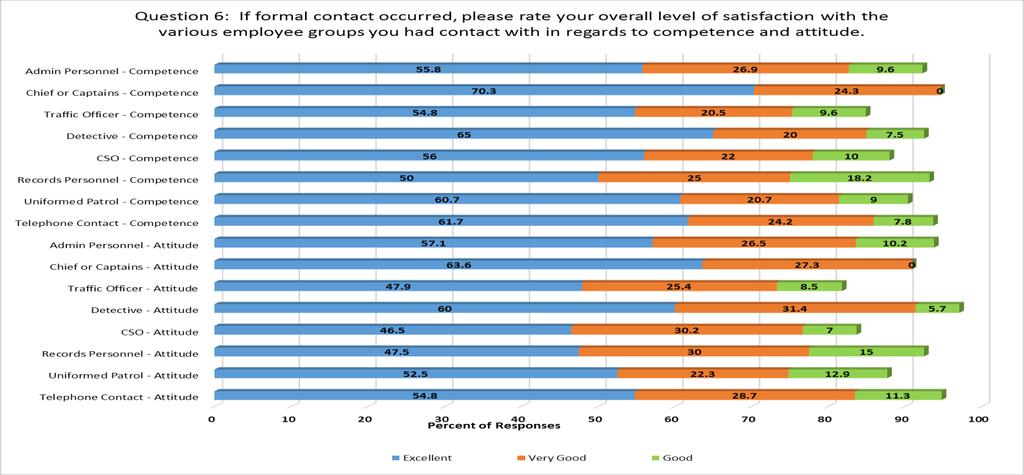
16 There were some significant differences in satisfaction levels within the various demographic groups for these categories. The quick response category saw lower satisfaction rates from the 30 to 39 year old age group at just 60.7% and District 4 respondents were more satisfied at 83.3% of respondents than other districts which all reported satisfaction rates between 75-77%. District 1 respondents were less satisfied with crime control in their neighborhoods than the other districts at 64.9% which was almost 10% lower than the next lowest district. Help with nuisance issues garnered less satisfaction for District 1 and 2 respondents than the other districts at 58.9% and 57.4% respectively. Amongst the 30 to 39 years-of-age group, respondents were much less satisfied with the crime prevention advice provided by the Police Department than were any other age group (44.8% vs. next lowest group at 54.5%). Males were much less satisfied with help with nuisance issues than females (58.2% satisfied vs. 70.3% satisfied respectively). Victims/witnesses of a crime (49 respondents) were significantly less satisfied with quick response to emergency situations (69.6% vs. 77.5%), and fair and equal treatment (62.8% vs. 71.0%) than were all other respondents. Question 5 Formal Contact with the Department in last 36 months N = % of respondents indicated that they or a member of their immediate family had formal contact with the Loveland Police Department during the prior 36 months. Questions 6 - Satisfaction with employee contact All employee groups had an 80% or higher response rate with regards to citizen s rating their satisfaction level at Good or better. Contact with a Traffic Officer had the lowest percentage of Good or better rating, while the Detectives, Records Personnel, Dispatch, Admin Personnel, and Captains/Chief groups were at 90% or higher for both attitude and competence being rated as Good or better. (Question 6 graph on page 17). Phone (Dispatch) Attitude: N = % rated their level of satisfaction as Good or better. Good (11.3%), Very Good (28.7%), Excellent (54.8%). Competence: N = % rated their level of satisfaction as Good (7.8%), Very Good (24.2%), or Excellent (61.7%). Uniformed Patrol Contact Attitude: N = % rated their level of satisfaction as Good (12.9%), Very Good (22.3%), or Excellent (52.5%). Competence: N = % rated their level of satisfaction as Good (9%), Very Good (20.7%), or Excellent (60.7%). Records Personnel Contact Attitude: N = % rated their level of satisfaction as Good (15%), Very Good (30%), or Excellent (47.5%). Competence: N = % rated their level of satisfaction as Good (18.2%), Very Good (25%), or Excellent (50%). CSO Contact Attitude: N = % rated their level of satisfaction as Good (7%), Very Good (30.2%), or Excellent (46.5%). Competence: N = 50 88% rated their level of satisfaction as Good (10%), Very Good (22%), or Excellent (56%). 15
17 Detective Contact Attitude: N = % rated their level of satisfaction as Good (5.7%), Very Good (31.4%), or Excellent (60%). Competence: N = % rated their level of satisfaction as Good (7.5%), Very Good (20%), or Excellent (65%). Traffic Officer Contact Attitude: N = % rated their level of satisfaction as Good (8.5%), Very Good (25.4%), or Excellent (47.9%). Competence: N = % rated their level of satisfaction as Good (9.6%), Very Good (20.5%), or Excellent (54.8%). Chief/Captains Contact Attitude: N = % rated their level of satisfaction as Very Good (27.3%), or Excellent (63.6%). Competence: N = % rated their level of satisfaction as Very Good (24.3%) or Excellent (70.3%). Admin Personnel Contact Attitude: N = % rated their level of satisfaction as Good (10.2%), Very Good (26.5%), or Excellent (57.1%). Competence: N = % rated their level of satisfaction as Good (9.6%), Very Good (26.9%), or Excellent (55.8%). A total of 49 respondents were victims/witnesses of a crime. Their levels of satisfaction with Police Department employees were rated as good, very good or excellent by % of the respondents. Victims/witnesses of crimes were more satisfied with the attitude (100% vs. 97.1%) of detectives than were all other respondents. However, they were less satisfied with the attitude (50.0% vs. 90.9%) and competence (66.7% vs. 94.6%) of the Chief or captains than were all other respondents. A total of 50 respondents had contact with Police Department employees as the result of a traffic stop or ticket. They were more satisfied (p<.05) than all other respondents with the attitude (100.0% vs. 92.5%) and competence (100.0% vs. 93.2%) of records personnel and the attitude (100.0% vs. 94.8%) and competence (95.7% vs. 93.7%) of dispatchers (phone contact). 16
18 17
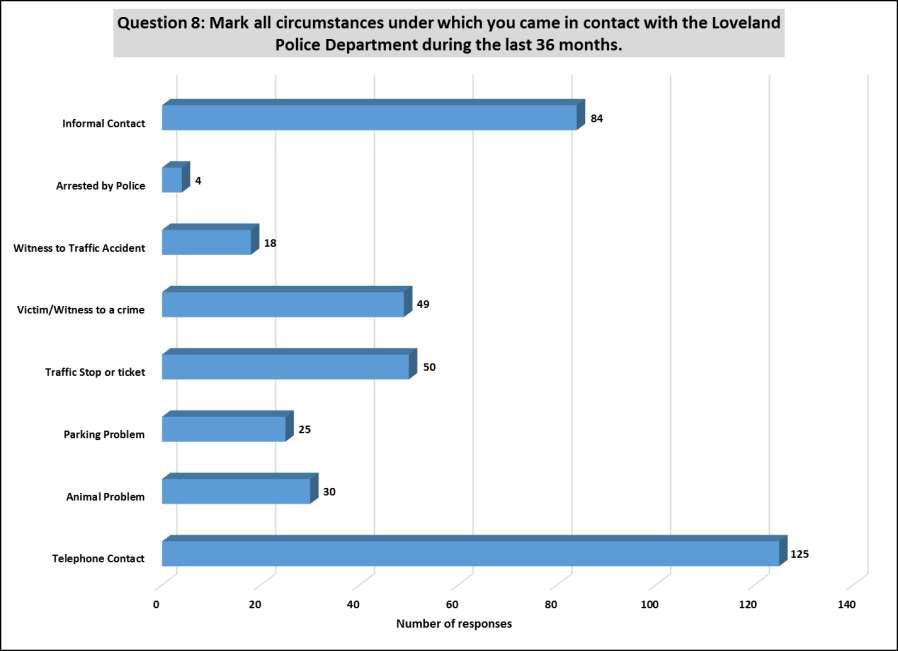
19 Question 7 - Officer Response time to calls for service N = 132 A total of 50% of respondents (up from 42.1% in 2011) indicated that it took less than 10 minutes for a police officer to arrive at their location when called for service. An additional 36.4% indicated that it took minutes and 8.3% indicated that it took minutes. Only 5.3% indicated it took over an hour. Officer response time to calls for service Over one hour 5.3% Under 10 Minutes 50.0% 30 minutes to one hour 8.3% 10 to 29 minutes 36.4% Question 8 Circumstances of contact N = 386 for all (either Yes or No) Graph on next page. Telephone contact 32.4% had contact via telephone (125 respondents) Animal problem 7.8% indicated an animal problem as a circumstance of their contact (30 respondents) Parking problem 6.5% indicated a parking problem as a circumstance of their contact (25 respondents) Traffic stop or ticket 13% indicated that a traffic stop or ticket was the circumstance of their contact (50 respondents) Victim of or witness to a crime 12.7% indicated they were the victim of or witness to a crime (49 respondents) Witness to a traffic accident 4.7% indicated they were witness to a traffic accident (18 respondents) Arrested by police 1% indicated they had been arrested as the circumstance of their contact (4 respondents) Informal contact 21.8% indicated that their contact circumstance was an informal contact with the Loveland Police Department (84 respondents) 18
20 19
21 Question 9 - What we are doing well There were 218 responses to the open-ended survey question What do you feel the Loveland Police Department is doing especially well?". The responses were grouped into general categories. Among the most frequent responses were: 1) Having a visible patrol presence around the city, in neighborhoods, and schools 2) Citizen and community safety and crime prevention 3) Dealing with traffic/speeding issues 4) Good response times 5) Having professional and helpful interactions with citizens Question 10 - Quality of service N = % of the respondents who answered indicated that the quality of service they received during their most recent contact with Loveland Police Department met their expectations or was higher than they expected. This is higher than the 87.3% from the 2011 Survey. 50 Quality Of Service Received 49.5 Percentage of Responses H igher than expected What I expected Lower than expected This favorable rating was also true for the 49 respondents who said they were victims/witnesses of crimes (87.8%, up from 81.7% in 2011). Also of the 50 respondents whose contact with the Police Department involved a traffic stop or ticket, 90% indicated a quality of service that met or exceeded their expectations (up from 77.4% in 2011). 20
22 Question 11 - Use of Police Department web site N = 376 Only 13.6% (51 people) of the respondents to this question answered that they have used/visited the Police Department s web site. This is up slightly from 11.6% in Use of Police Department Website Yes 13.6% No 86.4% No one over the age of 79 years had used it while 27.7% (13 people) of respondents who were years-of-age (n=47) had used the web site. 100 Web site users by Age Group # of Respondents Yes No 0 20 to to to to to to to to 99 No Response Age Grouping 21
23 Of the 51 people who have used the website, 52.9% were female (27 people) and 47.1% were male (24 people). Website users by Gender Male 47.1% Female 52.9% Question 12 - Satisfaction with police services in neighborhood N = 300 A total of 91.3% (274 of 300 respondents) were satisfied with the general police services provided in their neighborhood. 160 Satisfaction with Neighborhood Services # of Responses Very Satisfied 2 - Satisfied 3 - Dissatisfied 4 - Very Dissatisfied Satisfaction Level 22
24 93.6% (146 out of 156) of female respondents to this question indicated they were satisfied with neighborhood police services. 89.4% (126 out of 141) of male respondents to this question indicated they were satisfied. Neighborhood Services Satisfaction by Gender # of Responses F emale Male V ery Satisfied 2 - Satisfied 3 - Dissatisfied 4 - V ery Dissatisfied Satisfaction Level 92.4% of respondents aged 60 years and older were satisfied while 89.6% of respondents aged 20 to 59 were satisfied with the general police services in their neighborhood. Respondents who were victims of/witnesses to a crime had a satisfaction level of 82.6% with the general police services in their neighborhood (up from 79.6% in 2011). Question 13 - Satisfaction with police services in City as a whole N = 362 A total of 95.1% (344 of 362 respondents) were satisfied with the general police services provided in the City as a whole by the Loveland Police Department (up from 93.1% in 2011). 200 Citywide Police Services Satisfaction 195 # of Responses V ery Satisfied 2 - Satisfied 3 - Dissatisfied 4 - V ery Dissatisfied Satisfaction Level 23
25 97.3% (178 out of 183) of female respondents to this question indicated they were satisfied with police services provided in the City as a whole. 92.6% (163 out of 176) of male respondents to this question indicated they were satisfied. 100 Citywide Police Services Satisfaction by Gender # of Responses F emale Male V ery Satisfied 2 - Satisfied 3 - Dissatisfied 4 - V ery Dissatisfied Satisfaction Level 96.2% (202 out of 210) of respondents aged 60 years and older were satisfied while 93.9% (138 out of 147) of respondents aged 20 to 59 were satisfied with the police services in the City as a whole. 86.9% of respondents who were victims of/witnesses of to a crime (n = 46) were satisfied with the general police services provided in the City as a whole (up from 82.6% in 2011). 24

26 Question 14 Characteristics/qualities of police officers From 87.1% to 91.6% of all respondents agreed that Loveland police officers were easy to approach, trustworthy, fair, courteous, hardworking, knowledgeable or professional (Question 14 graph). 25
27 Professional N = % of overall respondents agreed that Loveland police officers were professional in responding to the public. Of note amongst the age groups was that 76.9% of the 30 to 39 year old age group agreed that Loveland officers were professional. All other age groupings had an agreement rate of 84% or higher. Courteous N = % of respondents agreed that officers were courteous in their interactions with the public. The 30 to 39 age group was once again the lowest in agreement regarding the courtesy of Loveland police officers at only 76.9% with all other age groups agreeing at a rate of 88% or higher. Females and males differed by less than 2% in their agreement (91.1% and 89.4% respectively). Knowledgeable N = % of the survey respondents agree that Loveland police officers are knowledgeable. Those living in Loveland between 11 and 15 years had the lowest agreement rate at 83.3%, with all other groups based on residency length coming in at 90% or higher. Amongst the age groups, the 30 to 39 age group was the lowest at 76.9% again, with all other age groups ranging from 83% to 100% in their agreement. Trustworthy N = % of respondents indicated they agree that Loveland police officers are trustworthy in responding to the public. 84.3% of respondents in District 4 agreed that officers were trustworthy which was the lowest, as all other district respondents came in at 90% or higher. The 30 to 39 year old age group was the lowest in agreement at 74.1%. All other age groups ranged from 83.3% to 100% in their agreement of Loveland police officers being trustworthy. Hard working N = % agreed that Loveland police officers are hardworking. 76.5% of respondents who have lived in Loveland for 11 to 15 years agreed that Loveland officers are hard working. All other residency groups came in at 90% or higher in agreement about Loveland police officers being hard working. Easy to approach N = % of survey respondents indicated they feel that Loveland police officers are easy to approach. District 2 and District 4 respondents agreed at 84.4% and 82.2% respectively. Respondents from District 1, 3, and 5 agreed at rates of 90.6%, 90.2%, and 94.7% respectively. Respondents aged 50 years and older came in at 89.9% in agreeing that Loveland police officers are easy to approach, while those respondents 49 and younger were at 82.2%. Fair N = % of respondents agreed that they feel that Loveland police officers are fair when responding to the public. Respondents aged 49 and younger showed less agreement than those 50 and older (77.5% vs. 90.9%). Victims/witnesses of a crime generally assessed the characteristics of Loveland police officers in all categories as slightly lower than all other respondents as follows: Professional 91.5% vs. 91.6% Courteous 87.5% vs. 90.4% Knowledgeable 83.3% vs. 90.7% Trustworthy 85.1% vs. 89.5% Hardworking 86.9% vs. 90% Easy to approach 79.2% vs. 87.1% Fair 80% vs. 87.4% 26
28 Respondents whose contact involved traffic stops or tickets also generally assessed the characteristics of police officers as 2-8% lower than all other respondents as follows: Professional 84.4% vs. 91.6% Courteous 84.8% vs. 90.4% Knowledgeable 84.4% vs. 90.7% Trustworthy 81% vs. 89.5% Hardworking 88.1% vs. 90% Easy to approach 84.4% vs. 87.1% Fair 79.5% vs. 87.4% Question 15 (1) - LPD should make use of Social Media to interact with the public 39.9% of 348 respondents agreed that the Police Department should use Facebook, Twitter, or other social media to interact with the public. This is up from 30% in More males than females indicated that social media should be used (42.9% vs. 37.9%). Question 15 (2) Comfort with contacting LPD to file a complaint against a police employee 60.6% of 345 respondents agreed that they would feel comfortable filing a complaint against a police employee. This is up from 56.1% in Victims/Witnesses of a crime were less comfortable with filing a complaint than all other respondents as only 48.9% indicated they would feel comfortable doing so. Question 15 (3) Improving public safety/quality of life are responsibilities of both citizens and police 94.9% of 370 respondents agreed that improving public safety and the quality of life in Loveland are responsibilities of both citizens and the police. This also is up from 91.8% in Question 15 (4) Police have adequate ethnic/cultural awareness training to perform duties/responsibilities 67.7% of 322 respondents indicated that they agree that police officers have adequate ethnic/cultural awareness training to perform their duties/responsibilities. This is down slightly from the 69.9% that indicated as such in There was significant disparity amongst respondents from the various police districts in regards to agreement with this question. Only 57.4% of respondents from District 1 agreed, while respondents from District 2 and District 3 indicated agreement at 73.6% and 79.8% respectively. 27

29 Question 15 Agreement Levels Chart 28

30 Question 16 - Importance of police programs Respondents indicated that many Police Department programs were important to the community (Question 16 graph). Any differences in importance for specific programs related to age, gender, District and years lived in Loveland will be addressed under each specific program listing below. The most important Loveland Police Department community programs were the traditional law enforcement activities of gang prevention (94.3%), sexual harassment and rape prevention (93.4%), illegal drug-use law enforcement (89.1%), crime prevention (87.4%), Neighborhood Watch (83.7%), accreditation (83.2%), school resource officers (82.3%) and underage liquor law enforcement (78.5%). Future budget constraints might require evaluation and termination of some community programs sponsored by the Loveland Police Department. Citizen responses obtained from this survey might provide guidance regarding the importance and priority of such programs. 29
31 Neighborhood Watch N = 368 Overall, 83.7% (308) of respondents indicated that they felt the Neighborhood Watch Program was important. Females rated it as more important than males (88.2% versus 78.8%). The two age groups with the highest rating of importance for this program were the 70 to 79 year olds at 88.2% and the 20 to 29 year olds at 87.5%. The two lowest age groups were the 50 to 59 year olds at 76.9% and the 30 to 39 year olds at 80.6%. The respondents in District 3 had the highest importance rating at 89.9%, while those in District 2 were the lowest at 78.7%. There was no significant difference in importance rating based on the number of years lived in Loveland. Gang Prevention N = 366 Gang prevention had the highest importance rating of all the programs at 94.3%. Even when broken down by age group, gender, years lived in Loveland and District, all groups rated the importance above a 90% level. This shows that Gang prevention is a prevalent issue and is important across many demographic levels. Underage Liquor Enforcement N = 368 Underage liquor enforcement had an overall importance rating of 78.5%. There were significant differences within the various demographic breakdowns. People having lived in Loveland for 16 to 20 years rated it more important (91.7%) than did those only having lived here 0 to 5 years (69.4%). Females rated it more important than males (84.4% versus 72.1%). Within the age group breakdowns, the 60 and older age groups gave it slightly higher importance ratings than below 60 years of age (80.6% versus 75.7%). The age group with the lowest importance rating was the 20 to 29 year old group at 68.8%. Illegal Drug Use Enforcement N = 366 Illegal drug use was the third highest rated program for overall importance at 89.1%. Within the age group break down, the 20 to 29 year old group had the lowest importance rating at 81.3% followed by the 50 to 59 age group at 84.6%. The two age groups with the highest rating for this program were the 30 to 39 at 96.6% and the 90 to 99 at 100%. Amongst the other demographic breakdowns, there were no significant disparities in the importance ratings. School Resource Officers N = 362 Overall, 82.3% of respondents rated the SRO program as important. Amongst the Districts, all but District 2 rated the importance at 81% or higher, while District 2 came in at 76.7%. The age group with the lowest importance rating was the 50 to 59 group at 70.8%, while all other groups were higher than 79%. Females came in at a 87% importance rating while 77% of males rated it as important. Crime Prevention N = 364 Crime prevention was the 4 th highest rated program in importance overall at 87.4%. Districts 2 and 3 had lower ratings than the others at 82.8% and 83.7% respectively, while the three other districts were all above 90% in their importance ratings. Respondents who had lived here 11 to 15 years were the only group in the years lived in Loveland category who rated the importance below 80%, all the other groups in this category were above 86%. Females were higher than males in their importance rating of this program, 88.8% to 82.6% respectively. Santa Cops N = 354 Santa Cops was amongst the lowest rated programs in terms of importance by respondents with a 57.1% rating. 63.5% of female respondents rated the program as important as compared to only 50.3% of male respondents. District 3 had the lowest importance rating compared to the other districts at 50.5%, while District 2 and District 5 came in the highest at 64.9% and 64.3% respectively. Respondents who had lived in Loveland for 11 or more years rated it more important than those who had lived here 10 years or less (61% versus 46.8%). 30
32 Fishing Derby N = 352 The fishing derby was the lowest rated program of importance with only 51.7% of respondents rating it as important. Amongst the age groupings, only the 80 to 89 and 90 to 99 years of age gave it an importance rating of 60% or higher. 56.2% of female respondents rated it as important compared to 47.1% of male respondents. District 2 was the highest of the districts with 62.5% of respondents indicating it was important, while the rest of the districts all came in below 56%. Citizen s Police Academy N = 353 Overall, 58.9% of respondents rated the Citizen Police Academy as important. 65.5% of female respondents rated it as important and 52% of male respondents rated it as important. Only 50% of respondents who have lived in Loveland 11 to 15 years rated it as important. All the other length of residency group respondents came in at 58% or higher when rating the program as important. Respondents in the 70 to 79 age bracket and 80 to 89 age bracket rated the importance at 63.5% and 75.9% respectively. The remaining age brackets all rated it at 60% or lower. Department Accreditation N = 351 Overall, 83.2% of respondents rated the Department Accreditation program as important. There was a similar high level of support amongst all the demographic groups. Loveland Community Night N = % of overall respondents rated the Loveland Community night as an important program. Respondents from all 5 police districts rated the importance at 64% or higher, with District 2 the highest at 73.2%. Respondents in the 30 to 39 year old group had the lowest importance rating amongst the age groups at 59.3%. 74.7% of female respondents rated the program as important which was far higher than male respondents at 59.3%. Sexual Harassment/Rape Prevention N = 364 Overall, this program was the second highest program in terms of respondents rating of importance at 93.4%. Across all demographic groups, this program received high importance ratings. Future budget constraints might require evaluation and termination of some community programs sponsored by the Loveland Police Department. Citizen responses obtained from this survey might provide guidance regarding the importance and priority of such programs. Question 17 - Sources of information N = 370 The primary source of information about the Loveland Police Department was the Loveland Reporter-Herald newspaper for 63.5% of respondents. This was followed by personal experience at 13.5% and word of mouth at 13.2%. Television was the primary source for 6.2% of respondents and the city website came in at 3.5%. Question 18 - Basis of opinions N = % of respondents indicated that they base their opinions on personal experience, 26.5% on observations, 14.7% on newspaper articles, 4.3% on word of mouth, 1.1% on other information, and 0.8% on television. 31
33 Question 19 - Most important issues 278 respondents responded to the open-ended survey question of What is the most important issue the Loveland Police Department should be addressing? Their unfiltered comments are listed separately at the end of the report. The top 3 specific issues mentioned were: 1) Gangs/gang issues 21.6% (60 of 278 respondents mentioned gangs/gang issues) 2) Drugs/drug activity/issues 20.1% (56 of 278 respondents mentioned drugs/drug issues) 3) Traffic/speeding issues 17.6% (49 of 278 respondents mentioned traffic/speeding issues) 32.7% of respondents (91 of 278) mentioned general crime prevention/public safety as the most important issue the Loveland Police Department should be addressing. Trend Analysis Besides the comparisons between 2011 and 2014 survey results that have been mentioned elsewhere, additional important comparisons between the 2014 survey and the 2011 survey are listed below. Service Satisfied respondents (%) General police service in your neighborhood (Question 12) Quick response to emergency situation (Question 4) Crime controls in your neighborhood (Question 4) Providing fair and equal treatment to all (Question 4) Understanding of community concerns (Question 4) Handling citizen's complaints (Question 4) Program Respondents reporting "Important" (%) Gang prevention Sexual harassment/rape prevention Illegal drug-use enforcement Crime prevention Neighborhood Watch Accreditation School resource officers Underage liquor enforcement Community Night Out Citizens Police Academy
34 Comments from Survey Question 9: Comments from What do you feel the Loveland Police Department is doing especially well? There were 218 responses to this question. They are listed alphabetically below. Active presence in neighborhoods All officers I have spoke to have been kind, caring and professional. Almost everything. As far as I know they do all well. attention to seniors Available and responsive while not having an overwhelming presence. average Being fair and informative. Being human - important! Being present in the community. Being professional and keeping Loveland safe. Being seen often. Being visible / supporting and patrolling. Calling on the phone to solicit money. Can ask them for advice or what resources you can use or handle a situation. Case # which I got dismissed w/ Attorney Communicate with public. Communicating with the public in non-official matters. Communicating. Communication with the public. Community minded - organized - very competent. Community relations. Community relationships Community service. Compassionate attitude in health crisis. Contributing to a safe community. Controlling gang activity. Controlling gang issues Crime control. Crime prevention Crime prevention, gang activity. Crime went down. Response time. Cruising around making things safe. customer service Discretion. Professionalism. Don't know Don't know. Don't know. Not enough contact with the police. I don't see them in our neighborhood enough to answer. Doug Savage was very courteous and professional. Downtown presence / hiring diverse officers. Drug control. Drug control. Emergency response: traffic accidents. Emergency. Enforcing the law. everything Everything I can think of. Everything. excellent 33
35 Excellent law enforcement. explaining my ticket and being generaly very friendly Fast and effective. Fishing derby. Follow up. From what I've seen - all is ok. Gang control. Good constant patrol. Good interaction skills and communication. Good presence in the community Good response time. Professional and courteous. Good response, polite, informative. Good sense of their presence in the community. Great Handle the one situation well. Teenage problem run-aways. Handled last years' flood very well. handling difficulties with people w/autism/dd Harassing people for small stuff vs. taking care of the big stuff. Hard to say. Harsh - bully - more from women - look at blonde. High profile. I am very pleased with it all. I don't know yet. I don't see a weak link. I feel that they are very aware of what's going on. I have great confidence in their service. I have no complaints. I have not witnessed much crime here since moving here from a city. I really don't know as I am home much of the time. I see a high police presence. I see them at accidents. I see them check speed. I think the police are doing in our area well. I walk to downtown and always feel safe. I would not know. Improving community safety. In my contact with the officer, he was super respectful and professional. It seems like you guys crack down on drunk driving. Just happy to have good PD. Keep eye on our neighborhood. Keeping an eye on the downtown Loveland area Keeping crime and homeless people to a minimum. Keeping crime out of my neighborhood. Keeping crime rate low. Keeping in touch with citizens. Keeping Loveland safe. Keeping Loveland safe. Keeping Loveland safe. Keeping low profile with ordinary people Keeping our neighborhood safe. Keeping residents safe and control crime Keeping the peace. Knowing our community. Like that they visit preschools and have the take back medication days for safe disposal. Looking and acting like Police officers (unlike Fort Collins) LPD is one of the best in this area - always seem to be on top of their game. Make a strong presence in the city. Making police presence very apparent - probably discourages crime. 34
36 Minimize unmarked cars show yourselves Most everything except some traffic issues. Most of the officers try to accommodate Most things Mostly everything. My husband was stopped for a brake light. He says the officer was very helpful and respectful. My neighborhood is safe. My neighborhood is very quiet. I love it! N/A Neighborhood safety - speeders. No comment. No complaint. No problem in any way. Nothing. Only contact was about 2 cars for sale parked on street. Overall safety in our town. Overall. Participation in community activities Patrolling Patrolling - I do see the cars going through the neighborhood and that makes me feel safe. Patrolling kids at Thompson Valley High School. Patrolling neighborhood. Patrolling the streets. Patrolling, keeping crime low. I feel safe in my neighborhood. Patrolling. Patrolling. People skills. Polite, efficient. Positive presence in the community. PR Presence. Prevention of problems. Professional, yet friendly (keep up the good work). Professional. Professionalism when you talk to them and keeping information private. Professionalism, visibility. Protecting all residents. Protecting citizens. Protecting us and willing to answer questions. Public relations. Pulling over Buicks. Especially mine. :-) Quick reponse Quick response time. Quick response time. Quick response to nuisance calls and friendly! Rapid response Re: animal control (dogs) Remaining objective. Responding to accidents and emergencies. Responding to drunk driver. Responding when called Response time is excellent. Response. Responsiveness and politeness. S.H.A.R.P. Safety to citizens. Seems well staffed, but new officers need better training with guidelines/policies. 35
Vancouver Police Community Policing Assessment Report Residential Survey Results NRG Research Group
 Vancouver Police Community Policing Assessment Report Residential Survey Results 2017 NRG Research Group www.nrgresearchgroup.com April 2, 2018 1 Page 2 TABLE OF CONTENTS A. EXECUTIVE SUMMARY 3 B. SURVEY
Vancouver Police Community Policing Assessment Report
 Vancouver Police Community Policing Assessment Report Residential Survey Results FINAL DRAFT NRG Research Group Adam Di Paula & Richard Elias www.nrgresearchgroup.com 3/17/2009 VPD Community Policing Report
Public Safety Survey
 Public Safety Survey Penticton Area Final Report Rupi Kandola Niki Huitson Irwin Cohen Darryl Plecas School of Criminology and Criminal Justice University College of the Fraser Valley February 2007-1 -
Public Safety Survey
 Public Safety Survey Terrace Area Final Report Rocky Sharma Niki Huitson Irwin Cohen Darryl Plecas School of Criminology and Criminal Justice University College of the Fraser Valley February 2007-1 - Terrace
Edmonton Police Service 2011 Citizen Survey
 Edmonton Police Service 2011 Citizen Survey May 2012 2012 Edmonton Police Service First Published 2012 Edmonton Police Service 9620 103A Avenue Edmonton, Alberta T5H 0H7 CANADA Phone (780) 421-3333 Fax
General Survey 2015 Winnipeg Police Service A Culture of Safety for All
 General Survey 2015 Winnipeg Police Service A Culture of Safety for All THE WINNIPEG POLICE SERVICE GENERAL SURVEY, 2015 The 2015 Winnipeg Police Service public opinion survey was conducted between September
2017 Citizen Survey of Police Surveys Citizen Survey Introduction 1
 Citizen Survey Introduction 1 Table of Contents 2017 Citizen Survey Introduction... 3 Respondents Profile... 4 Key Questions for 2017... 6 Key Questions Five Year Comparison... 10 Citizens Contact with
2017 Citizen Satisfaction Survey City of Shawnee, Kansas
 2017 Citizen Satisfaction Survey City of Shawnee, Kansas Presented by March 2017 ETC Institute A National Leader in Market Research for Local Governmental Organizations helping city and county governments
The National Citizen Survey
 CITY OF SARASOTA, FLORIDA 2008 3005 30th Street 777 North Capitol Street NE, Suite 500 Boulder, CO 80301 Washington, DC 20002 ww.n-r-c.com 303-444-7863 www.icma.org 202-289-ICMA P U B L I C S A F E T Y
Regional Municipality of Wood Buffalo 2014 RCMP and Bylaw Services Citizen Telephone Survey Final Report
 Regional Municipality of Wood Buffalo 2014 RCMP and Bylaw Services Citizen Telephone Survey Final Report December 19, 2014 TABLE OF CONTENTS 1.0 SUMMARY OF FINDINGS 3 2.0 PROJECT BACKGROUND 8 3.0 METHODOLOGY
City of Janesville Police Department 2015 Community Survey
 City of Janesville Police Department 2015 Community Survey Presentation and Data Analysis Conducted by: UW-Whitewater Center for Political Science & Public Policy Research Susan M. Johnson, Ph.D. and Jolly
PUBLIC SURVEY 2015 Report Presentation
 PUBLIC SURVEY 2015 Report Presentation Public Survey on the Ottawa Police Service Presentation, September 28, 2015 Objectives and Methodology Objectives and Methodology Context and Objectives The Ottawa
City of Bellingham Residential Survey 2013
 APPENDICES City of Bellingham Residential Survey 2013 January 2014 Pamela Jull, PhD Rachel Williams, MA Joyce Prigot, PhD Carol Lavoie P.O. Box 1193 1116 Key Street Suite 203 Bellingham, Washington 98227
EXECUTIVE SUMMARY: CITY OF BELLINGHAM RESIDENTIAL SURVEY REPORT
 EXECUTIVE SUMMARY: CITY OF BELLINGHAM RESIDENTIAL SURVEY REPORT CENTER FOR ECONOMIC AND BUSINESS RESEARCH February 21, 2017 Prepared for The City of Bellingham Author(s) Isabel Vassiliadis Hart Hodges,
Orange County Registrar of Voters. June 2016 Presidential Primary Survey Report
 2016 Orange County Registrar of Voters June 2016 Presidential Primary Survey Report Table of Contents Executive Summary 3 Voter Experience Survey 7 Poll Worker Survey 18 Training Survey 29 Delivery Survey
ANNUAL SURVEY REPORT: REGIONAL OVERVIEW
 ANNUAL SURVEY REPORT: REGIONAL OVERVIEW 2nd Wave (Spring 2017) OPEN Neighbourhood Communicating for a stronger partnership: connecting with citizens across the Eastern Neighbourhood June 2017 TABLE OF
ANNUAL SURVEY REPORT: ARMENIA
 ANNUAL SURVEY REPORT: ARMENIA 2 nd Wave (Spring 2017) OPEN Neighbourhood Communicating for a stronger partnership: connecting with citizens across the Eastern Neighbourhood June 2017 ANNUAL SURVEY REPORT,
PUBLIC CONTACT WITH AND PERCEPTIONS REGARDING POLICE IN PORTLAND, OREGON 2013
 PUBLIC CONTACT WITH AND PERCEPTIONS REGARDING POLICE IN PORTLAND, OREGON 2013 Brian Renauer, Ph.D. Kimberly Kahn, Ph.D. Kris Henning, Ph.D. Portland Police Bureau Liaison Greg Stewart, MS, Sgt. Criminal
ANNUAL SURVEY REPORT: BELARUS
 ANNUAL SURVEY REPORT: BELARUS 2 nd Wave (Spring 2017) OPEN Neighbourhood Communicating for a stronger partnership: connecting with citizens across the Eastern Neighbourhood June 2017 1/44 TABLE OF CONTENTS
WEST VANCOUVER PUBLIC SAFETY SURVEY RESEARCH RESULTS
 WEST VANCOUVER PUBLIC SAFETY SURVEY RESEARCH RESULTS Dr. Irwin M. Cohen & Dr. Amanda V. McCormick December 2016 Introduction This report describes the results of a public safety and police satisfaction
ANNUAL SURVEY REPORT: AZERBAIJAN
 ANNUAL SURVEY REPORT: AZERBAIJAN 2 nd Wave (Spring 2017) OPEN Neighbourhood Communicating for a stronger partnership: connecting with citizens across the Eastern Neighbourhood June 2017 TABLE OF CONTENTS
BLUE STAR HIGHWAY COMMUNITY OPINION SURVEY REPORT
 BLUE STAR HIGHWAY COMMUNITY OPINION SURVEY REPORT MAY 2011 BLUE STAR HIGHWAY: DOUGLAS COMMUNITY OPINION SURVEY On March 1st, 2011 the Douglas Advisory Committee and the City of Douglas issued opinion surveys
ANNUAL SURVEY REPORT: GEORGIA
 ANNUAL SURVEY REPORT: GEORGIA 2 nd Wave (Spring 2017) OPEN Neighbourhood Communicating for a stronger partnership: connecting with citizens across the Eastern Neighbourhood June 2017 TABLE OF CONTENTS
R Eagleton Institute of Politics Center for Public Interest Polling
 2002 SURVEY OF NEW BRUNSWICK RESIDENTS Conducted for: Conducted by: R Eagleton Institute of Politics Center for Public Interest Polling Data Collection: May 2002 02-02 EXECUTIVE SUMMARY TABLE OF CONTENTS
LOUISVILLE METRO POLICE DEPARTMENT
 LOUISVILLE METRO POLICE DEPARTMENT CITIZENS ATTITUDE SURVEY Deborah G. Keeling, Ph.D. Kristin M. Swartz, Ph.D. Department of Justice Administration University of Louisville April 2014 INTRODUCTION It is
Telephone Survey. Contents *
 Telephone Survey Contents * Tables... 2 Figures... 2 Introduction... 4 Survey Questionnaire... 4 Sampling Methods... 5 Study Population... 5 Sample Size... 6 Survey Procedures... 6 Data Analysis Method...
Motivations and Barriers: Exploring Voting Behaviour in British Columbia
 Motivations and Barriers: Exploring Voting Behaviour in British Columbia January 2010 BC STATS Page i Revised April 21st, 2010 Executive Summary Building on the Post-Election Voter/Non-Voter Satisfaction
Community Perception Survey
 Building Relationships of Trust Community Perception Survey Thank you for participating in this short survey. Your contribution will help us improve our service to the community and make us more effective
2017 State of the State Courts Survey Analysis
 To: National Center for State Courts From: GBA Strategies Date: November 15, 2017 2017 State of the State Courts Survey Analysis The latest edition of the State of the State Courts research, an annual
2001 Senate Staff Employment Study
 2001 Senate Staff Employment Study Written by Congressional Management Foundation Table of Contents INDIVIDUAL POSITION PROFILES AND ANALYSES Methodology...7 Summary Tables...8 Washington Positions Assistant
The 2016 Minnesota Crime Victimization Survey
 The 2016 Minnesota Crime Victimization Survey Executive Summary and Overview: August 2017 Funded by the Bureau of Justice Statistics Grant Number 2015-BJ-CX-K020 The opinions, findings, and conclusions
UTS:IPPG Project Team. Project Director: Associate Professor Roberta Ryan, Director IPPG. Project Manager: Catherine Hastings, Research Officer
 IPPG Project Team Project Director: Associate Professor Roberta Ryan, Director IPPG Project Manager: Catherine Hastings, Research Officer Research Assistance: Theresa Alvarez, Research Assistant Acknowledgements
PERSPECTIVES ON CRIME AND POLICING IN KENTVILLE, NOVA SCOTIA, 1997: A SURVEY OF RESIDENTS AND BUSINESS OPERATORS
 PERSPECTIVES ON CRIME AND POLICING IN KENTVILLE, NOVA SCOTIA, 1997: A SURVEY OF RESIDENTS AND BUSINESS OPERATORS Anthony Thomson Acadia University and Mark Mander Kentville Police Service MAY, 1997 I.
Thornbury Township Police Services Survey: Initial Data Analyses and Key Findings
 Thornbury Township Police Services Survey: Initial Data Analyses and Key Findings 1160 McDermott Drive, Suite 101, West Chester, PA 19383 Phone: 610-425-7448, E-Mail: lbernotsky@wcupa.edu April 2012 2
Community Survey. Report of Survey Results. April City Manager s Office
 Community Survey Report of Survey Results April 2016 City Manager s Office TABLE OF CONTENTS Introduction... 1 Who We Reached... 1 General Sense of City... 5 Conditions and Appearance... 7 Crime and Safety...
EMBARGOED NOT FOR RELEASE UNTIL: SUNDAY, OCTOBER 17, 1993 FLORIO MAINTAINS LEAD OVER WHITMAN; UNFAVORABLE IMPRESSIONS OF BOTH CANDIDATES INCREASE
 EMBARGOED NOT FOR RELEASE UNTIL: SUNDAY, OCTOBER 17, 1993 RELEASE INFORMATION A story based on the survey findings presented in this release and background memo will appear in Sunday's Star- Ledger. We
Rural Pulse 2016 RURAL PULSE RESEARCH. Rural/Urban Findings June 2016
 Rural Pulse 2016 RURAL PULSE RESEARCH Rural/Urban Findings June 2016 Contents Executive Summary Project Goals and Objectives 9 Methodology 10 Demographics 12 Research Findings 17 Appendix Prepared by Russell
2016 Appointed Boards and Commissions Diversity Survey Report
 2016 Appointed Boards and Commissions Diversity Survey Report November 28, 2016 Neighborhood and Community Relations Department 612-673-3737 www.minneapolismn.gov/ncr Table of Contents Introduction...
Research methods and findings of a twoyear study on the sex work industry in Cape Town
 Research methods and findings of a twoyear study on the sex work industry in Cape Town Chandré Gould, Crime and Justice Programme, Institute for Security Studies Research Objectives To develop a reproducible
2012 Residential Survey Results
 2012 Residential Survey Results Presented by: 1020 E. 1 st Street Papillion, NE 68046 January 25, 2013 1 City of Sterling Heights 2012 Residential Survey Results Background Infogroup was selected by the
CITY OF LOS ANGELES CHIEF OF POLICE SURVEY 2018 SELECTION CRITERIA SURVEY RESULTS
 CITY OF LOS ANGELES CHIEF OF POLICE SURVEY 2018 SELECTION CRITERIA SURVEY RESULTS The City of Los Angeles Personnel Department working with the Los Angeles Police Commission recently created and implemented
MALAYSIAN PUBLIC PERSPECTIVES ON THE ROLE OF THE MEDIA IN REPORTING CORRUPTION 2009
 MALAYSIAN PUBLIC PERSPECTIVES ON THE ROLE OF THE MEDIA IN REPORTING CORRUPTION 2009 EXECUTIVE SUMMARY The incidence of corruption and the extent to which it afflicts society is an indicator of governance
Survey Report Victoria Advocate Journalism Credibility Survey The Victoria Advocate Associated Press Managing Editors
 Introduction Survey Report 2009 Victoria Advocate Journalism Credibility Survey The Victoria Advocate Associated Press Managing Editors The Donald W. Reynolds Journalism Institute Center for Advanced Social
Public Attitudes Survey Bulletin
 An Garda Síochána Public Attitudes Survey Bulletin 218 Research conducted by This bulletin presents high level findings from the second quarter of the Public Attitudes Survey conducted between April and
Introduction. Changing Attitudes
 INTRODUCTION Introduction Surveys and polls have become fixtures of American life, each day bringing new findings and making headlines. Some of the results are enlightening, while others serve only to
Public Attitudes Survey Bulletin
 An Garda Síochána Public Attitudes Survey Bulletin 218 Research conducted by This bulletin presents high level findings from the third quarter of the Public Attitudes Survey conducted between July and
Grand Junction Police Department 2015 Annual Report
 Grand Junction Police Department 2015 Annual Report Vision: Excellence in Policing Mission: To enforce the law, safeguard our community, and enhance its quality of life through the prevention, investigation,
Reconviction patterns of offenders managed in the community: A 60-months follow-up analysis
 Reconviction patterns of offenders managed in the community: A 60-months follow-up analysis Arul Nadesu Principal Strategic Adviser Policy, Strategy and Research Department of Corrections 2009 D09-85288
2001 Visitor Survey. December 2001 (November 30 December 13, 2001) Cincinnatus Minneapolis, Minnesota
 Cincinnatus Minneapolis, Minnesota") December 2001 (November 30 December 13, 2001) Cincinnatus Minneapolis, Minnesota 612-331-9007 MINNEAPOLIS INSTITUTE OF ARTS Table of Contents MAJOR FINDINGS... 1 HOW THIS RESEARCH WAS CONDUCTED... 8 VISITOR
December 2001 (November 30 December 13, 2001) Cincinnatus Minneapolis, Minnesota 612-331-9007 MINNEAPOLIS INSTITUTE OF ARTS Table of Contents MAJOR FINDINGS... 1 HOW THIS RESEARCH WAS CONDUCTED... 8 VISITOR
How the Public, News Sources, and Journalists Think about News in Three Communities
 How the Public, News Sources, and Journalists Think about News in Three Communities This research project was led by the News Co/Lab at Arizona State University in collaboration with the Center for Media
Equality Awareness in Northern Ireland: Employers and Service Providers
 Equality Awareness in Northern Ireland: Employers and Service Providers Equality Awareness Survey Employers and Service Providers 2016 Contents 1 INTRODUCTION... 1 ROLE OF THE EQUALITY COMMISSION... 1
The City of Cape Coral, Florida
 PO Box 150027 Cape Coral, FL 33915 T: (239) 574-0447 F: (239) 574-0452 www.capegov.org The City of Cape Coral, Florida 2007 The National Citizen Survey National Research Center, Inc. 3005 30 th St. Boulder,
Colorado Springs Police Department
 Colorado Springs Police Department Survey of Citizens Briefed 8/22/2018 Faith Based Group Briefed 9/26/2018 Southern Colorado Ministerial Union Briefed 10/17/2018 Citizen Leaders Advisory Committee Q3
NOVEMBER visioning survey results
 NOVEMBER 2016 visioning survey results 2 Denveright SECTION 1 SURVEY INTRODUCTION OVERVIEW Our community is undertaking an effort that builds upon our successes and proud traditions to design the future
Streetcar Community Attitudes Survey - Community Development and Transportation Principles
 PREPARED FOR: CITY OF LAKE OSWEGO Streetcar Community Attitudes Survey - Community Development and Transportation Principles October 2011 PREPARED BY: DHM RESEARCH (503) 220-0575 203 SW Pine St., Portland,
Percentages of Support for Hillary Clinton by Party ID
 Executive Summary The Meredith College Poll asked questions about North Carolinians views of as political leaders and whether they would vote for Hillary Clinton if she ran for president. The questions
Neighborhood Problems and Quality of Life
 Survey Research Unit School of Public Affairs Baruch College / CUNY 1 Bernard Baruch Way New York, NY 10010 Neighborhood Problems and Quality of Life A survey conducted in collaboration with November 2004
This report is formatted for double-sided printing.
 Public Opinion Survey on the November 9, 2009 By-elections FINAL REPORT Prepared for Elections Canada February 2010 Phoenix SPI is a Gold Seal Certified Corporate Member of the MRIA 1678 Bank Street, Suite
Orange County Registrar of Voters. Survey Results 72nd Assembly District Special Election
 Orange County Registrar of Voters Survey Results 72nd Assembly District Special Election Executive Summary Executive Summary The Orange County Registrar of Voters recently conducted the 72nd Assembly
Erie County and the Trump Administration
 Erie County and the Trump Administration A Survey of 409 Registered Voters in Erie County, Pennsylvania Prepared by: The Mercyhurst Center for Applied Politics at Mercyhurst University Joseph M. Morris,
REPORT TO THE STATE OF MARYLAND ON LAW ELIGIBLE TRAFFIC STOPS
 REPORT TO THE STATE OF MARYLAND ON LAW ELIGIBLE TRAFFIC STOPS MARYLAND JUSTICE ANALYSIS CENTER SEPTEMBER 2005 Law Enforcement Traffic Stops in Maryland: A Report on the Third Year of Operation Under TR
Public Views of Policing in England and Wales 2016/17
 July 2017 Public Views of Policing in England and Wales 2016/17 Research report for Her Majesty s Inspectorate of Constabulary (HMIC) FINAL VERSION Ipsos MORI Public Views of Policing in England and Wales
Voting and Non-Voting in Christchurch City
 Voting and Non-Voting in Christchurch City Territorial local Authority and District Health Board Elections October 2001 Voting and Non-Voting in Christchurch City An analysis of a survey on voter attitudes
Race for Governor of Pennsylvania and the Use of Force Against ISIS
 Race for Governor of Pennsylvania and the Use of Force Against ISIS A Survey of 479 Registered Voters in Pennsylvania Prepared by: The Mercyhurst Center for Applied Politics at Mercyhurst University Joseph
Findings from the 2017 survey of criminal legal aid solicitors
 Findings from the 207 survey of criminal legal aid solicitors The Scottish Legal Aid Board (SLAB) undertook an online survey of solicitors delivering criminal legal assistance. This short report presents
Euro Introduction in Cyprus and Malta Ex-Post Citizen Survey
 Gallup Flash Eurobarometer N o 189a EU communication and the citizens Flash Eurobarometer European Commission Euro Introduction in Cyprus and Malta Ex-Post Citizen Survey Summary Fieldwork: February 2008
Kansas Speaks Fall 2018 Statewide Public Opinion Survey
 Kansas Speaks Fall 2018 Statewide Public Opinion Survey Prepared For The Citizens of Kansas By The Docking Institute of Public Affairs Fort Hays State University Copyright October 2018 All Rights Reserved
RAY C. BLISS INSTITUTE OF APPLIED POLITICS & REGULA CENTER FOR PUBLIC SERVICE. Presentation on Civility Research
 RAY C. BLISS INSTITUTE OF APPLIED POLITICS & REGULA CENTER FOR PUBLIC SERVICE Presentation on Civility Research BUCKEYE TELEPHONE SURVEY The Akron Buckeye Poll was conducted in August of 2011 by The Center
MONTEREY - SALINAS TRANSIT
 MONTEREY - SALINAS TRANSIT MARINA AREA SERVICE STUDY FINAL REPORT SEPTEMBER 2009 1. EXECUTIVE SUMMARY 01 2. CUSTOMER SURVEY ANALYSIS 05 3. COMMUNITY SURVEY ANALYSIS 35 TABLE OF CONTENTS 4. CSUMB SURVEY
Equality Awareness in Northern Ireland: General Public
 Equality Awareness in Northern Ireland: General Public Equality Awareness Survey General Public 2016 Table of Contents 1. Introduction... 1 2. Social Attitudes and Perceptions of Equality... 11 3. Perception
Boise Police Department
 Boise Police Department 2007 Neighborhood Survey Report - 1 - TABLE OF CONTENTS INTRODUCTION 3 BACKGROUND AND EVALUATION PROCESS...3 BOISE POLICE DEPARTMENT OVERALL SURVEY RESULTS.4 BENCH AREA NEIGHBORHOOD
COLORADO LOTTERY 2014 IMAGE STUDY
 COLORADO LOTTERY 2014 IMAGE STUDY AUGUST 2014 Prepared By: 3220 S. Detroit Street Denver, Colorado 80210 303-296-8000 howellreserach@aol.com CONTENTS SUMMARY... 1 I. INTRODUCTION... 7 Research Objectives...
OAKLAND POLICE DEPARTMENT Office of Chief of Police
 OAKLAND POLICE DEPARTMENT Office of Chief of Police Stop Data Annual Report January 1, 2015 to December 31, 2015 C I T Y O F O A K L A N D Memorandum TO: Office of Chief of Police ATTN: Chief Sean Whent
Understanding Transit s Impact on Public Safety
 Understanding Transit s Impact on Public Safety June 2009 401 B Street, Suite 800 San Diego, CA 92101-4231 Phone 619.699.1900 Fax 619.699.1905 Online www.sandag.org UNDERSTANDING TRANSIT S IMPACT ON PUBLIC
Vancouver Police Community Policing Assessment Report
 Vancouver Police Community Policing Assessment Report Business Survey Results for 2009 NRG Research Group Adam Di Paula & Richard Elias www.nrgresearchgroup.com 1/5/2010 VPD Community Policing Report-Survey
MEREDITH COLLEGE POLL September 18-22, 2016
 Women in politics and law enforcement With approximately three weeks until Election Day and the possibility that Democrat Hillary Clinton will be elected as the first woman president in our nation s history,
2016 Nova Scotia Culture Index
 2016 Nova Scotia Culture Index Final Report Prepared for: Communications Nova Scotia and Department of Communities, Culture and Heritage March 2016 www.cra.ca 1-888-414-1336 Table of Contents Page Introduction...
IFES PRE-ELECTION SURVEY IN NIGERIA 2014
 IFES PRE-ELECTION SURVEY IN NIGERIA 2014 January 2015 This publication was produced by IFES for the U.S. Agency for International Development concerning Cooperative Agreement Number AID-620-A-14-00002.
How s Life in Mexico?
 How s Life in Mexico? November 2017 Relative to other OECD countries, Mexico has a mixed performance across the different well-being dimensions. At 61% in 2016, Mexico s employment rate was below the OECD
Wisconsin Economic Scorecard
 RESEARCH PAPER> May 2012 Wisconsin Economic Scorecard Analysis: Determinants of Individual Opinion about the State Economy Joseph Cera Researcher Survey Center Manager The Wisconsin Economic Scorecard
TOWNSHIP OF LANGLEY, B.C Township of Langley Immigrant Demographics I
 Immigrant demographics TOWNSHIP OF LANGLEY, B.C. - 2018 Township of Langley Immigrant Demographics I Page 1 TOWNSHIP OF LANGLEY IMMIGRANT DEMOGRAPHICS Your quick and easy look at facts and figures around
Police Firearms Survey
 Police Firearms Survey Final Report Prepared for: Scottish Police Authority Prepared by: TNS JN:127475 Police Firearms Survey TNS 09.12.2014 JN127475 Contents 1. Background and objectives 3 2. Methodology
Japan s average level of current well-being: Comparative strengths and weaknesses
 How s Life in Japan? November 2017 Relative to other OECD countries, Japan s average performance across the different well-being dimensions is mixed. At 74%, the employment rate is well above the OECD
Immigrant DELTA, B.C Delta Immigrant Demographics I
 Immigrant demographics DELTA, B.C. - 2018 Immigrant Demographics I Page 1 DELTA IMMIGRANT DEMOGRAPHICS Your quick and easy look at facts and figures around immigration. Newcomers are an important and growing
a comprehensive and balanced approach to maintaining high levels of safety and security throughout our community. Here is what I believe.
 Historical Policing Philosophy - Updated 2006 1 2 a comprehensive and balanced approach to maintaining high levels of safety and security throughout our community. Here is what I believe. The community
Flash Eurobarometer 337 TNS political &social. This document of the authors.
 Flash Eurobarometer Croatia and the European Union REPORT Fieldwork: November 2011 Publication: February 2012 Flash Eurobarometer TNS political &social This survey has been requested by the Directorate-General
Vermonters Awareness of and Attitudes Toward Sprawl Development in 2002
 Vermonters Awareness of and Attitudes Toward Sprawl Development in 2002 Written by Thomas P. DeSisto, Data Research Specialist Introduction In recent years sprawl has been viewed by a number of Vermont
How s Life in Australia?
 How s Life in Australia? November 2017 In general, Australia performs well across the different well-being dimensions relative to other OECD countries. Air quality is among the best in the OECD, and average
NATIONAL: FAKE NEWS THREAT TO MEDIA; EDITORIAL DECISIONS, OUTSIDE ACTORS AT FAULT
 Please attribute this information to: Monmouth University Poll West Long Branch, NJ 07764 www.monmouth.edu/polling Follow on Twitter: @MonmouthPoll Released: Monday, April 2, 2018 Contact: PATRICK MURRAY
Iceland and the European Union Wave 2. Analytical report
 Flash Eurobarometer European Commission Iceland and the European Union Wave 2 Analytical report Fieldwork: August 2011 Report: October 2011 Flash Eurobarometer 327 The Gallup Organization This survey was
How s Life in the Slovak Republic?
 How s Life in the Slovak Republic? November 2017 Relative to other OECD countries, the average performance of the Slovak Republic across the different well-being dimensions is very mixed. Material conditions,
Survey of Pennsylvanians on the Issue of Health Care Reform KEY FINDINGS REPORT
 The Morning Call/ Muhlenberg College Institute of Public Opinion Survey of Pennsylvanians on the Issue of Health Care Reform KEY FINDINGS REPORT Release Date November 17, 2009 KEY FINDINGS: 1. As the national
Communitypolicingfirstnationsa pproachestopublicsafetypractici ngtrustandcommunitypridemoha
 Communitypolicingfirstnationsa pproachestopublicsafetypractici ngtrustandcommunitypridemoha Public Safety Consultation Project: Community Perspectives on Policing and Crime within the Mohawk wkwayoflifefghjklzxcvbnmqwpri
Evidence-Based Policy Planning for the Leon County Detention Center: Population Trends and Forecasts
 Evidence-Based Policy Planning for the Leon County Detention Center: Population Trends and Forecasts Prepared for the Leon County Sheriff s Office January 2018 Authors J.W. Andrew Ranson William D. Bales
THE LOUISIANA SURVEY 2018
 THE LOUISIANA SURVEY 2018 Criminal justice reforms and Medicaid expansion remain popular with Louisiana public Popular support for work requirements and copayments for Medicaid The fifth in a series of
Quarterly Crime Statistics Q (01-January-2014 to 31-March-2014)
") Quarterly Crime Statistics 214 (1-January-214 to 31-March-214) Authorising Officer: Commissioner Of The Bermuda Police Service Author: Analysis Unit Date: 7-MAY-214 File Location: G:\Intelligence Briefings\INTELLIGENCE
Quarterly Crime Statistics 214 (1-January-214 to 31-March-214) Authorising Officer: Commissioner Of The Bermuda Police Service Author: Analysis Unit Date: 7-MAY-214 File Location: G:\Intelligence Briefings\INTELLIGENCE
City of Carrollton. Final Report. February 6, Prepared by The Julian Group
 City of Carrollton Citizen Survey on Illegal l Immigration Final Report February 6, 2009 Prepared by The Julian Group Table of Contents Background and Objectives 3 Methodology 5 Conclusions and Recommendations
Elections Alberta Survey of Voters and Non-Voters
 Elections Alberta Survey of Voters and Non-Voters RESEARCH REPORT July 17, 2008 460, 10055 106 St, Edmonton, Alberta T5J 2Y2 Tel: 780.423.0708 Fax: 780.425.0400 www.legermarketing.com 1 SUMMARY AND CONCLUSIONS
Attitudes towards Refugees and Asylum Seekers
 Attitudes towards Refugees and Asylum Seekers A Survey of Public Opinion Research Study conducted for Refugee Week May 2002 Contents Introduction 1 Summary of Findings 3 Reasons for Seeking Asylum 3 If
How s Life in Estonia?
 How s Life in Estonia? November 2017 Relative to other OECD countries, Estonia s average performance across the different well-being dimensions is mixed. While it falls in the bottom tier of OECD countries