2016 Nova Scotia Culture Index
|
|
|
- Lynette Emmeline Glenn
- 6 years ago
- Views:
Transcription


1 2016 Nova Scotia Culture Index Final Report Prepared for: Communications Nova Scotia and Department of Communities, Culture and Heritage March
2 Table of Contents Page Introduction... 1 Executive Summary... 2 Detailed Analysis... 3 Public Good... 4 Perceptions of Culture... 4 Cultural Organizations Support for Culture Investment in Culture Individual Growth The Impact of Culture Demographic Profile Study Methodology Appendices: A: Survey Questionnaire B: Tabular Results
3 1 Introduction Playing a key role in Nova Scotia s culture, the Department of Communities, Culture, and Heritage (CCH) launched its first Nova Scotia Culture Index Survey in 2015, which aimed to understand Nova Scotians participation with, awareness of, and opinion of the value of culture. Ultimately, this Index was created to help support the development of Nova Scotia s Culture Action Plan and direct priorities and focus for eight key domains, including Personal Growth, Public Good, Heritage and Libraries, Live Performance, Visual and Applied Arts, Written and Published Works, Audio-visual and Interactive Media, and Sound Recording. Though the full-length Index survey will be repeated every two years, research to measure and establish benchmarks on select domains from the Index will be conducted annually to help gauge community and social impacts of culture in Nova Scotia. Specifically, the current iteration of the annual survey serves to establish benchmarks for Personal Growth and Public Good. The initial study conducted in 2015 involved an online survey conducted among a general population panel. The survey was divided into two questionnaires due to the number of questions. In total, 600 completed surveys were achieved (308 completes on survey A, 292 completes on survey B). The survey was designed in both French and English. The current iteration of this study consisted of random telephone interviews with a statistically representative sample of 1,000 Nova Scotia residents, conducted between February 16 and February 29, In keeping with the initial survey design, respondents were provided with the option to complete the survey in French or English. All respondents opted to conduct the survey in English. A sample of 1,000 drawn from the general population of Nova Scotia provides results accurate to within plus or minus 3.1 percentage points, 19 times out of 20. The results of this research can be extrapolated to the overall population of Nova Scotia with a 95 percent confidence level. This larger sample size allows for subgroup analysis across three key regions in the province. On average, the survey took eight (8) minutes to complete. Throughout the report, comparisons are provided between the overall 2016 telephone survey results and the combined 2015 online survey samples. That said, given the differing methodologies, it is important to note that changes in findings may be reflective of the methodologies used rather than an actual change year-over-year. A more complete description of the methodology used to conduct the 2016 survey is provided at the back of this report. Of note, throughout the report, detailed data table references are included (e.g. Table 1) for ease of reference. Data tables are included as Appendix B.
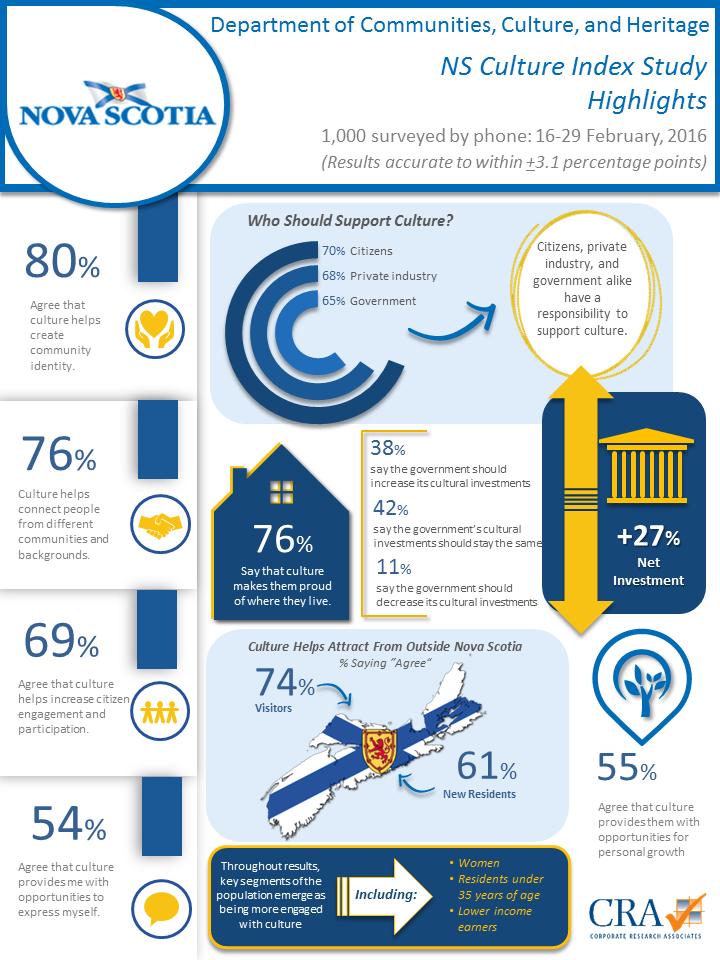
4 2 Executive Summary Findings from the 2016 Nova Scotia Culture Index Study reveal that culture is extremely important to residents as a key part of living in Nova Scotia. Indeed, the vast majority are proud of where they live because of culture, and largely consider culture to be a key factor in the development of individual and community identity. Perceptions of Culture According to residents, culture helps to create community identity, brings people together, and attracts visitors and new residents from outside of the province. As well, culture is viewed as a primary reason for people to stay in their community, increasing engagement and participation among citizens. Cultural Organizations Residents believe that cultural organizations are important to local economies, contributing in several ways. In particular, cultural organizations generate and support creativity and are critical to the sustainability of residents communities. Underscoring the importance placed on cultural organizations, a strong majority of residents believe that governments should spend tax dollars on supporting cultural organizations in Nova Scotia. Support for Culture Overall, residents acknowledge the responsibility of all Nova Scotians to support culture. More specifically, a large majority believe that citizens should support culture through donations and participation. Private industry should support culture through investments and donations according to a strong majority, along with government support, which should stem from taxes collected. Investment in Culture Regardless of whether the provincial budget changes, residents largely believe that either the same proportion of investments or more should be allocated towards cultural initiatives. Overall, when considering the net perception towards investment, findings suggest that Government should invest more in culture. The Impact of Culture Nova Scotians recognize the personal impact of culture. The vast majority indicates that culture makes them proud of where they live, and connects them with other people in their community, helping them develop a sense of identity and community. Moreover, a small majority of residents believe that culture provides them with opportunities for personal growth, as well as opportunities for self-expression. The infographic on the following page offers a one-page visual summary of results.
5 3

6 4 Detailed Analysis Public Good Perceptions of Culture Residents were asked to indicate their level of agreement with several statements about culture. Overall, culture is recognized among the majority of Nova Scotians as a key factor that enriches communities across the province. Indeed, residents strongly agree that culture helps create community identity, helps to Culture is considered an important part of Nova Scotia, uniting people and communities from inside and outside of the province. attract visitors from outside of the province, and helps connect people from different communities or backgrounds. Meanwhile, residents agree more moderately that culture helps attract new residents from outside Nova Scotia. Perceptions of each evaluation are discussed in more detail below. (Table 1a-f) Opinions around culture are highly consistent across the population, with only slight differences found between men and women, where women are more likely to agree with each statement.
7 5 Creating Community Identity Residents strongly agree that culture helps create community identity. Indeed, only a small portion disagree to any extent or indicate more neutral opinions (scoring 3 out of 5). When comparing results over time, the proportion of those who agree is consistent, although the extent to which they agree is much stronger this year, perhaps attributed to the different methodologies of data collection. (Table 1e) As mentioned, the proportion of residents who agree or disagree more generally is highly consistent across the population and across regions. Meanwhile, women cite stronger levels of agreement compared to men, as do those with higher educations.
8 6 Attracting Visitors From Outside Nova Scotia The vast majority of residents believe that culture helps attract visitors from outside Nova Scotia, including half who strongly agree, while one quarter agree to a lesser extent (i.e. rating of 2). Once again, results show the degree of agreement varies notably year-over-year, although this could be reflective of the differing methodology. Nonetheless, only a small number continue to feel otherwise or report neutral opinions. (Table 1b) As mentioned, women are more likely than men to strongly agree that culture helps attract visitors from outside Nova Scotia. This perception is also felt more strongly among younger residents under the age of 55 years, higher earners, and those with higher levels of education. Results are highly comparable across the Province.
9 7 Connecting People From Different Communities / Backgrounds A large majority of Nova Scotians believe that culture helps connect people from different communities or backgrounds, a perception which has held steady over the past year. However, the extent to which residents agree has strengthened compared to previous results, with nearly half now stating that they strongly agree. As with previous findings, only a small portion feel otherwise. (Table 1a) Women and those who have post-secondary education agree more strongly with this statement compared to their counterparts. Otherwise, perceptions are comparable across the population and by region. Larger businesses are less likely to say yes
10 8 Providing Reasons for People to Stay in Their Community For a large majority of residents, culture provides reasons for people to stay in their community. Although the proportion with this opinion has held steady, once again the degree of agreement (ratings of 1 & 2) varies notably year-over-year. Disagreement is uncommon, while those offering neutral opinions comprise two in ten. (Table 1f) The opinion that culture provides reasons for people to stay in their community is highly consistent across the population, including key regions across the Province. That is, with the exception of gender, as women are more likely to agree with this statement overall compared to men.
11 9 Increasing Citizen Engagement and Participation A large majority of residents agree that culture helps increase citizen engagement and participation. Overall, perceptions are consistent with last year, while a greater portion indicate strong levels of agreement by comparison. This variation in levels of agreement may be reflective of different research methodologies. Disagreement remains consistent. (Table 1d) Agreement that culture helps increase citizen engagement and participation is greater among those with higher income and education levels, and is also more common among women compared to men. Regional results are highly consistent.
12 10 Attracting New Residents From Outside Nova Scotia Culture is largely believed to help attract new residents from outside Nova Scotia. Although the number of residents who feel this way has declined over the past year, agreement levels have strengthened in comparison to previous results. (Table 1c) Women and younger residents are more likely to agree overall that culture helps attract new residents from outside Nova Scotia. Otherwise, opinions in this regard are comparable across demographics and regions.

13 11 Cultural Organizations Considered beneficial to Nova Scotia s communities and local economies, residents believe cultural organizations should be supported by tax dollars. In order to better understand the perceived contribution made by cultural organizations, residents were asked to indicate their level of agreement with several statements. Overall, perceptions are positive, with the majority agreeing that tax dollars should be allocated towards support for cultural organizations, as such organizations are believed to benefit Nova Scotia s communities and local economy. Opinions surrounding each statement are explored in more detail below. (Table 3a-d) Women are more likely to agree with each of the statements than men. Meanwhile, younger residents under the age of 35 years are more likely to agree that cultural organizations are critical to the sustainability of their community, and that Government should spend tax dollars on supporting cultural organizations in Nova Scotia. Otherwise, perceptions are relatively consistent across the population.

14 12 Government Tax Spending Residents feel strongly that Government should spend tax dollars on supporting cultural organizations in Nova Scotia. Although agreement overall is unchanged from last year, opinions this year are more definitive with a larger portion of residents indicating that they strongly agree and fewer expressing more moderate agreement. Neutrality has declined over the past year, while disagreement is largely unchanged. (Table 3d) Women feel more strongly than men that Government should spend tax dollars on supporting Nova Scotian cultural organizations. Likewise, Cape Bretoners agree more strongly with this statement than their counterparts elsewhere in the province. More generally, this perception declines with age, but increases with education and income level.
15 13 Generating and Supporting Creativity and Innovation Nearly two thirds of residents overall believe that cultural organizations generate and support creativity and innovation in their community. Those feeling otherwise comprise a small portion of the population. Compared to last year, overall agreement has notably declined, stemming from a drop in the number of residents who agree more moderately. That said, the portion expressing strong levels of agreement is consistent with 2015 results. (Table 3b) Women are much more likely than men to believe that cultural organizations generate and support creativity and innovation in their community. As well, agreement with this statement increases with education level. Perceptions are highly consistent across the Province.

16 14 Importance to Local Economy Over six in ten believe that cultural organizations are important to their local economies, including one third who strongly agree with this statement. A significant decline in overall agreement from last year is observed, with fewer residents expressing more moderate agreement. Those whose perceptions strongly align with this statement now comprise a greater minority of the population. Opposition is uncommon, and largely unchanged from last year. (Table 3a) Women are much more likely than men to feel that cultural organizations are important to residents local economies. Otherwise, this perception is generally consistent across the population and across regions.
17 15 Community Sustainability Three in five residents believe that cultural organizations are critical to the sustainability of their community, marking a decline from previous results. That said, the proportion who strongly agrees with this perception is unchanged, while more moderate agreement is lower compared to last year. This is also the case for residents expressing neutral opinions. Meanwhile, disagreement has increased. (Table 3c) Women and younger residents more commonly believe that cultural organizations are critical to the sustainability of their community. As well, slightly more Halifax residents feel this way compared to those living in the rest of mainland, while results for Cape Breton are comparable, sitting in between the two mainland regions.

18 16 Support for Culture Citizens, private industry, and Government alike should support culture in Nova Scotia financially. Residents believe that citizens, private industry, and government all have a responsibility to support culture in Nova Scotia. Moreover, findings suggest that all three parties share the obligation to support culture in Nova Scotia equally. Opinions surrounding each statement are explored in more detail below. (Table 4a-c) Across the population, opinions about who should support culture in Nova Scotia differ. In particular, differences by gender, age, income and education are found to varying degrees. Women are more likely than men to feel that Government and private industry should support culture. Age differences are also found, where those under 35 years more commonly agree that Government and citizens should support culture in Nova Scotia by comparison. The latter opinion is also more commonly held by those with higher incomes and education levels.
19 17 Citizen Donations and Participation The opinion that citizens should support culture through donations and participation is held by seven in ten residents. This year, a greater portion express strong levels of agreement and fewer agree more moderately. Neutral opinions have also declined slightly, while disagreement is relatively stable. (Table 4c) Overall, the belief that citizens should support culture through donations and participation becomes more prevalent as income and education levels increase. Meanwhile, perceptions are highly consistent across the Province.
20 18 Private Sector Investments and Donations Over two thirds believe that private industry should support culture through investments and donations. The portion holding strong opinions in this regard has not changed over the past year, however a decline is observed among those expressing moderate agreement. Residents stating neutral opinions or disagreement have remained stable. (Table 4b) As mentioned, women are more likely to agree that private industry should support culture through investments and donations. In addition, this perception is held by slightly more of those living in Cape Breton compared to residents elsewhere in the province.
21 19 Government Investment Three in five residents believe that Government should support culture by investing taxes collected. On the other hand, two in ten neither agree nor disagree with this comment, while slightly fewer state opposition. Over the past year, overall agreement has remained largely unchanged, although the extent to which residents agree has shifted. In particular, those expressing strong levels of agreement comprise a larger portion of residents, while more moderate agreement has declined. (Table 4a) The belief that Government should support culture by investing taxes collected is significantly higher among women compared to men. As well, agreement declines notably with age. Across regions, perceptions are consistent.

22 20 Investment in Culture Residents largely believe that cultural investments by the Government should increase or remain the same, even if the provincial budget is unchanged. In further exploring perceptions around support for culture in Nova Scotia, residents were asked to indicate how much of the provincial budget should be allocated towards cultural initiatives. Assuming the budget remains the same, four in ten residents believe that the Government should invest more on culture. A slightly larger portion feels that the Government should invest the same amount on culture, while one in ten states that less of an investment should be made. Comparing results to last year s findings, residents are now more supportive of culture, with a larger portion stating that the Government should invest more on culture, and fewer now believe that the same amount of the budget should be allocated. (Table 5) Net Investment by Region +30% +26% +28% Women, younger residents, and lower earners, are more likely to believe that the Government should invest more on culture compared to their respective counterparts. Cape Bretoners are most likely to believe the Government should invest more on culture, while those living in the rest of mainland Nova Scotia are least likely to feel this way.


23 21 Individual Growth The Impact of Culture Culture makes Nova Scotians proud of where they live and reinforces their relationships and identities. The personal impact of culture is recognized by the majority of residents, with the larger portion stating that they are proud of where they live because of culture. On the other hand, a smaller majority believe that culture provides them with opportunities to express themselves. Results for each of the statements under evaluation are analyzed in more detail in the following section. (Table 2a-e) Across nearly all statements, women are more likely to agree than men with the exception of the statement that culture makes them proud of where they live, where perceptions are comparable. As well, younger residents are more likely to believe that culture has helped them to develop a sense of identity and community, and that culture connects them with other people in their community. Lower earners are also more likely to align with the latter two statements, along with the statement that culture provides them with opportunities to express themselves.
24 22 Proud of Where I Live Three quarters of residents overall indicate that culture makes them proud of where they live, consistent with previous findings. That said, this year, a larger portion express stronger levels of agreement with this statement compared. As well, the number of residents stating neutral opinions has declined, while disagreement is largely unchanged. (Table 2e) While overall perceptions are generally consistent across the population, agreement is expressed more strongly by women, Cape Bretoners, those with incomes below $75K, and those without children in their household compared to their respective counterparts.
25 23 Connects Me With Other People For two thirds of residents, culture connects them with other people in their community, although results have declined slightly since Further, the portion expressing strong levels of agreement is consistent, while fewer now express more moderate agreement. Opposing perceptions have increased slightly compared to last year s results. (Table 2d) Perceptions vary demographically, with men, those earning incomes of $75K or more, and those with high school level educations being less likely than their counterparts to agree that culture connects them with other people in their community. Perceptions are highly comparable across regions.
26 24 Developing a Sense of Identity and Community Six in ten residents report that culture has helped them develop a sense of identity and community, consistent with last year. More residents now express strong levels of agreement, while the portion who agree to a lesser extent has declined notably. Those who fall in the middle of the scale, indicating neutrality have declined, while the portion who strongly disagree has increased. (Table 2c) Women, residents under 35 years of age, lower earners, and those without children in their households are much more likely to agree that culture has helped them develop a sense of identity and community compared to their respective counterparts. Across the three key regions of the Province, perceptions are highly consistent.
27 25 Opportunities for Personal Growth Just over one half of Nova Scotians agree that culture provides them with opportunities for personal growth. Agreement with this statement has significantly declined over the past year, although the portion strongly agreeing has remained relatively consistent. In turn, the portion feeling otherwise is now higher, particularly in terms of moderate disagreement. (Table 2a) The opinion that culture provides them with opportunities for personal growth is more common among women and lower earners by comparison. Otherwise, levels of agreement are consistent across demographics and regions.
28 26 Opportunities to Express Myself A small majority of residents state that culture provides them with opportunities to express themselves. This perception is less common compared to last year, with the portion who moderately agree having declined notably. In turn, the percent who disagree has increased. (Table 2b) % 2.4 Across the population, women are more likely to agree that culture provides them with opportunities to express themselves compared to men. As well, agreement declines notably with income. Meanwhile, across regions, perceptions are comparable.
29 27 Demographic Profile The following provides a demographic profile of respondents of the 2016 Nova Scotia Culture Index.
30 28 Study Methodology Sample Design and Selection The 2016 Nova Scotia Culture Index Survey was designed to complete random telephone interviews with a representative sample of Nova Scotia residents. Results were weighted based on age, gender, and region. The sample was drawn using systematic sampling procedures from a list of randomly selected residential telephone numbers, compiled from land line numbers in the Province. Data Collection Data collection was conducted by telephone between February 16 and February 29, The average length of time required to complete an interview was 8 minutes. Trained and fully supervised interviewers conducted all interviewing, and a field supervisor verified 10 percent of all interviews through monitoring. Sample Size and Tolerances A sample of 1,000 in Nova Scotia produces an overall margin of sampling error of plus or minus 3.1 percent, 19 times out of 20. The margin of sampling error will be greater for regional and other subsamples, as suggested in the following table. Sampling Tolerances for Percentage Results by Sample Size Size of Sample 10 or 90% 20 or 80% 30 or 70% 40 or 60% 50% 500 Interviews Interviews Interviews interviews Completion Results Among all eligible respondents contacted for interviews in the 2016 Nova Scotia Culture Index Survey, the rate of interview completion was seven percent. Completion rate is calculated as the number of cooperative contacts (1,297) divided by the total of eligible numbers attempted (17,764). The final disposition of all telephone numbers called is shown below in the Marketing Research and Intelligence Association (MRIA) Standard Record of Contact Format.
31 29 Completion Results A. Total Numbers Attempted 31,626 Discontinued Number/Not in Service 13,534 Fax/Modem 204 Cell Phone/Pager 0 Residential Number 111 Wrong Number 13 B. Total Eligible Numbers 17,764 Busy 247 Answering Machine 2,768 No Answer 6,631 Scheduled Call Back 1,435 Mid Call Back 8 Illness, Incapable 12 Language Problem 44 Qualified Not Available 0 C. Total Asked 6,619 Gatekeeper Refusal 0 Terminate/Hang Up 39 Respondent Refusal 4,687 Never Call List 596 Hang Up 0 D. Co-operative Contacts 1,297 Terminated, Quota Full 297 Complete 1,000 Average Interview Length 8 minutes
Community perceptions of migrants and immigration. D e c e m b e r
 Community perceptions of migrants and immigration D e c e m b e r 0 1 OBJECTIVES AND SUMMARY OBJECTIVES The purpose of this research is to build an evidence base and track community attitudes towards migrants
Public Attitudes Survey Bulletin
 An Garda Síochána Public Attitudes Survey Bulletin 2017 Research conducted by This bulletin presents key findings from the first quarter of the Public Attitudes Survey conducted between January and March
Vancouver Police Community Policing Assessment Report Residential Survey Results NRG Research Group
 Vancouver Police Community Policing Assessment Report Residential Survey Results 2017 NRG Research Group www.nrgresearchgroup.com April 2, 2018 1 Page 2 TABLE OF CONTENTS A. EXECUTIVE SUMMARY 3 B. SURVEY
Environmentally Sustainable Agriculture Practices
 Environmentally Sustainable Agriculture Practices Lethbridge Public Opinion Study Winter 2018 2018 Lethbridge College Faron Ellis PhD, Research Chair Citizen Society Research Lab faron.ellis@lethbridgecollege.ca
The City of Cape Coral, Florida
 PO Box 150027 Cape Coral, FL 33915 T: (239) 574-0447 F: (239) 574-0452 www.capegov.org The City of Cape Coral, Florida 2007 The National Citizen Survey National Research Center, Inc. 3005 30 th St. Boulder,
COLORADO LOTTERY 2014 IMAGE STUDY
 COLORADO LOTTERY 2014 IMAGE STUDY AUGUST 2014 Prepared By: 3220 S. Detroit Street Denver, Colorado 80210 303-296-8000 howellreserach@aol.com CONTENTS SUMMARY... 1 I. INTRODUCTION... 7 Research Objectives...
Police Firearms Survey
 Police Firearms Survey Final Report Prepared for: Scottish Police Authority Prepared by: TNS JN:127475 Police Firearms Survey TNS 09.12.2014 JN127475 Contents 1. Background and objectives 3 2. Methodology
FINAL REPORT. Public Opinion Survey at the 39th General Election. Elections Canada. Prepared for: May MacLaren Street Ottawa, ON K2P 0M6
 FINAL REPORT Public Opinion Survey at the 39th General Election Prepared for: Elections Canada May 2006 336 MacLaren Street Ottawa, ON K2P 0M6 TABLE OF CONTENTS List of Exhibits Introduction...1 Executive
Focus Canada Fall 2018
 Focus Canada Fall 2018 Canadian public opinion about immigration, refugees and the USA As part of its Focus Canada public opinion research program (launched in 1976), the Environics Institute updated its
BY Aaron Smith FOR RELEASE JUNE 28, 2018 FOR MEDIA OR OTHER INQUIRIES:
 FOR RELEASE JUNE 28, 2018 BY Aaron Smith FOR MEDIA OR OTHER INQUIRIES: Aaron Smith, Associate Director, Research Lee Rainie, Director, Internet and Technology Research Dana Page, Associate Director, Communications
STEM CELL RESEARCH AND THE NEW CONGRESS: What Americans Think
 March 2000 STEM CELL RESEARCH AND THE NEW CONGRESS: What Americans Think Prepared for: Civil Society Institute Prepared by OPINION RESEARCH CORPORATION January 4, 2007 Opinion Research Corporation TABLE
Attitudes toward Immigration: Iowa Republican Caucus-Goers
 November 0 Survey Attitudes toward Immigration: Iowa Republican Caucus-Goers Partnership for a New American Economy Methodology: Survey Sample frame: Sample size: Weighting: Margin of error: Method/length:
BACKGROUNDER The Common Good: Who Decides? A National Survey of Canadians
 BACKGROUNDER The Common Good: Who Decides? A National Survey of Canadians Commissioned by The Pierre Elliott Trudeau Foundation in collaboration with the University of Alberta Purpose: Prior to the ninth
FOR IMMEDIATE RELEASE DATE: August 3, 2004 CONTACT: Adam Clymer at or (cell) VISIT:
 VISIT:") FOR IMMEDIATE RELEASE DATE: August 3, 2004 CONTACT: Adam Clymer at 202-879-6757 or 202 549-7161 (cell) VISIT: www.naes04.org Fahrenheit 9/11 Viewers and Limbaugh Listeners About Equal in Size Even Though
FOR IMMEDIATE RELEASE DATE: August 3, 2004 CONTACT: Adam Clymer at 202-879-6757 or 202 549-7161 (cell) VISIT: www.naes04.org Fahrenheit 9/11 Viewers and Limbaugh Listeners About Equal in Size Even Though
Borders First a Dividing Line in Immigration Debate
 JUNE 23, 2013 More Say Legalization Would Benefit Economy than Cost Jobs Borders First a Dividing Line in Immigration Debate A Pew Research Center/USA TODAY Survey FOR FURTHER INFORMATION CONTACT THE PEW
Saskatchewan Ministry of Municipal Affairs. Daylight Saving Time Opinion Survey Results
 Saskatchewan Ministry of Municipal Affairs Daylight Saving Time Opinion Survey Results February 2011 Contents Executive Summary... 1 Introduction... 1 Methodology... 3 Project Background... 3 Survey Results...
Public Attitudes Survey Bulletin
 An Garda Síochána Public Attitudes Survey Bulletin 218 Research conducted by This bulletin presents high level findings from the second quarter of the Public Attitudes Survey conducted between April and
Public Attitudes Survey Bulletin
 An Garda Síochána Public Attitudes Survey Bulletin 218 Research conducted by This bulletin presents high level findings from the third quarter of the Public Attitudes Survey conducted between July and
Politics in Newfoundland and Labrador
 Politics in Newfoundland and Labrador A survey of eligible voters on provincial politics. David Coletto June 29, 2015 Methodology Survey Methodology 722 eligible voters in NL were surveyed using live telephone
City Facilities Survey February 2011
 City of Lake Oswego City Facilities Survey February 2011 Prepared By: DHM Research Prepared For: City of Lake Oswego February 7, 2011 To: City of Lake Oswego From: Davis, Hibbitts & Midghall, Inc. (DHM
Job approval in North Carolina N=770 / +/-3.53%
 Elon University Poll of North Carolina residents April 5-9, 2013 Executive Summary and Demographic Crosstabs McCrory Obama Hagan Burr General Assembly Congress Job approval in North Carolina N=770 / +/-3.53%
Focus Canada Spring 2017 Canadian public opinion about immigration and the USA
 Focus Canada Spring 2017 Canadian public opinion about immigration and the USA As part of its Focus Canada public opinion research program (launched in 1976), the Environics Institute updated its research
ANNUAL SURVEY REPORT: ARMENIA
 ANNUAL SURVEY REPORT: ARMENIA 2 nd Wave (Spring 2017) OPEN Neighbourhood Communicating for a stronger partnership: connecting with citizens across the Eastern Neighbourhood June 2017 ANNUAL SURVEY REPORT,
Refugees crossing Canadian border from U.S. NANOS SURVEY
 Canadians think too little is being done in response to asylum seekers crossing U.S. border into Canada but believe more aid should be given to Rohingya refugees National survey released June, 2018 Project
THE LOUISIANA SURVEY 2018
 THE LOUISIANA SURVEY 2018 Criminal justice reforms and Medicaid expansion remain popular with Louisiana public Popular support for work requirements and copayments for Medicaid The fifth in a series of
Telephone Survey. Contents *
 Telephone Survey Contents * Tables... 2 Figures... 2 Introduction... 4 Survey Questionnaire... 4 Sampling Methods... 5 Study Population... 5 Sample Size... 6 Survey Procedures... 6 Data Analysis Method...
R Eagleton Institute of Politics Center for Public Interest Polling
 2002 SURVEY OF NEW BRUNSWICK RESIDENTS Conducted for: Conducted by: R Eagleton Institute of Politics Center for Public Interest Polling Data Collection: May 2002 02-02 EXECUTIVE SUMMARY TABLE OF CONTENTS
Alberta Carbon Levy and Rebate Program Lethbridge Public Opinion Study Winter 2018
 Alberta Carbon Levy and Rebate Program Lethbridge Public Opinion Study Winter 2018 2018 Lethbridge College Faron Ellis PhD, Research Chair Citizen Society Research Lab faron.ellis@lethbridgecollege.ca
CITY USER PROFILE 15 ADELAIDE CITY COUNCIL RESEARCH REPORT
 CITY USER PROFILE 15 ADELAIDE CITY COUNCIL RESEARCH REPORT CONTENTS What is the City User Profile and why do we do it? p. 03 How is CUP data collected? p. 03 What are some of the key findings from CUP
MEDICAID EXPANSION RECEIVES BROAD SUPPORT CHRISTIE POSITIONED WELL AMONG ELECTORATE IMPROVES UPON FAVORABLES AMONG DEMOCRATS
 For immediate release Tuesday, March 12, 2013 8 pp. Contact: Krista Jenkins Office: 973.443.8390 Cell: 908.328.8967 kjenkins@fdu.edu MEDICAID EXPANSION RECEIVES BROAD SUPPORT CHRISTIE POSITIONED WELL AMONG
Committee for Economic Development: October Business Leader Study. Submitted to:
 ZOGBY INTERNATIONAL Committee for Economic Development: October Business Leader Study Submitted to: Mike Petro Vice President of Business and Government Policy and Chief of Staff Submitted by: Zogby International
OPEN NEIGHBOURHOOD. Communicating for a stronger partnership: connecting with citizens across the Southern Neighbourhood
 OPEN NEIGHBOURHOOD Communicating for a stronger partnership: connecting with citizens across the Southern Neighbourhood OPINION POLL SECOND WAVE REPORT Spring 2017 A project implemented by a consortium
Attitudes towards Refugees and Asylum Seekers
 Attitudes towards Refugees and Asylum Seekers A Survey of Public Opinion Research Study conducted for Refugee Week May 2002 Contents Introduction 1 Summary of Findings 3 Reasons for Seeking Asylum 3 If
RECOMMENDED CITATION: Pew Research Center, August, 2016, On Immigration Policy, Partisan Differences but Also Some Common Ground
 NUMBERS, FACTS AND TRENDS SHAPING THE WORLD FOR RELEASE AUGUST 25, 2016 FOR MEDIA OR OTHER INQUIRIES: Carroll Doherty, Director of Political Research Jocelyn Kiley, Associate Director, Research Bridget
Alberta Provincial Politics Carbon Levy and Rebate Program. Alberta Public Opinion Study October 2017
 Alberta Provincial Politics Carbon Levy and Rebate Program Alberta Public Opinion Study October 2017 Methodology Population The province of Alberta has a total population of 4,286,134 residents (Alberta
FAVORABLE RATINGS OF LABOR UNIONS FALL SHARPLY
 NEWS Release. 1615 L Street, N.W., Suite 700 Washington, D.C. 20036 Tel (202) 419-4350 Fax (202) 419-4399 FOR IMMEDIATE RELEASE: Tuesday, February 23, 2010 FOR FURTHER INFORMATION: Andrew Kohut, Director
October 29, 2010 I. Survey Methodology Selection of Households
 October 29, 2010 I. Survey Methodology The Elon University Poll is conducted using a stratified random sample of households with telephones and wireless telephone numbers in the population of interest
Americans and Germans are worlds apart in views of their countries relationship By Jacob Poushter and Alexandra Castillo
 EMBARGOED COPY NOT FOR DISTRIBUTION OR PUBLICATION UNTIL 17:00 WASHINGTON DC TIME 22:00 LONDON TIME 23:00 BERLIN TIME MONDAY, NOVEMBER 26, 2018 1 Americans and Germans are worlds apart in views of their
NDP Leads Going Into the Final Week, but the Gap is Narrowing
 FOR IMMEDIATE RELEASE NDP Leads Going Into the Final Week, but the Gap is Narrowing Weaver most popular leader by far Toronto, May 1 st In a random sampling of public opinion taken by The Forum Poll among
Demographic and economic profiles of immigrant taxfilers to Atlantic Canada. Yoko Yoshida, Associate Professor
 Demographic and economic profiles of immigrant taxfilers to Atlantic Yoko Yoshida, Associate Professor yoko.yoshida@dal.ca Howard Ramos, Professor howard.ramos@dal.ca Department of Sociology and Social
RECOMMENDED CITATION: Pew Research Center, October, 2015, On Immigration Policy, Wider Partisan Divide Over Border Fence Than Path to Legal Status
 NUMBERS, FACTS AND TRENDS SHAPING THE WORLD FOR RELEASE OCTOBER 8, 2015 FOR FURTHER INFORMATION ON THIS REPORT: Carroll Doherty, Director of Political Research Rob Suls, Research Associate Bridget Jameson,
35% 34% 34% 32% METHODOLOGY:
 Page 1 of 13 Federal Politics: Harper s Conservatives end 2014 with slight lead over Trudeau Liberals; NDP running third PM s momentum increases slightly over the year, but most Canadians still say it
Attitudes Toward Changes to CBC Regional Programming in Atlantic Canada
 Attitudes Toward Changes to CBC Regional Programming in Atlantic Canada A COMPAS Survey for the University of King s College School of Journalism in association with the Friends of Canadian Broadcasting
Nova Scotia Office of Immigration Annual Accountability Report for the Fiscal Year
 Nova Scotia Office of Immigration Annual Accountability Report for the Fiscal Year 2010-2011 Table of Contents Accountability Statement...3 Message from the Minister...4 Financial Results...6 Measuring
Voter ID Pilot 2018 Public Opinion Survey Research. Prepared on behalf of: Bridget Williams, Alexandra Bogdan GfK Social and Strategic Research
 Voter ID Pilot 2018 Public Opinion Survey Research Prepared on behalf of: Prepared by: Issue: Bridget Williams, Alexandra Bogdan GfK Social and Strategic Research Final Date: 08 August 2018 Contents 1
Study Background. Part I. Voter Experience with Ballots, Precincts, and Poll Workers
 The 2006 New Mexico First Congressional District Registered Voter Election Administration Report Study Background August 11, 2007 Lonna Rae Atkeson University of New Mexico In 2006, the University of New
Survey of Candidates of the 41 st Federal General Election
 Survey of Candidates of the 41 st Federal General Election FINAL REPORT Prepared for Elections Canada 2011 Phoenix SPI is a Gold Seal Certified Corporate Member of the MRIA 1678 Bank Street, Suite 2, Ottawa,
European Movement Ireland Research Poll. April 2017 Ref:
 European Movement Ireland Research Poll April 2017 Ref: 161115 Methodology and Weighting RED C interviewed a random sample of 1,007 adults aged 18+ by telephone between the 24 th 27 th April 2017. A random
Voter and non-voter survey report
 Voter and non-voter survey report Proposal prepared for: Colmar Brunton contact The Electoral Commission Ian Binnie Date: 27 February 2012 Level 1, 6-10 The Strand PO Box 33690 Takapuna 0740 Auckland.
Attitudes to global risks and governance
 Attitudes to global risks and governance Global Challenges Foundation 2017 Table of contents Introduction 3 Methodology 4 Executive summary 5 Perceptions of global risks 7 Perceptions of global governance
Points of View Asia Pacific
 Points of View Asia Pacific Profile of Opinion Panel Members (Updated - June 2012) Table of Contents About the Points of View Panel 3 Summary Profile Survey. 4 Connections to Asia.. 6 Type of Engagement
RECOMMENDED CITATION: Pew Research Center, May, 2015, Free Trade Agreements Seen as Good for U.S., But Concerns Persist
 NUMBERS, FACTS AND TRENDS SHAPING THE WORLD FOR RELEASE MAY 27, 2015 FOR FURTHER INFORMATION ON THIS REPORT: Carroll Doherty, Director of Political Research Jocelyn Kiley, Associate Director, Research
RECOMMENDED CITATION: Pew Research Center, May, 2015, Republicans Early Views of GOP Field More Positive than in 2012, 2008 Campaigns
 NUMBERS, FACTS AND TRENDS SHAPING THE WORLD FOR RELEASE MAY 19, 2015 FOR FURTHER INFORMATION ON THIS REPORT: Carroll Doherty, Director of Political Research Jocelyn Kiley, Associate Director, Research
Flash Eurobarometer 337 TNS political &social. This document of the authors.
 Flash Eurobarometer Croatia and the European Union REPORT Fieldwork: November 2011 Publication: February 2012 Flash Eurobarometer TNS political &social This survey has been requested by the Directorate-General
Immigration and Multiculturalism: Views from a Multicultural Prairie City
 Immigration and Multiculturalism: Views from a Multicultural Prairie City Paul Gingrich Department of Sociology and Social Studies University of Regina Paper presented at the annual meeting of the Canadian
DATE: October 7, 2004 CONTACT: Adam Clymer at or (cell) VISIT:
 VISIT:") DATE: October 7, 2004 CONTACT: Adam Clymer at 202-879-6757 or 202 549-7161 (cell) VISIT: www.naes04.org Kerry Gained Favorability after Debate but Bush Is Still Preferred As Commander-In-Chief, Annenberg
DATE: October 7, 2004 CONTACT: Adam Clymer at 202-879-6757 or 202 549-7161 (cell) VISIT: www.naes04.org Kerry Gained Favorability after Debate but Bush Is Still Preferred As Commander-In-Chief, Annenberg
Progressives in Alberta
 Progressives in Alberta Public opinion on policy, political leaders, and the province s political identity Conducted for Progress Alberta Report prepared by David Coletto, PhD Methodology This study was
NANOS. Ideas powered by world-class data. Liberals 41, Conservatives 31, NDP 15, Green 6 in latest Nanos federal tracking
 Liberals 41, Conservatives 31, NDP 15, Green 6 in latest Nanos federal tracking Nanos Weekly Tracking, ending September 14, 2018 (released September 18, 2018-6 am Eastern) NANOS Ideas powered by world-class
COMMUNITY PERCEPTIONS OF MIGRANTS AND IMMIGRATION
 COMMUNITY PERCEPTIONS OF MIGRANTS AND IMMIGRATION 3 1 EXECUTIVE SUMMARY 4 1.1 EXECUTIVE SUMMARY INTRODUCTION This report presents the findings from a Community survey designed to measure New Zealanders
NANOS. Liberals 42, Conservatives 29, NDP 19, Green 6 in latest Nanos federal tracking
 Liberals 42, Conservatives 29, NDP 19, Green 6 in latest Nanos federal tracking Nanos Weekly Tracking, ending December 15 th, 2017 (released December 19 th, 2017-6 am Eastern) NANOS At a glance Ballot
THE LOUISIANA SURVEY 2017
 THE LOUISIANA SURVEY 2017 Public Approves of Medicaid Expansion, But Remains Divided on Affordable Care Act Opinion of the ACA Improves Among Democrats and Independents Since 2014 The fifth in a series
RECOMMENDED CITATION: Pew Research Center, May, 2015, Public Continues to Back U.S. Drone Attacks
 NUMBERS, FACTS AND TRENDS SHAPING THE WORLD FOR RELEASE MAY 28, 2015 FOR FURTHER INFORMATION ON THIS REPORT: Carroll Doherty, Directory of Political Research Alec Tyson, Senior Researcher Rachel Weisel,
VOTERS AND HEALTH CARE IN THE 2018 CONGRESSIONAL ELECTION
 VOTERS AND HEALTH CARE IN THE 2018 CONGRESSIONAL ELECTION October 2018 TABLE OF CONTENTS PART I: PRESIDENT TRUMP... 1 PART II: NATIONAL PRIORITIES... 2 PART III: HEALTH CARE... 3 VOTERS AND HEALTH CARE
NANOS. Ideas powered by world-class data. Conservatives 35, Liberals 34, NDP 16, Green 8, People s 1 in latest Nanos federal tracking
 Conservatives 35, Liberals 34, NDP 16, Green 8, People s 1 in latest Nanos federal tracking Nanos Weekly Tracking, ending December 7, 2018 (released December 11, 2018-6 am Eastern) NANOS Ideas powered
RECOMMENDED CITATION: Pew Research Center, June, 2015, Broad Public Support for Legal Status for Undocumented Immigrants
 NUMBERS, FACTS AND TRENDS SHAPING THE WORLD FOR RELEASE JUNE 4, 2015 FOR FURTHER INFORMATION ON THIS REPORT: Carroll Doherty, Director of Political Research Alec Tyson, Senior Researcher Rachel Weisel,
Vancouver Police Community Policing Assessment Report
 Vancouver Police Community Policing Assessment Report Residential Survey Results FINAL DRAFT NRG Research Group Adam Di Paula & Richard Elias www.nrgresearchgroup.com 3/17/2009 VPD Community Policing Report
Motivations and Barriers: Exploring Voting Behaviour in British Columbia
 Motivations and Barriers: Exploring Voting Behaviour in British Columbia January 2010 BC STATS Page i Revised April 21st, 2010 Executive Summary Building on the Post-Election Voter/Non-Voter Satisfaction
Most opponents reject hearings no matter whom Obama nominates
 NUMBERS, FACTS AND TRENDS SHAPING THE WORLD FOR RELEASE FEBRUARY 22, 2016 Majority of Public Wants Senate to Act on Obama s Court Nominee Most opponents reject hearings no matter whom Obama nominates FOR
RECOMMENDED CITATION: Pew Research Center, July, 2015, Negative Views of Supreme Court at Record High, Driven by Republican Dissatisfaction
 NUMBERS, FACTS AND TRENDS SHAPING THE WORLD FOR RELEASE JULY 29, 2015 FOR FURTHER INFORMATION ON THIS REPORT: Carroll Doherty, Director of Political Research Bridget Jameson, Communications Associate 202.419.4372
PPIC Statewide Survey Methodology
 PPIC Statewide Survey Methodology Updated February 7, 2018 The PPIC Statewide Survey was inaugurated in 1998 to provide a way for Californians to express their views on important public policy issues.
NANOS. Gap between Liberals and Conservatives narrows to seven points in Nanos tracking
 Gap between Liberals and Conservatives narrows to seven points in Nanos tracking Nanos Weekly Tracking, ending January 27 th, 2017 (released January 31 st, 2017-6 am Eastern) NANOS At a glance Ballot The
Percentages of Support for Hillary Clinton by Party ID
 Executive Summary The Meredith College Poll asked questions about North Carolinians views of as political leaders and whether they would vote for Hillary Clinton if she ran for president. The questions
NANOS. Liberals 37, Conservatives 33, NDP 19, Green 7 in latest Nanos federal tracking
 Liberals 37, Conservatives 33, NDP 19, Green 7 in latest Nanos federal tracking Nanos Weekly Tracking, ending March 2 nd, 2018 (released March 6 th, 2018-6 am Eastern) NANOS At a glance Play with the data
NANOS. Liberals 35, Conservatives 34, NDP 20, Green 6 in latest Nanos federal tracking
 Liberals 35, Conservatives 34, NDP 20, Green 6 in latest Nanos federal tracking Nanos Weekly Tracking, ending May 18, 2018 (released May 22, 2018-6 am Eastern) NANOS At a glance Play with the data at the
NANOS. Liberals 37, Conservatives 35, NDP 18, Green 7 in latest Nanos federal tracking
 Liberals 37, Conservatives 35, NDP 18, Green 7 in latest Nanos federal tracking Nanos Weekly Tracking, ending July 13, 2018 (released July 17, 2018-6 am Eastern) NANOS At a glance Play with the data at
Vermonters Awareness of and Attitudes Toward Sprawl Development in 2002
 Vermonters Awareness of and Attitudes Toward Sprawl Development in 2002 Written by Thomas P. DeSisto, Data Research Specialist Introduction In recent years sprawl has been viewed by a number of Vermont
QUALITY OF LIFE QUALITY OF LIFE SURVEY 2016 Executive Summary and Research Design
 QUALITY OF LIFE QUALITY OF LIFE SURVEY 2016 Executive Summary and Research Design Quality of Life Survey 2016 Executive Summary and Research Design A joint project between the following New Zealand councils
This report is formatted for double-sided printing.
 Public Opinion Survey on the November 9, 2009 By-elections FINAL REPORT Prepared for Elections Canada February 2010 Phoenix SPI is a Gold Seal Certified Corporate Member of the MRIA 1678 Bank Street, Suite
NANOS. Liberals 38, Conservatives 34, NDP 17, Green 6 in latest Nanos federal tracking
 Liberals 38, Conservatives 34, NDP 17, Green 6 in latest Nanos federal tracking Nanos Weekly Tracking, ending January 19 th, 2018 (released January 23 rd, 2018-6 am Eastern) NANOS At a glance Play with
At a glance. Ottawa: (613) x 237
 x 237") Liberals 41, Conservatives 32, NDP 19, Green 3 in Nanos federal ballot Nanos Weekly Tracking, ending April 13 th, 2017 (released April 18 th, 2017-6 am Eastern) NANOS At a glance Ballot The latest Nanos
Liberals 41, Conservatives 32, NDP 19, Green 3 in Nanos federal ballot Nanos Weekly Tracking, ending April 13 th, 2017 (released April 18 th, 2017-6 am Eastern) NANOS At a glance Ballot The latest Nanos
NANOS. Liberals 40, Conservatives 31, NDP 17, Green 7 in latest Nanos federal tracking
 Liberals 40, Conservatives 31, NDP 17, Green 7 in latest Nanos federal tracking Nanos Weekly Tracking, ending December 1 st, 2017 (released December 5 th, 2017-6 am Eastern) NANOS At a glance Ballot The
NANOS. Liberals 35, Conservatives 33, NDP 22, Green 5 in latest Nanos federal tracking
 Liberals 35, Conservatives 33, NDP 22, Green 5 in latest Nanos federal tracking Nanos Weekly Tracking, ending June 8, 2018 (released June 12, 2018-6 am Eastern) NANOS At a glance Play with the data at
NANOS. Liberals 37, Conservatives 33, NDP 20, Green 5 in latest Nanos federal tracking
 Liberals 37, Conservatives 33, NDP 20, Green 5 in latest Nanos federal tracking Nanos Weekly Tracking, ending June 15, 2018 (released June 19, 2018-6 am Eastern) NANOS At a glance Play with the data at
ANNUAL SURVEY REPORT: AZERBAIJAN
 ANNUAL SURVEY REPORT: AZERBAIJAN 2 nd Wave (Spring 2017) OPEN Neighbourhood Communicating for a stronger partnership: connecting with citizens across the Eastern Neighbourhood June 2017 TABLE OF CONTENTS
Hong Kong Public Opinion & Political Development Opinion Survey Second Round Survey Results
 Centre for Communication and Public Opinion Survey The Chinese University of Hong Kong Hong Kong Public Opinion & Political Development Opinion Survey Second Round Survey Results (8-15.10.2014) October
NANOS. Liberals 38, Conservatives 35, NDP 17, Green 6 in latest Nanos federal tracking
 Liberals 38, Conservatives 35, NDP 17, Green 6 in latest Nanos federal tracking Nanos Weekly Tracking, ending March 23 rd, 2018 (released March 27 th, 2018-6 am Eastern) NANOS At a glance Play with the
FOURTH ANNUAL IDAHO PUBLIC POLICY SURVEY 2019
 FOURTH ANNUAL IDAHO PUBLIC POLICY SURVEY 2019 ABOUT THE SURVEY The Fourth Annual Idaho Public Policy Survey was conducted December 10th to January 8th and surveyed 1,004 adults currently living in the
Canadians Knowledge & Perception of the War of 1812 Final Report
 Canadians Knowledge & Perception of the War of 1812 Final Report TNS Canadian Facts, June 6, 2011 Submitted to: Department of Canadian Heritage 1 Contracting Details POR #: POR 071 10 Department of Canadian
Rural Pulse 2019 RURAL PULSE RESEARCH. Rural/Urban Findings March 2019
 Rural Pulse 2019 RURAL PULSE RESEARCH Rural/Urban Findings March 2019 Contents Executive Summary 3 Project Goals and Objectives 9 Methodology 10 Demographics 12 Detailed Research Findings 18 Appendix Prepared
Fairbank, Maslin, Maullin & Associates
 !! Fairbank, Maslin, Maullin & Associates Opinion Research & Public Policy Analysis TO: FROM: Interested Parties David Metz Fairbank, Maslin, Maullin & Associates Lori Weigel Public Opinion Strategies
Changing our ways: Why and how Canadians use the Internet
 Changing our ways: Why and how Canadians use the Internet By Heather Dryburgh Introduction Canadian households are increasingly buying home computers and connecting to the Internet (Dickinson & Ellison,
NANOS. Ideas powered by world-class data. Liberals 39 Conservatives 28, NDP 20, Green 6, People s 1 in latest Nanos federal tracking
 Liberals 39 Conservatives 28, NDP 20, Green 6, People s 1 in latest Nanos federal tracking Nanos Weekly Tracking, ending November 9, 2018 (released November 13, 2018-6 am Eastern) NANOS Ideas powered by
The National Citizen Survey
 CITY OF SARASOTA, FLORIDA 2008 3005 30th Street 777 North Capitol Street NE, Suite 500 Boulder, CO 80301 Washington, DC 20002 ww.n-r-c.com 303-444-7863 www.icma.org 202-289-ICMA P U B L I C S A F E T Y
REPORT TO PROPRIETARY RESULTS FROM THE 48 TH PAN ATLANTIC SMS GROUP. THE BENCHMARK OF MAINE PUBLIC OPINION Issued May, 2011
 REPORT TO PROPRIETARY RESULTS FROM THE 48 TH PAN ATLANTIC SMS GROUP OMNIBUS POLL THE BENCHMARK OF MAINE PUBLIC OPINION Issued May, 2011 5 Milk Street Portland, Maine 04101 Tel: (207) 871-8622 www.panatlanticsmsgroup.com
The Cook Political Report / LSU Manship School Midterm Election Poll
 The Cook Political Report / LSU Manship School Midterm Election Poll The Cook Political Report-LSU Manship School poll, a national survey with an oversample of voters in the most competitive U.S. House
ANNUAL SURVEY REPORT: BELARUS
 ANNUAL SURVEY REPORT: BELARUS 2 nd Wave (Spring 2017) OPEN Neighbourhood Communicating for a stronger partnership: connecting with citizens across the Eastern Neighbourhood June 2017 1/44 TABLE OF CONTENTS
EUROPEAN UNION CITIZENSHIP
 Flash Eurobarometer EUROPEAN UNION CITIZENSHIP REPORT Fieldwork: November 2012 Publication: February 2013 This survey has been requested by the European Commission, Directorate-General Justice and co-ordinated
PUBLIC BACKS CLINTON ON GUN CONTROL
 FOR RELEASE: FRIDAY, DECEMBER 10, 1993, A.M. But Handgun Ban Opposed PUBLIC BACKS CLINTON ON GUN CONTROL FOR FURTHER INFORMATION CONTACT: Andrew Kohut, Director Robert C. Toth, Senior Associate Carol Bowman,
November 15-18, 2013 Open Government Survey
 November 15-18, 2013 Open Government Survey 1 Table of Contents EXECUTIVE SUMMARY... 3 TOPLINE... 6 DEMOGRAPHICS... 14 CROSS-TABULATIONS... 15 Trust: Federal Government... 15 Trust: State Government...
FOR RELEASE NOVEMBER 07, 2017
 FOR RELEASE NOVEMBER 07, 2017 FOR MEDIA OR OTHER INQUIRIES: Carroll Doherty, Director of Political Research Jocelyn Kiley, Associate Director, Research Bridget Johnson, Communications Associate 202.419.4372