2013 UCLA Asian American Studies Center. All rights reserved. Asian American Studies Center Bridging Research with Community
|
|
|
- Hilary Adams
- 6 years ago
- Views:
Transcription
1
2 Ford Foundation The Ford Foundation supports visionary leaders and organizations on the frontlines of social change worldwide. Created with gifts and bequests by Edsel and Henry Ford, the foundation is an independent, nonprofit, nongovernmental organization, with its own board, and is entirely separate from the Ford Motor Company. The foundation is committed to serving the public welfare by strengthening democratic values, reducing poverty and injustice, promoting international cooperation and advancing human achievement. In the United States, the Ford Foundation s Building Economic Security over a Lifetime initiative promotes public support for policies that create universal and progressive savings accounts as well as Social Security and pension reforms that increase benefits for low-wage workers. For more information, please visit the Foundation s website at: building-economic-security-over-a-lifetime UCLA Asian American Studies Center Established in August 1969, the UCLA Asian American Studies Center has become the foremost national research center on Asian Americans and Pacific Islanders. It has sought to bridge the educational, social, political, and cultural concerns of the AAPI community, with the overall mission of the University of California, through research and creative endeavors, curriculum development, publications, library and archival work, public educational activities and partnerships with local and national organizations. Please visit our website at: aasc.ucla.edu Acknowledgements This research was made possible by the generous contribution and support of the Ford Foundation s Building Economic Security over a Lifetime Initiative. We are particularly appreciative to Kilolo Kijakazi for her encouragement, leadership, and wisdom. Kilolo is the Program Officer at the Financial Assets Unit, one of the units in the Economic Opportunity and Assets Program. The authors commend them for their continued commitment to better understand asset-building opportunities and challenges facing Asian American communities. The views expressed in this report are those of the authors and do not necessarily reflect the views or positions of the University of California, Los Angeles and the Ford Foundation. Special thanks to Chhandara Pech and Jonathan Ong for training on data sets, generating maps, formatting tables, and technical assistance. Big thanks to Karna Wong for copyediting and Randy Mai for assisting with the layout of the report. Cover and Report design: Mengning Li Asian American Studies Center Bridging Research with Community 2013 UCLA Asian American Studies Center. All rights reserved.
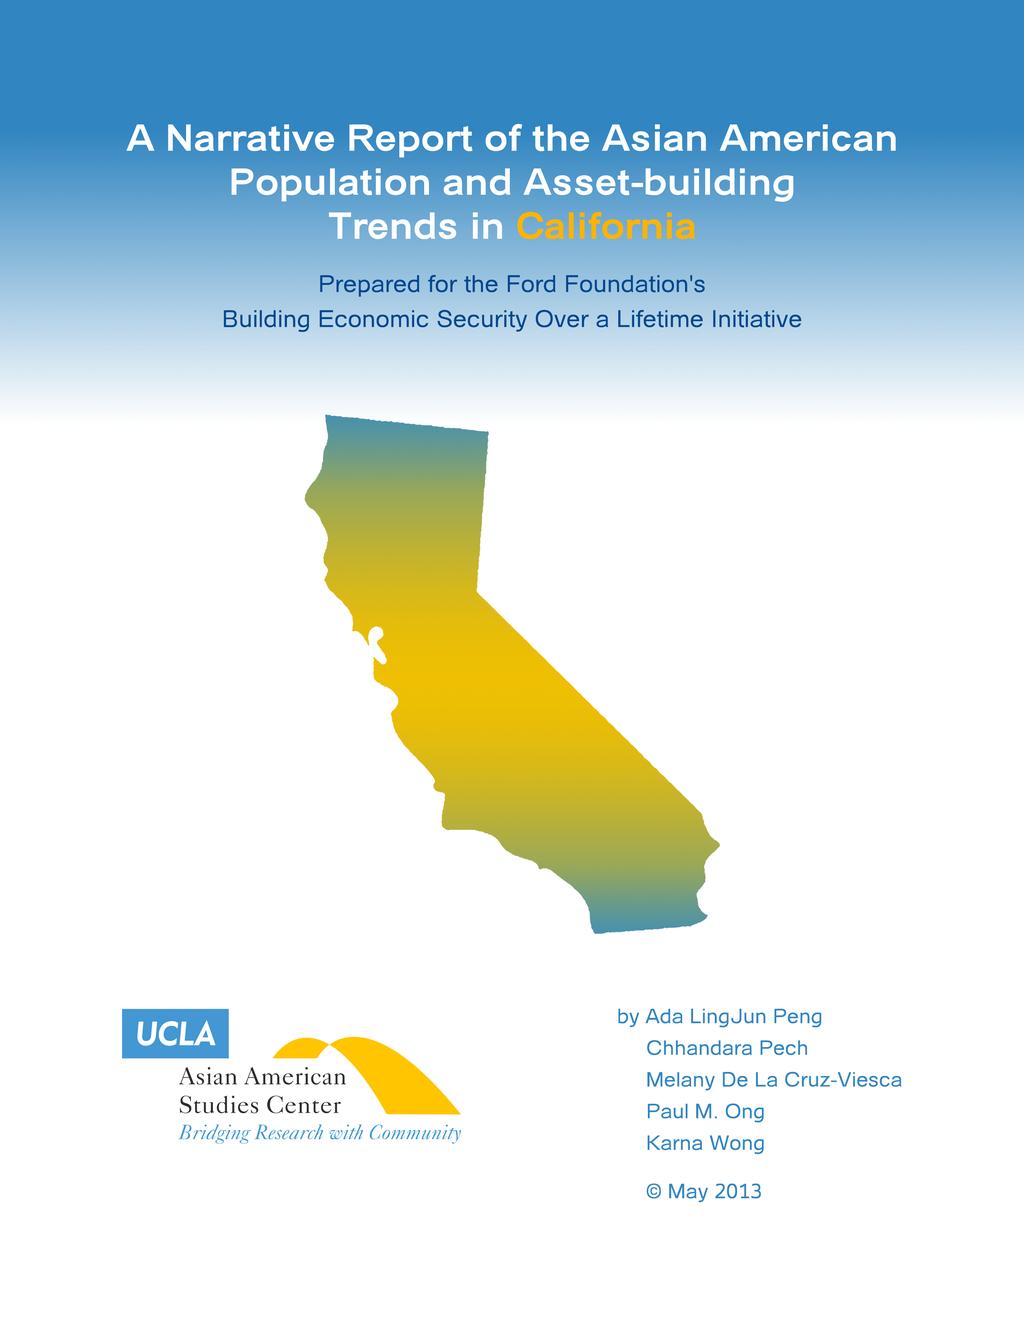
3 A Narrative Report of the Asian American Population and Asset-building Trends of California By Ada LingJun Peng, Chhandara Pech, Melany De La Cruz-Viesca, Paul M. Ong & Karna Wong UCLA Asian American Studies Center Table of Contents Map of California, Asian Population...2 Background...3 Introduction...3 Population...4 Nativity...4 Language...5 Education...6 Economic Status...8 Housing Trends...11 Conclusion...13 References...16 The Technical Report with this demographic profile s methodology, definitions, and detailed data charts and tables is available to download at:
4 Del Norte Siskiyou Modoc Humboldt Trinity Shasta Lassen Sacramento-Arden- Arcade-Roseville Tehama Plumas San Francisco- Oakland-Fremont Stockton Mendocino Glenn Butte Sierra Lake Nevada Colusa Yuba Placer Sutter Sonoma Yolo El Dorado Napa Sacramento Alpine Amador Solano Marin Calaveras Contra San Tuolumne Costa Joaquin Alameda San Francisco Stanislaus Mariposa Mono San Mateo Santa Clara Merced Madera California State: 15% Santa Cruz 0.8% - 5% 5.1% - 10% 10.1% - 15% Over 15% San Benito Monterey San Luis Obispo Metropolitan Statistical Area (MSA) All numbers are for the Asian Alone or In-Combination category. ± Miles Fresno Kings Santa Barbara C.Pech August 2012 Data Source: 2010 Decennial Census SF-1, Table QTP-5 Ventura Tulare Kern Los Angeles Orange Inyo Los Angeles-Long Beach- Santa Ana San Bernardino Riverside San Diego-Carlsbad- San Marcos San Diego Imperial Scale: 1:4,974,459 Projection: NAD 1983 California Teale Albers 2
5 Background This California profile is part of a set of demographic profiles developed to generate critical socioeconomic quantitative information and statistics on Asian Americans for state and regional asset building coalitions that are part of the Ford Foundation s Building Economic Security over a Lifetime Initiative. The profiles provide data at the state level and the major Metropolitan Statistical Areas with significant Asian American populations in: California, Illinois, Texas, Oklahoma, and the Southeast Region (Louisiana, Alabama, Florida, and Mississippi), from the Year American Community Survey (ACS) sample, 2000 and 2010 Decennial Census data sets (subject to the availability of data). 1 Moreover, a separate intensive case study report was produced on the East San Gabriel Valley, in Los Angeles County, a neighborhood that has a mix of large population concentrations of Asian Americans and Non-Hispanic Whites. The report examines the impact of the foreclosure crisis on Asian American asset building, in particular the gains and losses through homeownership. Similar to other racial groups, homeownership makes up a large share of assets, and any changes may indirectly help us understand overall declines in net worth for racial minorities. The East San Gabriel Valley case study analysis utilized data from Los Angeles County assessor s office (parcel data), American Community Survey (PUMS sample), DataQuick (purchases, defaults, and foreclosures), and Home Mortgage Disclosure Act (lending information). This report begins with a state level analysis comparing the total population by major racial and ethnic groups: African Americans, Asian Americans, Latinos, and Non-Hispanic Whites (subject to data availability). A comparative analysis with American Indians/Alaskan Natives at the state level was only conducted for the Oklahoma demographic profile. The profiles then include a Metropolitan Statistical Area level analysis comparing demographic trends for the total population, total Asian population, and by Asian ethnic subgroups (subject to data availability). 2 The report provides detailed data on the following characteristics: Population, Nativity, Language, Education, Economic Status (income, poverty, and other public and private income sources), and Housing Trends (homeownership, housing burden, and home property values). For more information on this demographic profile s methodology, definitions, and detailed data charts and tables, please see Technical Report at: Introduction The Asian American population is a diverse one, with many ethnic, cultural, language, and religious subgroups, each with its unique history and experience. This report provides a snapshot of demographic and socioeconomic trends in California. In particular, this profile looks at the challenges, issues, and opportunities facing Asian Americans as they relate to higher education, homeownership, and asset building. Data were analyzed for Asian subgroups in the following Metropolitan Statistical Areas (MSAs or metro areas): Fresno, Los Angeles, Sacramento, San Diego, San Francisco, and Stockton. In Fresno, subgroup data were only available for Hmong. 3 In Stockton, data were only available for Filipinos. In San Diego, data were available for Asian Indian, Chinese, Filipino, Japanese, Korean, and Vietnamese. In San Francisco, data were available for Asian Indian, Chinese, Filipino, Japanese, Korean, and Vietnamese. In Sacramento, data were available for Japanese, Asian Indian, Filipino, Hmong, Vietnamese, and Chinese. In Los Angeles, data were available for Asian Indian, Cambodian, Chinese, Taiwanese, Filipino, Japanese, Korean, Thai, and Vietnamese. 1 The ACS 3-Year estimate provides detailed Asian ethnic subgroup data if the subgroup has an estimated population of 20,000 or more. 2 For 2010 national demographic information, see the Asian American Center for Advancing Justice, A Community of Contrasts: Asian Americans in the United States 2011 at: For 2000 Census data with the most comprehensive look at the demographic and cultural changes sweeping the Asian American and Pacific Islander community, see the UCLA Asian American Studies Center, New Face of Asian Pacific America at: 3 If the Metropolitan Statistical Area has only one Asian ethnic subgroup, this subgroup was compared to the Asian American population as a whole. 3
6 Population The Asian American population in California was growing. The Asian subgroups that experienced the most population growth in the last decade were South Asians. From , the Asian American population in California grew by 34% approximately from 4.3 million to 5.7 million. Among the Asian ethnic subgroups, the Bangladeshi population had the most growth (157%), followed by Pakistanis (92%), and Sri Lankans (65%). In 2010, the three largest Asian subgroups were Filipinos, Chinese, and Vietnamese. 4 All of the six MSAs experienced Asian American population growth during the past decade. Bangladeshis and Pakistanis were the two Asian ethnic subgroups with the fastest growth rate in most areas. >>> San Francisco: the population size of Asian American had increased 30% from 896,000 to over 1.2 million from 2000 to The three subgroups with the largest percent population growth were Taiwanese (138%), Bangladeshis (134%), and Hmong (97%). In 2010, the three largest subgroups were Chinese, followed by Filipinos and Asian Indians. >>> Stockton: the population size of Asian American had increased 53% from 79,000 to over 121,000 from 2000 to The three subgroups with the largest percent population growth were Sri Lankans (392%), Pakistanis (156 %), and Asian Indians (137%). In 2010, the three largest subgroups were Filipinos, followed by Asian Indians and Cambodians. >>> San Diego: the population size of Asian American had increased 39% from 303,000 to over 422,000 from 2000 to Between 2000 and 2010, the Bangladeshi population experienced the largest growth (245%), followed by Pakistanis (134%), and Asian Indians (129%). The largest Asian subgroups were Filipinos, Chinese, and Vietnamese in >>> Sacramento: the population size of Asian American had increased 60% from 199,000 to over 320,000 from 2000 to The three subgroups with the largest percent population growth were Bangladeshis (578%), Taiwanese (175%), and Sri Lankans (132%). In 2010, the three largest subgroups were Filipinos, followed by Chinese and Asian Indians. >>> Los Angeles: the population size of Asian American had increased 26% from about 1.7 million to 2.2 million from 2000 to The three subgroups with the largest percent population growth were Bangladeshis (121%), Pakistanis (62%), and Sri Lankans (51%). In 2010, the three largest subgroups were Chinese, followed by Filipinos and Koreans. >>> Fresno: the population size of Asian American had increased 38% from 75,000 to over 103,000 from 2000 to The three subgroups with the largest percent population growth were Bangladeshis (338%), Pakistanis (129%), and Asian Indians (82%). In 2010, the three largest subgroups were Hmong, Asian Indians, and Filipinos. Nativity In California, the majority of Asians were foreign-born (with the exception in Fresno). Among subgroups, Asian Indians were more likely to be foreign-born and Japanese were less likely to be foreign-born. The majority of Asians in California were foreign-born (65%). The percentage was much higher than the total population (27%) and Latinos (40%). 4 Population data include 19 Asian ethnic subgroups (and Other Asian, specified and Other Asian, not specified). Other indicators have data available for a fewer number of subgroups. For ethnic groups with a small population in the base year, a small change in population absolute number can result in a large percentage change. All population size figures for the Chinese subgroup exclude Taiwanese. 4
7 >>> San Francisco: 60% of Asians were foreign-born compared to 29% for the total population. Asian Indians (68%) and Vietnamese (64%) had the highest proportion of foreign-born, while Japanese had the lowest (28%). >>> Stockton: 50% of Asians were foreign-born compared to 23% for the total foreign-born population. Forty-eight percent of Filipinos were foreign-born. >>> San Diego: 57% of Asians were foreign-born compared to 23% for the total population. Asian Indians (67%) had the highest proportion of foreign-born, while Japanese had the lowest at 37%. >>> Sacramento: 51% of Asians were foreign-born compared to 17% for the total population. Asian Indians (66%) had the highest proportion of foreign-born, while Japanese had the lowest at 16%. >>> Los Angeles: 64% of Asians were foreign-born compared to 34% for the total population. Taiwanese (74%) had the highest proportion of foreign-born, while Japanese had the lowest at 30%. >>> Fresno: 48% of Asians were foreign-born compared to 22% for the total population. Forty-four percent of Hmong were foreign-born. Language Compared to the total population, Asian Americans were more likely to have Limited English Proficiency (LEP); albeit their rate was slightly less than for Latinos. Foreign-born Asians had lower proportions of persons who reported that they did not speak English very well compared to the total foreign-born population. This may be because the total foreign-born population includes Latinos and Asians, two groups that have rapidly grown due to immigration and have high LEP rates. Native-born Asian Americans had higher proportions of those who did not speak English very well compared to the total native-born population. Among the subgroups, Vietnamese and Hmong had higher LEP rates. Japanese, Asian Indians, and Filipinos had the lower rates. In California, Asian Americans had Limited English Proficiency (LEP) at higher rate than the total population (37% versus 20%). The foreign-born Asian American population in California had lower proportions of persons who reported that they did not speak English very well (50%) when compared to the total foreign-born population (59%). However, native-born Asian Americans had higher proportions of those who did not speak English very well than the total native-born population (9% and 4% respectively). The LEP rates for Latinos were slightly higher (38%) than Asian Americans. A large majority (72%) for the foreign-born Latinos and 11% native-born Latinos reported that they did not speak English very well, the highest of all major racial and ethnic groups. >>> San Francisco: 34% of Asian Americans had LEP, which was higher than the total population (18%). Among the Asian subgroups, Vietnamese and Chinese (exclusive or inclusive of Taiwanese) had the highest rate (48% and 47% respectively) and Japanese had the lowest rate at 16% with LEP. >>> Stockton: 34% of Asian Americans had LEP, which was much higher than the rate of total population (19%). Twenty-two percent of Filipinos had LEP. >>> San Diego: 29% of Asian Americans had LEP, which was much higher than the rate of total population (16%). Vietnamese had the highest rate at 51% and Asian Indians had the lowest rate at 19%. >>> Sacramento: 30% of Asian Americans had LEP, almost three times higher than the total population (11%). Hmong had the highest rate at 50% and Japanese had the lowest rate at 11%. >>> Los Angeles: 39% of Asian Americans had LEP, which was much higher than the rate of total population (26%). Among the Asian subgroups Koreans had 5
8 the highest rate (56%), followed by Vietnamese (55%), and Taiwanese (50%). Japanese (22%), Asian Indians (22%), and Filipinos (21%) had the lowest rate. >>> Fresno: 35% of Asian Americans had LEP, which was much higher than the rate of total population (19%). Nearly half of Hmong population (49%) had LEP. Education Asian Americans were more likely to have at least a high school diploma compared to Non-Hispanic Whites. Among subgroups, Vietnamese and Hmong tended to have a higher proportion with less than a high school diploma. Japanese tended to have a lower proportion with less than a high school diploma. Statewide, Asian Americans over the age of 25 had a lower proportion of population (14%) with less than a high school diploma compared to the total population (20%) but a higher proportion compared to Non-Hispanic Whites (7%). >>> San Francisco: 16% of Asian Americans had less than a high school diploma as opposed to 13% for the total population, and 4% for Non-Hispanic Whites. Among the subgroups, Vietnamese had the highest (26%) proportion of population with less than a high school diploma, while Japanese had the lowest (4%). >>> Stockton: 24% of Asian Americans had less than a high school diploma. This number was similar to that of the total population (24%) but less than Non-Hispanic Whites (12%). Filipinos had a rate of 13%. >>> San Diego: 12% of Asian Americans had less than a high school diploma, which was lower than the total population (15%) but higher than Non-Hispanic Whites (5%). Vietnamese had the largest proportion (29%) with less than a high school diploma, and Asian Indians had the smallest at 4%. >>> Sacramento: the rate for all Asian Americans was 18%, which was higher than total population (13%) and Non-Hispanic Whites (7%). Hmong had the largest proportion of population (43%) that had less than a high school diploma; Filipinos and Japanese had the smallest proportion (7%). >>> Los Angeles: the rate for total Asian Americans was 13% which was less than the total population (23%) and greater than Non-Hispanic Whites (6%). Cambodians had the largest proportion (41%) that had less than a high school diploma. Taiwanese had the lowest at 4%. >>> Fresno: Asian Americans (28%) had a larger percentage of population that had less than a high school than the total population (27%) and Non-Hispanic Whites (9%). Almost half of Hmong (49%) had less than a high school diploma. Asian Americans were more likely to earn a Bachelor s degree compared to all other major racial and ethnic groups. Among subgroups, Filipinos tended to have a higher proportion with a Bachelor s degree. Vietnamese and Hmong tended to have lower proportions. In California, Asian Americans over the age of 25 had a larger proportion of population (32%) with Bachelor s degree, compared to the total population (19%) and Non-Hispanic Whites (24%). >>> San Francisco: the rate for all Asian Americans was higher (32%) compared to total population (27%) and Non-Hispanic Whites (31%). Japanese (40%) and Filipinos (39%) had the largest proportion of population with a Bachelor s degree; Vietnamese had the smallest at 23%. 6
9 >>> Stockton: Asian Americans had a larger proportion of population (21%) with a Bachelor s degree, compared to total population (12%) and Non-Hispanic Whites (14%). Filipinos had a rate of 28%. >>> San Diego: the rate for all Asian Americans was higher (30%) compared to total population (22%) and Non-Hispanic Whites (26%). Koreans had the largest proportion of population (40%) with a Bachelor s degree; Vietnamese had the smallest at 22%. >>> Sacramento: the rate for all Asian Americans was 26%, which was higher than total population (20%) and Non-Hispanic Whites (22%). Filipinos had the largest proportion of population (35%) with a Bachelor s degree; Hmong had the smallest at 10%. >>> Los Angeles: the rate for total Asian Americans was 34%, which was larger than total population (20%) and Non-Hispanic Whites (27%). Filipinos had the largest proportion (45%) with a Bachelor s degree. Cambodians had the lowest at 11%. >>> Fresno: Asian Americans (22%) also had a larger proportion with a Bachelor s degree than total population (13%) and Non-Hispanic Whites (19%). Hmong had a smaller proportion at 9%. Asian Americans were more likely to earn a graduate or professional degree compared to total population. Among subgroups, Asian Indians tended to have higher proportions with a graduate or professional degree. Filipinos and Hmong tended to have lower proportions. Statewide, the proportion of Asian Americans over the age of 25 with a graduate or professional degree (16%) was higher than the proportion for total population (11%) and Non-Hispanic Whites (15%). >>> San Francisco: the proportion of Asian Americans with a graduate or professional degree was similar to the proportion for the total population, with both at 17%. Non-Hispanic Whites had a higher proportion at 23%. Among Asian subgroups, both Asian Indians and Koreans had the highest proportion at 37% and 25% respectively. Eight percent of Filipinos had a graduate degree, the lowest of the subgroups. >>> Stockton: Asian and Non-Hispanic Whites had the highest proportion with a graduate degree with both at 7%. This number was slightly higher when compared to overall total population (5%). Filipinos had a rate of 4%. >>> San Diego: the proportion of Asian Americans with a graduate degree (15%) was higher than the overall total population (13%), but slightly lower when compared to Non-Hispanic Whites (16%). Among the Asian subgroups, Asian Indians and Chinese (exclusive or inclusive of Taiwanese) had the highest proportions at 50% and 33% respectively. Six percent of Filipinos had a graduate degree, the lowest of the subgroups. >>> Sacramento: the proportion of Asian Americans with a graduate degree was slightly higher than the proportion for both the overall population (10%) and Non-Hispanic Whites (11%). Among the subgroups, Asian Indians had the highest proportion (25%) with a graduate degree and Hmong had the lowest (4%). >>> Los Angeles: 14% of Asian American had a graduate degree compared to 10% for the overall total population. At 17%, Non-Hispanic Whites had a higher proportion with a graduate degree. Roughly a third of Asian Indians (35%) and Taiwanese (33%) had graduate degrees, the highest of all of the Asian American subgroups. Vietnamese and Cambodians had proportions lower than that of the total population (7% and 3% respectively), the lowest for the subgroups. 7
10 >>> Fresno: the proportion of Asian Americans with a graduate degree (9%) was higher than the overall total population (6%), but slightly lower when compared to Non-Hispanic Whites (10%). At 3%, Hmong had a lower proportion with a graduate degree. Economic Status Asian Americans had higher median household incomes than total households. Among subgroups, Asian Indians tended to have higher median incomes. Vietnamese and Hmong tended to have lower median incomes. Per capita, Asian Americans generally earned less than Non-Hispanic Whites. This may be due to Asian Americans larger average household sizes. 5 Asian Indians tended to earn more per capita, and Vietnamese, Hmong, and Cambodian tended to earn less per capita. In California, Asian American households had a higher median income ($74,000) than total households ($60,000) and Non-Hispanic Whites ($70,000). Statewide, Asian Americans and Non-Hispanic Whites had a lower percentage of Very Low-Income households (21% both) compared to total households (25%). Per capita income, Asian Americans ($31,000) earned more than the total population ($29,000), but were not earning as much as Non-Hispanic Whites ($41,000). This discrepancy may be due to the larger average household sizes of Asian Americans (3.2) compared to total households (2.9) and Non-Hispanic Whites (2.4). >>> San Francisco: the median household income for Asian Americans was $82,730, which was higher than total households ($75,000) but lower than Non-Hispanic Whites ($88,000). Asian Indians had the highest median household income at $108,000 and Vietnamese had the lowest at $60,000. The per capita income for Asian Americans ($33,283) was lower than the total population ($40,000) and Non-Hispanic Whites ($55,000). Asian Indians had the highest at $44,000, while Vietnamese had the lowest at $25,000. The average household size for Asian Americans was 3.1, which was larger than total households (2.7) and Non-Hispanic Whites (2.3). >>> Stockton: the median household income for Asian Americans was $61,000, which was higher than total households at $54,000 but lower than Non-Hispanic Whites at $63,000. Filipinos had a much higher median household income at $78,000. In terms of per capita income, Asian Americans had $21,000, which was lower than total population ($22,000) and Non-Hispanic Whites ($32,000). Filipinos had roughly the same with total population at $23,000. Asian Americans had larger an average household size (3.7) compared to total households (3.1) and Non-Hispanic Whites (2.6). >>> San Diego: Asian Americans had a higher median household income ($75,000) than total households ($63,000) and Non-Hispanic Whites ($71,000). Asian Indians had the highest at $101,000 and Vietnamese had the lowest at $56,000. Asian Americans had a lower per capita income ($28,000) than total population ($30,000) and Non-Hispanic Whites ($40,000). Asian Indians also had the highest at $44,000, while Vietnamese had the lowest at $22,000. The average household size for Asian Americans was 3.2, which was larger than total households (2.8) and Non-Hispanic Whites (2.4). >>> Sacramento: Asian Americans ($66,000) had a higher median household income compared to total households ($60,000) and Non-Hispanic Whites ($65,000). Asian Indians had the highest at $79,000 and Hmong had the lowest at $48,000. Asian Americans ($24,000) had a lower per capita income compared to total population ($29,000) and Non-Hispanic Whites ($35,000). 5 Household size plays a significant factor in estimating wealth because household incomes are calculated by the income generated by all members of a household. If a household has multiple wage-earners contributing to the overall household income, the likelihood is greater for that household income to be larger. Analytically, per capita income is a more realistic measure of wealth than household income. 8
11 Japanese had the highest at $32,000, while Hmong had the lowest at $11,000. Asian Americans had a larger average household size (3.2) than total households (2.7) Non-Hispanic Whites (2.5). >>> Los Angeles: the median household income for Asian Americans was $68,000, which was higher than total households ($59,000) and lower than Non-Hispanic Whites ($75,000). Taiwanese had the highest at $89,000, while Cambodians had the lowest at $44,000. Asian Americans ($29,000) had a slightly higher per capita income compared to total population ($29,000), which was lower than Non-Hispanic Whites ($47,000). Asian Indians had the highest per capita income at $40,000, while Cambodians had the lowest at $16, 000. Asian Americans (3.1) had a larger average household size compared to total households (3.0) and Non-Hispanic Whites (2.4). >>> Fresno: Asian Americans had a median household income at $52,000, which was higher than total households ($46,000) but lower than Non-Hispanic Whites ($61,000). Hmong had a much lower median household income at $33,000. Asian Americans had a lower per capita income at $18,000 compared to total population ($20,000) and Non-Hispanic Whites ($32,000). Hmong had a much lower per capita income at $8,000. Asian Americans had a much larger average household size (3.9) compared to total households (3.2) and Non-Hispanic Whites (2.5). The poverty rates for Asian Americans were lower than the rates for Non-Hispanic Whites. Among the subgroups, Hmong tended to have higher poverty rates. Asian Indians and Filipinos generally had lower poverty rates. Asian Americans had similar proportions of the population that received cash public assistance as Non-Hispanic Whites and the total households. Regarding subgroups, Vietnamese and Hmong were more likely to receive cash public assistance. Chinese and Japanese were less likely to receive cash public assistance. In California, the poverty rate for Asian Americans (10%) was lower than the total population (13%) but larger than Non-Hispanic Whites (8%). The proportion of households who received cash public assistance was similar for Asian Americans and Non-Hispanic Whites (2%), which was slightly lower than total households (3%). >>> San Francisco: the poverty rate for Asian Americans (8%) was higher than Non-Hispanic Whites (6%), but lower than the total population (10%). Vietnamese had the highest poverty rates at 15%. Asian Indians and Filipinos had the lowest poverty rates (4%). The proportion of households who received cash public assistance was similar for Asian Americans and total households (2%), which was slightly higher than that of Non-Hispanic Whites (1%). Vietnamese had a slightly larger proportion at 4%, while other subgroups had rates of about 2%. >>> Stockton: the poverty rate for total population and Asian Americans was similar around 16%, which was much higher than Non-Hispanic Whites (9%). Filipinos had a lower poverty rate at 8%. Asian Americans had a larger proportion of households with cash public assistance (8%) compared to Non-Hispanic Whites (3%) and total households (5%). Filipinos had a rate of 5%. >>> San Diego: Asian Americans (9%) and Non-Hispanic Whites (8%) had roughly the same poverty rate, which was less than total population (12%). Koreans had the highest poverty rates at 17%. Asian Indians had the lowest poverty rates (4%). The proportion of households who received cash public assistance was similar for Asian Americans, total households, and Non-Hispanic Whites (2%). Vietnamese had a slightly larger proportion at 3%, while Chinese (exclusive or inclusive of Taiwanese) had the lowest at 1%. 9
12 >>> Sacramento: Asian Americans (15%) had higher poverty rate than total population (12%) and Non-Hispanic Whites (8%). The poverty rate for Asian ethnic subgroups spread from 28% for Hmong to 7% for Filipinos. Asian Americans had a slightly larger proportion of households with cash public assistance (5%) compared to total households (4%) and Non-Hispanic Whites (3%). The proportion of households who received cash public assistance ranged from 17% for Hmong to 2% for Japanese and Chinese (including Taiwanese). >>> Los Angeles: the poverty rate for Asian Americans was 10%, which was lower than total population (14%) but higher than Non-Hispanic Whites (7%). Cambodians had the highest poverty rates at 24%, while Filipinos and Asian Indians had the lowest (6% each). The proportion of households who received cash public assistance was similar for Asian Americans and Non-Hispanic Whites (2%), which was slightly lower than total households (3%). Among Asian ethnic subgroups, it ranged from 12% for Cambodians to 1% for Japanese. >>> Fresno: Asian Americans had roughly the same poverty rate with total population (22%), which was much larger than Non-Hispanic Whites (10%). Hmong had a higher poverty rate at 38%. Asian Americans had a larger proportion of households who received cash public assistance (10%) compared to total households (7%) and Non-Hispanic Whites (3%). The rate for Hmong was higher at 23%. Fewer Asian Americans households had Social Security and retirement income compared to the total population and Non-Hispanic Whites. Among subgroups, Japanese were more likely to receive Social Security and retirement income. Asian Indians and Hmong were less likely to receive Social Security and retirement income. In California, Asian American households (19%) had a lower proportion with Social Security income compared to total households (24%) and Non-Hispanic Whites (29%). Asian American households (9%) also had a lower proportion of population with retirement income compared to total households (15%) and Non-Hispanic Whites (20%). >>> San Francisco: Asian American households (20%) had a lower proportion with Social Security income compared to total households (23%) and Non-Hispanic Whites (26%). The proportion of households with Social Security income ranged from 24% for Japanese to 8% for Asian Indians. Asian American households (10%) also had a lower proportion of population with retirement income compared to total households (16%) and Non-Hispanic Whites (19%). The proportion of households with retirement income ranged from 17% for Japanese to 4% for Asian Indians. >>> Stockton: Asian American households (24%) had a lower proportion with Social Security income compared to total households (25%) and Non-Hispanic Whites (30%). The proportion of households with Social Security income for Filipinos was 23%. Asian American households (12%) also had a lower proportion of population with retirement income compared to total households (17%) and Non-Hispanic Whites (22%). The proportion of households with retirement income for Filipinos was 14%. >>> San Diego: Asian American households (19%) had a lower proportion with Social Security income compared to total households (23%) and Non-Hispanic Whites (28%). The proportion of households with Social Security income ranged from 26% for Japanese to 9% for Asian Indians. Asian American households (15%) also had a lower proportion of population 10
13 with retirement income compared to total households (17%) and Non-Hispanic Whites (21%). The proportion of households with retirement income ranged from 23% for Filipinos to 5% for Asian Indians. >>> Sacramento: Asian American households (18%) had a lower proportion with Social Security income compared to total households (24%) and Non-Hispanic Whites (28%). The proportion of households with Social Security income ranged from 33% for Japanese to 11% for Hmong and Vietnamese. Asian American households (11%) had a lower proportion with Social Security income compared to total households (20%) and Non-Hispanic Whites (23%). The proportion of households with retirement income ranged from 24% for Japanese to 3% for Hmong. >>> Los Angeles: Asian American households (19%) had a lower proportion with Social Security income compared to total households (22%) and Non-Hispanic Whites (27%). The proportion of households with Social Security income ranged from 29% for Japanese to 12% for Asian Indians. Asian American households (8%) also had a lower proportion of population with retirement income compared to total households (12%) and Non-Hispanic Whites (16%). The proportion of households with retirement income ranged from 17% for Japanese to 3% for Koreans. >>> Fresno: Asian American households (20%) had a lower proportion with Social Security income compared to total households (24%) and Non-Hispanic Whites (31%). The proportion of households with Social Security income for Hmong was 11%. Asian American households (9%) also had a lower proportion of population with retirement income compared to total households (15%) and Non-Hispanic Whites (20%). The proportion of households with retirement income for Hmong was even lower at 4%. Housing Trends Asian Americans had similar homeownership rates with the total population, which was lower than Non-Hispanic Whites. Compared to Non-Hispanic Whites, Asian Americans tended to have lower median home values. Asian American households had higher proportions of housing costs burden compared to other major racial and ethnic groups. 6 Among subgroups, Filipinos were more likely to be homeowners and Hmong were less likely. Asian Indians were more likely to have higher median home values and Hmong were more likely to have lower median home values. Koreans and Hmong had larger proportions of burdened households and Japanese had smaller proportions of burdened households. In California, Asian Americans (58%) had roughly the same homeownership rate as the total households, which was lower than that of Non-Hispanic Whites (65%). Asian Americans had higher median home values ($556,000) compared to total households ($461,000) and Non-Hispanic Whites ($494,000). Over half of all California homeowners (53%) suffered from heavy housing burden. Asian Americans had a slightly higher proportion of burdened households (55%). Among all racial subgroups, only Non-Hispanic Whites had a lower proportion (48%) than the statewide average. >>> San Francisco: the homeownership rate for Asian Americans (58%) was higher than the total households (56%) but less than Non-Hispanic Whites (62%). Chinese (exclusive or inclusive of Taiwanese) and Filipinos had the highest at 61%, while Koreans had the lowest at 47%. The median home value for Asian Americans was $655,000, which was lower than total 6 Homeowners paying 30% or more of household income on selected monthly housing costs are considered cost burdened. Selected monthly owner costs are the sum of debt payments (e.g. mortgage or home equity loans), real estate taxes, insurance, utility, fuel, and condominium fees. 11
14 households ($656,000) and Non-Hispanic Whites ($714,000). Koreans had the highest median home value ($744,000), while Filipinos had the lowest at $601,000. Asian American homeowners (54%) had a larger proportion of housing burdened households than total homeowners (52%) and Non-Hispanic Whites (47%). Korean homeowners had the highest proportion (66%) of burdened households, while Japanese had the lowest at 42%. >>> Stockton: the homeownership rate for Asian Americans (63%) was higher than the total households (61%) but less than Non-Hispanic Whites (70%). Filipinos had a rate of 69%. The median home value for Asian Americans was $330,000, which was higher than total households ($315,000) and Non-Hispanic Whites ($327,000). Filipinos had higher at $341,000. Asian American homeowners (64%) had a larger proportion of housing burdened households than total homeowners (55%) and Non-Hispanic Whites (45%). Filipinos had a rate at 63%. >>> San Diego: the homeownership rate for Asian Americans (59%) was higher than the total households (56%) but less than Non-Hispanic Whites (63%). Filipinos had the highest at 63%, while Asian Indians had the lowest at 50%. The median home value for Asian Americans was $484,000, which was roughly the same with total households ($485,000) but lower than Non-Hispanic Whites ($522,000). Asian Indians had the highest median home value ($591,000), while Japanese Americans had the lowest at $462,000. Asian American homeowners (55%) had roughly the same proportion of housing burdened households as total homeowners (54%), which was a little larger than Non-Hispanic Whites (50%). Koreans had the highest proportion (63%) among Asian ethnic subgroups, while Asian Indians had the lowest at 41%. >>> Sacramento: the homeownership rate for Asian Americans (62%) was roughly the same with total households but less than Non-Hispanic Whites (68%). Japanese had the highest at 70%, while Hmong had the lowest at 35%. The median home value for Asian Americans was $360,000, which was roughly the same with total households ($356,000.) but lower than Non-Hispanic Whites ($367,000). Asian Indians had the highest median home value ($389,000), while Hmong had the lowest at $268,000. Asian American homeowners (54%) had a larger proportion of housing burdened households compared to total homeowners (50%) and Non-Hispanic Whites (46%). Hmong had the highest proportion (64%), while Japanese Americans had the lowest at 43%. >>> Los Angeles: the homeownership rate for Asian Americans (53%) was roughly the same with total households but less than Non-Hispanic Whites (61%). Taiwanese had the highest at 69%, while Cambodians had the lowest at 32%. The median home value for Asian Americans was $568,000, which was higher than total households ($547,000) but lower than Non-Hispanic Whites ($629,000). Taiwanese Americans had the highest median home value ($690,000), while Cambodians had the lowest at $456,000. Asian American and total homeowners (55%) had a larger proportion of housing burdened households compared to Non-Hispanic Whites (49%). Korean Americans had the highest proportion (64%) of burdened households, while Japanese Americans had the lowest at 44%. >>> Fresno: the homeownership rate for Asian Americans (55%) was roughly the same with total households but less than Non-Hispanic Whites (67%). Hmong had a lower rate at 32%. The median home value for Asian Americans was $288,000, which was higher than total households ($261,000) and but 12
15 lower than Non-Hispanic Whites ($289,000). Hmong had a lower median home value at $192,000. Asian American homeowners (55%) had a larger proportion of housing burdened households compared to total homeowners (47%) and Non-Hispanic Whites (39%). Hmong had a larger percentage of burdened households at 63%. Conclusion As pensions decline, health and educational costs rise, home values and savings accounts shrink, and benefits under Social Security continue to be severely threatened and limited, asset-building strategies are needed now more than ever to close the racial wealth gap. In the aftermath of the Great Recession and foreclosure crisis, the goal of this report was to provide critical socioeconomic quantitative information and statistics on Asian Americans that would be useful for the state and regional asset-building coalitions in: 1) Developing their policy agenda, 2) Assisting with outreach by identifying where Asian American populations are concentrated residentially and geographically, which can perhaps lead to the strengthening of coalition efforts, and 3) Understanding cultural and linguistic barriers unique to Asian Americans, especially the Asian ethnic subgroups that are most in need. The quantitative data is meant to be used in relation with other sources of knowledge (qualitative, historical, voices from community leaders etc.) in order to offer fuller and more nuanced explanations. It is vital that we use multiple frameworks (research, organizing, advocacy, etc.) as we think about how to improve access and knowledge of asset-building programs and practices for underserved communities of color and end the widening racial wealth divide. Much of the literature on poverty indicates that Southeast Asians (primarily Vietnamese, Lao, Hmong, and Cambodian immigrants) are amongst those that have the highest disparities in higher education, housing burden, and wealth in the United States. Under the Indochina Migration and Refugee Assistance Act of 1975, the majority of Southeast Asian refugees who fled their homelands in the aftermath of the U.S. invasion of Vietnam and Cambodia were placed in federal welfare programs as a temporary and adaptive measure. They are now entering a fourth consecutive decade of welfare dependency, contrary to government officials predictions of a seamless transition into American labor markets (Tang, 2000). Due to data limitations, this report only provides Asian ethnic subgroup data for Fresno, Los Angeles, Sacramento, San Diego, San Francisco, and Stockton Metropolitan Statistical Areas. In Fresno, subgroup data were only available for Hmong. In Stockton, data were only available for Filipinos. In San Diego, data were available for Asian Indian, Chinese, Filipino, Japanese, Korean, and Vietnamese. In San Francisco, data were available for Asian Indian, Chinese, Filipino, Japanese, Korean, and Vietnamese. In Sacramento, data were available for Japanese, Asian Indian, Filipino, Hmong, Vietnamese, and Chinese. In Los Angeles, data were available for Asian Indian, Cambodian, Chinese, Taiwanese, Filipino, Japanese, Korean, Thai, and Vietnamese. Thus, we are able to shed light on a number of Southeast Asian subgroups and other disadvantaged Asian American subgroups. Similar to American Indians, Blacks or African Americans, and Latinos, the majority of Asian Americans (especially the foreign-born) carry their net worth in their home equity, such that the loss of this asset is particularly devastating to their financial security. A study by the UCLA Asian American Studies Center revealed how Asian Americans made considerable economic progress with whites through the rapid appreciation of home values from 2000 to 2005 (Patraporn, Ong, and Houston, 2009). The average value of homes for Asian Americans increased by 73 percent, compared to only 60 percent for whites nationwide (Patraporn, Ong, and Houston, 2009). However, many of these gains were lost during the housing market meltdown. A Pew report indicated the net worth of Asian Americans is estimated to have fallen by 54 percent in the four year period from 2005 to 2009 (Kochhar, Fry, and Taylor, 2011). This massive decimation of wealth is largely due to Asian Americans residing in Arizona, California, Florida, and Nevada four of the five states with the steepest declines in home prices in 2005 (Michigan is fifth). As communities of color have less wealth and home equity, it will be more difficult to afford a college education, which leads to better jobs that are needed to start saving and building wealth. 13
16 Currently, the majority of research articles and policy briefs on asset-building and wealth report aggregate socioeconomic data on Asian Americans, which often claim Asian Americans are doing well because of high educational attainment rates or high incomes. However, the lumping of all Asian American ethnic groups under the aggregate Asian category masks a high degree of variation in social and economic status across these subgroups. Thus, it is important to examine demographic trends below the surface, in order to serve real disadvantaged groups that are being completely neglected by mainstream assetbuilding and financial institutions. Although, Asian ethnic subgroup data was only provided for the Fresno, Los Angeles, Sacramento, San Diego, San Francisco, and Stockton metro areas, the report highlights the following key findings for Asian Americans: Population Growth: South Asians were the fastest growing in California. The three largest groups in each metro area were: 1) Fresno Bangladeshis (338%), Pakistanis (129%), and Asian Indians (82%); 2) Los Angeles Bangladeshis (121%), Pakistanis (62%), and Sri Lankans (51%); 3) Sacramento Bangladeshis (578%), Taiwanese (175%), and Sri Lankans (132%); 4) San Diego Bangladeshis (245%), Pakistanis (134%), and Asian Indians (129%); 5) San Francisco Taiwanese (138%), Bangladeshis (134%), and Hmong (97%), and 6) Stockton Sri Lankans (392%), Pakistanis (156%), and Asian Indians (137%). Citizenship & Language: The majority of Asians in California were foreign-born (65%). The percentage was much higher than the total population (27%) and Latinos (40%). Among subgroups, Asian Indians were more likely to be foreign-born and Japanese were less likely to be foreign-born. Asians also had higher rates of Limited English Proficiency (LEP) than the total population. In San Francisco, Vietnamese (48%) and Chinese (47%) had the highest rates of persons, who did not speak English very well compared with the 18% of the total population. In Stockton, Filipinos had a LEP rate of 22% compared with 19% of the total population. In San Diego, Vietnamese (51%) had the highest rates of LEP compared with 16% of the total population. Hmong in Sacramento had the highest LEP rate at 50% versus 11% of the total population. In Los Angeles, Koreans had the highest rate (56%), followed by Vietnamese (55%), and Taiwanese (50%). In Fresno, nearly half of the Hmong population (49%) was Limited English Proficient. Education: Asian Americans were more likely to have at least a high school diploma compared to the total population and Non-Hispanic Whites. Among subgroups, Vietnamese and Hmong tended to have a higher proportion with less than a high school diploma. Filipinos and Koreans largely held a Bachelor s degree. Asian Indians and Chinese tended to have a higher proportion of those with a Graduate or professional degree. Income: Household size plays a significant factor in estimating wealth because household incomes are calculated by the income generated by all members of a household. If a household has multiple wageearners contributing to the overall household income, the likelihood is greater for that household income to be larger. Analytically, per capita income is a more realistic measure of wealth than household income. Asian American households tended to have higher median household incomes than other major racial and ethnic groups. Asian Indians had the highest median incomes. Vietnamese and Hmong had the lowest median income. In contrast, Asian Americans generally earned less per capita income than Non-Hispanic Whites. Vietnamese, Hmong, and Filipinos earned the lowest per capita income. Poverty: The poverty rate for Asian Americans was generally lower than the total population, but higher than Non-Hispanic Whites. Among the subgroups, Hmong, Vietnamese and Cambodians had higher poverty rates, while Asian Indians and Filipinos had lower rates. Asian Americans had similar proportions of the population that received cash public assistance as Non-Hispanic Whites and the total households. Regarding subgroups, Vietnamese and Hmong were more likely to receive cash public assistance. Chinese and Japanese were less likely to receive cash public assistance. Social Security and Retirement Income: Fewer Asian Americans households had Social Security and retirement income compared to the total population and Non-Hispanic Whites. Among subgroups, Japanese were more likely to receive Social Security and retirement income. Asian Indians and Hmong
17 were less likely to receive Social Security and retirement income. This underutilization of Social Security and retirement programs may be due to language barriers and foreign-born status. As immigrants, there is a greater likelihood that they are unfamiliar, unaware or ineligible for Social Security and retirement programs because of cultural barriers. Many times, even if an Asian immigrant is deemed eligible for a benefit or service, being able to navigate the system is a huge hurdle for many in order to actually obtain the benefit or service. Housing: Asian Americans had lower homeownership rates and home values compared to Non-Hispanic Whites. Taiwanese, Japanese, and Filipinos had the highest homeownership rate, and Hmong, Cambodians, and Koreans had the lowest. Asian Indians were more likely to have higher median home values and Hmong were more likely to have lower median home values. In addition, the majority of Asian Americans had higher housing costs burden than Non-Hispanic Whites and the total population. Koreans and Hmong had larger proportions of burdened households and Japanese had smaller proportions of burdened households. This may be due to the high self-employment rates of Asian Americans, which prevent them from accessing conventional mortgage lending products. As a result, they must often find non-tradi tional or alternative mortgage credit products with higher loan rates or amounts (Asian Real Estate Association of America, 2012). In conclusion, in order to be effective in strengthening asset-building opportunities for communities of color, it is critical to provide cultural and linguistically appropriate materials, services, and education, in particular to underserved immigrant populations. Moreover, future research must collect data on smaller Asian ethnic group populations, in which no data is available because of data suppression practices associated with confidentiality requirements when the sample sizes are too small. A few foundations, such as the Ford Foundation, have responded to addressing these needs, but much more can be done in terms of technical assistance, outreach, advocacy, data collection, capturing voices and stories at the local level, in order to offer fuller and more nuanced explanations and close the racial wealth gap. The Technical Report with this demographic profile s methodology, definitions, and detailed data charts and tables is available to download at: 15
The California Civic Engagement Project Issue Brief
 Increasing Proportions of Vote-by-Mail Ballots In Millions 14 12 10 8 6 4 2 0 1. VBM Use Rates by Sub-Group Youth and Older Voters: Disparities in VBM Use Only voters age 55 and older use VBM at a rate
HMO PLANS Anthem Select $ $1, $1,541.23
 & one Dep., & 2 Anthem Select $592.78 $1,185.56 $1,541.23 Reimbursement NOT AVAILABLE NOT AVAILABLE $592.78 $1,185.56 $1,237.00 Differential (Amount Not Reimbursed) $0.00 $0.00 $304.23 Anthem Traditional
The California Civic Engagement Project Issue Brief
 Increasing Proportions of Vote-by-Mail Ballots In Millions 14 12 10 8 6 4 2 0 1. VBM Use Rates by Sub-Group Youth and Older Voters: Disparities in VBM Use Only voters age 55 and older use VBM at a rate
FIELD RESEARCH CORPORATION
 FIELD RESEARCH CORPORATION FOUNDED IN 15 BY MERVIN FIELD 601 California Street San Francisco, California 8 32563 Tabulations From a Survey of California Registered Voters About the Job Performance of the
1: HOW DID YOUTH VOTER TURNOUT DIFFER FROM THE REST OF THE 2012 ELECTORATE?
 March 2013 The Califor nia Civic Enga gement Project CALIFORNIA'S 2012 YOUTH VOTER TURNOUT: DISPARATE GROWTH AND REMAINING CHALLENGES Boosted by online registration, the youth electorate (ages 18-24) in
RURAL CAUCUS BY-LAWS California Democratic Party State Central Committee
 RURAL CAUCUS BY-LAWS California Democratic Party State Central Committee (Last amended 04/13/13 at Rural Caucus during CDP State Convention in Sacramento.) ARTICLE I NAME AND PURPOSE SECTION 1: NAME The
25% Percent of General Voters 20% 15% 10%
 Policy Brief Issue 6 May 2013 Page 1 The California Civic Engagement Project Policy Brief Issue 6 May 2013 In This Brief: In 2012, Latinos increased their share of California voters, but their proportion
Legislative Policy Study. Can California County Jails Absorb Low-Level State Prisoners?
 CENTER ON JUVENILE AND CRIMINAL JUSTICE MARCH 2011 www.cjcj.org Legislative Policy Study Can California County Jails Absorb Low-Level State Prisoners? by Mike Males, PhD Senior Research Fellow, Center
Mr. John Mott-Smith Chief, Elections Division Secretary of State th Street, Sixth Floor Sacramento, CA Dear Mr.
 April 16, 2004 Mr. John Mott-Smith Chief, Elections Division Secretary of State 1500 11 th Street, Sixth Floor Sacramento, CA 95814 Subject: State Certification and Federal Qualification of County Voting
Three Strikes Analysis: Urban vs. Rur al Counties
 Three Strikes Analysis: Urban vs. Rur al Counties Jessica Jin 16 Jennifer Walsh, PhD, Project Supervisor May 3, 216 85 Columbia Avenue Kravis Center 436 Claremont, CA 91711-642 P: (99) 621-8159 E: roseinstitute@cmc.edu
JUSTICE BY GEOGRAPHY: DO POLITICS INFLUENCE THE PROSECUTION OF YOUTH AS ADULTS?
 JUSTICE BY GEOGRAPHY: DO POLITICS INFLUENCE THE PROSECUTION OF YOUTH AS ADULTS? Mike Males, Ph.D., Senior Research Fellow Center on Juvenile and Criminal Justice June 2016 Research Report Introduction
FIELD RESEARCH CORPORATION
 FIELD RESEARCH CORPORATION FOUNDED IN 1945 BY MERVIN FIELD 61 California Street San Francisco, California 9418 415-392-5763 Tabulations From a Field Poll Survey of Californians Likely to Vote in the June
State 4-H Council Bylaws Adopted 10/23/2010 R = Required O = Optional
 . Article 1 Membership State 4-H Council Bylaws Adopted 10/23/2010 = equired O = Optional Section 1 Categories Membership shall be active, ex-officio and honorary, and open to all persons without regard
County-by- County Data
 April 2017 State and Local Tax Contributions of Undocumented Californians -by- Data Public debates in California over immigrants, specifically around undocumented immigrants, often suffer from insufficient
VIETNAM VETERANS OF AMERICA, INC. CALIFORNIA STATE COUNCIL CONSTITUTION
 VIETNAM VETERANS OF AMERICA, INC. CALIFORNIA STATE COUNCIL CONSTITUTION Adopted October 12, 1988 Amended September 27, 1989 Amended January 27, 1990 Amended January 24, 1990 Amended June 28, 1992 Amended
1. Summary of the FY coordinated claim for Sonoma County Transit Services dated April, 28, 2009 marked Exhibit A and attached hereto;
 Resolution No. Administration Building Santa Rosa, CA June 9, 2009 CONCURRENT RESOLUTION OF THE BOARD OF SUPERVISORS OF SONOMA COUNTY, AGRICULTURAL PRESERVATION AND OPEN SPACE DISTRICT, AND SONOMA COUNTY
VIETNAM VETERANS OF AMERICA, INC. CALIFORNIA STATE COUNCIL CONSTITUTION
 VIETNAM VETERANS OF AMERICA, INC. CALIFORNIA STATE COUNCIL CONSTITUTION Adopted October 12, 1988 Amended September 27, 1989 Amended January 27, 1990 Amended January 24, 1990 Amended June 28, 1992 Amended
CALIFORNIA S 58 CRIME RATES: REALIGNMENT AND CRIME IN 2012
 CALIFORNIA S 58 CRIME RATES: REALIGNMENT AND CRIME IN 2012 Mike Males, Ph.D., Senior Research Fellow Brian Goldstein, Policy Analyst Center on Juvenile and Criminal Justice JANUARY 2014 Research Report
County Structure & Powers
 County Structure & Powers There is a fundamental distinction between a county and a city. Counties lack broad powers of self-government that California cities have (e.g., cities have broad revenue generating
Constitution of the California State Division International Association for Identification as amended through May 2, 2018 Las Vegas, Nevada
 Constitution of the California State Division International Association for Identification as amended through May 2, 2018 Las Vegas, Nevada ARTICLE I NAME AND GOALS OF THE ASSOCIATION SECTION 1.01 NAME
-- DEPARTMENT OF HEALTH SERVICES NEW ALL COUNTY LETTERS
 CCWRO Weekly New Welfare News - #2002-10 March 13, 2002 HEADLINES --IN BRIEF -- DSS NEWS -- DEPARTMENT OF HEALTH SERVICES NEW ALL COUNTY LETTERS -- TANF UPDATE -- CWD VICTIMS OF THE WEEK --STATISTICS OF
PART I Introduction to Civil Litigation for the Paralegal
 PART I Introduction to Civil Litigation for the Paralegal CHAPTER 1 Litigation and the Paralegal KEY POINTS Civil Litigation in California State Courts is regulated by: California Code of Civil Procedure
Califor nia Migration: A Comparative Analysis CALIFORNIA. A Comparative Analysis NEXT 10
 Califor nia Migration: A Comparative Analysis CALIFORNIA M I G R AT I O N A Comparative Analysis $ NEXT 1 1 PRODUCED BY Next 1 F. Noel Perry Colleen Kredell Marcia E. Perry Stephanie Leonard PREPARED BY
California Counts. California s Newest Immigrants. Summary. Public Policy Institute of California POPULATION TRENDS AND PROFILES
 POPULATION TRENDS AND PROFILES Hans P. Johnson, editor Volume 5 Number 2 November 2003 California s Newest Immigrants By Laura E. Hill and Joseph M. Hayes Immigration and immigrant adaptation are an integral
Impact of Realignment on County Jail Populations
 Technical Appendix Impact of Realignment on County Jail Populations Magnus Lofstrom and Steven Raphael with research support from Brandon Martin Supported with funding from the Smith Richardson Foundation
SPACE ABOVE THIS LINE FOR RECORDER S USE DEED OF TRUST WITH ASSIGNMENT OF RENTS
 RECORDING REQUESTED BY: AND WHEN RECORDED MAIL TO: ORDER NO.: Parcel No.: SPACE ABOVE THIS LINE FOR RECORDER S USE DEED OF TRUST WITH ASSIGNMENT OF RENTS This DEED OF TRUST, made, between whose address
Rules Committee Report Anaheim, California Saturday, October 21, 2017
 Rules Committee Report Anaheim, California Saturday, October 21, 2017 The Rules Committee met on Saturday, October 21, 2017 in the Grand G-H Room at the Anaheim Marriott to consider proposed bylaw changes
TABLE OF CONTENTS RECOMMENDATIONS... 6 CONCLUSION... 7
 TABLE OF CONTENTS INTRODUCTION... 1 CURRENT LAW... 2 2014 REPORT SUMMARY... 2 2017 RESEARCH METHODOLOGY... 3 COMPLIANCE FINDINGS... 3 COMMON POLICY DEFICIENCIES... 4 FAILURE TO MANDATE NOTIFICATION OF
REGIONS SECTION 15 ACSA POLICIES & PROCEDURES
 2018 REGIONS SECTION 15 POLICIES & PROCEDURES Policies: 15.1 Region Governing Boards Each region governing board shall include at least: president, vice president for legislative action, treasurer and
California Public Defender Websites
 California Websites This directory of California websites and contact information is a companion piece to New Beginnings: A Congregational Guide to Restorative Justice through Expungement. The version
2000 Decennial Census (SF-1), Table: P001, PCT005 and PCT007 Race/Ethnicity
, Table: P001, PCT005 and PCT007 Race/Ethnicity") Technical Report for the State and Regional Profiles on the American Population and Asset-building Trends This Technical Report is a supplement to the state and regional narrative reports prepared for
Technical Report for the State and Regional Profiles on the American Population and Asset-building Trends This Technical Report is a supplement to the state and regional narrative reports prepared for
USA WEIGHTLIFTING, INCORPORATED PACIFIC WEIGHTLIFTING ASSOCIATION
 USA WEIGHTLIFTING, INCORPORATED PACIFIC WEIGHTLIFTING ASSOCIATION CONSTITUTION OF THE PACIFIC WEIGHTLIFTING ASSOCIATION OF USA WEIGHTLIFTING, INCORPORATED TABLE OF CONTENTS ARTICLE I NAME Name... 3 Address...
California State Senators
 California State Senators # Photo Last Name First Name Term Ends Address Phone Fax Website Email SD 36 Anderson Joel- R 2018 State Capitol, (916)651-4036 (916) 651-4936 http://district36 Room 5052.cssrc.us/
CALIFORNIA COUNTY, CITY AND SCHOOL DISTRICT ELECTION OUTCOMES. County Offices and Ballot Measures
 CALIFORNIA COUNTY, CITY AND SCHOOL DISTRICT ELECTION OUTCOMES 1999 ELECTIONS County Offices and Ballot Measures Institute for Social Research Center For California Studies California State University,
BYLAWS DEPOSITION REPORTERS ASSOCIATION OF CALIFORNIA, INC. A California Nonprofit Mutual Benefit Corporation
 BYLAWS OF DEPOSITION REPORTERS ASSOCIATION OF CALIFORNIA, INC. A California Nonprofit Mutual Benefit Corporation ARTICLE I OFFICES OF THE CORPORATION Section 1. PRINCIPAL EXECUTIVE OFFICE. The principal
BYLAWS ARTICLE I OFFICES ARTICLE II MEMBERS
 BYLAWS OF THE CALIFORNIA ASSOCIATION OF LOCAL AGENCY FORMATION COMMISSIONS ARTICLE I OFFICES 1.1 Principal Office. The principal office of California Association of Local Agency Formation Commissions (
Criminal Justice Realignment:
 Criminal Justice Realignment: What Counties Need to Know to Implement Jointly Presented by: CSAC, CPOC, CSSA, CDAA, CPDA and AOC September 2011 What is Criminal Justice Realignment? Shifts custody of felons
A Community of Contrasts
 A Community of Contrasts Asian Americans and Pacific Islanders in the United States DEMOGRAPHIC PROFILE Principal Researcher Contents Welcome 1 Introduction 2 Key Findings 3 United States 4 Largest Communities
Agricultural Workers--Collective Bargaining Rights And Secondary Boycott Prohibition
 University of California, Hastings College of the Law UC Hastings Scholarship Repository Initiatives California Ballot Propositions and Initiatives 10-28-1971 Agricultural Workers--Collective Bargaining
Enactment Of Tax Measures By Legislature
 University of California, Hastings College of the Law UC Hastings Scholarship Repository nitiatives California Ballot Propositions and nitiatives 2-10-1977 Enactment Of Tax Measures By Legislature Follow
California Court Reporters Association Bylaws (Adopted October 4, 2017)
") California Court Reporters Association Bylaws (Adopted October 4, 2017) ARTICLE 1 NAME The name of this organization shall be the California Court Reporters Association, Incorporated (hereinafter referred
California Court Reporters Association Bylaws (Adopted October 4, 2017) ARTICLE 1 NAME The name of this organization shall be the California Court Reporters Association, Incorporated (hereinafter referred
I A I N S T I T U T E O F T E C H N O L O G Y C A LI F O R N
 DIVISION OF THE HUMANITIES AND SOCIAL SCIENCES CALIFORNIA INSTITUTE OF TECHNOLOGY PASADENA, CALIFORNIA 91125 CITIZENSHIP AND POLITICAL REPRESENTATION IN CONTEMPORARY CALIFORNIA R. Michael Alvarez Tara
How Proposed Changes to the Public Charge Rule Will Affect Health, Hunger and the Economy in California
 THE UCLA CENTER FOR HEALTH POLICY RESEARCH 1 The Center s 2018 Health Policy Seminar Series: How Proposed Changes to the Public Charge Rule Will Affect Health, Hunger and the Economy in California Ninez
California Counts. A State of Diversity Demographic Trends in California s Regions. Summary. Public Policy Institute of California
 POPULATION TRENDS AND PROFILES Hans P. Johnson, editor Volume 3 Number 5 May 2002 Demographic Trends in California s Regions By Hans P. Johnson This edition of uses recent data from the 2000 Census to
Contents APA CALIFORNIA BYLAWS
 Contents Article 1. NAME, AREA SERVED, AND NON-PROFIT NATURE... 4 1.1 NAME... 4 1.2 AREA SERVED... 4 1.3 NON-PROFIT NATURE OF CHAPTER... 4 Article 2. PURPOSE AND AFFILIATED ENTITIES... 4 2.1 STATEMENT
Report on Arrests for Driving Under the Influence in California, 1997
 Golden Gate University School of Law GGU Law Digital Commons California Agencies California Documents 3-1999 Report on Arrests for Driving Under the Influence in California, 1997 Office of the Attorney
California Civic Engagement Project
 California Civic Engagement Project Policy Brief Issue 10 July 2015 Page 1 Policy Brief Issue 10 July 2015 Highlights: Only 17.3% of eligible Latinos and 18.4% of eligible Asian Americans voted in the
SECOND AMENDED AND RESTATED JOINT EXERCISE OF POWERS AGREEMENT
 CALSAWS CONSORTIUM SECOND AMENDED AND RESTATED JOINT EXERCISE OF POWERS AGREEMENT Originally Adopted: December 1998 First Amended: June 2007 Second Amended: June 2010 Amended and Restated: September 2017
Disparities in California s Uncounted Vote-by-Mail Ballots: Youth, Language Preference and Military Status
 The California Civic Engagement Project Disparities in California s Uncounted Vote-by-Mail Ballots: Youth, Language Preference and Military Status The (CCEP) recently published an issue brief examining
Appendix A. Humboldt County Community Corrections Partnership (CCP) Membership Roster Humboldt County AB 109 Implementation Progress Report
 Membership Roster Humboldt County AB 109 Implementation Progress Report") Appendix A. Humboldt County Community Corrections Partnership (CCP) Membership Roster Humboldt County AB 109 Implementation Progress Report Humboldt County Community Corrections Partnership Membership
Appendix A. Humboldt County Community Corrections Partnership (CCP) Membership Roster Humboldt County AB 109 Implementation Progress Report Humboldt County Community Corrections Partnership Membership
State Employee Salaries
 University of California, Hastings College of the Law UC Hastings Scholarship Repository Initiatives California Ballot Propositions and Initiatives 2-9-1972 State Employee Salaries Follow this and additional
USA WEIGHTLIFTING, INCORPORATED) PACIFIC WEIGHTLIFTING ASSOCIATION CONSTITUTION OF THE PACIFIC WEIGHTLIFTING ASSOCIATION (A MEMBER OF
 PACIFIC WEIGHTLIFTING ASSOCIATION CONSTITUTION OF THE PACIFIC WEIGHTLIFTING ASSOCIATION (A MEMBER OF") USA WEIGHTLIFTING, INCORPORATED PACIFIC WEIGHTLIFTING ASSOCIATION CONSTITUTION OF THE PACIFIC WEIGHTLIFTING ASSOCIATION (A MEMBER OF USA WEIGHTLIFTING, INCORPORATED) TABLE OF CONTENTS ARTICLE I NAME Name...
USA WEIGHTLIFTING, INCORPORATED PACIFIC WEIGHTLIFTING ASSOCIATION CONSTITUTION OF THE PACIFIC WEIGHTLIFTING ASSOCIATION (A MEMBER OF USA WEIGHTLIFTING, INCORPORATED) TABLE OF CONTENTS ARTICLE I NAME Name...
Integration Potential of California s Immigrants and Their Children
 ROSENBERG FOUNDATION Integration Potential of California s Immigrants and Their Children > > > > > > > > > > > > > > > > > New Estimates of Potential New Voters at the State, County, and Legislative District
THE STATE OF THE UNIONS IN 2007: A PROFILE OF UNION MEMBERSHIP IN LOS ANGELES, CALIFORNIA AND THE NATION 1
 THE STATE OF THE UNIONS IN 2007: A PROFILE OF UNION MEMBERSHIP IN LOS ANGELES, CALIFORNIA AND THE NATION 1 Ruth Milkman and Bongoh Kye UCLA Institute for Research on Labor and Employment September 2007
THE STATE OF THE UNIONS IN 2009: A PROFILE OF UNION MEMBERSHIP IN LOS ANGELES, CALIFORNIA AND THE NATION 1
 THE STATE OF THE UNIONS IN 2009: A PROFILE OF UNION MEMBERSHIP IN LOS ANGELES, CALIFORNIA AND THE NATION 1 Lauren D. Appelbaum UCLA Institute for Research on Labor and Employment Ben Zipperer University
Racial Disparities in the Direct Care Workforce: Spotlight on Asian and Pacific Islander Workers
 FEBRUARY 2018 RESEARCH BRIEF Racial Disparities in the Direct Care Workforce: Spotlight on Asian and Pacific Islander Workers BY STEPHEN CAMPBELL The final publication in a three-part series focusing on
PREPARED FOR: Breaking ICE s Hold. Presented by: Angela Chan Senior Staff Attorney and Policy Director Advancing Justice Asian Law Caucus
 PREPARED FOR: Breaking ICE s Hold Presented by: Angela Chan Senior Staff Attorney and Policy Director Advancing Justice Asian Law Caucus About us Advancing Justice - Asian Law Caucus San Francisco, CA
SYSTEMWIDE OFFICE of the EDUCATION ABROAD PROGRAM (UCEAP) 2011 Brazil Student Visa Information: PUC-Rio de Janeiro Programs
 2011 Brazil Student Visa Information: PUC-Rio de Janeiro Programs") SYSTEMWIDE OFFICE of the EDUCATION ABROAD PROGRAM (UCEAP) 2011 Brazil Student Visa Information: PUC-Rio de Janeiro Programs To receive a visa is a privilege, not a right. Consulates reserve the right to
SYSTEMWIDE OFFICE of the EDUCATION ABROAD PROGRAM (UCEAP) 2011 Brazil Student Visa Information: PUC-Rio de Janeiro Programs To receive a visa is a privilege, not a right. Consulates reserve the right to
PPIC Statewide Survey:
 Global California: PPIC Statewide Survey: Perspectives on U.S.-Japan Relations Mark Baldassare Senior Fellow and Survey Director September 2001 Public Policy Institute of California Contents Press Release
Asian American Pacific Islanders for Civic Empowerment Concept Paper. California Leads the Way Forward (and Backward)
") Asian American Pacific Islanders for Civic Empowerment Concept Paper As California goes, so goes the country. California Leads the Way Forward (and Backward) Home to the world s 8 th largest economy, California
Asian American Pacific Islanders for Civic Empowerment Concept Paper As California goes, so goes the country. California Leads the Way Forward (and Backward) Home to the world s 8 th largest economy, California
INSTRUCTIONS FOR FILING A COMPLAINT BY A PRISONER UNDER CIVIL RIGHTS STATUTE 42 U.S.C. 1983
 (HC) McCullock v. Cate et al Doc. 7 Att. 1 INSTRUCTIONS FOR FILING A COMPLAINT BY A PRISONER UNDER CIVIL RIGHTS STATUTE 42 U.S.C. 1983 I. Scope of Section 1983 An action under Section 1983 is available
AGENDA ITEM 9A. MEETING: July 18, 2018
 MEETING: July 18, 2018 TO: FROM: SUBJECT: AGENDA ITEM 9A Humboldt LAFCo Commissioners Colette Metz, Executive Officer CALAFCO Annual Conference Items The Commission will receive a report relating to 2018
REGIONAL. San Joaquin County Population Projection
 Lodi 12 EBERHARDT SCHOOL OF BUSINESS Business Forecasting Center in partnership with San Joaquin Council of Governments 99 26 5 205 Tracy 4 Lathrop Stockton 120 Manteca Ripon Escalon REGIONAL analyst june
DRAFT BYLAWS for Caucus Comments of the CALIFORNIA DEMOCRATIC PARTY STATE CENTRAL COMMITTEE VETERANS CAUCUS ARTICLE I NAME
 DRAFT BYLAWS for Caucus Comments of the CALIFORNIA DEMOCRATIC PARTY STATE CENTRAL COMMITTEE VETERANS CAUCUS ARTICLE I NAME SECTION 1. NAME: The name of this organization shall be the Veterans Caucus of
Asian Americans in New York City. A Decade of Dynamic Change Presented on April 20, 2012 Report from
 Asian Americans in New York City A Decade of Dynamic Change 2000-2010 Presented on April 20, 2012 Report from Asian Americans in New York City: A Decade of Dynamic Change Demographic Changes from 2000-2010
01/19/2018. Attorneys for Plaintiffs SUPERIOR COURT OF THE STATE OF CALIFORNIA COUNTY OF SAN FRANCISCO
 0 SSAMERICAN CIVIL LIBERTIES UNION FOUNDATION OF NORTHERN CALIFORNIA MICHAEL T. RISHER () (MRISHER@ACLUNC.ORG) RAUL L. MACIAS (0) (RMACIAS@ACLUCA.ORG) Drumm Street, nd Floor San Francisco, CA Telephone:
diverse communities diverse experiences
 diverse communities diverse experiences The Status of Asian Americans & Pacific Islanders in the U.S. A Review of Six Socioeconomic Indicators and Their Impact on Health APIAHF ASIAN & PACIFIC ISLANDER
FBI NATIONAL ACADEMY ASSOCIATES, INC., CALIFORNIA CHAPTER 1 EXECUTIVE BOARD PROTOCOL AND POLICIES
 FBI NATIONAL ACADEMY ASSOCIATES, INC., CALIFORNIA CHAPTER 1 EXECUTIVE BOARD PROTOCOL AND POLICIES The Executive Board Protocol and Policies are dedicated to the memory and service of Past President Bernard
Riverside Labor Analysis. November 2018
 November 2018 The City of Labor Market Dynamics and Local Cost of Living Analysis Executive Summary The City of is located in one of the fastest growing parts of California. Over the period 2005-2016,
Nevada s Share of Employment and Personal Earnings within the Economic Regions
 Nevada s Share of Employment and Personal Earnings within the Economic Regions 1.1 Purpose This report presents a more detailed economic analysis of Northern and Southern Nevada within the context of their
Migration Information Source - Chinese Immigrants in the United States
 Pagina 1 di 8 Chinese Immigrants in the United States By Aaron Terrazas, Jeanne Batalova Migration Policy Institute May 6, 2010 The United States is home to about 1.6 million Chinese immigrants (including
Chapter Bylaws (AMENDED MARCH 3, 2017)
") Chapter Bylaws (AMENDED MARCH 3, 2017) ARTICLE I Name and Geographical Area This Chapter shall be known as the Northern California Chapter of the International Public Management Association Human Resources.
Chapter Bylaws (AMENDED MARCH 3, 2017) ARTICLE I Name and Geographical Area This Chapter shall be known as the Northern California Chapter of the International Public Management Association Human Resources.
Title Do Californians Answer the Call to Serve on a Jury? A Report on California Rates of Jury Service Participation May 2015.
 Title Do Californians Answer the Call to Serve on a Jury? A Report on California Rates of Jury Service Participation May 2015 Introduction Jurors play an integral part of the American justice system. Because
Grants approved in the second quarter of 2017 Allied Media Project, Inc.
 Allied Media Project, Inc. Detroit, MI https://www.alliedmedia.org/ $200,000 over one year and six months For project support to produce a series of short videos that will be used to increase public awareness
Institute for Public Policy and Economic Analysis
 Institute for Public Policy and Economic Analysis The Institute for Public Policy and Economic Analysis at Eastern Washington University will convey university expertise and sponsor research in social,
THE STATE OF THE UNIONS IN 2011: A PROFILE OF UNION MEMBERSHIP IN LOS ANGELES, CALIFORNIA AND THE NATION 1
 THE STATE OF THE UNIONS IN 2011: A PROFILE OF UNION MEMBERSHIP IN LOS ANGELES, CALIFORNIA AND THE NATION 1 Lauren D. Appelbaum UCLA Institute for Research on Labor and Employment 2 Ben Zipperer University
Labor Force Characteristics by Race and Ethnicity, 2015
 Cornell University ILR School DigitalCommons@ILR Federal Publications Key Workplace Documents 9-2016 Labor Force Characteristics by Race and Ethnicity, 2015 Bureau of Labor Statistics Follow this and additional
California Xegi$Lature PRESIDENT PRO TEMPORE STATE SENATE
 California Xegi$Lature.- DON PERATA PRESIDENT PRO TEMPORE STATE SENATE CORRESPONDENC'E~ 1paga,165 June 6,2008 The Honorable Thomas Mayfield County Supervisor Stanislaus County 101 0 10th St, Suite 6500
Health Policy Research Brief
 Health Policy Research Brief June 2005 More Than 2.9 Million Californians Now Food Insecure One in Three Low-Income, An Increase in Just Two Years Gail G. Harrison, George Manalo-LeClair, Anthony Ramirez,
This report is published by the Council on Asian Pacific Minnesotans. For more information, contact the Council on Asian Pacific Minnesotans at
 This report is published by the Council on Asian Pacific Minnesotans. For more information, contact the Council on Asian Pacific Minnesotans at 658 Cedar Street, Suite 160 Saint Paul, Minnesota 55155 (651)
Racial Inequities in the Washington, DC, Region
 W A S H I N G T O N A R E A R E S E A R C H I N I T I A T V E Racial Inequities in the Washington, DC, Region 2011 15 Leah Hendey December 2017 The Washington, DC, region is increasingly diverse and prosperous,
BYLAWS CALIFORNIA CHAPTER 1, AMERICAN ACADEMY OF PEDIATRICS. (a California nonprofit mutual benefit corporation) ARTICLE I. General Provisions
 ARTICLE I. General Provisions") Draft approved by the Board 6/19/18 Approved by the Membership / /18 BYLAWS OF CALIFORNIA CHAPTER 1, AMERICAN ACADEMY OF PEDIATRICS (a California nonprofit mutual benefit corporation) ARTICLE I. General
Draft approved by the Board 6/19/18 Approved by the Membership / /18 BYLAWS OF CALIFORNIA CHAPTER 1, AMERICAN ACADEMY OF PEDIATRICS (a California nonprofit mutual benefit corporation) ARTICLE I. General
CALIFORNIA NARCOTIC OFFICERS ASSOCIATION B Y L A W S
 CALIFORNIA NARCOTIC OFFICERS ASSOCIATION B Y L A W S Amended June 12, 2014 AMENDMENTS October 1997 Amended, restated and renumbered Amended, June 1999 Amended, January 2000 Amended, July 9, 2002 Amended,
This Could Be the Start of Something Big: Looking for the New America
 This Could Be the Start of Something Big: Looking for the New America Manuel Pastor January 2011 La Conyuntura vs. the Long-run We tend to think about short-term politics and economics... 1 La Conyuntura
BYLAWS LOCAL UNION NO INTERNATIONAL BROTHERHOOD ELECTRICAL WORKERS VACAVILLE, CALIFORNIA. APPROVED: January 30, 2015
 BYLAWS OF LOCAL UNION NO. 1245 INTERNATIONAL BROTHERHOOD OF ELECTRICAL WORKERS VACAVILLE, CALIFORNIA APPROVED: January 30, 2015 ORDER OF BUSINESS 1. Opening. 2. Roll Call of Officers and Reading of Minutes.
Marijuana. Use And Possession.
 University of California, Hastings College of the Law UC Hastings Scholarship Repository Initiatives California Ballot Propositions and Initiatives 10-5-1973 Marijuana. Use And Possession. Follow this
Data Brief Vol. 1, No. 1
 Asian Americans and Pacific Islanders in the United States Aged 55 Years and Older: Population, Nativity, and Language Asian Americans and Pacific Islanders (AAPIs) are one of the fastest growing populations
California Republican Party
 Standing Rules and Bylaws of the California Republican Party As Amended October 22, 2017* *On-line version updated 11-16-17 to correct formatting errors 2 TABLE OF CONTENTS CRP Standing Rules & Bylaws
Traffic Density and Ethnic Composition in Massachusetts: An Exploratory Study. Rana Charafeddine Boston University School of Public Health
 Traffic Density and Ethnic Composition in Massachusetts: An Exploratory Study Rana Charafeddine Boston University School of Public Health Outline 1. Introduction 2. Research Question 3. Methods 4. Results
GROWTH AMID DYSFUNCTION An Analysis of Trends in Housing, Migration, and Employment SOLD
 GROWTH AMID DYSFUNCTION An Analysis of Trends in Housing, Migration, and Employment SOLD PRODUCED BY Next 10 F. Noel Perry Colleen Kredell Marcia E. Perry Stephanie Leonard PREPARED BY Beacon Economics
Setting the Context on South Asian Americans: Demographics, Civic Engagement, Race Relations. Alton Wang & Karthick Ramakrishnan AAPI Data
 Setting the Context on South Asian Americans: Demographics, Civic Engagement, Race Relations Alton Wang & Karthick Ramakrishnan AAPI Data Context #1: Growth and Diversity National Origins (2015) (in Thousands)
County of Sonoma Agenda Item Summary Report
 Revision No. 20170501-1 County of Sonoma Agenda Item Summary Report Agenda Item Number: 1 (This Section for use by Clerk of the Board Only.) Clerk of the Board 575 Administration Drive Santa Rosa, CA 95403
Using Data to Address Health Inequities. Iyanrick John Senior Policy Strategist February 12, 2019
 Using Data to Address Health Inequities Iyanrick John Senior Policy Strategist February 12, 2019 About APIAHF The Asian & Pacific Islander American Health Forum is one of the oldest and largest national
Advancing Equity and Inclusive Growth in San Joaquin Valley: Data for an Equity Policy Agenda
 Advancing Equity and Inclusive Growth in San Joaquin Valley: Data for an Equity Policy Agenda Equity is the Superior Growth Model Image source: Flickr. Regional indicators database Coverage: 150 largest
Extrapolated Versus Actual Rates of Violent Crime, California and the United States, from a 1992 Vantage Point
 Figure 2.1 Extrapolated Versus Actual Rates of Violent Crime, California and the United States, from a 1992 Vantage Point Incidence per 100,000 Population 1,800 1,600 1,400 1,200 1,000 800 600 400 200
Criminal Appeals in California
 California Law Review Volume 24 Issue 6 Article 1 September 1936 Criminal Appeals in California Ronald H. Beattie Follow this and additional works at: http://scholarship.law.berkeley.edu/californialawreview
Illegal Immigration: How Should We Deal With It?
 Illegal Immigration: How Should We Deal With It? Polling Question 1: Providing routine healthcare services to illegal Immigrants 1. Is a moral/ethical responsibility 2. Legitimizes illegal behavior 3.
ASIAN AMERICAN BUSINESSES EXPLODING IN DIVERSITY & NUMBERS
 ASIAN AMERICAN BUSINESSES EXPLODING IN DIVERSITY & NUMBERS CENTRAL TEXAS ASIAN AMERICAN OWNED BUSINESSES REPORT 2016 PRESENTED BY THE GREATER AUSTIN ASIAN CHAMBER OF COMMERCE FORWARD Exploding in Diversity
Resolutions Committee Report Anaheim, CA Saturday, October 21, 2017
 Resolutions Committee Report Anaheim, CA Saturday, October 21, 2017 The Resolutions Committee met on Saturday, October 21, 2017 at 4:00pm in Grand D at the Anaheim Marriott to consider resolutions for
INSTRUCTIONS FOR FILING A COMPLAINT IN THE EASTERN DISTRICT OF CALIFORNIA BY A PRISONER:
 (PC) Trevino v. Gomez, et al Doc. 62 Att. 1 INSTRUCTIONS FOR FILING A COMPLAINT IN THE EASTERN DISTRICT OF CALIFORNIA BY A PRISONER: 1. AGAINST FEDERAL GOVERNMENT EMPLOYEES UNDER BIVENS V. SIX UNKNOWN