Reexamining Ferguson: The effect of police officers on arrests by race
|
|
|
- Sophie Cobb
- 6 years ago
- Views:
Transcription
1 University of California, Berkeley Undergraduate Senior Thesis Reexamining Ferguson: The effect of police officers on arrests by race Author: Bhargav Gopal Advisor: Justin McCrary May 6, 2015
2 1 Introduction The shooting of Michael Brown in August of 2014 and the subsequent protests in Ferguson, Missouri brought a sharp spotlight to the issue of race and policing in the United States. The events prompted an investigation of the Ferguson Police Department by the Department of Justice, and a report was issued in March of 2015 [1]. According to the report, of all arrests after car stops from 2012 to 2014, 93% of those arrests were of African American individuals. Furthermore, at the time of the Michael Brown shooting, only 6% of the Ferguson police department was black. Hence the ratio between percent black (white) arrests and percent black (white) officers, which I will refer to as black (white) ratio, is The figures from Ferguson motivate the following research questions that I answer in this paper: 1) is the black ratio ratio in Ferguson (15.5) atypical of the US as a whole; 2) how have the black and white ratios changed over time; and 3) What is the effect of adding a black, white, or Asian officer on black, white, or Asian arrests. Aggregated over all years in my dataset, I find that the white ratio for every state in the US is less than 1, while the black ratio for every state is greater than 1 (the only exception is New Mexico). A plausible explanation for why African Americans are more represented in the arrested population as opposed to the police population is that disadvantaged groups are hurt by the discretionary process of defining and responding to criminal conduct[5, 6]. Another theory is that the ratios do not indicate racial discrimination, but rather differences in ability to enter the police force and differences in rates of offending[3]. In addition, systematic discrimination where police forces hire whites at disproportionate rates, and where white police officers discriminatorily arrest black suspects would also be consistent with the ratios observed. In this paper, I also use OLS to answer the following question: What is the effect of adding a black, white, or Asian officer on black, white, or Asian arrests? Notable theories regarding the effect of officers on crime include the Deterrence and Incapacitation theories. The Deterrence theory states that criminal activity becomes less attractive as the probability of arrest increases; the Incapacitation theory states that adding police officers will eventually reduce criminal activity by 1
3 arresting the most prolific offenders[2]. While both theories suggest that adding police officers reduces crime, the Deterrence theory implies that adding police officers would reduce arrests, while the Incarceration theory implies that adding police officers would initially increase arrests. The Impact of Race on Policing and Arrests looks at a similar research question, and the authors find that increases in the number of minority police are associated with significant increases in arrests of whites but have little impact on arrests of nonwhites[8]. They also argue that more white police increase the number of arrests of nonwhites but do not systematically affect the number of white arrests. While this paper examines a similar question, the effect of adding a black, white, or Asian police officer on each of black, white, and Asian arrests, there are some notable differences in the methodologies used between this paper and The Impact of Race on Policing and Arrests. First, the data that I use to examine the racial composition of municipal police departments comes from the Law Enforcement Management and Administrative Statistics (LEMAS), while the racial data on municipal police departments used in The Impact of Race on Policing and Arrests comes from EEOC tabulations. In the LEMAS dataset, we are able to see the number of full-time sworn officers by race. In the EEOC, the figures represent officers whose job function is protective services, which can include both sworn and unsworn police officers. Another difference between this paper and The Impact of Race on Policing and Arrests is the fact that in my paper, I do not divide my race categories into white and non-white. Instead, I have arrest and officer figures for blacks, whites, and Asians. Finally, another unique feature of my paper is the examination of the black, white, and Asian ratio both over time and across different states in the US. I use agency and year fixed effects, as well as 1987 Population weights when implementing my regressions. Over various regression specifications, my dependent variable is either the sum of black, white, and Asian arrests in a given agency and year or the yearly sum of the number of arrests of a particulate race in a given agency and year. The three independent variables are the counts of the number of white, black, and Asian officers in a given agency and year. On the surface, the 2
4 model immediately suffers from 1) Omitted variable bias 2) Simultaneity bias, and 3) Measurement Error. Indeed, the possibility that the level of officers is partly determined by the level of arrests has led to the creative use of instrumental variables to measure the effect of officers on crime[9, 7]. In addition, if the level of officers is correlated with potential omitted variables such as the local economy and city budgets, the coefficients on the officer variables would be biased. Thus I rely upon the fact that year over year changes in police have generally weak associations with potential omitted variables such as the local economy, city budgets, social disorganization, and recent changes in crime, suggesting that the Omitted Variable and Simultaneity biases are not particularly worrisome. Since the arrest data received from the Uniform Crime Reports (UCR) has measurement error, which stems from factors such as differences in police department reporting practices across jurisdictions, technological changes in crime reporting, and changes in crime reporting by victims over time, the coefficients on the officer variables will be biased downward[4]. The use of agency fixed effects is critical in obtaining an unbiased estimate of the effect of adding an officer on the number of arrests. If agency fixed effects were not included, increases in the number of officers could be correlated with unobserved omitted variables that vary over different agencies. For example, it is not out of the realm of possibility to imagine a world where agencies representing regions with poor socio-economic characteristics have more officers and arrests. Thus, if we do not include agency-fixed effects, we will most likely overstate the effect of adding officers on the number of arrests. Similarly, population weights are necessary for understanding the true relationship between officers and arrests. Since the data is presented at the agency level, there are simply more agencies representing small populations than large populations. Without population weights, we would give, for example, equal weight to New York Police Department as Abbeville Police Department. However, we know that New York Police Department represents a population much larger than Abbeville Police Department, and we can give more weight to agencies that represent larger populations. 3
5 2 Data The FBI s Uniform Crime Reports (UCR) provides information regarding the number of arrests, broken down by race, undertaken by agencies across the United States in a given year. The UCR data is available annually from 1980 until 2012, and I access agency level data where arrests are organized by age, sex, and race. The relevant variables I access in the UCR data are adult white arrests, adult black arrests, adult Asian arrests, originating reporting agency identifier (ORI), agency name, and state. The ORI code uniquely identifies a police agency. Since the arrest data within a given year are reported monthly, for each agency, I sum arrests for all months to find the total yearly arrests undertaken by a given agency. The Law Enforcement Management and Administrative Statistics (LEMAS) provides agency level information regarding the organization and administration of police and sheriff departments that employ 100 or more full time sworn officers. Information about a nationally representative sample of smaller agencies is also included. The LEMAS years that I access are 1987, 1990, 1993, 1997, 2000, and The 1999 LEMAS dataset is a limited version that doesn t contain the race variables for police officers. The relevant LEMAS variables that I access are full time sworn white officers, full time sworn black officers, full time sworn Asian officers, agency name, state, and ORI (if available). To ultimately construct my final dataset, I merged the officer race information provided by LEMAS and the arrest race information provided by the UCR. For the years where the ORI code was included in both LEMAS and UCR, I merged using the ORI code as the unique identifier. When the ORI code was not available for both datasets, I merged based on agency name and state. After the LEMAS and UCR information is merged together for the available years, there are 7847 total observations. Of the 7847 observations, there are 4293 unique agencies. Table 1 presents the number of observations in each year. There are fewer observations in 1987 due to difficulties in finding a common identifier between the LEMAS and UCR data. Table 2 presents the weighted means for the number of white, black, and Asian arrests or officers in a given agency. Since there are significant differences in the sizes of different agencies (measured by the 4
6 size of the population an agency represents), weights proportional to the size of the population an agency represents are used. If weights are not used, we will overestimate statistics and features from the smaller agencies. I follow convention by using population weights that are measured in a particular year (I use 1987 population, which is the first year that I consider in my analysis). Table 3 shows that half the agencies represent a population that is less than 15,560. Naturally, half the agencies represent populations more than 15,560, but some agencies in the dataset are particularly large. In fact, there are 9 agencies in the dataset that represent 1987 populations greater than 1,000, Data shortcomings An important omission from my data is Hispanic arrest and race information. The reason Hispanic information is not included is because the UCR does not have any information about Hispanic arrests except in 2013[10]. The FBI discontinued collecting ethnic based crime data in 1987 (only to reinstate in 2013), and as a result, the Hispanic figures are implicitly part of white arrests and white officers. If the Hispanic information were available and if the ratio of Hispanic arrests to Hispanic officers were greater than the ratio of white arrests to white officers, then the current statistic of white officer /white arrest overstates the true ratio. The fact that an agency voluntarily submits reports on crimes also presents an issue. Agencies have the option of simply not reporting UCR data in a given year. As a result, many agencies are only observed in 1 year. The fact that a sizable number of agencies are only observed in 1 year reduces the relevant sample size when performing a demeaned regression. In addition, even if an agency does file UCR reports in a given year, the data have measurement error problems. The issue of agencies self-reporting statistics is also partially present in the LEMAS data. Large agencies with 100 or more full time sworn officers self report, while the smaller law enforcement agencies chosen through a stratified random sample were not allowed to self-report. The exclusion of a host of covariates in the regression specification presents a concern if one is worried about omitted variable bias. Namely one could worry 5
7 that even within an agency, an outside variable such as the local economy could influence both officer and arrest levels. While the inclusion of potential covariates would be ideal, I rely upon evidence that year over year changes in police levels are uncorrelated with the local economy, city budgets, social disorganization, and recent changes in crime[4]. Finally, the lack of a common identifier that is consistent in both the UCR and LEMAS data over all years presents difficulties in matching arrest data to police data. If such an identifier existed, my sample size would be larger, and there would be more agencies that are observed in multiple years. 3 Methodology The primary statistic I use to compare a race s representation in the police force to representation in the arrest population is the race ratio := % race arrested /% race officers. If, for the sake of example, an agency has 100 officers, 10 black officers, 500 arrests, and 400 black arrests, then the black ratio =.8 /.1 = 8. A competing statistic that I elect not to use is the race difference:=% race arrests - % race officers. Empirically, if we compare the black difference statistic across states, we find that the black difference is inflated in states with large black populations. A strength of the race difference statistic that is not present in the race ratio statistic is that one can calculate the race difference statistic for every agency. When the denominator of the race ratio statistic is 0 (when there are 0 officers of a certain race), then we cannot calculate the race ratio statistic. Figure 1 shows the weighted and un-weighted means of the race ratio statistic for blacks, whites, and Asians. Since the race ratio statistic cannot be calculated for agencies with 0 officers of a given race, I define the mean of race.ratio, race.ratio = (%race.arrested). Analogously, the weighted mean of race.ratio = weighted mean (%race.officers) (% race arrested) / weighted mean (% race officers), where the weights are provided by the size of the population an agency represents in Hence after canceling terms, the equation for the weighted mean ratio is the following, where the unit of analysis is the agency: 6
8 n (pop i )(percent.race i ) i=1 n (pop i )(percent.officer i ) i=1 Figure 2 shows how the weighted mean ratio for blacks, whites, and Asians have changed since Only agencies observed over all years are tracked. Hence the time series shows how the weighted mean ratio has changed for the same basket of agencies over time. Tracking the same agencies over time is important because in any given year, agencies might self-select to report their arrest or officer figures. A caveat of interpreting the figure is that the agencies that do appear in all the years tend to be larger agencies. The reason 1987 is not included is because there are relatively fewer observations in 1987 than in other years, as shown in Table 1. Thus, if 1987 were included, the number of agencies that we observe over all years in the data dwindles. In addition, the means for each year are weighted to give greater weight to agencies that represent larger populations. Figures 3 and 4 show the weighted mean ratio for blacks and whites within each state. Thus for each state separately, I calculate the weighted mean using the weighted mean ratio formula presented earlier. 3.1 Regression Specification I estimate models of two forms. The first form is as follows: race.arrestsit = B 0 + white.officers it B 1 + black.officers it B 2 + Asian.officers it B 3 + D γ + T φ + ɛ it The second form is as follows: log BW A.arrests it = B 0 + log B 1 BW A.officers + +D γ + T φ + ɛ it The unit of observation is at the agency-time level. In the first form, the dependent variable is the number of arrests of a certain race. The X matrix contains the level of black officers, white officers, and Asian officers. The T matrix consists of dummies for each year in the dataset (except the first year). The D matrix consists of dummies for each agency in the dataset (except the first agency). In the second form, the dependent variable is the sum of black, white, and Asian arrests in a given agency-year. The independent variable is the sum of black, white, and Asian officers in a given agency-year. ɛ represents the error term in 7
9 both forms. Both forms also are weighted by the 1987 population. 1 The use of agency fixed effects in both forms is very important in obtaining an unbiased estimate of the effect of adding an officer on the number of arrests. Suppose, for example, that a city s collective consciousness about crime is unobserved and influences both the officer counts and the number of arrests in a given agency. Also suppose that this unobserved variable is constant within a city but varies between cities. Then if agency fixed effects are not included, we will obtain an unbiased estimate. 2 In the second form, the B 1 term represents the elasticity of BWA.arrests with respect to BWA.officers. Since the dataset only includes agencies that have total arrest counts and total officer counts greater than 0, the independent and dependent variable are finite under the log transformation. Hence the coefficient represents an elasticity: a 1% increase in BWA.officers is associated with a ˆβ 1 % increase in BWA.arrests. Also, the standard error of the elasticity is simply the standard error of ˆβ 1 In the first form, we cannot report to taking logs of the dependent and independent variables without throwing observations away. The reason is that many agencies have 0 officers of a particular race (such as 0 Asian officers). Taking the log of a variable with 0 as a value would yield, and would consequently bias our estimate of the elasticity. Instead, we apply a square root transformation to the data, and calculate the elasticity of race.arrests with respect to race.officers in the following way: ɛ y,x = x i/ yi ˆβ SE(ɛ y,x ) = x i/ yi SE( ˆβ) Here the averages are weighted averages, where the weights are determined by the 1987 population. Furthermore, ˆβ refers to coefficient on x when y is regressed 1 In both forms, the coefficients are achieved through demeaning, rather than including dummies for every agency. In addition, due to large variation in the size of various police forces in the dataset, transformations that pull down extreme values (ie. sqrt and log) are used to prevent the regression coefficients from being unduly influenced by extreme values. 2 Year fixed effects are also important in controlling for omitted variables that vary over time but not over agency. 8
10 on x and other independent variables. Note that for some agencies, y it, the number of arrests of a certain race in a given year, is 0. Thus when calculating the elasticity, we calculate the weighted average of the numerator and denominator separately. 4 Results 4.1 Graphical Results Figure 1 compares the weighted and unweighted means of the ratio statistic for blacks, whites, and Asians. In both the weighted and unweighted cases, the ratio for whites and Asians is less than or equal to 1, while the ratio for blacks is above 1. Hence, on average, the proportion of all arrests that are white or Asian is less than the proportion of all officers that are white or Asian. Conversely, the the proportion of all arrests that are black is greater than the proportion of all officers that are black by a factor of at least 2.5. Notice that when weighted averages are calculated by using population weights, the weighted mean ratio is less than the unweighted mean ratio for all races. The fraction of all arrests that are white decreases from.78 to.66 when we take into account population weights. The fraction of all officers that are white decreases from.93 to.86 when population weights are used. The results imply that in areas with larger populations, agencies have a smaller fraction of white officers and white arrests relative to the average agency in the dataset. On the other hand, the proportion of all arrests that are black increases from.21 to.32 when we use a weighted mean. The fraction of all officers that are black increases from.06 to.11 when we take into account the population weights. The results imply that in areas with larger populations, agencies have a larger fraction of black officers and black arrests relative to the average agency in the dataset. The change when we use population weights is greatest for Asians. The mean fraction of Asian arrests doubles from.005 to.01, while the mean fraction of Asian officers quadruples from.005 to.02. The results imply that in areas with larger populations, agencies have a larger fraction of Asian officers and Asian arrests relative to the average agency in the dataset. Figure 2 shows how the weighted mean ratio for blacks, whites, and Asians 9
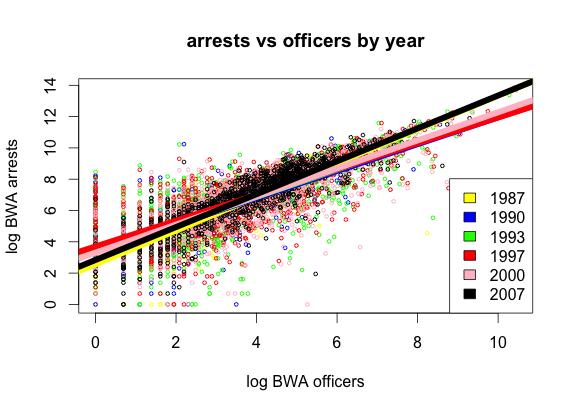
11 have changed since 1990 for agencies we observe in all years. As can be readily seen, the weighted mean ratio has been monotonically decreasing for blacks and has been monotonically increasing for whites. The ratio for Asians is lower in 2007 than the ratio in 1990; however, for all observed years before 2007, the ratio has been monotonically increasing. For each race, a paired difference t-test can be used to examine if the difference between the 2007 and 1990 ratio is significantly different from 0. I find that the t statistic for whites, blacks, and Asians is 3.09, -2.65, and respectively. Hence for all races, the ratios in 2007 are significantly different from the ratios in 2000 at the 5% level. The formula used to calculate the t-statistic for a particular race is in the footnotes. 3 Figures 3 and 4 show the weighted mean ratio for blacks and whites within each state over all years. From Figure 3, we see that the weighted white ratio is smallest in the southeastern states of the US. From Figure 4, we see that the weighted black ratio is typically larger for states in the north and north-east. Far west states tend to have lower black ratios and higher black ratios relative to other states. 4.2 Regression Results and Elasticities We are interested in finding the effect of adding a police officer on arrested made by police officers, and figure 5 shows the general relationship between police officers and arrests. Quite unsurprisingly, we see that more total officers, which is referred to in this paper as BWA officers, is associated with more total arrests, denoted as BWA arrests. The scatterplot also compares the relationship between officers and arrests for each year available by fitting a separate line of best fit for each year. The slopes of the lines for each year is obtained by fitting a regression of total officers on total arrests and an interaction term between total arrests and year. As the visual analysis confirms, the effect of officers on arrests is stronger in paired difference t stat = ratio N ( ratio i ratio) 2 /N i=1, where we take a weighted mean of the ratio, and N refers to the number of agencies that have a difference in ratio that is finite. 10
12 than it is in any other year 4. While figure 5 demonstrates the general relationship between officers and arrests, the slopes overstate the impact of officers on arrests because the slopes are the product of a pooled regression. In effect, an increase in police officers might be associated with towns that have poorer socioeconomic standings, which could be associated with more arrests. To find a more accurate estimate of the effect of adding a police officer on arrests, we need to use the within estimator, and we also need to see how the effect of adding an officer on arrests depends on the race of the officer and the race of the arrestee. The results obtained in tables 6 through table 9 are all products of regressions where agency fixed effects, time fixed effects, and population weights are used. Thus the coefficients can approximately be interpreted as the average effect of X on Y within each agency. We are primarily interested in the coefficients from tables 6 through 9 as a means of calculating the elasticity between arrests of a certain race and officers of a certain race 5. However, the coefficients on the year dummies in these tables do carry some valuable information. The square root of black and white arrests has decreased significantly 6 from 1987 to 2007, while the square root of Asian arrests has increased during the same time period. The most important numerical results in this paper are found in table 5, which represents the elasticities of arrests with respect to officers by race. The elasticity in the second row, for example, can be interpreted as follows: At the weighted mean of white arrests and white officers, a 1% increase in white officers is associated with a.38% increase in white arrests. There are a couple important facts to note. First, for all races, the elasticity of arrests with respect to white officers is greater than the elasticity with respect to black and Asian officers. If we treat these results as causal estimates, the figures imply that on average, white officers arrest suspects of all races more frequently than black or Asian officers. Second, we observe that an officer is most likely to arrest an individual of his or her own race. The elasticity of arrests with respect to white officers is greatest for white arrests; the elasticity 4 In fact, the slope in 1987 is significantly larger than the slope in any other year at the 5% level, except for Recall the equation to calculate the elasticity using a square root transformation in page 7 6 at the 5% level 11
13 of arrests with respect to black officers is greatest for black arrests; the elasticity of arrests with respect to Asian officers is greatest for Asian arrests. The third important fact is that on average, a 1% increase in police officers is associated with a.138% increase in arrests for all levels of officers and arrests 7. Finally, we should notice that the estimates of the elasticity standard errors are smallest when measuring the elasticity of arrests with respect to Asian officers. However, the t-statistics are largest for the elasticities with respect to white officers. 5 Conclusion This paper sets out to answer the following questions: 1) is the black ratio ratio in Ferguson (15.5) in 2014 atypical of the US as a whole; 2) how have the black, white, and Asian ratios changed over time; and 3) What is the effect of adding a black, white, or Asian officer on black, white, or Asian arrests. Of the 3891 observations of agency-pairs that have a finite black ratio, only 133 observations have a black ratio above Thus Ferguson s black ratio in 2014 would place itself in the top 5%. Of the 169 observations in Missouri, only 3 agency-time observations have a black ratio above In addition, table 4 shows that 23 states have 0 agencies that had a black ratio above 15.5 at any year observed in the dataset. Thus, by these measures, Ferguson s black ratio is atypical of the US black ratio. The weighted black ratio has been steadily declining in every year observed in the dataset (As seen in Figure 2). However, in each year, the weighted black ratio is still greater than 1. The weighted white ratio has been fairly constant over all years at a value below 1. The Asian ratio has also been fairly constant over all years at a value below 1, although we observe a decline in Finally, we see that white officers arrest suspects of all races more frequently than black or Asian officers, and that an officer is most likely to arrest an individual of his or her own race. Further research could examine why an officer is more likely to arrest an individual of the same race. 7 This is true because the coefficient from a log-log regression represents elasticity 12
14 References [1] Investigation of the Ferguson Police Department, 2015 [2] Berk, Richard and Lawrence A. Sherman, The specific deterrent effects of arrest for domestic assault,1984 [3] Blumstein, Alfred, On the racial disproportionality of United States prison populations, 1982 [4] Chalfin, Aaron and Justin McCrary, The Effect of Police on Crime: New Evidence from US Cities, , 2012 [5] Chambliss, William Crime and the legal process, 1969 [6] Davidson, Laura, Douglas Smith, and Christy A. Visher, Equity and discretionary justice: The influence of race on police arrest decisions, 1984 [7] Di Tella, Rafael and Ernesto Schargrodsky Do police reduce crime? Estimates using the allocation of police forces after a terrorist attack, 2004 [8] Donohue, John and Steven Levitt, The Impact of Race on Policing and Arrests, 2001 [9] Levitt, Steven, Levitt, Using electoral cycles in police hiring to estimate the effect of police on crime, 1997 [10] Planas, Roque. FBI To Track Latino Arrests For Uniform Crime Report. The Huffington Post 13
15 Table 1: means weighted by population weighted average over all agencies white.officers 1, black.officers Asian.officers white.arrests 14, black.arrests 13, Asian.arrests BWA.officers 1, BWA.arrests 28, Table 2: Distribution of size of agencies Q1 Q2 Q3 Q4 pop.quartiles ,870,000 number.of.agencies Table 3: Number of observations by year years obs.by.year , , , , , 119
16 Table 4: Statistics by state State Percent observations with black ratio above ferguson s Number of observations 34 NY RI MI CT NJ MD MN SD AR NC MO UT PA ME KS IL MS CO WI IA TX WV OH OK AL CA GA AK AZ DE FL HI ID IN KY LA MA MT ND NE NH NM NV OR SC TN VA VT WA WY
17 Table 5: Elasticities of Arrests with Respect to Officers comparison value standard.error 1 BWA arrests;bwa officers white arrests;white officers white arrests;black officers white arrests; Asian officers black arrests;white officers black arrests; black officers black arrests; Asian officers Asian arrests;white officers Asian arrests; black officers Asian arrests; Asian officers Table 6: Regression of Total Arrests on Total Officers Variable Coefficient (Std. Err.) lnbwaofficers (0.037) (0.000) (0.050) (0.045) (0.044) (0.048) (0.067) Intercept (0.200) Table 7: Regression of white Arrests on Officers using sqrt transformation Variable Coefficient (Std. Err.) white.officers (0.361) black.officers (1.379) Asian.officers (1.010) (0.000) (3.512) (3.874) (5.159) (4.210) (5.452) Intercept (12.462) Table 8: Regression of black Arrests on Officers using sqrt transformation Variable Coefficient (Std. Err.) white.officers (0.347) black.officers (1.379) Asian.officers (1.147) (0.000) (2.068) (2.454) (3.423) (2.632) (4.171) Intercept (9.564)
18 Table 9: Regression of Asian Arrests on Officers using sqrt transformation Variable Coefficient (Std. Err.) white.officers (0.050) black.officers (0.141) Asian.officers (0.114) (0.000) (0.489) (0.454) (0.501) (0.514) (0.658) Intercept (0.846)
19 mean(% race arrests)/mean(% race officers) Ratio between % race arrests and % race officers Weighted white white Weighted black black Weighted asian asian Figure 1
20 Changes in ratio of %arrests to %officers over time mean % arrests/ mean % officers {weighted} white ratio black ratio asian ratio Year Figure 2
21 50 Ratio between mean % white arrested and mean % white officers lat ratio long Figure 3
22 50 Ratio between mean % black arrested and mean % black officers lat ratio long Figure 4
23 Figure 5
24 black ratio vs log population black ratio Poughkeepsie, NY Dearborn, Warren, MI MI Dearborn, MI log Population white ratio vs log population white ratio log Population Figure 6
25 fraction arrested by race and year fraction arrested Fraction White Fraction Black Ferguson Mean Similar sized 1987 Agencies years Figure 7
26 Ferguson arrests over the years arrests Total arrests White arrests Black arrests Ferguson Mean Similar sized 1987 Agencies years Figure 8
27 Ratio of black to white arrests ratio ferguson Mean Similar sized 1987 agencies years Figure 9
Now is the time to pay attention
 Census & Redistricting : Now is the time to pay attention By Kimball Brace, President Election Data Services, Inc. Definitions Reapportionment Allocation of districts to an area Example: Congressional
The Youth Vote in 2008 By Emily Hoban Kirby and Kei Kawashima-Ginsberg 1 Updated August 17, 2009
 The Youth Vote in 2008 By Emily Hoban Kirby and Kei Kawashima-Ginsberg 1 Updated August 17, 2009 Estimates from the Census Current Population Survey November Supplement suggest that the voter turnout rate
A Dead Heat and the Electoral College
 A Dead Heat and the Electoral College Robert S. Erikson Department of Political Science Columbia University rse14@columbia.edu Karl Sigman Department of Industrial Engineering and Operations Research sigman@ieor.columbia.edu
RULE 1.1: COMPETENCE. As of January 23, American Bar Association CPR Policy Implementation Committee
 American Bar Association CPR Policy Implementation Committee Variations of the ABA Model Rules of Professional Conduct RULE 1.1: COMPETENCE A lawyer shall provide competent representation to a client.
RULE 1.14: CLIENT WITH DIMINISHED CAPACITY
 American Bar Association CPR Policy Implementation Committee Variations of the ABA Model Rules of Professional Conduct RULE 1.14: CLIENT WITH DIMINISHED CAPACITY (a) When a client's capacity to make adequately
Constitution in a Nutshell NAME. Per
 Constitution in a Nutshell NAME Per Preamble We the People of the United States, in Order to form a more perfect Union, establish Justice, insure domestic Tranquility, provide for the common defense, promote
2016 NATIONAL CONVENTION
 Delegate Allocations and Region Formation 2016 NATIONAL CONVENTION ROSEN CENTRE, ORLANDO, FL FRIDAY, MAY 27 MONDAY, MAY 30 Written and Prepared By Alicia Mattson Secretary, Libertarian National Committee
RULE 2.4: LAWYER SERVING
 American Bar Association CPR Policy Implementation Committee Variations of the ABA Model Rules of Professional Conduct RULE 2.4: LAWYER SERVING AS THIRD-PARTY NEUTRAL (a) A lawyer serves as a third-party
Mineral Availability and Social License to Operate
 Mineral Availability and Social License to Operate Brett Jordan Division of Economics and Business Colorado School of Mines Camp Resources, August 7-9, 2016 Motivation Social License to Operate (SLO) NIMBYism
2018 NATIONAL CONVENTION
 Delegate Allocations and Region Formation 2018 NATIONAL CONVENTION HYATT REGENCY, NEW ORLEANS, LA SUNDAY, JULY 1 TUESDAY JULY 3 Written and Prepared By Alicia Mattson Secretary, Libertarian National Committee
Online Appendix. Table A1. Guidelines Sentencing Chart. Notes: Recommended sentence lengths in months.
 Online Appendix Table A1. Guidelines Sentencing Chart Notes: Recommended sentence lengths in months. Table A2. Selection into Sentencing Stage (1) (2) (3) Guilty Plea Dropped Charge Deferred Prosecution
THE POLICY CONSEQUENCES OF POLARIZATION: EVIDENCE FROM STATE REDISTRIBUTIVE POLICY
 THE POLICY CONSEQUENCES OF POLARIZATION: EVIDENCE FROM STATE REDISTRIBUTIVE POLICY Elizabeth Rigby George Washington University Gerald Wright Indiana University Prepared for presentation at the Conference
Candidate Faces and Election Outcomes: Is the Face-Vote Correlation Caused by Candidate Selection? Corrigendum
 Quarterly Journal of Political Science, 2010, 5: 99 105 Corrigendum Candidate Faces and Election Outcomes: Is the Face-Vote Correlation Caused by Candidate Selection? Corrigendum Matthew D. Atkinson, Ryan
Uniform Wage Garnishment Act
 Uniform Wage Garnishment Act Agenda What is it? Why do we need it? Major provisions Enactment 1 Who is the ULC? National Conference of Commissioners for Uniform State Laws Uniform Interstate Family Support
a rising tide? The changing demographics on our ballots
 a rising tide? The changing demographics on our ballots OCTOBER 2018 Against the backdrop of unprecedented political turmoil, we calculated the real state of the union. For more than half a decade, we
Geek s Guide, Election 2012 by Prof. Sam Wang, Princeton University Princeton Election Consortium
 Geek s Guide, Election 2012 by Prof. Sam Wang, Princeton University Princeton Election Consortium http://election.princeton.edu This document presents a) Key states to watch early in the evening; b) Ways
Incarcerated Women and Girls
 Incarcerated and Over the past quarter century, there has been a profound change in the involvement of women within the criminal justice system. This is the result of more expansive law enforcement efforts,
Representational Bias in the 2012 Electorate
 Representational Bias in the 2012 Electorate by Vanessa Perez, Ph.D. January 2015 Table of Contents 1 Introduction 3 4 2 Methodology 5 3 Continuing Disparities in the and Voting Populations 6-10 4 National
STATISTICAL GRAPHICS FOR VISUALIZING DATA
 STATISTICAL GRAPHICS FOR VISUALIZING DATA Tables and Figures, I William G. Jacoby Michigan State University and ICPSR University of Illinois at Chicago October 14-15, 21 http://polisci.msu.edu/jacoby/uic/graphics
INSTITUTE of PUBLIC POLICY
 INSTITUTE of PUBLIC POLICY Harry S Truman School of Public Affairs University of Missouri ANALYSIS OF STATE REVENUES AND EXPENDITURES Andrew Wesemann and Brian Dabson Summary This report analyzes state
Mandated Use of Prescription Drug Monitoring Programs (PMPs) Map
 Map") Mandated Use of Prescription Drug Monitoring Programs (PMPs) Map Research Current as of January 2, 2018. This project was supported by Grant No. G1799ONDCP03A, awarded by the Office of National Drug Control
Mandated Use of Prescription Drug Monitoring Programs (PMPs) Map Research Current as of January 2, 2018. This project was supported by Grant No. G1799ONDCP03A, awarded by the Office of National Drug Control
RULE 3.1: MERITORIOUS CLAIMS AND CONTENTIONS
 American Bar Association CPR Policy Implementation Committee Variations of the ABA Model Rules of Professional Conduct RULE 3.1: MERITORIOUS CLAIMS AND CONTENTIONS A lawyer shall not bring or defend a
Background and Trends
 Background and Trends Kim English, Division of Criminal Justice Colorado Commission on Criminal and Juvenile Justice February 10, 2017 CCJJ / 02-10-2017 1/14 CCJJ / 02-10-2017 2/14 CCJJ / 02-10-2017 3/14
Breakdown of the Types of Specific Criminal Convictions Associated with Criminal Aliens Placed in a Non-Custodial Setting in Fiscal Year 2015
 Breakdown the Types Specific Criminal Associated with Criminal Placed in a Non-Custodial Setting in Fiscal Year 2015 The following table below provides a breakdown the types specific criminal convictions
Promoting Second Chances: HR and Criminal Records
 AL AK AZ AR CA CO CT DE DC FL GA HI ID IL IN Adult arrests without charges; records with inaccuracies Only cases of mistaken identity or false accusations are expungeable No expungement or sealing permitted
State Governments Viewed Favorably as Federal Rating Hits New Low
 APRIL 15, 2013 State Governments Viewed Favorably as Federal Rating Hits New Low FOR FURTHER INFORMATION CONTACT THE PEW RESEARCH CENTER FOR THE PEOPLE & THE PRESS Michael Dimock Director Carroll Doherty
If you have questions, please or call
 SCCE's 17th Annual Compliance & Ethics Institute: CLE Approvals By State The SCCE submitted sessions deemed eligible for general CLE credits and legal ethics CLE credits to most states with CLE requirements
Migrant and Seasonal Head Start. Guadalupe Cuesta Director, National Migrant and Seasonal Head Start Collaboration Office
 Migrant and Seasonal Head Start Guadalupe Cuesta Director, National Migrant and Seasonal Head Start Collaboration Office The Migrant Seasonal Head Start (MSHS) program is one of the largest community based
Governing Board Roster
 AASA Governance AASA is the national association most directly concerned with public education leadership. Its practicing superintendents and other school system leaders establish and oversee AASA's goals.
UNIFORM NOTICE OF REGULATION A TIER 2 OFFERING Pursuant to Section 18(b)(3), (b)(4), and/or (c)(2) of the Securities Act of 1933
(3), (b)(4), and/or (c)(2) of the Securities Act of 1933") Item 1. Issuer s Identity UNIFORM NOTICE OF REGULATION A TIER 2 OFFERING Pursuant to Section 18(b)(3), (b)(4), and/or (c)(2) of the Securities Act of 1933 Name of Issuer Previous Name(s) None Entity Type
Item 1. Issuer s Identity UNIFORM NOTICE OF REGULATION A TIER 2 OFFERING Pursuant to Section 18(b)(3), (b)(4), and/or (c)(2) of the Securities Act of 1933 Name of Issuer Previous Name(s) None Entity Type
RULE 3.8(g) AND (h):
 AND (h):") American Bar Association CPR Policy Implementation Committee Variations of the ABA Model Rules of Professional Conduct RULE 3.8(g) AND (h): (g) When a prosecutor knows of new, credible and material evidence
American Bar Association CPR Policy Implementation Committee Variations of the ABA Model Rules of Professional Conduct RULE 3.8(g) AND (h): (g) When a prosecutor knows of new, credible and material evidence
Admitting Foreign Trained Lawyers. National Conference of Bar Examiners Washington, D.C., April 15, 2016
 Admitting Foreign Trained Lawyers National Conference of Bar Examiners Washington, D.C., April 15, 2016 Professor Laurel S. Terry Carlisle, Pennsylvania LTerry@psu.edu Overview of Remarks Why this issue
January 17, 2017 Women in State Legislatures 2017
 January 17, 2017 in State Legislatures 2017 Kelly Dittmar, Ph.D. In 2017, 1832 women (1107D, 703R, 4I, 4Prg, 1WFP, 13NP) hold seats in state legislatures, comprising 24.8% of the 7383 members; 442 women
RIDE Program Overview
 RIDE Program Overview Table of Contents 1 Program Overview and the E-Verify Process 2 RIDE by the Numbers 3 Filling a Critical Gap and a Glance at Identity Fraud 4 Fact and Fiction? 5 Benefits of Working
Prison Price Tag The High Cost of Wisconsin s Corrections Policies
 Prison Price Tag The High Cost of Wisconsin s Corrections Policies November 19, 2015 Wisconsin s overuse of jails and prisons has resulted in outsized costs for state residents. By emphasizing high-cost
VOCA 101: Allowable/Unallowable Expenses Janelle Melohn, IA Kelly McIntosh, MT
 VOCA 101: Allowable/Unallowable Expenses Janelle Melohn, IA Kelly McIntosh, MT While you re waiting, please visit pollev.com/iowaagcvad so you can participate in this presentation from your phone. Overview
ELECTORAL COLLEGE AND BACKGROUND INFO
 ELECTORAL COLLEGE AND BACKGROUND INFO 1. Go to www.270towin.com and select the year 2000 2. How many total popular votes did George W. Bush receive? Al Gore? 3. How many total electoral votes did George
The Impact of Wages on Highway Construction Costs
 The Impact of Wages on Highway Construction Costs Updated Analysis Prepared for the Construction Industry Labor-Management Trust and the National Heavy & Highway Alliance by The Construction Labor Research
NATIONAL VOTER REGISTRATION DAY. September 26, 2017
 NATIONAL VOTER REGISTRATION DAY September 26, 2017 THE PROBLEM Every year millions of Americans find themselves unable to vote because they miss a registration deadline, don t update their registration,
RULE 4.2: COMMUNICATION WITH PERSON REPRESENTED BY COUNSEL
 American Bar Association CPR Policy Implementation Committee Variations of the ABA Model Rules of Professional Conduct RULE 4.2: COMMUNICATION WITH PERSON REPRESENTED BY COUNSEL In representing a client,
FSC-BENEFITED EXPORTS AND JOBS IN 1999: Estimates for Every Congressional District
 FSC-BENEFITED EXPORTS AND JOBS IN 1999: Estimates for Every Congressional District Prepared for National Foreign Trade Council July 2, 2002 National Economic Consulting FSC-BENEFITED EXPORTS AND JOBS IN
14 Pathways Summer 2014
 14 Pathways Summer 2014 Pathways Summer 2014 15 Does Immigration Hurt the Poor? By Giovanni Peri The United States has a famously high poverty rate. In recent years, the Great Recession and the slow recovery
Dynamic Diversity: Projected Changes in U.S. Race and Ethnic Composition 1995 to December 1999
 Dynamic Diversity: Projected Changes in U.S. Race and Ethnic Composition 1995 to 2050 December 1999 DYNAMIC DIVERSITY: PROJECTED CHANGES IN U.S. RACE AND ETHNIC COMPOSITION 1995 TO 2050 The Minority Business
Election Cybersecurity, Voter Registration, and ERIC. David Becker Executive Director, CEIR
 Election Cybersecurity, Voter Registration, and ERIC David Becker Executive Director, CEIR SECURING THE VOTER FILE Prevention Detection Mitigation Prevention White-listing IP addresses Limiting
the polling company, inc./ WomanTrend On behalf of the Center for Security Policy TOPLINE DATA Nationwide Survey among 1,000 Adults (18+)
") Field Dates: September 23-26, 2014 Margin of Error: ±3% SCREENER 1. Gender (RECORDED BY OBSERVATION) 49% MALE 51% FEMALE the polling company, inc./ WomanTrend On behalf of the Center for Security Policy
Field Dates: September 23-26, 2014 Margin of Error: ±3% SCREENER 1. Gender (RECORDED BY OBSERVATION) 49% MALE 51% FEMALE the polling company, inc./ WomanTrend On behalf of the Center for Security Policy
The Progressive Era. 1. reform movement that sought to return control of the government to the people
 Date CHAPTER 17 Form A CHAPTER TEST The Progressive Era Part 1: Main Ideas Write the letter of the term or name that best matches each description. (4 points each) a. Federal Trade Commission f. Susan
How States Can Achieve More Effective Public Safety Policies
 How States Can Achieve More Effective Public Safety Policies Arkansas Legislative Criminal Justice Oversight Task Force and Behavioral Health Treatment Access Task Force July 13, 2015 Marc Pelka, Deputy
RIDE Program Overview
 RIDE Program Overview Region IV Annual Conference May 2017 Table of Contents 1 2 3 Program Overview and the E-Verify Process Fact and Fiction Filling a Critical Gap and a Glance at Identity Fraud? 4 RIDE
SPECIAL EDITION 11/6/14
 SPECIAL EDITION 11/6/14 The document below will provide insights on what the new Senate Majority means, as well as a nationwide view of House, Senate and Gubernatorial election results. We will continue
Public and Subsidized Housing as a Platform for Becoming a United States Citizen
 Public and Subsidized Housing as a Platform for Becoming a United States Citizen John I. Carruthers The George Washington University Natasha T. Duncan Mercyhurst College Brigitte S. Waldorf Purdue University
Next Generation NACo Network BYLAWS Adopted by NACo Board of Directors Revised February, 2017
 Next Generation NACo Network BYLAWS Adopted by NACo Board of Directors Revised February, 2017 I. NAME The name of the organization shall be Next Generation NACo Network, hereinafter called NextGen. NACo
The Shadow Value of Legal Status --A Hedonic Analysis of the Earnings of U.S. Farm Workers 1
 The Shadow Value of Legal Status --A Hedonic Analysis of the Earnings of U.S. Farm Workers 1 June, 3 rd, 2013 Sun Ling Wang 2 Economic Research Service, U.S. Department of Agriculture Daniel Carroll Employment
Trump, Populism and the Economy
 Libby Cantrill, CFA October 2016 Trump, Populism and the Economy This material contains the current opinions of the manager and such opinions are subject to change without notice. This material has been
Chapter 5. Labour Market Equilibrium. McGraw-Hill/Irwin Labor Economics, 4 th edition
 Chapter 5 Labour Market Equilibrium McGraw-Hill/Irwin Labor Economics, 4 th edition Copyright 2008 The McGraw-Hill Companies, Inc. All rights reserved. 5-2 Introduction Labour market equilibrium coordinates
Bylaws of the Prescription Monitoring Information exchange Working Group
 Bylaws of the Prescription Monitoring Information exchange Working Group ` Table of Contents Table of Contents... 2 Article I. Introduction... 6 Article II. Purpose... 6 Article III. Membership... 6 Article
New Population Estimates Show Slight Changes For 2010 Congressional Apportionment, With A Number of States Sitting Close to the Edge
 67 Emerywood Court Manassas, Virginia 202 202 789.2004 tel. or 703 580.7267 703 580.6258 fax Info@electiondataservices.com EMBARGOED UNTIL 6:0 P.M. EST, SUNDAY, SEPTEMBER 26, 200 Date: September 26, 200
By 1970 immigrants from the Americas, Africa, and Asia far outnumbered those from Europe. CANADIAN UNITED STATES CUBAN MEXICAN
 In Search of the American Dream After World War II, millions of immigrants and citizens sought better lives in the United States. More and more immigrants came from Latin America and Asia. Between 940
Trends in Medicaid and CHIP Eligibility Over Time
 REPORT Trends in Medicaid and CHIP Eligibility Over Time August 2015 Prepared by: Samantha Artiga and Elizabeth Cornachione Kaiser Family Foundation Executive Summary... 1 Section 1: Eligibility Trends
A contentious election: How the aftermath is impacting education
 Amy L Dagley, Ph.D. University of Alabama Birmingham Brittany Larkin, Ph.D. Auburn University ELA Annual Conference, San Diego, 2017 A contentious election: How the aftermath is impacting education Each
Ballot Questions in Michigan. Selma Tucker and Ken Sikkema
 Ballot Questions in Michigan Selma Tucker and Ken Sikkema PUBLIC SECTOR PUBLIC CONSULTANTS SECTOR CONSULTANTS @PSCMICHIGAN @PSCMICHIGAN PUBLICSECTORCONSULTANTS.COM Presentation Overview History of ballot
A Note on the Use of County-Level UCR Data: A Response
 1 A Note on the Use of County-Level UCR Data: A Response John R. Lott, Jr. Resident Scholar American Enterprise Institute 115 17 th St, NW Washington, DC 236 jlott@aei.org and John Whitley School of Economics
The Law Library: A Brief Guide
 The Law Library: A Brief Guide I. INTRODUCTION Welcome to the Chase Law Library! Law books may at first appear intimidating, but you will gradually find them logical and easy to use. The Reference Staff
50 State Survey of Bad Faith Law. Does your State encourage bad faith?
 A 50 State Survey of Bad Faith Law. Does your State encourage bad faith? Tort Contract Statute/UCPA Tort Contract Assign Statute Tort Statute //Cap AL Ala. Code 1975 Ala. Code 1975 27-12-24 27-12-24 Cap
Presentation to the Bakery, Confectionery, Tobacco Workers and Grain Millers' International Union. Paul Lemmon July 26, 2010
 Presentation to the Bakery, Confectionery, Tobacco Workers and Grain Millers' International Union Paul Lemmon July 26, 2010 Our Hard Work in 2006 Our Hard Work in 2008 Who We re Fighting Speaker Boehner?
2016 us election results
 1 of 6 11/12/2016 7:35 PM 2016 us election results All News Images Videos Shopping More Search tools About 243,000,000 results (0.86 seconds) 2 WA OR NV CA AK MT ID WY UT CO AZ NM ND MN SD WI NY MI NE
Reporting and Criminal Records
 A project funded by U.S. Department of Labor and U.S. Department of Justice Reporting and Criminal Records Considerations for Writing about People Who Have Criminal Histories June 13, 2018 Presenters Corinne
Kansas Legislator Briefing Book 2019
 Kansas Legislator Briefing Book 2019 I-1 Addressing Abandoned Property Using Legal Tools I-2 Administrative Rule and Regulation Legislative Oversight I-3 Board of Indigents Defense Services I-4 Election
We re Paying Dearly for Bush s Tax Cuts Study Shows Burdens by State from Bush s $87-Billion-Every-51-Days Borrowing Binge
 Citizens for Tax Justice 202-626-3780 September 23, 2003 (9 pp.) Contact: Bob McIntyre We re Paying Dearly for Bush s Tax Cuts Study Shows Burdens by State from Bush s $87-Billion-Every-51-Days Borrowing
Supreme Court Decision What s Next
 Supreme Court Decision What s Next June 3, 2015 Provided by Avalere Disclaimer Organizations may not re use material presented at this AMCP webinar for commercial purposes without the written consent of
WYOMING POPULATION DECLINED SLIGHTLY
 FOR IMMEDIATE RELEASE Wednesday, December 19, 2018 Contact: Dr. Wenlin Liu, Chief Economist WYOMING POPULATION DECLINED SLIGHTLY CHEYENNE -- Wyoming s total resident population contracted to 577,737 in
Drew Kurlowski University of Missouri Columbia
 Kurlowski 1 Simulation of Increased Youth Turnout on the Presidential Election of 2004 Drew Kurlowski University of Missouri Columbia dak6w7@mizzou.edu Abstract Youth voting has become a major issue in
CRAIN S CLEVELAND BUSINESS
 PAID CIRCULATION CRAIN S CLEVELAND BUSINESS Cleveland, Ohio 44113 FIELD SERVED: CRAIN S CLEVELAND BUSINESS serves the general business information needs of executives, managers and professionals in the
Admitting Foreign-Trained Lawyers. Professor Laurel S. Terry Penn State Dickinson School of Law Carlisle, Pennsylvania
 Admitting Foreign-Trained Lawyers National Conference of Bar Examiners Seattle, May 3, 2014 Professor Laurel S. Terry Penn State Dickinson School of Law Carlisle, Pennsylvania LTerry@psu.edu Overview of
Historically, state PM&R societies have operated as independent organizations that advocate on legislative and regulatory proposals.
 PROMOTING STATE PM&R ADVOCACY NEXT STEPS Historically, state PM&R societies have operated as independent organizations that advocate on legislative and regulatory proposals. PROMOTING STATE PM&R ADVOCACY
Unsuccessful Provisional Voting in the 2008 General Election David C. Kimball and Edward B. Foley
 Unsuccessful Provisional Voting in the 2008 General Election David C. Kimball and Edward B. Foley The 2002 Help America Vote Act (HAVA) required most states to adopt or expand procedures for provisional
IRLE. A Comparison of The CPS and NAWS Surveys of Agricultural Workers. IRLE WORKING PAPER #32-91 June 1991
 IRLE IRLE WORKING PAPER #32-91 June 1991 A Comparison of The CPS and Surveys of Agricultural Workers Susan M. Gabbard, Richard Mines, and Jeffrey M. Perloff Cite as: Susan M. Gabbard, Richard Mines, and
Election 2014: The Midterm Results, the ACA and You
 Election 2014: The Midterm Results, the ACA and You James Slotnick, JD Sun Life Financial AVP, Broker Education Join the conversation on Twitter using #SLFElection2014 The Midterm Results The Outlook for
BYLAWS OF THE NATIONAL STUDENT SPEECH LANGUAGE HEARING ASSOCIATION
 1 2 3 4 5 6 7 8 9 10 11 12 13 14 15 16 17 18 19 20 21 22 23 24 25 26 27 28 29 30 31 32 33 34 35 36 37 38 39 40 BYLAWS OF THE NATIONAL STUDENT SPEECH LANGUAGE HEARING ASSOCIATION ARTICLE I Name Section
The Effect of Electoral Geography on Competitive Elections and Partisan Gerrymandering
 The Effect of Electoral Geography on Competitive Elections and Partisan Gerrymandering Jowei Chen University of Michigan jowei@umich.edu http://www.umich.edu/~jowei November 12, 2012 Abstract: How does
Background Checks and Ban the Box Legislation. November 8, 2017
 Background Checks and Ban the Box Legislation November 8, 2017 Presented By Uzo Nwonwu Littler, Kansas City UNwonwu@littler.com, 816.627.4446 Jason Plowman Littler, Kansas City JPlowman@littler.com, 816.627.4435
Congressional Districts Potentially Affected by Shipments to Yucca Mountain, Nevada
 2015 Congressional Districts Potentially Affected by Shipments to Yucca Mountain, Nevada Fred Dilger PhD. Black Mountain Research 10/21/2015 Background On June 16 2008, the Department of Energy (DOE) released
Relationship Between Adult and Minor Guardianship Statutes
 RELATIONSHIP DEFINITION STATES TOTAL Integrated Statutory provisions regarding authority over personal AR, DE, FL, IN, IA, KS, KY, MO, NV, NC, OH, OR, 17 matters are applicable to both adults and minors
Oregon and STEM+ Migration and Educational Attainment by Degree Type among Young Oregonians. Oregon Office of Economic Analysis
 Oregon and STEM+ Migration and Educational Attainment by Degree Type among Young Oregonians 1 What is STEM and STEM+? STEM refers to college degrees where graduates majored in Science, Technology, Engineering
Graduation and Retention Rates of Nonresidents by State
 Graduation and Retention Rates of Nonresidents by State March 2011 Highlights: California, Illinois, and Texas are the states with the largest numbers of nonresidents. Students from Ohio and Wyoming persist
Epicenter Cities and International Education 17th AIEC Melbourne, Victoria Australia
 Epicenter Cities and International Education 17th AIEC Melbourne, Victoria Australia Thursday, 23 October 2003 Todd Davis, Ph.D. Senior Scholar Institute of International Education The idea of the global
RULE 2.10: Judicial Statements on Pending and Impending Cases
 AMERICAN BAR ASSOCIATION CPR POLICY IMPLEMENTATION COMMITTEE COMPARISON OF ABA MODEL CODE OF JUDICIAL CONDUCT AND STATE VARIATIONS RULE 2.10: Judicial Statements on Pending and Impending Cases (A) A judge
Why is Measured Productivity so Low in Agriculture?
 Why is Measured Productivity so Low in Agriculture? Berthold Herrendorf and Todd Schoellman Arizona State University June 6, 2013 Herrendorf and Schoellman Motivation Key Fact about Poor Countries Value
Effective Dispute Resolution Systems and the Vital Role of Stakeholders
 Effective Dispute Resolution Systems and the Vital Role of Stakeholders Region 4 PTAC Summer Working Meeting June 24-25, 2015 Traverse City, Michigan Philip Moses Associate Director The human brain is
Presented by: Ted Bornstein, Dennis Cardoza and Scott Klug
 1 Attorney Advertising Prior results do not guarantee a similar outcome Models used are not clients but may be representative of clients 321 N. Clark Street, Suite 2800,Chicago, IL 60654 312.832.4500 2
Research Brief. Resegregation in Southern Politics? Introduction. Research Empowerment Engagement. November 2011
 Research Brief Resegregation in Southern Politics? David A. Bositis, Ph.D. November 2011 Civic Engagement and Governance Institute Research Empowerment Engagement Introduction Following the election of
Key Facts on Health and Health Care by Race and Ethnicity
 REPORT Key Facts on Health and Health Care by Race and Ethnicity June 2016 Prepared by: Kaiser Family Foundation Disparities in health and health care remain a persistent challenge in the United States.
House Apportionment 2012: States Gaining, Losing, and on the Margin
 House Apportionment 2012: States Gaining, Losing, and on the Margin Royce Crocker Specialist in American National Government August 23, 2013 CRS Report for Congress Prepared for Members and Committees
Federal Education: Of Elections &Politics. Oh, and Policy. Noelle Ellerson December 2014
 Federal Education: Of Elections &Politics. Oh, and Policy. Noelle Ellerson December 2014 Climates & To-Do List Funding State and local budgets have yet to reach prerecession levels Sequestration at the
NATIONAL VOTER SURVEY. November 30 December 3, 2017 N = 1,200 respondents (1/3 Landline, 1/3 Cell, 1/3 Internet) margin of error: +/- 2.
 margin of error: +/- 2.") NATIONAL VOTER SURVEY N = 1,200 respondents (1/3 Landline, 1/3 Cell, 1/3 Internet) margin of error: +/- 2.83% 1 For reference: the 2018 map. When we refer to competitive 2018 Senate states, we are referring
NATIONAL VOTER SURVEY N = 1,200 respondents (1/3 Landline, 1/3 Cell, 1/3 Internet) margin of error: +/- 2.83% 1 For reference: the 2018 map. When we refer to competitive 2018 Senate states, we are referring
Regulating Lawyers in a Global Arena. Conference of Chief Justices Midyear Meeting, Sea Island, Georgia Jan. 28, 2014
 Regulating Lawyers in a Global Arena Conference of Chief Justices Midyear Meeting, Sea Island, Georgia Jan. 28, 2014 Professor Laurel S. Terry Penn State Dickinson School of Law Carlisle, Pennsylvania
Matt Clark, DHS Adam Rose and Detlof von Winterfeldt, CREATE Chris Soares, John Wirth, Treasury
 TO: Matt Clark, DHS Adam Rose and Detlof von Winterfeldt, CREATE Chris Soares, John Wirth, Treasury FROM: Peter Gordon, Jim Moore, JiYoung Park and Harry Richardson, CREATE DATE: January 12, 2007 RE: U.S.
Discussion Paper Series DP
 UKCPR University of Kentucky Center for Poverty Research Discussion Paper Series DP 2011-01 ISSN: 1936-9379 If You Don t Build It... Mexican Mobility Following the U.S. Housing Bust Brian C. Cadena Department
/mediation.htm s/adr.html rograms/adr/
 Alaska Alaska Court System AK http://www.state.ak.us/courts /mediation.htm A variety of programs are offered in courts throughout the state. Alabama Arkansas Alabama Center for AL http://www.alabamaadr.org
Presentation Outline
 2016 Elections November 10, 2016 Grant Couch, Director, Government Relations Christina Lavoie, JD, Assistant Director, Public Policy and Operations Jamie Miller, MBA, Director, Government Relations Presentation
State Legislative Competition in 2012: Redistricting and Party Polarization Drive Decrease In Competition
 October 17, 2012 State Legislative Competition in 2012: Redistricting and Party Polarization Drive Decrease In Competition John J. McGlennon, Ph.D. Government Department Chair and Professor of Government