Researching structural change & inclusive growth
|
|
|
- Noreen Lawson
- 6 years ago
- Views:
Transcription

: Cinar Baymul and Kunal Sen Date: 19 September 2017 Affiliation(s): Global Development Institute, University of")
1 Researching structural change & inclusive growth ESRC GPID Research Network Working Paper Number 2 WHAT DO WE KNOW ABOUT THE RELATIONSHIP BETWEEN STRUCTURAL TRANSFORMATION, INEQUALITY AND POVERTY? Author(s): Cinar Baymul and Kunal Sen Date: 19 September 2017 Affiliation(s): Global Development Institute, University of Manchester (s): Notes: cinar.baymul@manchester.ac.uk Background Paper prepared for ESRC Workshop: Global Poverty and Inequality Dynamics, April 2017
2 ABSTRACT This paper asks what we know about the relationship between structural transformation, inequality and poverty using comparable time-series data for 32 developing and recently developed countries for the post-1950 period. We find that structural change in the majority of our countries has been a move of workers from agriculture to services, and not to manufacturing. This has been accompanied by a fall in the relative productivity of services to agriculture, indicating that structural transformation has not been growth-enhancing for the majority of countries. Countries show different paths of structural transformation which cuts across geographical regions and growth experiences, with a set of 10 countries being structurally developed, another 14 being structurally developing and the remaining 8 countries being structurally under-developed. We see clear differences in the structural transformation-inequality relationship, depending on the stage of structural transformation that a particular country is in. While a movement of workers away from agriculture is unambiguously related to an increase in inequality, we do not see a Kuznets type relationship between manufacturing employment share and inequality when we take into account the different paths of industrialisation that our countries have followed. On the other hand, inequality unambiguously increases with structural transformation, if the movement of workers from agriculture is to services and not to manufacturing. Structural transformation is linked to falling poverty across all categories of countries, though there are differences in the response of poverty to structural transformation, depending on whether the country is structurally developed, developing or under-developed, and whether the movement of workers is from agriculture to manufacturing or to services. Overall, our findings suggest the structural transformation-inequality/poverty relationship depends on the path of structural transformation that a country has followed and whether the shift of employment away from agriculture is towards manufacturing or services. KEYWORDS Structural transformation; inequality; poverty; 2
3 About the GPID research network: The ESRC Global Poverty and Inequality Dynamics (GPID) research network is an international network of academics, civil society organisations, and policymakers. It was launched in 2017 and is funded by the ESRC s Global Challenges Research Fund. The objective of the ESRC GPID Research Network is to build a new research programme that focuses on the relationship between structural change and inclusive growth. See: THE DEVELOPER S DILEMMA The ESRC Global Poverty and Inequality Dynamics (GPID) research network is concerned with what we have called the developer s dilemma. This dilemma is a trade-off between two objectives that developing countries are pursuing. Specifically: 1. Economic development via structural transformation and productivity growth based on the intra- and inter-sectoral reallocation of economic activity. 2. Inclusive growth which is typically defined as broad-based economic growth benefiting the poorer in society in particular. Structural transformation, the former has been thought to push up inequality. Whereas the latter, inclusive growth implies a need for steady or even falling inequality to spread the benefits of growth widely. The developer s dilemma is thus a distribution tension at the heart of economic development. 1
4 1. INTRODUCTION In the recent decades, most developing and emerging countries have seen large shifts of workers from agriculture to manufacturing and services sectors. At the same time, in several countries, inequality has increased, often accompanied by falling poverty. In a famous 1955 paper, Kuznets argued that as low-income countries industrialise, inequality will increase over time as workers move from low productivity agriculture to high productivity manufacturing. Since agriculture tends to be characterised by low inequality while manufacturing is characterised by high inequality, this shift of workers from agriculture to manufacturing will tend to increase overall inequality, though the process of industrialisation will also increase economic growth. Though Kuznets did not explicitly discuss the implications of industrialisation on poverty, it follows from his argument as well as that of Lewis (1954) that industrialisation will be accompanied by sharp falls in poverty as well (Athukorala and Sen 2014). Two complications arise when considering Kuznets thesis from the viewpoint of today. Firstly, very few countries have followed successful industrialisation strategies since the time that Kuznets published his article, and some countries may well be undergoing premature deindustrialisation currently (Rodrik 2016). It is not clear what would be the inequality and poverty implications of the mixed record on industrialisation in developing countries. Secondly, as we will show in this paper, much of the shift of workers from agriculture has been to services, and not to manufacturing. Services, in general, tend to have lower levels of productivity than manufacturing, so it is not obvious that structural change that is biased towards services is necessarily inequality enhancing to the same degree as the agriculture to manufacturing shift in employment. In this paper, we revisit the stylised facts of structural transformation, inequality and poverty, using comparable data on these measures for a range of low, middle and now high income countries in Asia, Africa and Latin America for the period (the end year is 2012 in some cases, and the start year differs across countries, depending on data availability). 1 We ask whether there is a positive relationship between structural transformation and inequality (and a 1 By structural transformation, we mean the movement of workers from low productivity agriculture to higher productivity services and manufacturing (McMillan et al 2014). 1
5 negative relationship with poverty) as had been hypothesised by Kuznets, and whether this relationship may differ across countries which have followed different paths of structural transformation. For the rest of the paper, we first provide a brief literature review of the recent studies on structural transformation. We then describe the data that we use in the paper. We next document the patterns of structural transformation. We then discuss the relationship between structural transformation and inequality, and structural transformation and poverty in turn. We end with a recap of our main findings. 2. LITERATURE REVIEW In recent years, there has been a revival of interest in patterns and determinants of structural transformation/change. In this section, we briefly review the recent literature. Duarte and Restuccia (2010) investigate the role of sectoral labour productivity in shaping sectoral labour reallocation and aggregate productivity experience across countries. Their analysis illustrates the significant differences sectoral differences in productivity across countries and over time, and that these differences explain the broad patterns of structural transformation. Moreover, they also find that productivity differences between rich and poor countries are larger in agriculture and services than manufacturing, and a productivity catch-up of poor countries compared to the US exists in agriculture and industry. Haraguchi and Rezonja (2010) examine the power of income levels in explaining the variations in sectoral outputs. Using data from UN s Industrial Statistics Unit in their simultaneous equation model that integrates both supply and demand side factors, they find that income is the most important determinant of sectoral development and it explains most of the output variations. Dabla-Norris et al. (2013) demonstrate that while country fundamentals, such as income, endowments and population explain a large proportion of the variation in sectoral shares across countries, structural reforms, globalization and other policy and institutional variables also have significant impacts on observed patterns of structural change. Haraguchi (2015) also discusses the three major factors that form the pattern of structural change in manufacturing across countries. According to the author, these are the level of economic development, country-specific factors such as geographic and demographic conditions, and the speed of development. While labour-intensive primary industries provide the major source of employment as countries commence economic development, labour shifts 2
6 to capital and technology intensive industries as average income increases. Haraguchi (2015) argues that the speed of the development process is also essential in determining the structural pattern in manufacturing, as globalization allows countries more opportunities for technological advancement. McMillan et al. s (2014) empirical study highlight the large gaps in labour productivity between the traditional and modern parts of the economy in developing countries. Emphasizing the importance of labour flows from low to high productivity activities in economic development, they show that since 1990, structural change in Africa and Latin America had been growth reducing, with labour moving away from high productivity activities. In the most extensive review of literature on structural transformation to date, Herrendorf et al. (2014) stress the need for more quantitative case studies on the subject in currently poor countries. Through a multisector model of growth, they have built in order to encompass the existing theories on structural transformation; they conduct theoretical and empirical analysis on the economic forces that drive structural transformation. In a more recent study, Rodrik (2016) undertakes to display and explain a puzzling trend of premature deindustrialization in developing countries. The author defines premature deindustrialization as the shift of labour to services sector without undergoing a complete process of industrialization of the economy. The share of industry in total value added output, or total employment, follows an inverted U-shaped pattern. The rapid increase in the share of industry in the early stages of economic development eventually slows down and decreases. However, Rodrik shows that developing countries in Latin America and Africa have reached their industrial peak at lower shares of value added output, or employment, compared to the developed countries or the Asian manufactures exporters. Rodrik argues that premature deindustrialization poses a threat to the growth prospects of developing countries, since reallocation of employment from agriculture to manufacturing where productivity is higher, and increasing in the long term, is a primary source of economic growth. Wood (2017) examines how globalization changed the structural patterns of exports, output and employment in relation to factor endowments around the world. Establishing his analysis around the Augmented Heckscher-Ohlin theory, which states that countries export goods that can be produced by the factors they are relatively well endowed with, and import those that they lack a good supply of factors to produce, Wood (2017) empirically shows that the variation in structural change around the world between 1985 and 2015 confirms the theory. Land abundant countries produce and export primary goods more than skill abundant countries, 3
7 which are more advanced in producing manufactured goods. Wood (2017) also addresses the question of premature deindustrialization, and finds that even though the share of employment and output in manufacturing rose across the land scarce developing world, the land abundant developing regions went through deindustrialization. In addition to the empirical research on describing structural transformation across countries, two recent studies focus on how the reallocation of labour between sectors impact economic growth. Timmer and Vries (2009) construct a modified shift-share method, where they use estimates of the shadow price of labour to measure the difference between average and marginal productivity, to study the contribution of sectors to growth accelerations. They find that productivity increases in market services, commonly regarded as a sector lacking productivity growth, are in fact the largest contributors to economic growth accelerations, followed by productivity increases in manufacturing. Diao et al. (2017) analyse the growth accelerations of countries in the GGDC 10-Sector Database with an emphasis on the developing countries in the sample. According to the authors, within sector labour productivity growth becomes ever more important for labour productivity growth, while the importance of structural change decreases after the initial stages of economic development. Productivity increase in modern sectors is vital for long-term development, even though their model also suggests that rapid productivity growth in agriculture played an important role in Africa as a driver of growthincreasing structural change. However, this change in Africa was accompanied by declining labour productivity in modern sectors. Lastly, in their study to explain the determinants of income inequality, Jaumotte et al. (2013), also control for the shares of employment in agriculture and industry, and relative labour productivities. They expect the labour shift away from agriculture to industry, and the relative productivity increase in agriculture to have inequality reducing effects. The authors find that an increase in the share of employment of industry reduces income inequality; however, they advise caution in drawing conclusions due to the methodological concerns arising from the short and unbalanced panel dataset that they use. Apart from the Jaumotte et al. (2013) study, none of the recent studies look at the relationship between structural change, inequality and poverty in developing countries. In this note, we examine the relationship between structural change, inequality and poverty for 32 developing and emerging countries for which we have comparable data for a reasonably long period of time. 4
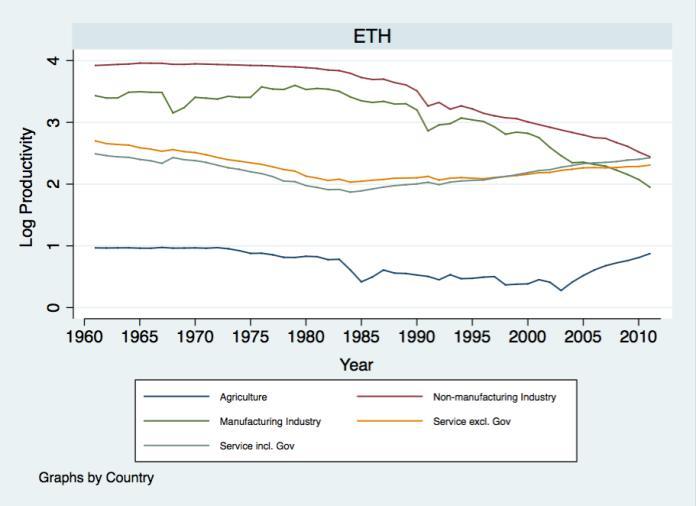
8 3. DATA In this section, we describe the data we use in the analysis of structural transformation, inequality and poverty. Structural Change: Data on structural change in countries is taken from Groningen Growth and Development Centre s (GGDC) 10-Sector Database. GGDC s 10-Sector Database includes data for 42 countries covering a time span from 1950 to We have excluded countries from Europe, Japan and the USA from our sample, which left us with 32 countries from four geographic regions. A list of countries in our sample with the time period that the data cover is given in Table 1. The GGDC database consists of annual series for the gross value-added output and the number of people employed in agriculture, mining, manufacturing, utilities, construction, trade services, transport services, business services, government services and personal services. We have grouped these ten sectors into four main categories as follows: Categories Agricultural Sector Manufacturing Industry Non-manufacturing Industry Service Sector Sectors Agriculture Manufacturing Mining + Utilities + Construction Trade Services + Transport Services + Business Services + Government Services + Personal Services However, annual series for government services are missing for eight countries, while an additional two countries lack series on personal services 2. For these countries, the service sector excludes the missing series. 2 Bolivia, Chile, Colombia, Peru, Singapore, South Korea, Venezuela and Zambia do not have data on government services. Egypt and Morocco do not have data on personal services. In addition, Indonesia lack both only in one year,
9 Table 1. List of Countries in our Sample Region Country Value Added Data Employment Data Botswana Ethiopia Ghana Kenya Sub-Saharan Africa Malawi Mauritius Nigeria Senegal South Africa Tanzania Zambia North Africa Egypt Morocco China Hong Kong India Indonesia Asia South Korea Malaysia Philippines Singapore Taiwan Thailand Argentina Bolivia Brazil Latin America Chile Colombia Costa Rica Mexico Peru Venezuela Gross value added data is taken from national income accounts of the various countries and compiled according to the UN System of National Accounts (SNA). The 10 sectors have been classified using the International Standard Industrial Classification (ISIC), Revision 3.1. Using the ISIC classification of manufacturing instead of the narrower SITC classification implies that primary processed products are also included in the definition of manufacturing. Employment is defined as all persons engaged, thus including all paid employees but also selfemployed and family workers. This implies that the GGDC employment data includes both 6
10 the formal and informal sectors. The primary source of the employment data is the population census, supplemented by labour force and business surveys (De Vries et al. 2015) The share of employment for the four main categories is calculated by dividing the number of people employed in each category by the total number of people employed in the country in a given year. Productivity in each category is calculated by dividing the value-added output in constant 2005 local currency by the number of people employed. GGDC provides the highest quality of data available on sectoral output across countries, however, it is also subject to certain limitations, which can raise concerns when the data is used to calculate productivity. The first set of limitations relate to the quality of the source data, and the extent to which they include the informal sector. Quality of data on the sectoral value-added output published by national statistical agencies of the under-developed countries can be unsatisfactory, and whether the data successfully account for the informal sector depends on the quality of the national sources. On the other hand, as the annual series on the number of people employed in each sector is obtained from census data and household surveys by the GGDC researchers, they are more likely to capture informal employment. Income Inequality: Income inequality data is taken from the standardized income inequality dataset computed by Shorrocks and Baymul (forthcoming). The Gini coefficient, calculated from household surveys, is the most commonly used measure of inequality. However, due to conceptual and methodological differences between household surveys, comparability of inequality data is an issue that troubles empirical researchers. The standardized dataset used in this research tries to enhance comparability by adjusting all available data that exceeds a quality threshold from various sources through a regression adjustment method that includes an extensive list of independent variables. Despite generating the highest number of individual annual observations per country compared to any other available dataset, the number of observations still vary between countries and sometimes a standardized observation cannot be produced, as in the case of Taiwan. In this paper, we use Gini coefficients that indicate the net income per capita inequality. Income shares of the bottom 40% of the population is also standardized when available. It is important to note that standardized income inequality data is prone to measurement errors made in source data. Measurement errors could be especially problematic in least developed countries where the quality of the data collection methods is questionable. 7
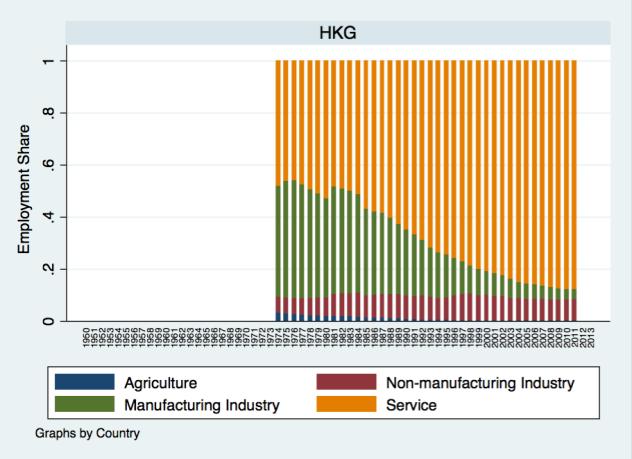
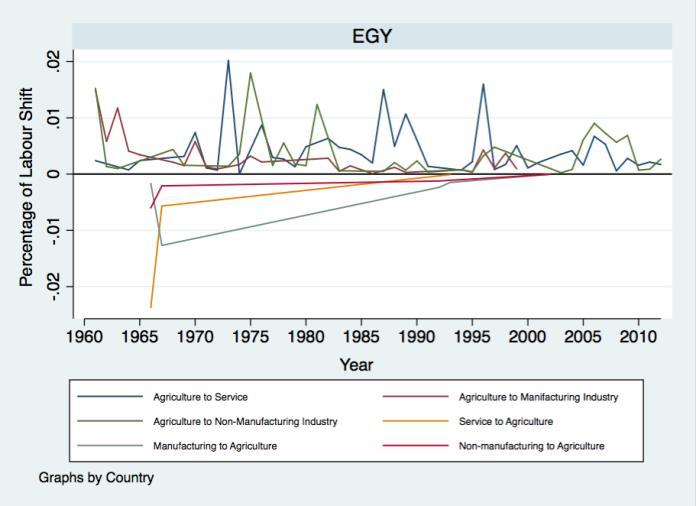
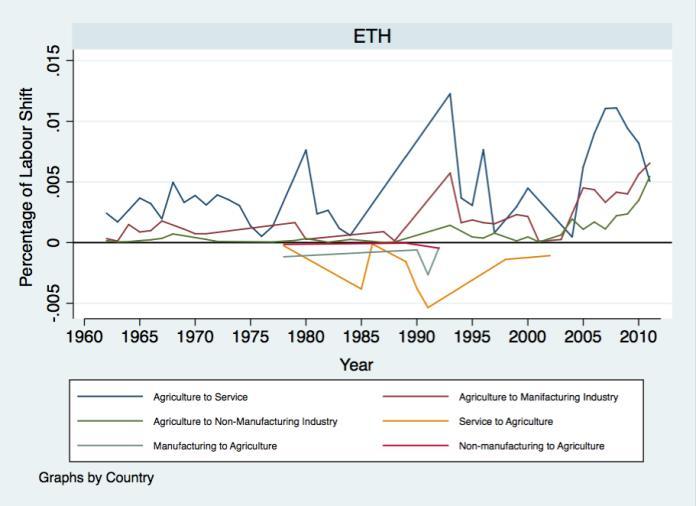
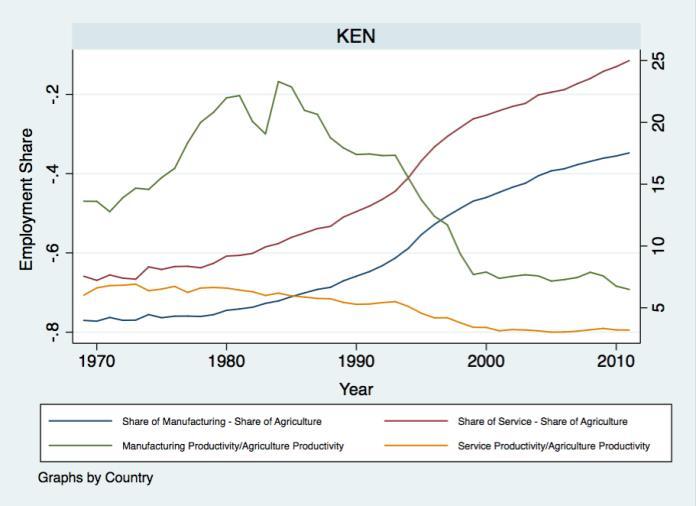
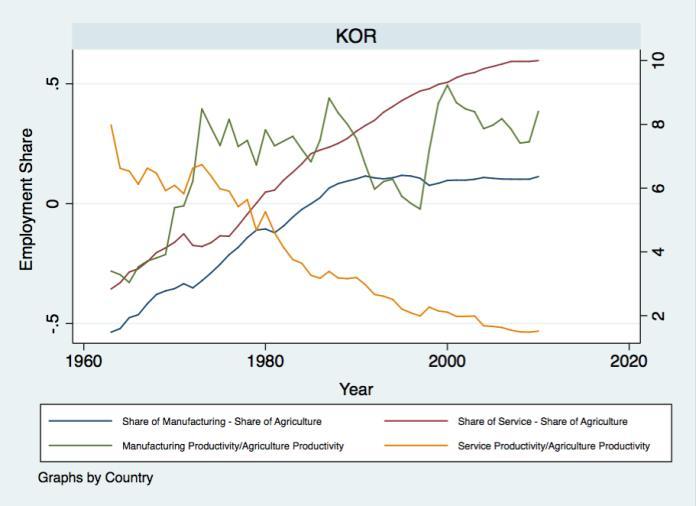
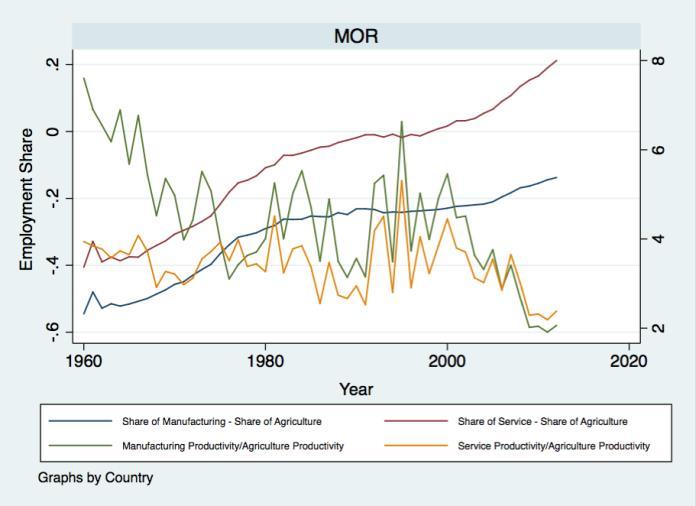
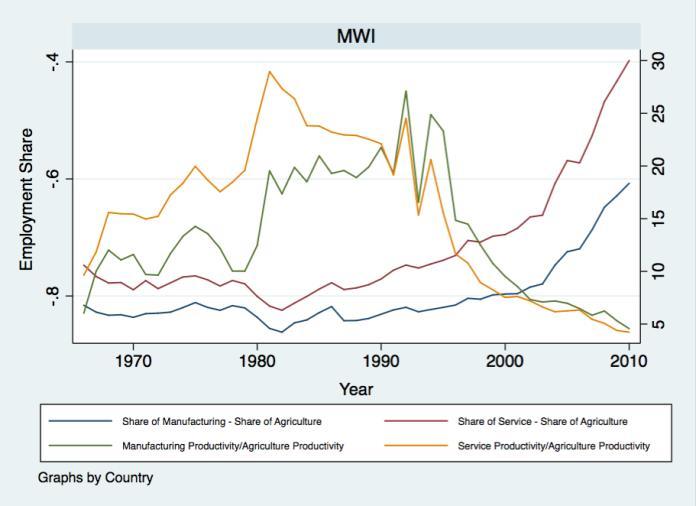
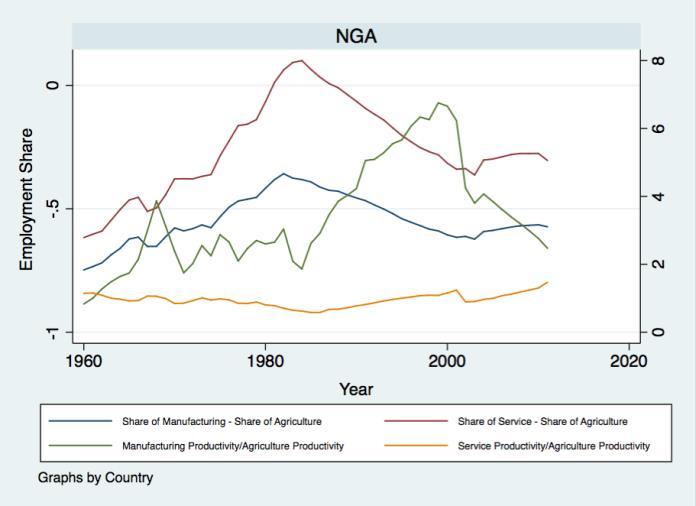
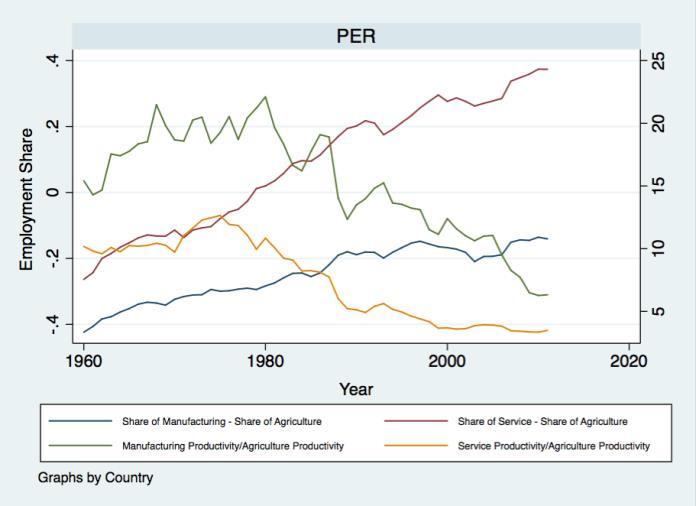
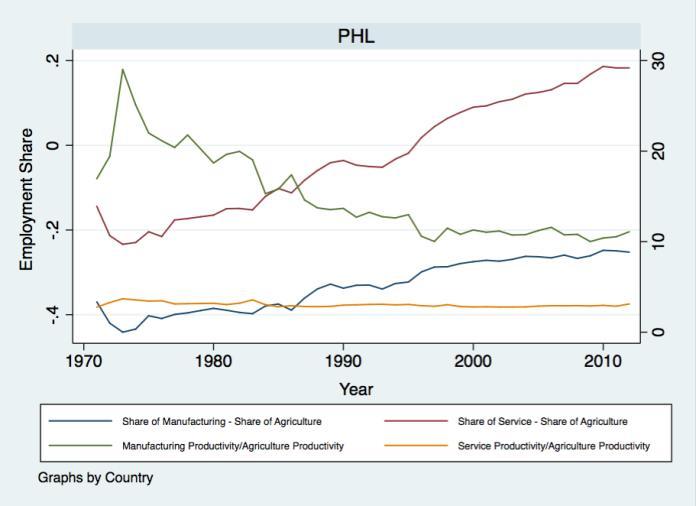
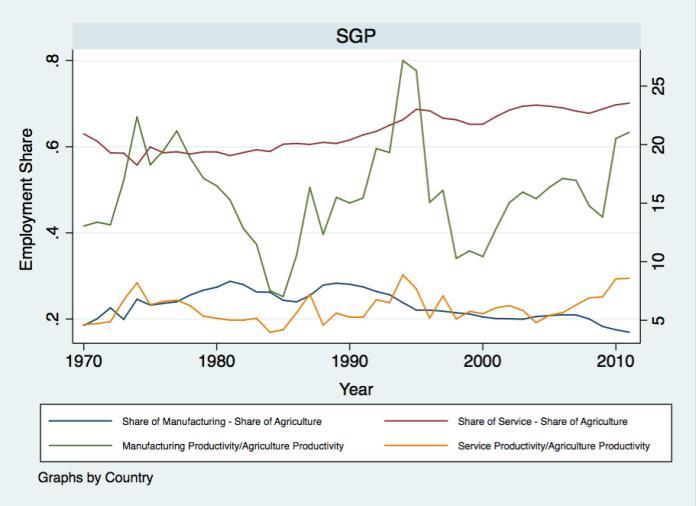
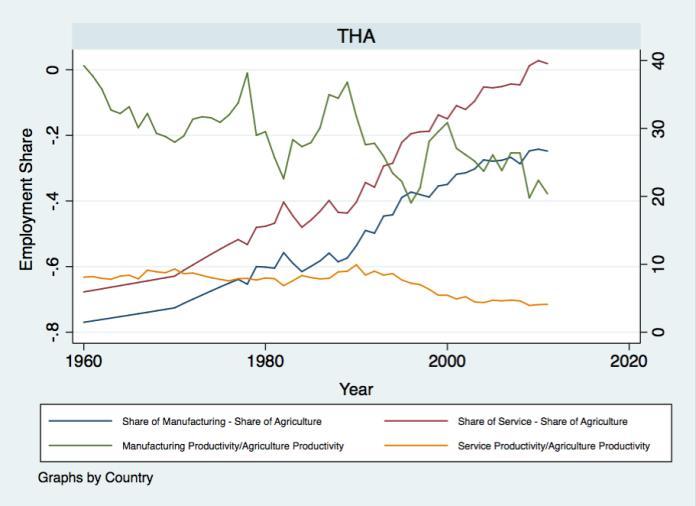
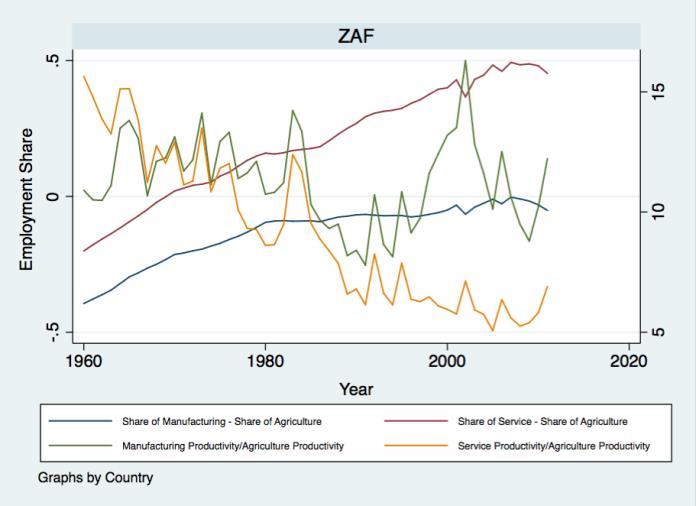
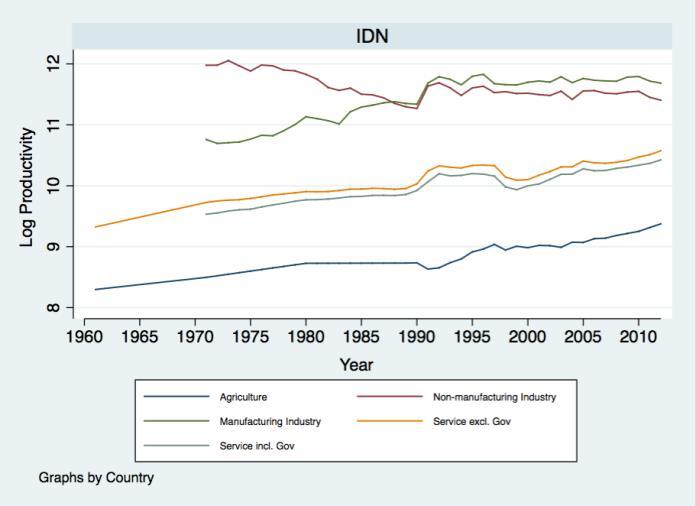
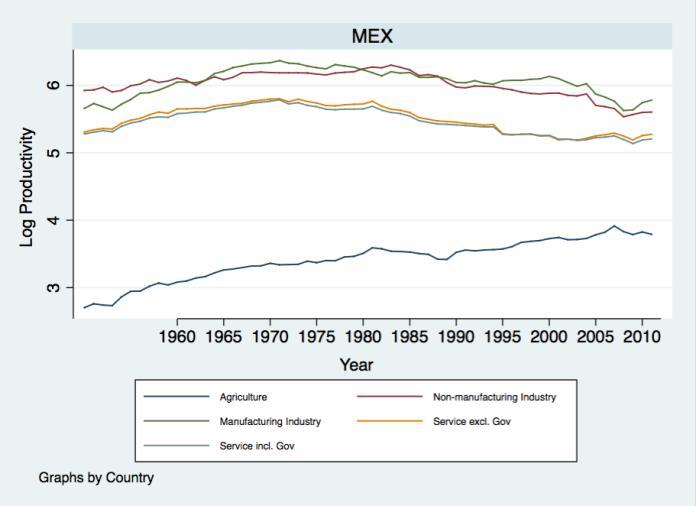
11 Poverty: The indicator of preference to measure poverty in countries is the poverty headcount ratio at $1.90 a day. Data is taken primarily from the World Bank s PovcalNet Data published in February 2016, and complemented by data from the World Bank s World Development Indicators (WDI). The headcount ratio is the percentage of people living under the income threshold depicting the poverty line, which is evaluated at $1.90 a day. When needed, population data from WDI is used to calculate absolute poverty, which is the total number of people living under the poverty line. 4. PATTERNS OF STRUCTURAL TRANSFORMATİON A striking feature of structural transformation in our 32 countries is that the movement of employment from agriculture has been mostly to services (Figure A1). We observe an agriculture to manufacturing shift in employment for an appreciably long period only for North East and South East Asian countries and for Mauritius. Even for these latter set of countries, the share of manufacturing in total employment shows a hump shape in the case of Korea, Hong Kong, Malaysia, Mauritius, Singapore, and Taiwan, which suggest that the share of employment in manufacturing has reached its peak and now falling steadily over time. Labour shifts from agriculture to manufacturing and services take place gradually, even though countries do experience shocks that create abrupt changes in the sectoral decomposition of labour (Figure A2). A second striking feature of structural transformation has been that the shift of employment from agriculture to services has been accompanied by falling productivity of services to agriculture (Figure A3). The productivity of services compared to the productivity in agriculture has seen a steady increase only in Botswana, China, Hong Kong, India and Zambia. Productivity in manufacturing has also stagnated or decreased for most countries, with the exception of Botswana, China, Korea, Malaysia, Taiwan and Zambia (Figure A4). Productivity in manufacturing has also stagnated or decreased for most countries, with the exception of Botswana, China, Korea, Malaysia, Taiwan and Zambia. The large shift of employment from agriculture to services accompanied by falling relative productivity of services suggests that structural transformation in most developing countries (barring a few countries in Asia) has not been growth enhancing. This has implications for the possible effects that structural transformation may have on inequality and poverty, which we explore next. 8


12 Figure 1. Shifts in Employment between Sectors and Relative Labour Productivity Figure 2. Shifts in Employment between Sectors and Relative Labour Productivity in Structurally Developed Countries Figure 3. Shifts in Employment between Sectors and Relative Labour Productivity in Structurally Developing Countries Figure 4. Shifts in Employment between Sectors and Relative Labour Productivity in Structurally Under-Developed Countries The country level graphs in Figures A1-A4 show very different patterns of structural transformation which cut across geographical region. To help with the interpretation of the country level graphs, we categorize the countries in our sample into three groups that we call Structurally Under-Developed, Structurally Developing and Structurally Developed. We define structurally under-developed countries as countries where agriculture is the largest sector in terms of the number of people employed in the most recent time period available. In our sample, these countries are Ethiopia, India, Kenya, Malawi, Nigeria, Senegal, Tanzania and Zambia. These countries are all in Sub-Saharan Africa, with only India being the non-african country. Structurally developing countries are where more people are employed in the services sector than agriculture, with agriculture being the second largest sector. Bolivia, Botswana, 9
13 Brazil, China, Colombia, Costa Rica, Egypt, Ghana, Indonesia, Morocco, Peru, Philippines, Thailand and South Africa are structurally developing countries according to our definition. These countries span all three continents Africa, Asia and Latin America. Lastly, structurally developed countries are counties that have more people employed in manufacturing sector than agriculture. These countries in the sample are Argentina, Chile, Hong Kong, Korea, Malaysia, Mauritius, Mexico, Singapore, Taiwan, and Venezuela. These countries are either in East Asia or Latin America (with the exception of Mauritius, which is in Africa). We note that within each category, average growth rates of GDP per capita has differed significantly across countries, suggesting a weak link between stages of structural transformation and economic growth (Figure A7). For example, in the structurally developed group of countries, the Latin American countries show lower growth rates than the other countries than the Asian countries. Similarly, for the structurally underdeveloped category, India s growth rate has exceeded those of the African countries. For the structurally developing category, we have fast growers such as Botswana and Egypt and slow growers such as South Africa. We present summary graphs of paths of structural transformation, first for all countries (Figure 1), and then by the country categories as defined above (Figures 2, 3 and 4). In the full sample, we see the steady movement of labour from agriculture to services. However, as already noted, this move of workers to services is not supported by increases in the relative productivity in that sector. Even though agriculture remains the sector with lowest productivity in all country groups, its relative productivity has increased greatly in the previous 30 years. The average share of employment in the service sector has surpassed the share of employment in agriculture in mid-90s. Structurally developed countries have passed this level prior to 1980, while the share of employment in their manufacturing sectors has stayed relatively stable with a slight decrease in the relative productivity of manufacturing. Despite decreasing relative productivity compared to agriculture, labour shares of both services and manufacturing have been increasing over the 30-year period for structurally developing and under-developed countries. Structurally under-developed countries started to experience significant labour shifts from agriculture to other sectors only from mid-1990s onwards. 10
14 5. STRUCTURAL TRANSFORMATION AND INEQUALITY What is the relationship between structural transformation and inequality? Figures 5-10 show the pooled relationship between structural transformation and two measures of inequality the net income per capita Gini and the income share of the bottom 40 per cent. Country graphs of this relationship are available in the Appendix, Figure A5. We summarise the key relationships between structural transformation and inequality, first for the overall sample in Figures 5-7, and then by the three groups of countries: a) structurally developed, b) structurally developing) and c) structurally under-developed in Figures 8, 9 and 10 respectively. We focus on the relationship between structural transformation and the net income Gini as the relationship between structural transformation and the income share of the bottom 40 per cent of the population is broadly similar. Agriculture vs Inequality In the overall sample, we see evidence of the Kuznets curve with an increase in inequality (whether measured by the net income Gini or the income share of the bottom 40 per cent of the population), then a decrease with a fall in the share of employment in agriculture (Figure 5). In structurally developed countries, we see that as the share of agriculture in employment decreases, inequality follows an inverted U-shaped pattern (Figure 8). It first increases, peaking around when agriculture s share is around 20% of total employment. Inequality reduces once its share drops below this level. In structurally developing and underdeveloped countries, we only witness the first half of the transformation, where agriculture s share has not declined below 20% yet for most countries, and inequality has been increasing while agriculture s share drops (Figures 9 and 10). Developed: Inverted U Developing: Lower Agriculture Higher Inequality & Lower Bottom 40 Income Under-developed: Lower Agriculture Higher Inequality (weakly U shaped) & Lower Bottom 40 income 11
.")

. Figure 5. Employment share in Agriculture vs Income Inequality Figure 6.")
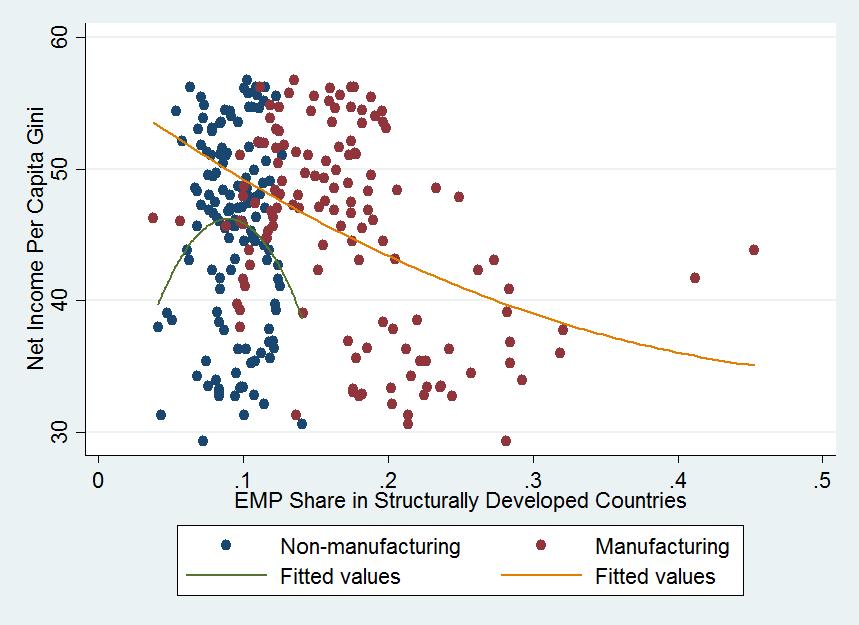
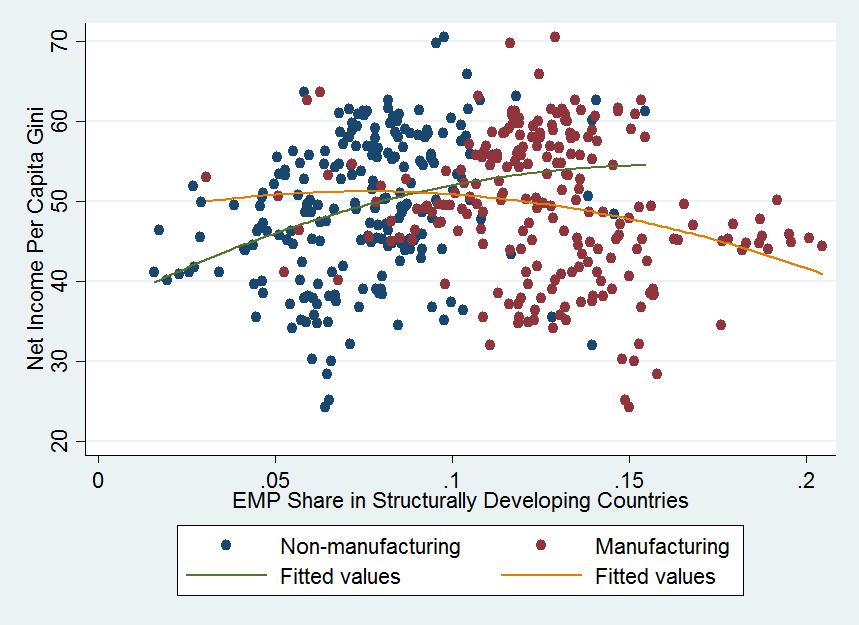
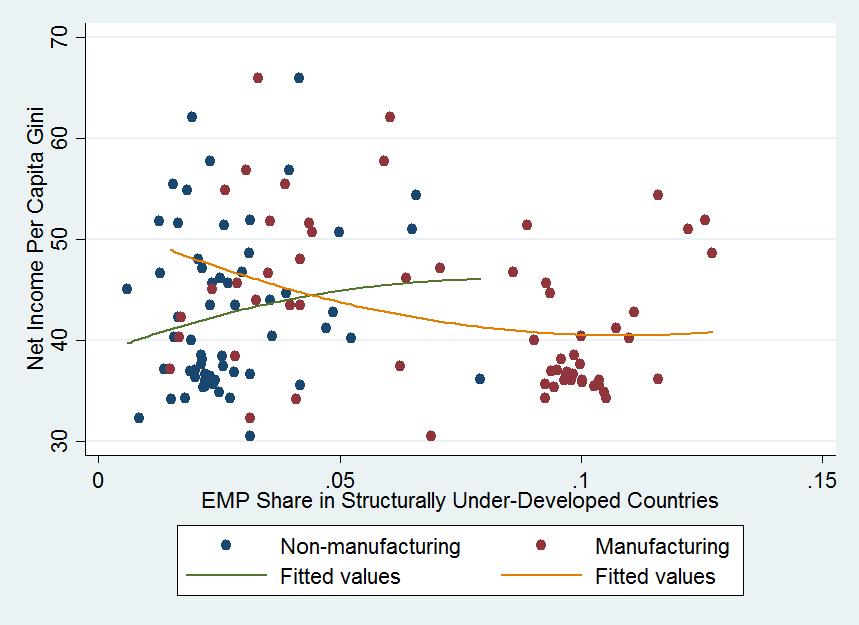
15 Manufacturing vs Inequality In the overall sample, we do not see any clear relationship between the share of employment in manufacturing/non-manufacturing industry and inequality (Figure 6). As the share of manufacturing increases in structurally developed countries, inequality decreases (Figure 8). There is weaker evidence of this relationship for developing and under-developed countries, likely because they have not yet reached the level of development that is necessary to foster a more equal distribution of income (Figures 9 and 10). Figure 5. Employment share in Agriculture vs Income Inequality Figure 6. Employment share in Industry vs Income Inequality 12
16 Developed: Higher Manufacturing Lower inequality & higher bottom 40 income Non-manufacturing U shaped but could actually be a vertical line Developing: Higher Manufacturing Lower inequality, weakly inverted U shape Under-developed: Higher Manufacturing Lower inequality However, one problem in assessing the relationship between manufacturing employment share and inequality is that the share of manufacturing in total employment does not show a clear monotonic relationship with time. This is in contrast to the behaviour of the share of agriculture in total employment and the share of services in total employment, both of which show a clear monotonic relationship with time (in the case of agriculture, its share in total employment falls over time for our sample countries, and in the case of services, its share increases more or less continuously over time for our sample countries). As is clear from Figure A1 in the Appendix, countries undergo the following patterns in the share of manufacturing in total employment over time: a) a hump shape (increasing, then decreasing), b) continuously increasing, c) continuously decreasing and d) no discernible movement. This suggests that a scatter plot of inequality against manufacturing employment share may be simply capturing cross-sectional differences in the relationship of inequality with manufacturing employment share across the sample countries, in contrast to the scatters of inequality against agricultural and services employment share which capture both time-series and cross-sectional variation in the relationship (in the case of the inequality-agriculture scatter, a movement in the graph from right to left in the horizontal axis is a movement in time, while in the case of the inequality-services scatter, a movement in the graph from left to right in the horizontal axis is a movement in time). In order to further analyse the relationship between inequality and manufacturing employment share, we have separated the countries in which we observe a hump in manufacturing employment. We define these humps as a steady increase in manufacturing from time t to time t+1, and then a decrease from t+1 onwards. Hence countries reach the peak levels of employment in manufacturing at t+1, where t can be different for each county. We call the increase in manufacturing in time-period t, Development Stage 1, the peak at t+1 Development Stage 2, and the following decline Development Stage 3. Taking the closest net income Gini 13


17 coefficients corresponding to each stage for each country, we produced the graphs in Figure 7. Graphs on the left-hand side show the movement of Gini coefficients through the three development stages, for countries that we observe the hump. Other countries might be on the first or third stage of development during the entire time period of the sample. Graphs depicting the same relationship are on the right-hand side for all countries. We do not observe any meaningful relationship between income inequality and the development stages of different countries. Whether we confine our analysis to the countries with a hump shape in manufacturing employment share or include all countries for which we have inequality data over the time-period, we do not observe a common relationship between manufacturing employment share and inequality over time across our sample countries. This clearly shows the lack of a Kuznets type relationship across all countries, with a great deal of heterogeneity in the response of inequality to manufacturing driven structural transformation across countries. In fact, we do not see a Kuznets type relationship for any of the 32 countries in our sample. Figure 7. Inequality in Different Development Stages Countries with a hump in manufacturing All Countries employment share 14

.")


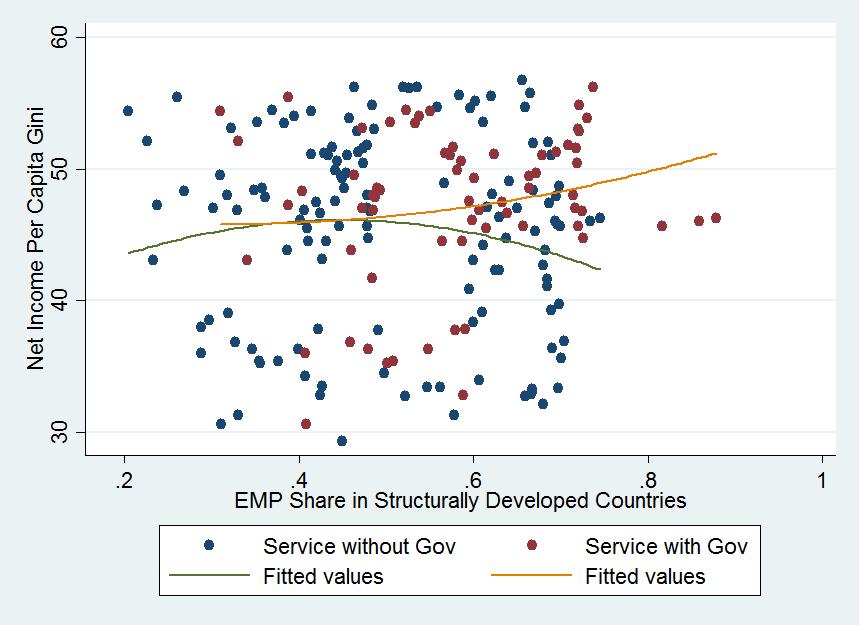
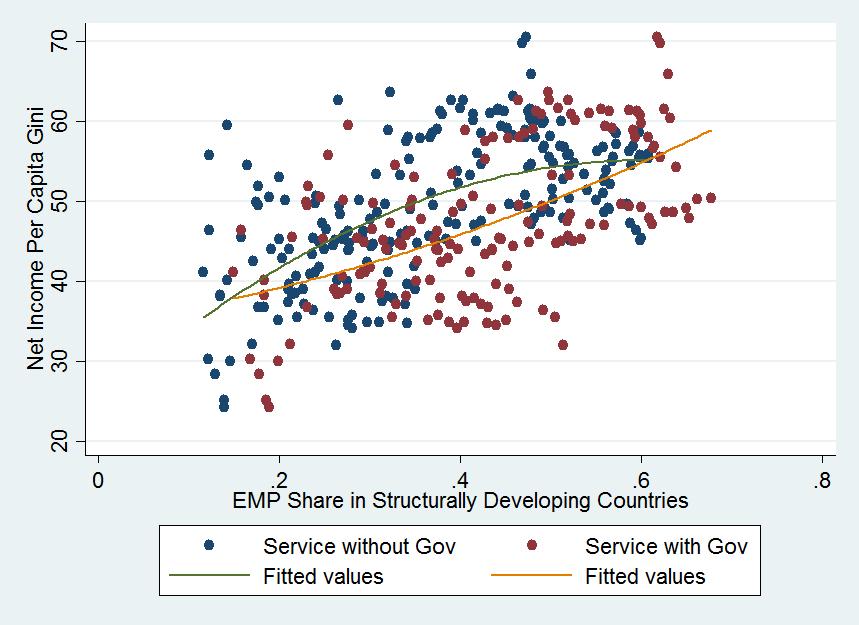
18 Service vs Inequality Higher shares of service sector employment are associated with higher inequality in all country groups, with the correlation being especially strong in structurally developing countries (Figures 8-11). Higher Service Higher inequality in all groups Figure 8. Employment share in Services vs Income Inequality Figure 9. Agriculture, Industry and Services vs Income Inequality in Structurally Developed Countries Figure 10. Agriculture, Industry and Services vs Income Inequality in Structurally Developing Countries 15
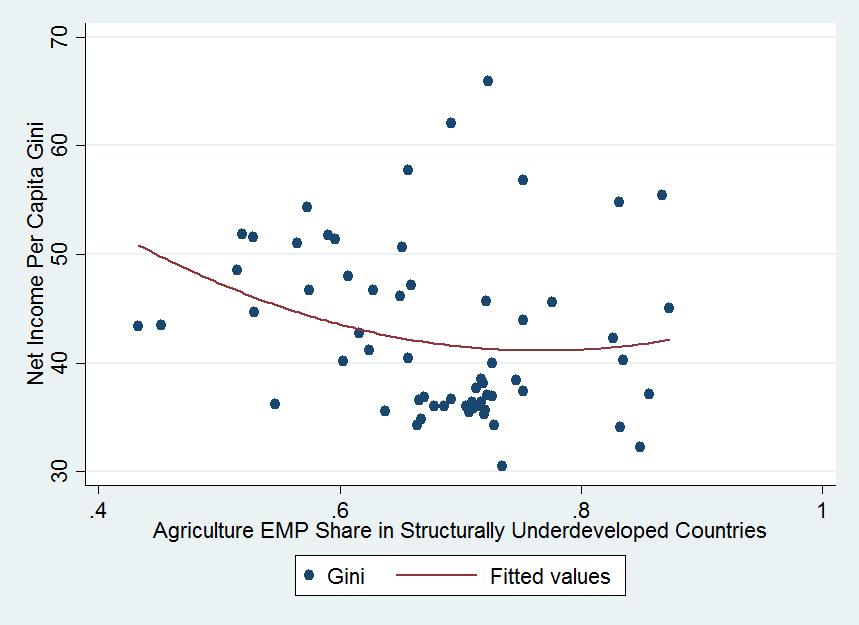
19 Figure 11. Agriculture, Industry and Services vs Income Inequality in Structurally Under- Developed Countries 16

20 6. STRUCTURAL TRANSFORMATION AND POVERTY Figures show the pooled relationship between structural transformation and poverty, as measured by the headcount ratio. Country graphs of this relationship are available in the Appendix, Figure A6. We summarise the key relationships between structural transformation and poverty, and then by the three groups of countries: a) structurally developed, b) structurally developing) and c) structurally under-developed. Agriculture vs Poverty A shift from agriculture to other sectors reduces poverty in all country groups (Figures 12-15). Lower agriculture Lower poverty in all groups Manufacturing vs Poverty There is a U-shaped relationship between the share of employment in manufacturing/nonmanufacturing industry and headcount poverty (Figure 12). The relationship between manufacturing and poverty in structurally developed countries is not clear due to outliers that shift the right end of the curve upwards (Figure 13). If outliers were taken out, we are likely seeing the poverty reducing impact of manufacturing. Despite the outliers, manufacturing does reduce poverty in structurally developing countries, while non-manufacturing industry has a U- shaped impact on poverty (Figure 14). A rise in the share of manufacturing, or nonmanufacturing, in total employment significantly reduces poverty in structurally underdeveloped countries (Figure 15) 17


21 Figure 12. Agriculture, Industry and Services vs Poverty Headcount Ratio in the Entire Sample Figure 13. Agriculture, Industry and Services vs Poverty Headcount Ratio in Structurally Developed Countries 18


22 Developed: Developing: Under-developed: Manufacturing U-shaped but could be lowering poverty if outliers are taken out Non-manufacturing Inverted-U shaped but could actually be a vertical line Higher Manufacturing Lower poverty but weak. Non-manufacturing U shaped Higher Manufacturing Lower poverty Service vs Poverty There is a clear negative relationship between share of employment in services and headcount poverty (Figure 12). A strong negative correlation between higher share of service and poverty exists in structurally developing countries, while the relationship between the two follows a U- shaped pattern in structurally developed countries (Figures 13 and 14). The shift to service does not seem to have a meaningful impact on poverty in under-developed countries (Figure 15). Developed: Developing: Higher service Lower poverty Higher service Lower poverty Figure 14. Agriculture, Industry and Services vs Poverty Headcount Ratio in Structurally Developing Countries Figure 15. Agriculture, Industry and Services vs Poverty Headcount Ratio in Structurally Under-Developed Countries 19

, suggesting that structural")
 The countries in our sample have shown different paths of structural transformation which cuts across geographical regions.")
23 7. CONCLUSIONS We can summarise the main findings of our paper as follows: i) Structural transformation in the majority of our 32 countries has been a move of workers from agriculture to services, and not to manufacturing. Further, the move of workers from agriculture to services (and to manufacturing, wherever it has occurred) has been accompanied by a fall in the relative productivity of services and manufacturing to agriculture (barring a few countries in North and South East Asia), suggesting that structural transformation has, on the whole, not been growth enhancing. ii) The countries in our sample have shown different paths of structural transformation which cuts across geographical regions. A set of countries can be categorised as structurally developed as the number of workers employed in manufacturing exceeds the number of workers in agriculture. These countries are Argentina, Chile, 20
24 iii) iv) Hong Kong, Korea, Malaysia, Mauritius, Mexico, Singapore, Taiwan, and Venezuela. Structurally under-developed countries have agriculture as the largest sector in terms of the number of people employed in the most recent time period available. In our sample, these countries are Ethiopia, India, Kenya, Malawi, Nigeria, Senegal, Tanzania and Zambia. Structurally developing countries are where more people are employed in the services sector than agriculture, with agriculture being the second largest sector. Bolivia, Botswana, Brazil, China, Colombia, Costa Rica, Egypt, Ghana, Indonesia, Morocco, Peru, Philippines, Thailand and South Africa are structurally developing countries according to our definition. If we use look at the relationship of the share of agriculture in total employment and inequality, we we see a Kuznets type inverted U relationship for structurally developed countries. For structurally developing and under-developed countries, a lower employment share in agriculture is accompanied by higher inequality However, we do not observe a Kuznets relationship between the share of manufacturing in total employment and inequality. This is particularly evident when we take into account the different paths of industrialisation that developing countries have followed. However, a shift to services unambigously increases inequality in all categories of countries with different types of structural transformation. This suggests that contrary to Kuznets argument, the move of employment from agriculture to manufacturing is not necessarily inequality enhancing. On the other hand, a move from agriculture to services clearly is. Structural transformation is broadly linked to falling poverty across all categories of countries. Within this overall finding, there are differences in the response of poverty to structural change, depending on whether the country is structurally developed, developing or under-developed, and whether the movement of workers is from agriculture to manufacturing or to services. 21
25 REFERENCES Athukorala, P. and K. Sen (2014), Industrialization, Employment and Poverty, in J. Weiss and M. Tribe (eds.), Routledge Handbook of Industry and Development London: Routledge, pp Dabla-Norris, E., Thomas, A.H., Garcia-Verdu, R. and Chen, Y. (2013). Benchmarking structural transformation across the world. De Vries, G., de Vries, K., Gouma, R., Pahl, S. and Timmer, M. (2015). GGDC 10-Sector Database: Contents, Sources and Methods. Diao, X., McMillan, M. and Rodrik, D. (2017). The recent growth boom in developing economies: A structural change perspective (No. w23132). NBER. Duarte, M. and Restuccia, D. (2010). The role of the structural transformation in aggregate productivity. The Quarterly Journal of Economics, 125(1), pp Haraguchi, N. and Rezonja, G. (2010). Patterns of Manufacturing Development Revisited. United Nations Industrial Development Organization. Haraguchi, N. (2015). Patterns of structural change and manufacturing development. Routledge Handbooks Online. Herrendorf, B., Rogerson, R. and Valentinyi, Á. (2014). Growth and Structural Transformation. Handbook of Economic Growth, 2, pp Jaumotte, F., Lall, S. and Papageorgiou, C. (2013). Rising income inequality: technology, or trade and financial globalization?. IMF Economic Review, 61(2), pp Kuznets, S. (1955), Economic Growth and Income Inequality, American Economic Review, Vol. 45, No. 1, pp Lewis, W. A. (1954), "Economic development with unlimited supplies of labour.", The Manchester School 22(2), McMillan, M., Rodrik, D. and Verduzco-Gallo, Í. (2014). Globalization, structural change, and productivity growth, with an update on Africa. World Development, 63(1), Rodrik, D., (2016). Premature deindustrialization. Journal of Economic Growth, 21(1), Timmer, M.P. and de Vries, G.J. (2009). Structural change and growth accelerations in Asia and Latin America: a new sectoral data set. Cliometrica, 3(2), pp Wood, A. (2017). Variation in structural change around the world, WIDER Working Paper 2017/34. 22

26 APPENDIX Figure A1. Structural Transformation Over Time 23
27 24
28 25
29 26
30 27
31 Figure A2. Movements to and from Agriculture Over Time 28
32 29
33 30
34 31
35 32

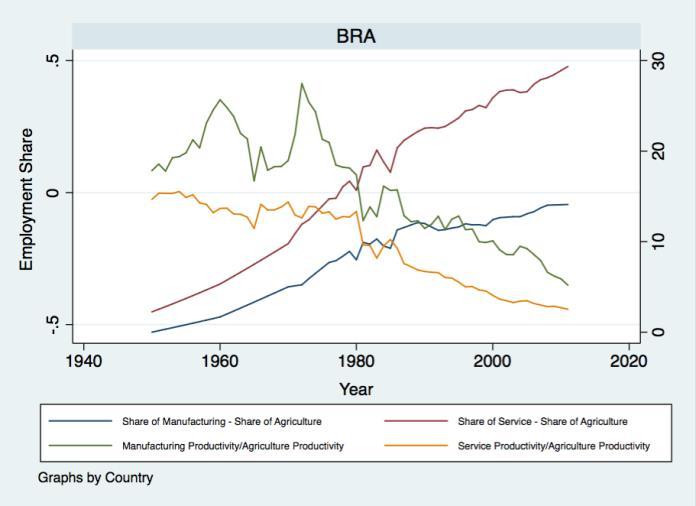
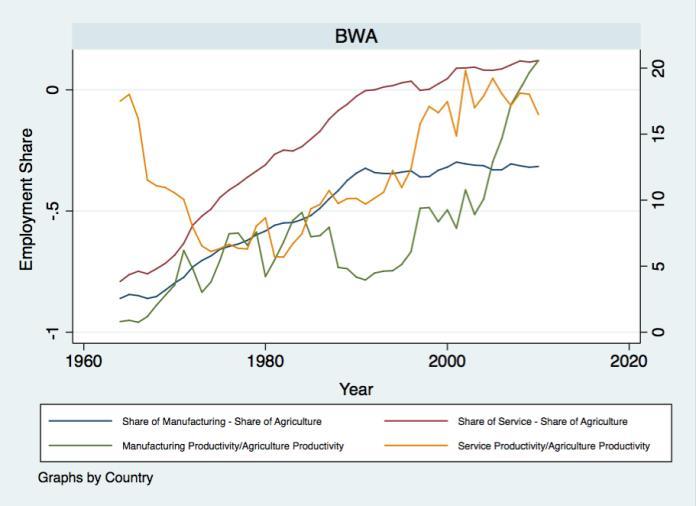
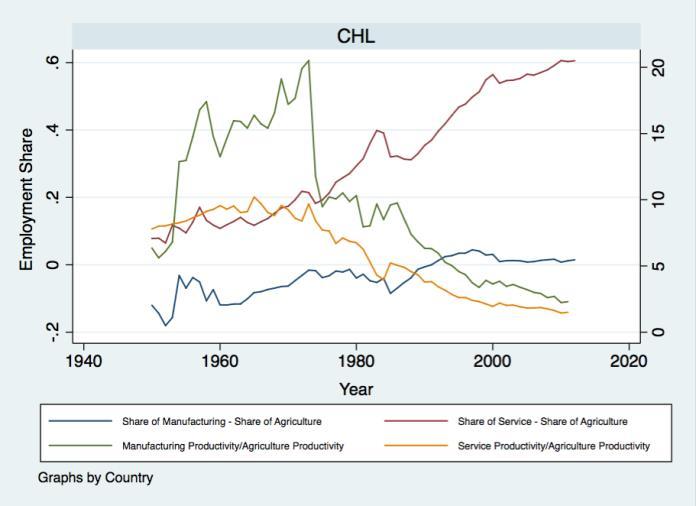
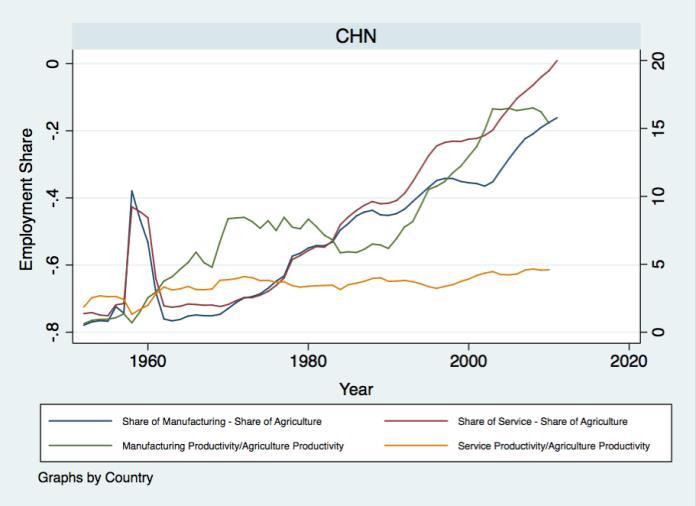
36 Figure A3. Shifts in Employment between Sectors and Relative Labour Productivity 33
37 34
38 35
39 36
40 37

41 Figure A4. Labour Productivity over Time 38
42 39
43 40
44 41
45 42
46 Figure A5. Structural Transformation and Inequality Plots of Share of Agriculture in Employment, Share of Manufacturing in Employment and Share of Services in Employment against Net Income Per Capita Gini and Income Share of Bottom 40 per cent by Country 43
47 44
48 45
 Plots of Share of Agriculture in Employment, Share of")
49 Figure A6. Structural Transformation and Poverty (Headcount Ratio) Plots of Share of Agriculture in Employment, Share of Manufacturing in Employment and Share of Services in Employment against Headcount Ratio by Country 46


50 Figure A7. Average GDP per capita Growth Rate by Country 47
51 List of Country Abbreviations ARG BOL BRA BWA CHL CHN COL CRI EGY ETH GHA HKG IDN IND KEN KOR MEX MOR MUS MWI MYS NGA PER PHL SEN SGP THA TWN TZA VEN ZAF ZMB Argentina Bolivia Brazil Botswana Chile China Colombia Costa Rica Egypt Ethiopia Ghana China, Hong Kong SAR Indonesia India Kenya Republic of Korea Mexico Morocco Mauritius Malawi Malaysia Nigeria Peru Philippines Senegal Singapore Thailand Taiwan Tanzania: Mainland Venezuela South Africa Zambia 48
Was Kuznets right? New evidence on the relationship between structural transformation and inequality
 Global Development Institute Working Paper Series 2018-027 May 2018 Was Kuznets right? New evidence on the relationship between structural transformation and inequality Cinar Baymul 1 l Kunal Sen 2 1 Honorary
The Changing Structure of Africa s Economies
 IFPRI Discussion Paper 01598 January 2017 The Changing Structure of Africa s Economies Xinshen Diao Kenneth Harttgen Margaret McMillan Development Strategy and Governance Division INTERNATIONAL FOOD POLICY
Is There Convergence in the Future of Global Capitalism? Dani Rodrik April 2017
 Is There Convergence in the Future of Global Capitalism? Dani Rodrik April 2017 Convergence of what? Economics: standards of living GDP per head Politics: models of governance liberal/social democracy
Poverty Reduction and Economic Management The World Bank
 Financiamento del Desarollo Productivo e Inclusion Social Lecciones para America Latina Danny Leipziger Vice Presidente Poverty Reduction and Economic Management, Banco Mundial LAC economic growth has
The Challenge of Inclusive Growth: Making Growth Work for the Poor
 2015/FDM2/004 Session: 1 The Challenge of Inclusive Growth: Making Growth Work for the Poor Purpose: Information Submitted by: World Bank Group Finance and Central Bank Deputies Meeting Cebu, Philippines
The globalization of inequality
 The globalization of inequality François Bourguignon Paris School of Economics Public lecture, Canberra, May 2013 1 "In a human society in the process of unification inequality between nations acquires
Development, Politics, and Inequality in Latin America and East Asia
 Institutions in Context: Inequality Development, Politics, and Inequality in Latin America and East Asia Inyoung Cho DPhil student Department of Politics and International Relations University of Oxford
POLICY OPTIONS AND CHALLENGES FOR DEVELOPING ASIA PERSPECTIVES FROM THE IMF AND ASIA APRIL 19-20, 2007 TOKYO
 POLICY OPTIONS AND CHALLENGES FOR DEVELOPING ASIA PERSPECTIVES FROM THE IMF AND ASIA APRIL 19-20, 2007 TOKYO RISING INEQUALITY AND POLARIZATION IN ASIA ERIK LUETH INTERNATIONAL MONETARY FUND Paper presented
What Explains the Job Creating Potential of Industrialisation in the Developing World? Kunal Sen Global Development Institute, University of
 What Explains the Job Creating Potential of Industrialisation in the Developing World? Kunal Sen Global Development Institute, University of Manchester www.kunalsen.org.uk The False Promise of Industrialisation?
Summary of the Results
 Summary of the Results CHAPTER I: SIZE AND GEOGRAPHICAL DISTRIBUTION OF THE POPULATION 1. Trends in the Population of Japan The population of Japan is 127.77 million. It increased by 0.7% over the five-year
Part 1: The Global Gender Gap and its Implications
 the region s top performers on Estimated earned income, and has also closed the gender gap on Professional and technical workers. Botswana is among the best climbers Health and Survival subindex compared
Poverty Reduction and Economic Growth: The Asian Experience Peter Warr
 Poverty Reduction and Economic Growth: The Asian Experience Peter Warr Abstract. The Asian experience of poverty reduction has varied widely. Over recent decades the economies of East and Southeast Asia
The Changing Structure of Africa s Economies
 Policy Research Working Paper 7958 WPS7958 The Changing Structure of Africa s Economies Xinshen Diao Kenneth Harttgen Margaret McMillan Public Disclosure Authorized Public Disclosure Authorized Public
Chapter 17. Other source data Macroeconomic data. Betina Dimaranan
 Chapter 17 Other source data 17.1 Macroeconomic data Betina Dimaranan The 1992 macroeconomic data that was used directly in the FIT process to update the regional inputoutput tables include the following
HOW ECONOMIES GROW AND DEVELOP Macroeconomics In Context (Goodwin, et al.)
") Chapter 17 HOW ECONOMIES GROW AND DEVELOP Macroeconomics In Context (Goodwin, et al.) Chapter Overview This chapter presents material on economic growth, such as the theory behind it, how it is calculated,
Chapter 17 HOW ECONOMIES GROW AND DEVELOP Macroeconomics In Context (Goodwin, et al.) Chapter Overview This chapter presents material on economic growth, such as the theory behind it, how it is calculated,
Capital Profitability and Economic Growth
 Journal of Economics and Development Studies December 2018, Vol. 6, o. 4, pp. 12-18 ISS: 2334-2382 (Print), 2334-2390 (Online) Copyright The Author(s). All Rights Reserved. Published by American Research
GLOBAL MONITORING REPORT 2015/2016
 GLOBAL MONITORING REPORT 215/216 Development Goals in an Era of Demographic Change MARCIO CRUZ DEVELOPMENT PROSPECTS GROUP Global Monitoring Report 215/216 Implications of Demographic Change: Pathways
2005 WIDER Annual Lecture Why Inequality Matters in a Globalizing World
 2005 WIDER Annual Lecture Why Inequality Matters in a Globalizing World Helsinki, October 26 Nancy Birdsall President Center for Global Development Washington, D.C. 1 Holy mackerel, the world is becoming
Inclusive global growth: a framework to think about the post-2015 agenda
 Inclusive global growth: a framework to think about the post-215 agenda François Bourguignon Paris School of Economics Angus Maddison Lecture, Oecd, Paris, April 213 1 Outline 1) Inclusion and exclusion
Volume 36, Issue 1. Impact of remittances on poverty: an analysis of data from a set of developing countries
 Volume 6, Issue 1 Impact of remittances on poverty: an analysis of data from a set of developing countries Basanta K Pradhan Institute of Economic Growth, Delhi Malvika Mahesh Institute of Economic Growth,
Education, financial markets and economic growth
 Education, financial markets and economic growth Lucas Papademos European Central Bank 35th Economics Conference on Human Capital and Economic Growth Österreichische Nationalbank Vienna, 21 May 1 Outline
GaveKalDragonomics China Insight Economics
 GaveKalDragonomics China Insight 6 September 211 Andrew Batson Research director abatson@gavekal.com Is China heading for the middle-income trap? All fast-growing economies slow down, eventually. Since
Higher education global trends and emerging opportunities to Kevin Van-Cauter Higher Education Adviser The British Council
 Higher education global trends and emerging opportunities to 2020 Kevin Van-Cauter Higher Education Adviser The British Council Outline Where are international students coming from? Trends in Engineering
Earnings Inequality, Educational Attainment and Rates of Returns to Education after Mexico`s Economic Reforms
 Latin America and the Caribbean Region The World Bank Poverty Reduction and Economic Management Division The World Bank Earnings Inequality, Educational Attainment and Rates of Returns to Education after
Chapter 11. Trade Policy in Developing Countries
 Chapter 11 Trade Policy in Developing Countries Preview Import-substituting industrialization Trade liberalization since 1985 Trade and growth: Takeoff in Asia Copyright 2015 Pearson Education, Inc. All
Global Income Inequality by the Numbers: In History and Now An Overview. Branko Milanovic
 Global Income Inequality by the Numbers: In History and Now An Overview. Branko Milanovic Usually inequality looked at within a state (for govt program access e.g.) Also, across countries (the poor, the
HOW STRATIFIED IS THE WORLD? Openness and Development
 HOW STRATIFIED IS THE WORLD? Openness and Development by Walter G. Park and David A. Brat Department of Economics American University Randolph-Macon College March 1997 Tel. 202-885-3774 Tel. 804-752-7353
INDONESIA AND THE LEWIS TURNING POINT: EMPLOYMENT AND WAGE TRENDS
 INDONESIA AND THE LEWIS TURNING POINT: EMPLOYMENT AND WAGE TRENDS 1 Chris Manning (Adjunct Fellow, Indonesian Project, ANU) and R. Muhamad Purnagunawan (Center for Economics and Development Studies, UNPAD,
BBVA EAGLEs. Emerging And Growth Leading Economies Economic Outlook. Annual Report 2014 Cross-Country Emerging Markets, BBVA Research March 2014
 BBVA EAGLEs Emerging And Growth Leading Economies Economic Outlook Annual Report 2014 Cross-Country Emerging Markets, BBVA Research March 2014 Index Key takeaways in 2013 Rethinking EAGLEs for the next
CHAPTER I: SIZE AND GEOGRAPHICAL DISTRIBUTION OF THE POPULATION
 CHAPTER I: SIZE AND GEOGRAPHICAL DISTRIBUTION OF THE POPULATION 1. Trends in the Population of Japan The population of Japan is 127.77 million. It increased by 0.7% over the five-year period, the lowest
RETHINKING GLOBAL POVERTY MEASUREMENT
 RETHINKING GLOBAL POVERTY MEASUREMENT Working Paper number 93 April, 2012 Khalid Abu-Ismail and Gihan Abou Taleb United Nations Development Programme, Regional Centre in Cairo (UNDP-RCC) Racha Ramadan
Macroeconomics+ World+Distribu3on+of+Income+ XAVIER+SALA=I=MARTIN+(2006)+ ECON+321+
+ ECON+321+") Macroeconomics+ World+Distribu3on+of+Income+ XAVIER+SALA=I=MARTIN+(26)+ ECON+321+ Ques3ons+ Do+you+have+any+percep3ons+that+existed+ before+reading+this+paper+that+have+been+ altered?++ What+are+your+thoughts+about+the+direc3on+of+
Macroeconomics+ World+Distribu3on+of+Income+ XAVIER+SALA=I=MARTIN+(26)+ ECON+321+ Ques3ons+ Do+you+have+any+percep3ons+that+existed+ before+reading+this+paper+that+have+been+ altered?++ What+are+your+thoughts+about+the+direc3on+of+
Charting Singapore s Economy, 1H 2017
 Charting Singapore s Economy, 1H 2017 Designed to help executives interpret economic numbers and incorporate them into company s planning. Publication Date: January 3 rd, 2017 Next Issue: To be published
Labour markets. Carla Canelas
 Labour markets Carla Canelas 20.10.2016 1 / 37 Table of contents Introduction Basic definitions World labour force Labour markets in developing countries Formal and informal employment References 2 / 37
Charting Cambodia s Economy
 Charting Cambodia s Economy Designed to help executives catch up with the economy and incorporate macro impacts into company s planning. Annual subscription includes 2 semiannual issues published in June
Direction of trade and wage inequality
 This article was downloaded by: [California State University Fullerton], [Sherif Khalifa] On: 15 May 2014, At: 17:25 Publisher: Routledge Informa Ltd Registered in England and Wales Registered Number:
ARTNeT Trade Economists Conference Trade in the Asian century - delivering on the promise of economic prosperity rd September 2014
 ASIA-PACIFIC RESEARCH AND TRAINING NETWORK ON TRADE ARTNeT CONFERENCE ARTNeT Trade Economists Conference Trade in the Asian century - delivering on the promise of economic prosperity 22-23 rd September
Income and Population Growth
 Supplementary Appendix to the paper Income and by Markus Brueckner and Hannes Schwandt November 2013 downloadable from: https://sites.google.com/site/markusbrucknerresearch/research-papers Table of Contents
Trademarks FIGURE 8 FIGURE 9. Highlights. Figure 8 Trademark applications worldwide. Figure 9 Trademark application class counts worldwide
 Trademarks Highlights Applications grew by 16.4% in 2016 An estimated 7 million trademark applications were filed worldwide in 2016, 16.4% more than in 2015 (figure 8). This marks the seventh consecutive
REMITTANCE PRICES W O R L D W I D E
 Public Disclosure Authorized Public Disclosure Authorized Public Disclosure Authorized Public Disclosure Authorized REMITTANCE PRICES W O R L D W I D E PAYMENT SYSTEMS DEVELOPMENT GROUP FINANCIAL AND PRIVATE
Trends in inequality worldwide (Gini coefficients)
") Section 2 Impact of trade on income inequality As described above, it has been theoretically and empirically proved that the progress of globalization as represented by trade brings benefits in the form
Section 2 Impact of trade on income inequality As described above, it has been theoretically and empirically proved that the progress of globalization as represented by trade brings benefits in the form
Lecture 1 Economic Growth and Income Differences: A Look at the Data
 Lecture 1 Economic Growth and Income Differences: A Look at the Data Rahul Giri Contact Address: Centro de Investigacion Economica, Instituto Tecnologico Autonomo de Mexico (ITAM). E-mail: rahul.giri@itam.mx
Emerging Asian economies lead Global Pay Gap rankings
 For immediate release Emerging Asian economies lead Global Pay Gap rankings China, Thailand and Vietnam top global rankings for pay difference between managers and clerical staff Singapore, 7 May 2008
Globalization, Technology and the Decline in Labor Share of Income. Mitali Das Strategy, Policy and Research Department. IMF
 Globalization, Technology and the Decline in Labor Share of Income Mitali Das Strategy, Policy and Research Department. IMF 1 The global labor share of income has been on a downward trend Evolution of
Charting South Korea s Economy, 1H 2017
 Charting South Korea s Economy, 1H 2017 Designed to help executives interpret economic numbers and incorporate them into company s planning. Publication Date: January 3 rd, 2017 Next Issue: To be published
Prospects for Inclusive Growth in the MENA Region: A Comparative Approach
 Prospects for Inclusive Growth in the MENA Region: A Comparative Approach Hassan Hakimian London Middle East Institute SOAS, University of London Email: HH2@SOAS.AC.UK International Parliamentary Conference
Chapter 10 Trade Policy in Developing Countries
 Chapter 10 Trade Policy in Developing Countries Prepared by Iordanis Petsas To Accompany International Economics: Theory and Policy, Sixth Edition by Paul R. Krugman and Maurice Obstfeld Chapter Organization
Chapter Organization. Introduction. Introduction. Import-Substituting Industrialization. Import-Substituting Industrialization
 Chapter 10 Trade Policy in Developing Countries Chapter Organization Introduction The East Asian Miracle Summary Prepared by Iordanis Petsas To Accompany International Economics: Theory and Policy, Sixth
Welfare, inequality and poverty
 97 Rafael Guerreiro Osório Inequality and Poverty Welfare, inequality and poverty in 12 Latin American countries Argentina, Bolivia, Brazil, Chile, Colombia, Ecuador, El Salvador, Mexico, Paraguay, Peru,
Mastercard Index of Women Entrepreneurs (MIWE) 2018
 2018") Mastercard Index of Women Entrepreneurs (MIWE) 2018 Table of Contents 1.0 Introduction 2.0 Overview of Key Findings 2 15 1.1. Description of 9 18 Indicator and Sources 2.1. Benchmark: Women Business Owners
Mastercard Index of Women Entrepreneurs (MIWE) 2018 Table of Contents 1.0 Introduction 2.0 Overview of Key Findings 2 15 1.1. Description of 9 18 Indicator and Sources 2.1. Benchmark: Women Business Owners
Global Imbalances 2017 External Sector Report
 International Monetary Fund Global Imbalances 2017 External Sector Report Gustavo Adler and Luis Cubeddu IMF Research Department Bruegel Brussels, September 26, 2017 Roadmap I. Recent developments II.
title, Routledge, September 2008: 234x156:
 Trade Policy, Inequality and Performance in Indian Manufacturing Kunal Sen IDPM, University of Manchester Presentation based on my book of the same title, Routledge, September 2008: 234x156: 198pp, Hb:
Poverty, growth and inequality
 Part 1 Poverty, growth and inequality 16 Pro-Poor Growth in the 1990s: Lessons and Insights from 14 Countries Broad based growth and low initial inequality are critical to accelerating progress toward
ARANGKADA PHILIPPINES 2010: A BUSINESS PERSPECTIVE. Figure 10: Share in world GDP,
 Living in the High Growth Neighborhood The Philippines is located in the world s fastest growing region. Figure 10 shows that the ASEAN-6 plus 4 (China, India, Japan, and Korea) in 2009 had about the same
Has Globalization Helped or Hindered Economic Development? (EA)
") Has Globalization Helped or Hindered Economic Development? (EA) Most economists believe that globalization contributes to economic development by increasing trade and investment across borders. Economic
Has Globalization Helped or Hindered Economic Development? (EA) Most economists believe that globalization contributes to economic development by increasing trade and investment across borders. Economic
Latin America in the New Global Order. Vittorio Corbo Governor Central Bank of Chile
 Latin America in the New Global Order Vittorio Corbo Governor Central Bank of Chile Outline 1. Economic and social performance of Latin American economies. 2. The causes of Latin America poor performance:
Hilde C. Bjørnland. BI Norwegian Business School. Advisory Panel on Macroeconomic Models and Methods Oslo, 27 November 2018
 Discussion of OECD Deputy Secretary-General Ludger Schuknecht: The Consequences of Large Fiscal Consolidations: Why Fiscal Frameworks Must Be Robust to Risk Hilde C. Bjørnland BI Norwegian Business School
Discussion of Angus Deaton, Wellbeing: Measurement and Concepts
 Discussion of Angus Deaton, Wellbeing: Measurement and Concepts Charles I. Jones Stanford GSB Discussion of Deaton on Wellbeing p.1/17 PPP Problems Discussion of Deaton on Wellbeing p.2/17 International
KPMG: 2013 Change Readiness Index Assessing countries' ability to manage change and cultivate opportunity
 KPMG: 2013 Change Readiness Index Assessing countries' ability to manage change and cultivate opportunity Graeme Harrison, Jacqueline Irving and Daniel Miles Oxford Economics The International Consortium
31% - 50% Cameroon, Paraguay, Cambodia, Mexico
 EStimados Doctores: Global Corruption Barometer 2005 Transparency International Poll shows widespread public alarm about corruption Berlin 9 December 2005 -- The 2005 Global Corruption Barometer, based
Productivity. Total Factor Productivity Across the Developing World
 Public Disclosure Authorized Public Disclosure Authorized Public Disclosure Authorized Public Disclosure Authorized World Bank Group Enterprise Note No. 23 2011 Enterprise Surveys Enterprise Note Series
HUMAN RESOURCES IN R&D
 HUMAN RESOURCES IN R&D This fact sheet presents the latest UIS S&T data available as of July 2011. Regional density of researchers and their field of employment UIS Fact Sheet, August 2011, No. 13 In the
Inequality in Indonesia: Trends, drivers, policies
 Inequality in Indonesia: Trends, drivers, policies Taufik Indrakesuma & Bambang Suharnoko Sjahrir World Bank Presented at ILO Country Level Consultation Hotel Borobudur, Jakarta 24 February 2015 Indonesia
Application of PPP exchange rates for the measurement and analysis of regional and global inequality and poverty
 Application of PPP exchange rates for the measurement and analysis of regional and global inequality and poverty D.S. Prasada Rao The University of Queensland, Brisbane, Australia d.rao@uq.edu.au Abstract
Income, Deprivation, and Perceptions in Latin America and the Caribbean:
 Income, Deprivation, and Perceptions in Latin America and the Caribbean: New Evidence from the Gallup World Poll Leonardo Gasparini* Walter Sosa Escudero** Mariana Marchionni* Sergio Olivieri* * CEDLAS
Charting Australia s Economy
 Charting Australia s Economy Designed to help executives catch up with the economy and incorporate macro impacts into company s planning. Annual subscription includes 2 semiannual issues published in June
THAILAND SYSTEMATIC COUNTRY DIAGNOSTIC Public Engagement
 THAILAND SYSTEMATIC COUNTRY DIAGNOSTIC Public Engagement March 2016 Contents 1. Objectives of the Engagement 2. Systematic Country Diagnostic (SCD) 3. Country Context 4. Growth Story 5. Poverty Story 6.
Send Money Africa sendmoneyafrica.worldbank.org
 Send Money Africa sendmoneyafrica.worldbank.org February 2012 The World Bank - Payment Systems Development Group SMA is funded by AIR Project This report presents the results from the first eight months
Making Growth Work for the Poor: The Challenge of Inclusive Growth
 15/SOM1/EC/39 Agenda Item: 7 Making Growth Work for the Poor: The Challenge of Inclusive Growth Purpose: Information Submitted by: World Bank First Economic Committee Meeting Clark, Philippines 4-5 February
China and India:Convergence and Divergence
 China and India:Convergence and Divergence I. "What China is good at, India is not and vice versa. The countries are inverted mirror of each other».. «very real possibility that China and India will in
Executive summary. Strong records of economic growth in the Asia-Pacific region have benefited many workers.
 Executive summary Strong records of economic growth in the Asia-Pacific region have benefited many workers. In many ways, these are exciting times for Asia and the Pacific as a region. Dynamic growth and
Growth, Inequality, and Poverty in Sub-Saharan Africa: Recent Progress in a Global Context
 Growth, Inequality, and Poverty in Sub-Saharan Africa: Recent Progress in a Global Context Augustin Kwasi FOSU Institute of Statistical, Social and Economic Research (ISSER), University of Ghana, Legon,
Charting Indonesia s Economy, 1H 2017
 Charting Indonesia s Economy, 1H 2017 Designed to help executives interpret economic numbers and incorporate them into company s planning. Publication Date: January 3 rd, 2017 Next Issue: To be published
Payments from government to people
 3 PAYMENTS Most people make payments such as for utility bills or domestic remittances. And most receive payments such as wages, other payments for work, or government transfers. The 2017 Global Findex
GLOBAL RISKS OF CONCERN TO BUSINESS WEF EXECUTIVE OPINION SURVEY RESULTS SEPTEMBER 2017
 GLOBAL RISKS OF CONCERN TO BUSINESS WEF EXECUTIVE OPINION SURVEY RESULTS SEPTEMBER 2017 GLOBAL RISKS OF CONCERN TO BUSINESS Results from the World Economic Forum Executive Opinion Survey 2017 Survey and
A poverty-inequality trade off?
 Journal of Economic Inequality (2005) 3: 169 181 Springer 2005 DOI: 10.1007/s10888-005-0091-1 Forum essay A poverty-inequality trade off? MARTIN RAVALLION Development Research Group, World Bank (Accepted:
INCOME INEQUALITY WITHIN AND BETWEEN COUNTRIES
 INCOME INEQUALITY WITHIN AND BETWEEN COUNTRIES Christian Kastrop Director of Policy Studies OECD Economics Department IARIW general conference Dresden August 22, 2016 Upward trend in income inequality
REMITTANCES, POVERTY AND INEQUALITY
 JOURNAL OF ECONOMIC DEVELOPMENT 127 Volume 34, Number 1, June 2009 REMITTANCES, POVERTY AND INEQUALITY LUIS SAN VICENTE PORTES * Montclair State University This paper explores the effect of remittances
Gendered Employment Data for Global CGE Modeling
 Preliminary Draft: Do Not Cite Gendered Employment Data for Global CGE Modeling Betina Dimaranan, Kathryn Pace, and Alison Weingarden Abstract The gender-differentiated impacts of trade reforms and other
The Demography of the Labor Force in Emerging Markets
 The Demography of the Labor Force in Emerging Markets David Lam I. Introduction This paper discusses how demographic changes are affecting the labor force in emerging markets. As will be shown below, the
English Australia. Survey of major ELICOS regional markets in 2014
 English Australia Survey of major ELICOS regional markets in 2014 May 2015 Executive Summary of a report prepared for English Australia by Environmetrics May 2015 English Australia contact: Sue Blundell
Test Bank for Economic Development. 12th Edition by Todaro and Smith
 Test Bank for Economic Development 12th Edition by Todaro and Smith Link download full: https://digitalcontentmarket.org/download/test-bankfor-economic-development-12th-edition-by-todaro Chapter 2 Comparative
Inequality of Outcomes
 USD Inequality of Outcomes 1. Introduction Economic inequality generally refers to the disproportionate distribution of income, assets or wealth among households in a society. However, the overall welfare
and with support from BRIEFING NOTE 1
 and with support from BRIEFING NOTE 1 Inequality and growth: the contrasting stories of Brazil and India Concern with inequality used to be confined to the political left, but today it has spread to a
DRIVERS OF DEMOGRAPHIC CHANGE AND HOW THEY AFFECT THE PROVISION OF EDUCATION
 DRIVERS OF DEMOGRAPHIC CHANGE AND HOW THEY AFFECT THE PROVISION OF EDUCATION This paper provides an overview of the different demographic drivers that determine population trends. It explains how the demographic
ASEAN: THE AEC IS HERE, FINALLY 2030: NOMINAL GDP USD TRILLION US CHINA EURO AREA ASEAN JAPAN UK $20.8 $34.6 IN IN
 14: NOMINAL GDP USD TRILLION US EURO AREA CHINA JAPAN UK $2.9 $4.6 : THE AEC IS HERE, FINALLY $1.4 $13.4 $17.4 3: NOMINAL GDP USD TRILLION US CHINA EURO AREA JAPAN UK $6.8 $6.4 $8.5 $.8 $34.6 $33.6 $2.5
Lecture 4: Measuring Welfare
 Lecture 4: Measuring Welfare Nicolas Roys University of Wisconsin Madison Econ 302 - Spring 2015 Comparing welfare across countries and over time How succesful is an economy at delivering the highest possible
A Global View of Entrepreneurship Global Entrepreneurship Monitor 2012
 A Global View of Entrepreneurship Global Entrepreneurship Monitor 2012 Donna Kelley, Babson College REITI Workshop Tokyo Japan January 21, 2001 In 2012, its 14 th year, GEM surveyed 198,000 adults in 69
vi. rising InequalIty with high growth and falling Poverty
 43 vi. rising InequalIty with high growth and falling Poverty Inequality is on the rise in several countries in East Asia, most notably in China. The good news is that poverty declined rapidly at the same
Migration and Developing Countries
 Migration and Developing Countries Jeff Dayton-Johnson Denis Drechsler OECD Development Centre 28 November 2007 Migration Policy Institute Washington DC International migration and developing countries
Inequality in Asia: Trends, Drivers and Policy Implications
 Inequality in Asia: Trends, Drivers and Policy Implications Juzhong Zhuang Deputy Chief Economist Asian Development Bank Presentation at 215 Hitotsubashi University-IMF Seminar on Inequality, March 12-13,
Pro-Poor Growth and the Poorest
 Background Paper for the Chronic Poverty Report 2008-09 Pro-Poor Growth and the Poorest What is Chronic Poverty? The distinguishing feature of chronic poverty is extended duration in absolute poverty.
Emerging Market Consumers: A comparative study of Latin America and Asia-Pacific
 Emerging Market Consumers: A comparative study of Latin America and Asia-Pacific Euromonitor International ESOMAR Latin America 2010 Table of Contents Emerging markets and the global recession Demographic
Lecture III South Korean Economy today
 Lecture III South Korean Economy today Lecture 3: South Korean Economy - Current Status and Issues in the future South Korean Economy: Current Status 1 Korean Economy with Numbers GDP (PPP based) S. Korea
INCLUSIVE GROWTH AND POLICIES: THE ASIAN EXPERIENCE. Thangavel Palanivel Chief Economist for Asia-Pacific UNDP, New York
 INCLUSIVE GROWTH AND POLICIES: THE ASIAN EXPERIENCE Thangavel Palanivel Chief Economist for Asia-Pacific UNDP, New York Growth is Inclusive When It takes place in sectors in which the poor work (e.g.,
Full file at
 Chapter 2 Comparative Economic Development Key Concepts In the new edition, Chapter 2 serves to further examine the extreme contrasts not only between developed and developing countries, but also between
FACTOR PRICES AND INCOME DISTRIBUTION IN LESS INDUSTRIALISED ECONOMIES
 Blackwell Publishing AsiaMelbourne, AustraliaAEHRAustralian Economic History Review0004-8992 2006 The Authors; Journal compilation Blackwell Publishing Asia Pty Ltd and the Economic History Society of
Research Report. How Does Trade Liberalization Affect Racial and Gender Identity in Employment? Evidence from PostApartheid South Africa
 International Affairs Program Research Report How Does Trade Liberalization Affect Racial and Gender Identity in Employment? Evidence from PostApartheid South Africa Report Prepared by Bilge Erten Assistant
The Big Switch in Latin America: Restoring Growth Through Trade
 216/FDM2/3 Session 1 The Big Switch in Latin America: Restoring Growth Through Trade Purpose: Information Submitted by: World Bank Group Finance and Central Bank Deputies Meeting Lima, Peru 14 October
Overview. Main Findings. The Global Weighted Average has also been steady in the last quarter, and is now recorded at 6.62 percent.
 This Report reflects the latest trends observed in the data published in September. Remittance Prices Worldwide is available at http://remittanceprices.worldbank.org Overview The Remittance Prices Worldwide*