Framework Document 2003
|
|
|
- Augustus Foster
- 5 years ago
- Views:
Transcription
1 Background Paper to the 2003 Corruption Perceptions Index The Corruption Perceptions Index is a composite index. The data used this year were compiled between 2001 and surveys of businesspeople and assessments by country analysts from 13 independent institutions have been used. Framework Document 2003 All sources use a homogeneous definition of levels of corruption. These perceptions enhance our understanding of real levels of corruption from one country to another. Comparisons with last year s index should be based on scores. However, such comparisons can be misleading because of methodological changes between years. Non-parametric statistics have been used for standardizing the data and for determining the precision of our results. Prof. Dr. Johann Graf Lambsdorff Transparency International (TI) and University of Passau September 2003
2 1. The methodology Transparency International (TI) publishes its annual Corruption Perceptions Index (CPI) since This index has evolved into a leading indicator in social sciences. As in previous years, this framework document provides an in-depth explanation of the methodology and measurement precision. The goal of the CPI is to provide data on extensive perceptions of corruption within countries. The CPI is a composite index, making use of surveys of businesspeople and assessments by country analysts. It consists of credible sources using diverse sampling frames and different methodologies. These perceptions enhance our understanding of real levels of corruption from one country to another. As pointed out in previous framework documents, unbiased, hard data continue to be difficult to obtain and usually raise problematic questions with respect to validity. International surveys on perceptions therefore serve as the most credible means of compiling a ranking of nations. Overall, 17 sources could be included in the 2003 CPI, originating from 13 independent institutions. The complete list of sources is presented in the appendix. All in all, the number of countries in the CPI increased from 102 last year to 133. Sources in 2003 Prior to selecting sources guidelines have been set up which organize the underlying decision making process. These include the actual criteria that a source needs to meet in order to qualify for inclusion as well as organizational guidelines on how the final decision is reached with the help of the Transparency International Steering Committee. This process aimed at making the final decision as transparent and robust as possible. As a result of this it was decided that the 2003 CPI includes data from the following sources: Freedom House Nations in Transit (FH), 2003 The Economist Intelligence Unit (EIU), 2003 PricewaterhouseCoopers (PwC), the 2001 Opacity Index. The Institute for Management Development, Lausanne (IMD). We will use data for The Political and Eonomic Risk Consultancy, Hong Kong (PERC). We will for the last time be using the data from The World Bank (WBES), The World Economic Forum (WEF). We will use data for State Capacity Survey by Columbia University (CU), 2003 Gallup International on behalf of Transparency International (GI/TI), BPI Information International (II), A Multilateral Development Bank (MDB), The Business Environment and Enterprise Performance Survey (BEEPS), The World Markets Research Centre (WMRC), An essential condition for inclusion is that a source must provide a ranking of nations. This condition is not met if a source conducts surveys in a variety of countries but with varying methodologies. Comparison from one country to another is not feasible in this case and a ranking cannot be produced. Another condition is that sources must measure the overall level of corruption. This is violated if aspects of corruption are mixed with issues other than corruption such as political instability or nationalism or if changes are measured instead of levels of corruption. For example, the index Corruption in Government from the International Country Risk Guide (ICRG), conducted by
3 the Political Risk Services (PRS), did not meet these requirements, albeit being widely used in research as a measure of levels of corruption. It does not determine a country s level of corruption but the political risk involved in corruption. As pointed out to us by the ICRG-editor, these two issues can differ considerably, depending on whether there exists a high or low tolerance towards corruption. Corruption only leads to political instability if it is not tolerated. Due to this, the data by PRS-ICRG did not qualify for inclusion in the CPI. However, TI hopes to include a modified set of data by PRS in the future. The 2003 CPI combines assessments from the past three years to reduce abrupt variations in scoring that might arise due to random effects. Some sources, such as II, TI/GI, BEEPS, WBES and PwC, provided only one recent survey. Others such as WEF and IMD provided various surveys between 2001 and 2003, which are all included. While this averaging is valuable for the inclusion of surveys, it is inappropriate for application to the data compiled by country experts. Such assessments as compiled by WMRC, FH, CU and EIU are conducted by a small number of country experts who regularly analyze a country's performance, counterchecking their conclusions with peer discussions. Following this systematic evaluation, they then consider a potential upgrading or downgrading. As a result, a country's score changes rather seldom and the data shows little year-to-year variation. Changing scores in this case are the result of a considered judgment by the organization in question. To then go back and average the assessments over a period of time would be inappropriate. On the other hand, in the case of elite surveys an averaging over various years produces a useful smoothing effect. While some annual data may contain random errors, these do not necessarily carry over into the next year. Year-to-year comparisons Comparisons with the results from previous years should be based on a country s score, not its rank. A country s rank can change simply because new countries enter the index and others drop out. A higher score is an indicator that respondents provided better ratings, while a lower score suggests that respondents revised their perception downwards. However, year-to-year comparisons of a country's score result not only from a changing perception of a country's performance but also from a changing sample and methodology. With differing respondents and slightly differing methodologies, a change in a country's score may also relate to the fact that different viewpoints have been collected and different questions been asked. The index primarily provides an annual snapshot of the views of businesspeople, with less of a focus on year-to-year trends. However, to the extent that changes can be traced back to a change in the results from individual sources, trends can cautiously be identified. Noteworthy examples of a downward trend between 2002 and 2003 are Argentina, Belarus, Chile, Canada, Israel, Luxembourg, Poland, USA, and Zimbabwe. The considerable decline in their scores does not result from technical factors actual changes in perceptions are therefore likely. With the same caveats applied, on the basis of data from sources that have been consistently used for the index, improvements can be observed for Austria, Belgium, Colombia, France, Germany, Ireland, Malaysia, Norway, and Tunisia. 2. Validity All sources generally apply a definition of corruption such as the misuse of public power for private benefit, for example bribing of public officials, kickbacks in public procurement, or embezzlement of public funds. Each of the sources also assesses the extent of corruption among public offi-
4 cials and politicians in the countries in question: The IMD asks respondents to assess whether bribing and corruption prevail or do not prevail in the economy. The PERC asks How do you rate corruption in terms of its quality or contribution to the overall living/working environment? A slightly different question had been asked previously. The EIU defines corruption as the misuse of public office for personal (or party political) financial gain and aims at measuring the pervasiveness of corruption. Corruption is one of over 60 indicators used to measure country risk and forecasting. PwC asks for the frequency of corruption in various contexts (e.g. obtaining import/export permits or subsidies, avoiding taxes). FH determines the "level of corruption" without providing further defining statements. The WBES asks two questions with respect to corruption, one determining the "Frequency of bribing" and another one relating to "corruption as a constraint to business". Columbia University asks for the severity of corruption within the state. WMRC assesses the amount of red tape likely to be encountered, as well as the likelihood of encountering corrupt officials and other such groups. The types of corruption covered range from smallscale bribes right through to larger-scale kickbacks BEEPS asks Thinking about officials It is common for firms in my line of business to have to pay some irregular additional payments to get things done. (Always, Mostly, Frequently, Sometimes, Seldom, Never, Don t know) and Using this scale (No Obstacle=1 ; Minor Obstacle=2 ; Moderate Obstacle=3 ; Major Obstacle=4 ; Don t know/no answer=5) can you tell me how problematic are these different factors for the operation and growth of your business: corruption MDB asks its staff to assess multiple countries with respect to the following questions: How widespread is the incidence of corruption? (Widespread; Somewhat widespread; Somewhat limited; Limited; No judgement). The WEF asks in its 2003 Global Competitiveness Report: 7. In your industry, how commonly would you estimate that firms make undocumented extra payments or bribes connected with: 1 exports and imports Common Never occur 2 - public utilities (e.g. telephone or electricity) Common Never occur 3 - annual tax payments Common Never occur 4 public contracts Common Never occur 5 - loan applications Common Never occur 6 - influencing laws and policies, regulations, or decrees to favor selected business interests? Common Never occur 7 getting favorable judicial decisions Common Never occur. From these questions the simple average has been determined. Gallup International on behalf of Transparency International (TI/GI) and similarly Information International ask: 13. Which are the countries, besides this one, with which you have had the most business experience in the last 3-5 years? Please name up to five countries. 13a. In [country 1], how common are payments (e.g. bribes) to obtain or retain business or other improper advantages to senior public officials, like politicians, senior civil servants, and judges? In [country 1], how significant of an obstacle are the costs associated with such payments for doing business? From Very significant [1] to Insignificant [4]. Don t know [88]. The questions
5 continue for countries 2-5. In [country 1], how frequently are public contracts awarded to business associates, friends and relatives rather than on a competitive bidding basis? Scale for answers are from Very Common [01] to Very Uncommon / Never [04]. Don t know [88]. The terms "prevalence", "commonness", "frequency", "constraint ", "contribution to working environment" and severity are closely related. They all refer to some kind of degree of corruption, which is also the aim of the CPI. This common feature of the various sources is particularly important in view of the fact that corruption comes in different forms. It has been suggested in numerous publications that distinctions should be made between these forms of corruption, e.g. between nepotism and corruption in the form of monetary transfers. Yet, none of the data included in the CPI emphasize one form of corruption at the expense of other forms. The sources can be said to aim at measuring the same phenomenon. As also emphasized in the framework documents of previous years, the sources do not distinguish between administrative and political corruption. The term "degree of corruption" may imply different things. In particular, it may relate to the frequency of bribes or the size of bribes. But we know from the results of our sources that frequency and the size of bribes tend to correlate highly (as expounded in the framework documents of previous years). In countries where corruption is frequent it also amounts to a high fraction of firms' revenues. In sum, the term degree of corruption seems to equally reflect the two aspects, frequency of corruption and the total value of bribes paid. 3. Samples, perceptions and reality While the sources all aim at measuring the degree of corruption, the sample design differs considerably. The data by IMD, WBES, BEEPS, PwC and WEF largely sample residents (sometimes also from multinational companies). In contrast, the data by PERC, FH, TI/GI, II, MDB, CU, WMRC, and EIU largely relate to expatriates. Whether this difference between samples may lead to different outcomes still requires scientific study. For the purposes of the CPI it added to the robustness of the resulting figures, because the data correlate well, irrespective of whether expatriates or residents had been polled. This correlation suggests that there being different samples makes no large difference to the results. Interpreting perceptions As the data collected relates to perceptions rather than to real phenomena, it has to be considered whether such perceptions improve our understanding of what real levels of corruption may be. Since actual levels of corruption cannot be determined directly, perceptions may be all we have to guide us. However, this approach is undermined, to at least some extent, if the perceptions gathered are biased. Such a potential bias might originate from the particular cultural background of respondents. Depending on whether the sample consist of locals or expatriates, this suggests two potential biases to be relevant. Imagine that being asked to assess the level of corruption, a local estimates a high level of corruption in the country of residence. Such an assessment would be a valid contribution to the CPI only if the respondent makes the assessment as a result of comparisons with the levels of corruption perceived in other countries. But this is not necessarily the viewpoint taken by the respondent. A respondent may also assign high levels by comparing corruption to other (potentially less pressing) problems facing the country, or by evaluating it according to a high ethical standard (e.g. which assumes any kind of gift-giving to a public official to be corrupt and not culturally acceptable). In the case of such an outlook, a high degree of observed corruption may reflect a high standard of ethics rather than a high degree of real misbehavior. Per-
6 ceptions would be a misleading indicator for real levels of corruption. This bias can occur particularly if only locals are surveyed, each assessing only the level of perceived corruption in their own countries. If respondents are asked to assess foreign countries or to make comparisons between a variety of countries, this bias should not occur. Respondents will, in this case, compare a foreign country with their home country or with an even larger set of countries. They will be forced to apply the same definition of corruption and make use of the same ethical standard for all countries, which produces valid comparative assessments. However, in this context a second type of bias might arise, originating from the potential dominance of a particular cultural heritage in the sample questioned or because expatriates lack a proper understanding of a country's culture. The results would be meaningless to locals if they have a different understanding and definition of corruption. While samples of expatriates are susceptible to this kind of bias, surveys that question local residents clearly avoid it. The strength of the CPI rests with the idea that we include surveys that are not susceptible to the first type of bias, in particular EIU, WMRC, CU, FH and PERC. Because the data provided by these sources refer to assessments by expatriates, they are subject to a homogeneous definition of corruption and a consistent ethical standard. EIU, WMRC, CU and FH are assessments carried out by country analysts (mostly from North America and Western Europe). These assessments are discussed and reviewed by peers in order to guarantee consistency across countries. The CPI also incorporates the data from the IMD, WEF, BEEPS, PwC and WBES. These ratings are less likely to represent the perception of a certain cultural heritage because they refer to assessments made by local residents. The second type of bias can clearly be rejected for these sources. Because the data from the EIU, MDB, CU, FH and PERC correlate well with the other data, there seems to be no support for the suggestion that they might be influenced by the second type of bias. Similarly, the data by the IMD, WEF, BEEPS, PwC and WBES correlate well with data from the first group; the notion that the first type of bias might be present is clearly not supported. The validity of the sources is mutually confirmed and no hint is found for the existence of a bias in our data. A third group of more recently included sources is less susceptible to both biases simultaneously: these are TI/GI, II and MDB. They survey either their staff members (in the case of MDB) or respondents from emerging economies and less developed countries (TI/GI and II). In the latter case respondents are asked to assess the performance of industrial countries and neighboring countries. Those polled are not asked to assess their home country or individual foreign countries, but to provide a comparative assessment of various foreign countries. This approach makes sure that a consistent ethical standard is applied to all countries, that only those countries are assessed where sufficient experience and cultural insights are available and that the viewpoint of less developed countries is well represented. Yet, as shown in the correlations, this different approach does not bring about noteworthy different results. Thus, the comparative assessments gathered in the CPI do not disproportionately reflect the perceptions of western businesspeople. In sum, it seems that residents tend to have a consistent ethical standard with regard to assessments of corruption, while expatriates do not tend to impose an inappropriate ethical standard or to lack cultural insights. The approach suggests that the perceptions gathered are a helpful contribution to the understanding of real levels of corruption. 1 1 As was also explained in detail in the 2001 framework document, the perceptions
7 4. The index Standardizing Each of the sources uses its own scaling system, requiring that the data be standardized before each country s mean value can be determined. This standardization is carried out in two steps. For step 1 each source is standardized using matching percentiles. The ranks (and not the scores) of countries is the only information processed from our sources. For this technique the common sub-samples of a new source and the previous year s CPI are determined. Then, the largest value in the CPI is taken as the standardized value for the country ranked best by the new source. The second largest value is given to the country ranked second best, etc. 2 Imagine that a new source ranks only four countries: UK is best, followed by Singapore, Venezuela and Argentina respectively. In the 2002 CPI these countries obtained the gathered relate well to actual experience made and less to hearsay. See Lambsdorff, J. Graf (2001) Framework Document, Background Paper 2001 Corruption Perceptions Index: s/2001_cpi_fd.pdf 2 In case two countries share the same rank, their standardized value is the simple mean of the two respective scores in the CPI. The scores for countries where no CPI value was available are determined by referring to neighbor countries in the source s ranking. Linear interpolation is applied to their scores, suggesting that if a source assigns such a country a score close to the upper neighbor, also its standardized value is closer to that of this neighbor. If such a country is ranked best (or worst) by a source it would have only one neighbor, not two. The second neighbor is constructed by using the highest (or lowest) attainable score by the source and the CPI value 10 (or 0). This approach guarantees that all values remain within the range between 10 and 0. scores 8.7, 9.3, 2.5 and 2.8. Matching percentiles would now assign UK the best score of 9.3, Singapore 8.7, Venezuela 2.8 and Argentina 2.5. Matching percentiles is superior in combining indices that have different distributions. But, as it makes use of the ranks, and not the scores of sources, this method loses some of the information inherent in the sources. What tips the balance in favor of this techniques is its capacity to keep all reported values within the bounds from 0 to 10: All countries in the CPI obtain scores between 0 (very corrupt) and 10 (highly clean). This characteristic is not obtained by an alternative technique that standardizes the mean and standard deviation of the subsamples. Matching percentiles, on the other hand, guarantees that all standardized values are within these bounds. This results because any standardized value is taken from the previous year s CPI, which by definition is restricted to the aforementioned range. In sum, matching percentiles has the disadvantage of wasting some information by processing only the ranks reported by sources. Yet, this disadvantage is offset because 1) the approach is free of assumptions regarding the distribution of sources, and 2) all standardized values remain within the range from 0 to 10. Step 2 Having obtained standardized values that are all within the reported range, a simple average from these standardized values can be determined. As already argued before, the resulting index has a standard deviation which is smaller than that of the CPI of previous years. Without a second adjustment there would be a trend towards a continuously smaller diversity of scores. If, e.g., Finland were to repeat its score from the previous year, it would have to score best in all sources listing this country. If it scores second to best in any source, the standardized value it obtains after using matching percentiles and aggregation would be lower than its current score. Thus, given

8 some heterogeneity among sources, it seems inevitable that Finland s score would deteriorate. The opposite would be true of Bangladesh, which would obtain a better score if it is not consistently rated worst by all its sources. A second standardization is required in order to avoid a continuous trend to less diversity among scores. However, applying a simple mean and standard deviation technique might again bring about are beyond values our that range are from 0 to 10. A more complicated standardization is required for the second step: A beta-transformation. The idea behind this monotonous transformation is to increase the standard deviation to its desired value, but to keep all values within the range from 0 to 10. Each value (X) is therefore transformed according to the following function: 1 α 1 β 1 10 ( X /10) (1 X /10) dx 0 This beta-transformation is available in standard statistics programs. The crucial task is to find the parameters α and β so that the resulting mean and standard deviation of the index have the desired values. An algorithm has been determined that carries out this task. Applying this approach to the 2003 CPI, the change in the scores is depicted by figure 1. The parameters are α= 1.24 and β=1.23. As shown in the figure, scores between 5 and 10 are increased slightly, while those between 0 and 5 are lowered. This effect makes sure that the previous standard deviation is preserved. Yet, once a score of 10 has been reached, the score is not further increased. Equally, a score of 0 is not further decreased. This guarantees that all values remain within the range. The beta transformation is first applied to all values that were standardized in step 1. Afterwards the average of these are computed to determine a country s score. In our publication we also report the high-low range. This refers to all standardized values after carrying out the beta-transformation. This procedure ensured that the high-low range is consistently related to a country s mean value. All these values remain within the range from 0 to 10. Reliability and Precision A ranking of countries may easily be misunderstood as measuring the performance of a country with absolute precision. This is certainly not true. Since its start in 1995 TI has provided data on the standard deviation and the amount of sources contributing to the index. This data already serves to illustrate the inherent imprecision. Also the high-low range is provided in the main table. This depicts the highest and the lowest values provided by our sources, so as to portray the whole range of assessments. However, no quick conclusions should be derived from this range to the underlying


9 precision with which countries are measured. Countries which were assessed by 3 or 12 sources can have the same minimum and maximum values, but in the latter case we can feel much more confident about the country s score. In order to arrive at such measures of precision, other statistical methods are required. The strength of the CPI is based on the concept that a combination of data sources combined into a single index increases the reliability of each individual figure. As in previous years, the 2003 CPI includes all countries for which at least
10 three sources had been available. The idea of combining data is that the nonperformance of one source can be balanced out by the inclusion of at least two other sources. This way, the probability of misrepresenting a country is seriously lowered. This is valid even in case the sources are not totally independent of each other. Such partial dependency may arise if some respondents are aware of other people's perception of the level of corruption, or of other sources contributing to the CPI. An indicator for the overall reliability of the 2003 CPI can be drawn from the high correlation between the sources. This can be depicted from the standard Pearson correlation and Kendall s rank correlation, provided in tables 1 and 2. These data refer to all countries, even those not included in the CPI. 3 The correlations on average are 0.80 for the Pearson correlation and 0.65 for Kendall s rank correlation. The sources do not differ considerably in their assessment of levels of corruption. In addition to these correlations, the reliability of each individual country score can be determined. The larger the number of sources and the lower the standard deviation between the sources, the more reliable is the value for a country. The relatively large standard deviation for Lithuania of 1.6 signifies that 95% of the sources range be- 3 Abbreviations are: BEEPS: Business Environment and Enterprise Performance Survey; CU: Columbia University; EIU: Economist Intelligence Unit; FH: Freedom House, Nations in Transit; II: Information International; IMD: World Competitiveness Report of the Institute for Management Development; MDB: A Multinational Development Bank; PERC: Political and Economic Risk Consultancy, Hong Kong; PwC: PricewaterhouseCoopers, Opacity Index; TI/GI: Gallup International on behalf of Transparency International; WBES: World Business Environment Survey of the World Bank; WEF: Global Competitiveness Report of the World Economic Forum; WMRC: World Markets Research Centre tween a value of 1.7 and 7.7. In contrast, the low standard deviation for Luxembourg of 0.4 means that 95% of the scores range between 7.9 and 9.5. Confidence range We have been providing readers with the information on the confidence range for some years now. Up to 2001 this was based on the determination of the standard error for a country s average score and a resulting parametric assessment of a 95% confidence range. This approach required the assumption that there is no imprecision associated with the source s values and that these values are independent of each other. Another strong assumption required is that errors are normally distributed. While it is statistically difficult to relax the first two assumptions, one can relax the assumption of a normal distribution and apply tests which are valid throughout any type of distribution. Another drawback of the older confidence ranges was, again, that they sometimes violated the given range from 0 to 10. For example, while in 2001 Bangladesh had a score of 0.4, its 95% confidence range was between -3.6 and 4.4. For Finland, on the other hand, the range went as high as This type of a range is confusing even to an expert. Since it is in contradiction to the official range reported, the public is equally disoriented. In order to restrict the confidence range to our pre-specified limits, since 2002 we apply a different methodology: a nonparametric approach applying the bootstrap methodology. The principal idea of such a bootstrap confidence range is to resample the sources of a country with replacement. If five source values (3, 5, 4, 4.5, 4.2) had been given, an example of such a sample would be (5, 5, 4.2, 3, 3). A sufficiently large number of such samples (in our case 10,000) are drawn from the available vector of sources and the sample mean is determined in each case. Based on the distribution of the resulting means, inferences on the underlying precision can be drawn. The lower (upper) bound of a 90% confidence
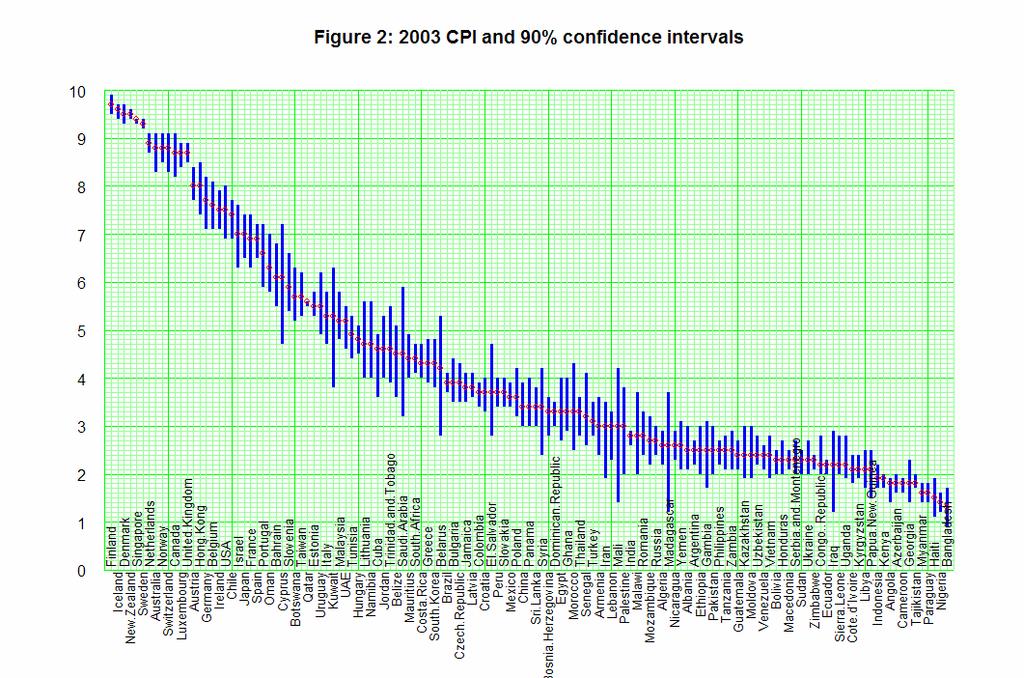
11 range is then determined as the value where 5% of the sample s means are below (above) this critical value. In addition to the percentile method just described, more complicated approaches exist. First, the confidence levels can be adjusted if (on average) the mean of a bootstrap sample is smaller than the observed mean. The relevant parameter is called z 0. Another adjustment is to assume the standard deviation also to be dependent on the mean of the bootstrap sample. The relevant parameter is a. If both these adjustments are considered, the resulting approach is called a bootstrap- BC a -method (bias-corrected-accelerated). A precise description of this approach can be obtained from Efron and Tibshirani (1993, chap. 14.3, 22.4 and 22.5). 4 One concern with the BC a approach is that it is throwing a lot of machinery at very few observations. Due to statistical considerations, a simple method might prove superior. Brad Efron had therefore suggested the use of a BCapproach for our purpose. In this case, z 0 is determined endogenously from the bootstrap sample but a is set equal to zero. There are two interesting characteristics of the resulting confidence range. 1) When requiring a 90% confidence range (which allows with 5% probability that the true value is below and with 5% probability that the value is above the determined confidence range) the upper (lower) bound will not be higher (lower) than the highest (lowest) value provided by a source. This implies that our range from 0 to 10 will never be violated. It should not be ignored that confidence ranges cannot be very solid when only very few sources are available. This is true for any methodology applied. Regardless of whether a normal distribution is assumed or a bootstrap approach is taken, the confidence range must not be overrated when few sources exist. It serves only as a rough guide in this case. Above that, there can arise boundary effects when only 3 or 4 sources exist. Since only 10 different combinations are possible in the case of 3 sources, a 5% confidence point can hit one resulting boundary. If this is the case, the BC-approach could produce at random two different values for the upper (or the lower) confidence point. These boundary effects have been identified and, if existent, the more conservative range is reported in the table. The resulting confidence range is reported in our publications. It is also graphically illustrated in figure 2. On the web-sites and we provide the complete data for each country: the score, amount of sources contributing, standard deviation, high-low range, the confidence range and the amount of independent institutions that contributed to an average value. 2) The confidence range remains valid even if the data (i.e. the standardized values for a given country) are not normally distributed. The range is even free of assumptions with regard to the distribution of these data. 4 See Efron, B. and R. Tibshirani (1993), An Introduction to the Bootstrap, Chapman & Hall: New York and London:
12
13 Survey sources for the TI Corruption Perceptions Index (CPI) 2003 Number Source World Economic Forum Name Global Competitiveness Report Year Internet address Who was surveyed? Senior business leaders; domestic and international companies Subject asked Undocumented extra payments connected with import and export permits, public utilities and contracts, business licenses, tax payments or loan applications are common/not common. In addition to questions mentioned on the left: payments connected to favorable regulations and judicial decisions Number of replies 4,022 ca. 4,600 7,741 Coverage 59 countries 76 countries 102 countries Number Source Institute for Management Development, IMD, Switzerland Name World Competitiveness Yearbook Year Internet address Who was surveyed? Executives in top and middle management; domestic and international companies Subject asked Bribing and corruption exist in the public sphere Bribing and corruption exist in the economy Number of replies 3,678 3,532 > 4,000 Coverage 49 countries 51 countries Number 7 8 Source Information International World Bank Name Survey of Middle Eastern Businesspeople World Business Environment Survey Year Internet address info.worldbank.org/governance/wbes/index 1.html Who was surveyed? Subject asked Senior businesspeople from Bahrain, Lebanon and UAE How common are bribes, how costly are they for doing business and how frequently are public contracts awarded to friends and relatives in neighboring countries Senior managers "Frequency of bribing" and "corruption as a constraint to business" Number of replies 382 assessments from 165 respondents 10,090 Coverage 31 countries 79 countries 5 5 The survey was carried out in 81 countries, but data for two countries was insufficient.
14 Number Source Economist Intelligence Unit Freedom House World Markets Research Centre Name Country Risk Service and Country Forecast Nations in Transit Risk Ratings Year Internet address Who was surveyed? assessment (expatriate) experts and FH staff Expert staff Assessment by US academic Assessment by staff Assessment of the pervasiveness of corruption (the misuse Perception of corruption in the civil service, the business Red tape and the likelihood of encountering corrupt Subject asked of public office for private or interests of top policy makers, laws on financial disclo- small-scale bribes, larger- officials. This includes political party gain) among public officials (politicians and civil servants) sure and conflict of interest, and anticorruption initiatives. scale kickbacks and corporate fraud. Number of replies Not applicable Not applicable Not applicable Coverage 139 countries 27 transition economies 186 countries Number Source Columbia University (CU) Political & Economic Risk Consultancy PricewaterhouseCoopers Name State Capacity Survey Asian Intelligence Issue Opacity Index Year Internet address US-resident country experts Who was surveyedtiveers and PwC staff Expatriate business execu- CFOs, equity analysts, bank- (policy analysts, academics and journalists) Subject asked Severity of corruption within the state How do you rate corruption in terms of its quality or contribution to the overall living/working environment? Frequency of corruption in various contexts (e.g. obtaining import/export permits or subsidies, avoiding taxes) Number of replies 224 ca. 1,000 1,357 Coverage 95 countries 14 countries 34 countries
15 Number Source A Multilateral Development Bank Gallup International on behalf of Transparency International Name Survey Corruption Survey Year Internet address x.html#bpi Who was surveyed? Subject asked Experts within the bank were identified and multiple questionnaires (each relating to a different country) were sent out to them. Roughly 40% of the questionnaires were returned. How widespread is the incidence of corruption? (Widespread; Somewhat widespread; Somewhat limited; Limited; No judgment) Senior businesspeople from 15 e- merging market economies How common are bribes to politicians, senior civil servants, and judges and how significant of an obstacle are the costs associated with such payments for doing business? Number of replies Coverage 47 countries 21 countries Number 17 Source Name World Bank and the EBRD Business Environment and Enterprise Performance Survey Year 2002 Internet address Who was surveyed? Subject asked Number of replies Coverage info.worldbank.org/governance/beep s2002/ Senior businesspeople Frequency of irregular additional payments ; how is corruption for the operation and growth of your business? transition countries
Framework Document 2002
 Background Paper to the 2002 Corruption Perceptions Index Framework Document 2002 The Corruption Perceptions Index is a composite index. The data used this year were compiled between 2000 and 2002. Comparisons
The Transparency International
 The Transparency International Corruption Perceptions Index 1999 Framework Document Dr. Johann Graf Lambsdorff on behalf of Transparency International, October 1999 1. The Methodology 1.1 Introduction
TI Corruption Perception Index 1996
 Dr. Johann Graf Lambsdorff Volkswirtschaftliches Seminar Universität Göttingen Tel: +49-30-3438200 Platz der Göttinger Sieben 3 Fax: +49-30-3470 3912 Tel: +49-551-397298 email: ti@transparency.org Fax:
Transparency International Corruption Perceptions Index 2003
 Transparency International Corruption Perceptions Index 2003 http://www.transparency.org Transparency International Secretariat Otto-Suhr-Allee 97-99, 10585 Berlin, Germany Tel: +49-30-3438 2010 Fax: +49-30-3470
Transparency International Corruption Perceptions Index 2003
 Transparency International Corruption Perceptions Index 2003 http://www.transparency.org Transparency International Secretariat Otto-Suhr-Allee 97-99, 10585 Berlin, Germany Tel: +49-30-3438 2010 Fax: +49-30-3470
Corruption Perceptions Index 2011 Long Methodological Brief
 Corruption Perceptions Index 2011 Long Methodological Brief Transparency International s (TI) Corruption Perceptions Index 1 (CPI) is an aggregate indicator that ranks countries in terms of the degree
A view from the Inside at Transparency International. entrusted power for private gain WHAT the abuse of ISentrusted power for private gain the
 Fighting Corruption: A view from the Inside at Transparency International Susan Côté-Freeman, Transparency International Utilities & Energy Compliance & Ethics Conference Houston, Texas 1 March 2011 power
Unit 4: Corruption through Data
 Unit 4: Corruption through Data Learning Objectives How do we Measure Corruption? After studying this unit, you should be able to: Understand why and how data on corruption help in good governance efforts;
NEW ZEALAND BEST, INDONESIA WORST IN WORLD POLL OF INTERNATIONAL CORRUPTION
 PRESS RELEASE EMBARGOED UNTIL SATURDAY 15 JULY 1995 AT 0400 HRS GMT NEW ZEALAND BEST, INDONESIA WORST IN WORLD POLL OF INTERNATIONAL CORRUPTION New Zealand, Denmark, Singapore and Finland come out as the
GLOBAL CORRUPTION PERCEPTION INDEX (CPI) 2017 published 21 February
 2017 published 21 February") GLOBAL CORRUPTION PERCEPTION INDEX (CPI) 2017 published 21 February 2018 www.transparentnost.org.rs www.transparency.org/cpi Corruption Perception Index for 2017 Global (180 states/territories) agregate
GLOBAL CORRUPTION PERCEPTION INDEX (CPI) 2017 published 21 February 2018 www.transparentnost.org.rs www.transparency.org/cpi Corruption Perception Index for 2017 Global (180 states/territories) agregate
Corruption Perceptions Index 2011 Full Source Description. Sources included in the CPI 2011:
 Corruption Perceptions Index 2011 Sources included in the CPI 2011: 1. African Development Bank Governance Ratings 2010 2. Asian Development Bank Country Performance Assessment 2010 3. Bertelsmann Foundation
Improving the accuracy of outbound tourism statistics with mobile positioning data
 1 (11) Improving the accuracy of outbound tourism statistics with mobile positioning data Survey response rates are declining at an alarming rate globally. Statisticians have traditionally used imputing
31% - 50% Cameroon, Paraguay, Cambodia, Mexico
 EStimados Doctores: Global Corruption Barometer 2005 Transparency International Poll shows widespread public alarm about corruption Berlin 9 December 2005 -- The 2005 Global Corruption Barometer, based
Volume 30, Issue 1. Corruption and financial sector performance: A cross-country analysis
 Volume 30, Issue 1 Corruption and financial sector performance: A cross-country analysis Naved Ahmad Institute of Business Administration (IBA), Karachi Shahid Ali Institute of Business Administration
TI s Corruption Perceptions Index (CPI)
") ADB-OECD Anti-Corruption Initiative for Asia and the Pacific 5th regional anti-corruption conference Beijing, September 28-30, 2005 How can public opinion surveys assist in preparing anti-corruption reform?
ADB-OECD Anti-Corruption Initiative for Asia and the Pacific 5th regional anti-corruption conference Beijing, September 28-30, 2005 How can public opinion surveys assist in preparing anti-corruption reform?
Report on the Transparency International Global Corruption Barometer 2006
 Report on the Transparency International Global Corruption Barometer 2006 Embargoed until Thursday 7 December 2006 at 10:00 GMT; 11:00 CET; 5:00 EST Release date: 7 December 2006 Policy and Research Department
Table 1-1. Transparency International Corruption Perceptions Index 2005 and Corruption Perceptions Global Corruption Barometer 2004: Correlations
 Table 1-1 Transparency International Corruption Perceptions Index 2005 and Corruption Perceptions Global Corruption Barometer 2004: Correlations Global Corruption Barometer Variables TI Corruption Perceptions
Report. Transparency International Global Corruption Barometer 2005
 Report on the Transparency International Global Corruption Barometer 2005 Embargoed until 9 December 2005 Release date: 9 December 2005 Policy and Research Department Transparency International International
The objective of the survey "Corruption in Estonia: a survey of three target groups" is to find answers to the following questions:
 Introduction The objective of the survey "Corruption in Estonia: a survey of three target groups" is to find answers to the following questions: 1) how is corruption defined and to what extent it is condemned;
Perceptions of Corruption in Mass Publics
 Perceptions of Corruption in Mass Publics Sören Holmberg QoG WORKING PAPER SERIES 2009:24 THE QUALITY OF GOVERNMENT INSTITUTE Department of Political Science University of Gothenburg Box 711 SE 405 30
MEASUREMENT TOOL Since 1995 Perceptions Public sector corruption Aggregate index Compare countries 178 in Awareness raising Country level
 BRIBE FAVOURITE PAYERS CORRUPTION INDEX 2011 Since 1995 Perceptions Public sector corruption Aggregate index Compare countries 178 in 2010 - Awareness raising Country level attention Research 2nd November
Achieving Corporate Integrity
 Achieving Corporate Integrity Dr Mark Lovatt Transparency International Malaysia ti-malaysia@transparency.org.my www.transparency.org.my Integrity Unsinkable Titanic s current state How is integrity compromised?
Corruption continues to deprive societies around the world
 PRESS RELEASE This is Passau University s press release on the Corruption Perceptions Index 2004. Please also obtain the official press release by Transparency International at: transparency.org/surveys/index.html#cpi
Doing Business in East Asia and the Pacific
 Doing Business in East Asia and the Pacific Penelope J. Brook Acting Vice President Financial & Private Sector Development Singapore October 10, 2009 1 Doing Business: Overview Doing Business measures
Corruption Perceptions Index 2017: Full Source Description 13 data sources were used to construct the Corruption Perceptions Index (CPI) 2017:
 2017:") Corruption Perceptions Index 2017: Full Source Description 13 data sources were used to construct the Corruption Perceptions Index (CPI) 2017: 1. African Development Bank Country Policy and Institutional
Corruption Perceptions Index 2017: Full Source Description 13 data sources were used to construct the Corruption Perceptions Index (CPI) 2017: 1. African Development Bank Country Policy and Institutional
2017 Edelman Trust Barometer. Presentation to EuroPCom November 2017
 2017 Edelman Trust Barometer Presentation to EuroPCom November 2017 Trust in Retrospect 2001 2002 2003 2004 2005 2006 2007 2008 2009 Rising Influence of NGOs Fall of the Celebrity CEO Earned Media More
Global Corruption Barometer 2010 New Zealand Results
 Global Corruption Barometer 2010 New Zealand Results Ben Krieble TINZ Summer Intern www.transparencynz.org.nz executive@transparency.org.nz Contents Executive Summary 3 Summary of global results 4 Summary
Migration and Integration
 Migration and Integration Integration in Education Education for Integration Istanbul - 13 October 2017 Francesca Borgonovi Senior Analyst - Migration and Gender Directorate for Education and Skills, OECD
The evolution of the EU anticorruption
 DEVELOPING AN EU COMPETENCE IN MEASURING CORRUPTION Policy Brief No. 27, November 2010 The evolution of the EU anticorruption agenda The problem of corruption has been occupying the minds of policy makers,
Corruption Perceptions Index 2016: Full Source Description 13 data sources were used to construct the Corruption Perceptions Index 2016:
 Corruption Perceptions Index 2016: Full Source Description 13 data sources were used to construct the Corruption Perceptions Index 2016: 1. African Development Bank Governance Ratings 2015 2. Bertelsmann
Confidence Intervals*
 Transparency International Corruption Perceptions Index A country or territory s indicates the degree of public sector corruption as perceived by business people and country analysts, and ranges between
Egypt s Administrative Corruption Perception Index February 2018
 Egypt s Administrative Corruption Perception Index 2016 February 2018 Egypt s Administrative Corruption Perception Index Definition of Administrative Corruption The term of administration corruption is
BY Amy Mitchell, Katie Simmons, Katerina Eva Matsa and Laura Silver. FOR RELEASE JANUARY 11, 2018 FOR MEDIA OR OTHER INQUIRIES:
 FOR RELEASE JANUARY 11, 2018 BY Amy Mitchell, Katie Simmons, Katerina Eva Matsa and Laura Silver FOR MEDIA OR OTHER INQUIRIES: Amy Mitchell, Director, Journalism Research Katie Simmons, Associate Director,
Daniel Kaufmann, Brookings Institution
 Corruption in transition: reflections & implications from governance empirics Daniel Kaufmann, Brookings Institution Presentation at the opening plenary session on Measurement & Consequences of Corruption
2017 Edelman Trust Barometer. European Union
 2017 Edelman Trust Barometer European Union 2017 Edelman Trust Barometer Methodology Online Survey in 28 Countries General Online Population Informed Public Mass Population 17 years of data 33,000+ respondents
The 2017 TRACE Matrix Bribery Risk Matrix
 The 2017 TRACE Matrix Bribery Risk Matrix Methodology Report Corruption is notoriously difficult to measure. Even defining it can be a challenge, beyond the standard formula of using public position for
Governance and the City:
 Governance and the City: Global Determinants of Urban Performance and Implications from an International Perspective Daniel Kaufmann, Frannie Léautier & Massimo Mastruzzi The World Bank Institute http://worldbank.org/wbi/governance/
University of Groningen. Corruption and governance around the world Seldadyo, H.
 University of Groningen Corruption and governance around the world Seldadyo, H. IMPORTANT NOTE: You are advised to consult the publisher's version (publisher's PDF) if you wish to cite from it. Please
More and more corruption?
 1 Validity of the CPI, Passau 23-25 June 2005 DIES OECONOMICUS VI 23-25 June 2005 University of Passau Organized by Transparency International Germany and the Passau University On the occasion of 10 years
Daniel Kaufmann, Brookings Institution
 Reset Within Russia?: A Comparative Governance Perspective Daniel Kaufmann, Brookings Institution Presentation at the Public Conference The Risks of the Reset, at the Heritage Foundation, Washington, D.C.,
Measuring Corruption: Myths and Realities
 Measuring Corruption: Myths and Realities Daniel Kaufmann, Aart Kraay, and Massimo Mastruzzi, TheWorld Bank Draft, May 1 st, 2006 There is renewed interest in the World Bank, and among aid donors and aid
The BEEPS Interactive Tool
 The BEEPS Interactive Tool James Anderson, BEEPS User The Basics On The BEEPS Business Environment and Enterprise Performance Survey Joint initiative of the World Bank and EBRD Detailed survey of over
Exploring relations between Governance, Trust and Well-being
 Exploring relations between Governance, Trust and Well-being Using recent Gallup WorldPoll data Robert Manchin Gallup Europe Asia-Pacific Conference on Measuring Well-Being and Fostering the Progress of
A Global Perspective on Socioeconomic Differences in Learning Outcomes
 2009/ED/EFA/MRT/PI/19 Background paper prepared for the Education for All Global Monitoring Report 2009 Overcoming Inequality: why governance matters A Global Perspective on Socioeconomic Differences in
Executive summary 2013:2
 Executive summary Why study corruption in Sweden? The fact that Sweden does well in international corruption surveys cannot be taken to imply that corruption does not exist or that corruption is not a
PUBLIC PERCEPTIONS OF CORRUPTION
 PUBLIC PERCEPTIONS OF CORRUPTION The public were asked about their perceptions of corruption in their home country. The survey captures views on whether people feel that overall corruption levels have
LABOUR-MARKET INTEGRATION OF IMMIGRANTS IN OECD-COUNTRIES: WHAT EXPLANATIONS FIT THE DATA?
 LABOUR-MARKET INTEGRATION OF IMMIGRANTS IN OECD-COUNTRIES: WHAT EXPLANATIONS FIT THE DATA? By Andreas Bergh (PhD) Associate Professor in Economics at Lund University and the Research Institute of Industrial
A GAtewAy to A Bet ter Life Education aspirations around the World September 2013
 A Gateway to a Better Life Education Aspirations Around the World September 2013 Education Is an Investment in the Future RESOLUTE AGREEMENT AROUND THE WORLD ON THE VALUE OF HIGHER EDUCATION HALF OF ALL
Global Consumer Confidence
 Global Consumer Confidence The Conference Board Global Consumer Confidence Survey is conducted in collaboration with Nielsen 1ST QUARTER 2018 RESULTS CONTENTS Global Highlights Asia-Pacific Africa and
2014 BELGIAN FOREIGN TRADE
 2014 BELGIAN FOREIGN TRADE 2 3 01 \\ EXPORTS 6 1.1 Geographical developments 1.2 Sectoral developments 02 \\ IMPORTS 14 2.1 Geographical developments 2.2 Sectoral developments 03 \\ GEOGRAPHICAL TRADE
Economic Growth, Foreign Investments and Economic Freedom: A Case of Transition Economy Kaja Lutsoja
 Economic Growth, Foreign Investments and Economic Freedom: A Case of Transition Economy Kaja Lutsoja Tallinn School of Economics and Business Administration of Tallinn University of Technology The main
The Sudan Consortium African and International Civil Society Action for Sudan. Sudan Public Opinion Poll Khartoum State
 The Sudan Consortium African and International Civil Society Action for Sudan Sudan Public Opinion Poll Khartoum State April 2015 1 Table of Contents 1. Introduction... 3 1.1 Background... 3 1.2 Sample
Modern Slavery Country Snapshots
 Modern Slavery Country Snapshots The Country Snapshot has been developed to give the reader an immediate impression of some of the driving factors behind modern slavery within a given country. Following
Belgium s foreign trade
 Belgium s FIRST 9 months Belgium s BELGIAN FOREIGN TRADE AFTER THE FIRST 9 MONTHS OF Analysis of the figures for (first 9 months) (Source: eurostat - community concept*) After the first nine months of,
It s Time to Begin An Adult Conversation on PISA. CTF Research and Information December 2013
 It s Time to Begin An Adult Conversation on PISA CTF Research and Information December 2013 1 It s Time to Begin an Adult Conversation about PISA Myles Ellis, Acting Deputy Secretary General Another round
Mapping physical therapy research
 Mapping physical therapy research Supplement Johan Larsson Skåne University Hospital, Revingevägen 2, 247 31 Södra Sandby, Sweden January 26, 2017 Contents 1 Additional maps of Europe, North and South
Special Eurobarometer 470. Summary. Corruption
 Corruption Survey requested by the European Commission, Directorate-General for Migration and Home Affairs and co-ordinated by the Directorate-General for Communication This document does not represent
DANISH TECHNOLOGICAL INSTITUTE. Supporting Digital Literacy Public Policies and Stakeholder Initiatives. Topic Report 2.
 Supporting Digital Literacy Public Policies and Stakeholder Initiatives Topic Report 2 Final Report Danish Technological Institute Centre for Policy and Business Analysis February 2009 1 Disclaimer The
PISA 2006 PERFORMANCE OF ESTONIA. Introduction. Imbi Henno, Maie Kitsing
 PISA 2006 PERFORMANCE OF ESTONIA Imbi Henno, Maie Kitsing Introduction The OECD Programme for International Student Assessment (PISA) was administered in Estonian schools for the first time in April 2006.
2007/ACT/WKSP1/016 Corruption Control in Singapore Effective National Anti-Corruption Strategies: Prosecuting High-Level Corruption
 2007/ACT/WKSP1/016 Corruption Control in Singapore Effective National Anti-Corruption Strategies: Prosecuting High-Level Corruption Submitted by: Singapore Workshop on Strengthening Cooperation Mechanisms
SKILLS, MOBILITY, AND GROWTH
 SKILLS, MOBILITY, AND GROWTH Eric Hanushek Ludger Woessmann Ninth Biennial Federal Reserve System Community Development Research Conference April 2-3, 2015 Washington, DC Commitment to Achievement Growth
The Rights of the Child. Analytical report
 Flash Eurobarometer 273 The Gallup Organisation Analytical Report Flash EB N o 251 Public attitudes and perceptions in the euro area Flash Eurobarometer European Commission The Rights of the Child Analytical
Transparency International Bribe Payers Index 2008
 Transparency International Bribe Payers Index 2008 TRANSPARENCY INTERNATIONAL the global coalition against corruption Introduction 2 Introduction 4 Bribe Payers Index 2008 10 Bribery in sectors: sectoral
Civil and Political Rights
 DESIRED OUTCOMES All people enjoy civil and political rights. Mechanisms to regulate and arbitrate people s rights in respect of each other are trustworthy. Civil and Political Rights INTRODUCTION The
Impact Of Economic Freedom On Economic Development: A Nonparametric Approach To Evaluation
 Impact Of Economic Freedom On Economic Development: A Nonparametric Approach To Evaluation Andrea Vondrová, Ing., PhD Elena Fifeková, Ing., PhD University of Economics, Faculty of National Economy, Department
8. Perceptions of Business Environment and Crime Trends
 8. Perceptions of Business Environment and Crime Trends All respondents were asked their opinion about several potential obstacles, including regulatory controls, to doing good business in the mainland.
STATISTICS BRIEF URBAN PUBLIC TRANSPORT IN THE 21 ST CENTURY
 STATISTICS BRIEF URBAN PUBLIC TRANSPORT IN THE 21 ST CENTURY This Statistics Brief is an abridged version of the extensive report, Urban Public Transport in the 21 st Century, available on the UITP MyLibrary
STUDY OF PRIVATE SECTOR PERCEPTIONS OF CORRUPTION
 STUDY OF PRIVATE SECTOR PERCEPTIONS OF CORRUPTION This sur vey is made possible by the generous suppor t of Global Af fairs Canada. The Asia Foundation and the Sant Maral Foundation have implemented the
2017 Edelman Trust Barometer. Susanne Marell CEO Edelman.ergo
 2017 Edelman Trust Barometer Susanne Marell CEO Edelman.ergo 1 Trust Index A world of distrust Average trust in institutions, General Population, 2016 vs. 2017 Trusters (60-100) Neutrals (50-59) Distrusters
OFFICE OF ANTICORRUPTION AND INTEGRITY ANTICORRUPTION SEMINAR FOR CONSULTANTS, CONTRACTORS, AND SUPPLIERS
 OFFICE OF ANTICORRUPTION AND INTEGRITY ANTICORRUPTION SEMINAR FOR CONSULTANTS, CONTRACTORS, AND SUPPLIERS 1 Main Objectives Increase understanding and compliance with ADB s Anticorruption Policy Raise
Rankings: Universities vs. National Higher Education Systems. Benoit Millot
 Rankings: Universities vs. National Higher Education Systems Benoit Millot Outline 1. Background 2. Methodology 3. Results 4. Discussion 11/8/ 2 1. Background 11/8/ 3 Clear Shift Background: Leagues focus
Examining the Relationship Between Media Freedom and Corruption Using Elite and Public Opinion Measures
 Examining the Relationship Between Media Freedom and Corruption Using Elite and Public Opinion Measures By Lee B. Becker University of Georgia, USA (lbbecker@uga.edu) Teresa K. Naab Hochschule für Musik,
Equity and Excellence in Education from International Perspectives
 Equity and Excellence in Education from International Perspectives HGSE Special Topic Seminar Pasi Sahlberg Spring 2015 @pasi_sahlberg Evolution of Equity in Education 1960s: The Coleman Report 1970s:
Networks and Innovation: Accounting for Structural and Institutional Sources of Recombination in Brokerage Triads
 1 Online Appendix for Networks and Innovation: Accounting for Structural and Institutional Sources of Recombination in Brokerage Triads Sarath Balachandran Exequiel Hernandez This appendix presents a descriptive
GSU Research Day Research Day 2017
 Governors State University OPUS Open Portal to University Scholarship GSU Research Day Research Day 2017 Apr 7th, 9:30 AM - 10:00 AM Business Ethics Perceptions of Russian Working Adults: Do Age, Gender,
CORRUPTION PERCEPTIONS INDEX CORRUPTION PERCEPTIONS INDEX (CPI) 2015 SURVEY RESULTS
 2015 SURVEY RESULTS") CORRUPTION PERCEPTIONS INDEX CORRUPTION PERCEPTIONS INDEX (CPI) 2015 SURVEY RESULTS Date: 27th January 2016 (Wednesday) Time: 11.00am Venue: Royal Selangor Club, Bukit Kiara CORRUPTION PERCEPTIONS INDEX
CORRUPTION PERCEPTIONS INDEX CORRUPTION PERCEPTIONS INDEX (CPI) 2015 SURVEY RESULTS Date: 27th January 2016 (Wednesday) Time: 11.00am Venue: Royal Selangor Club, Bukit Kiara CORRUPTION PERCEPTIONS INDEX
Latin America in the New Global Order. Vittorio Corbo Governor Central Bank of Chile
 Latin America in the New Global Order Vittorio Corbo Governor Central Bank of Chile Outline 1. Economic and social performance of Latin American economies. 2. The causes of Latin America poor performance:
Corruption and Shadow Economies: Some New Results
 Prof. Dr. Dr.h.c.mult. Friedrich Schneider Department of Economics Johannes Kepler University of Linz A4040 LinzAuhof ShadEconomyCorruption_short.ppt Email: friedrich.schneider@jku.at Phone: 004373224688210
What is good governance: main aspects and characteristics
 KYRGYZSTAN What is good governance: main aspects and characteristics Roman Mogilevsky Center for Social and Economic Research CASE-Kyrgyzstan Presentation at the Roundtable VIII of the Fostering Global
Best Practices for Curbing Corruption in Asian Countries
 Best Practices for Curbing Corruption in Asian Countries Jon S.T. Quah, Ph.D. Vice-President, Asian Association for Public Administration Anti-Corruption Consultant, Singapore Email: jonstquah@gmail.com
The Future of Central Bank Cooperation
 The Future of Central Bank Cooperation (An Outsider s Perspective) Beth Simmons Government Department Harvard University What are the conditions under which cooperation is likely to take place? Economic
A COMPARISON OF ARIZONA TO NATIONS OF COMPARABLE SIZE
 A COMPARISON OF ARIZONA TO NATIONS OF COMPARABLE SIZE A Report from the Office of the University Economist July 2009 Dennis Hoffman, Ph.D. Professor of Economics, University Economist, and Director, L.
If citizens had a magic wand the world over, they would most like to eliminate corruption from political parties
 PRESS RELEASE Media Contacts: Jeff Lovitt Tel: +49-30-3438 2045 Fax: +49-30-3470 3912 press@transparency.org Fredrik Galtung Tel: +44 7979 648877 galtung@transparency.org Embargoed until 9am Central European
WORLDWIDE DISTRIBUTION OF PRIVATE FINANCIAL ASSETS
 WORLDWIDE DISTRIBUTION OF PRIVATE FINANCIAL ASSETS Munich, November 2018 Copyright Allianz 11/19/2018 1 MORE DYNAMIC POST FINANCIAL CRISIS Changes in the global wealth middle classes in millions 1,250
Fieldwork October-November 2004 Publication November 2004
 Special Eurobarometer European Commission The citizens of the European Union and Sport Fieldwork October-November 2004 Publication November 2004 Summary Special Eurobarometer 213 / Wave 62.0 TNS Opinion
Economic Freedom and Transparency in Latin America:
 Economic Freedom and Transparency in Latin America: Measuring Corruption Power Parity (CPP) Second Report by Pedro Isern This report is divided in two parts: firstly, it relates the index of economic freedom
2013 Country RepTrak Topline Report The World s View on Countries: An Online Study of the Reputation of 50 Countries
 2013 Country RepTrak Topline Report The World s View on Countries: An Online Study of the Reputation of 50 Countries RepTrak is a registered trademark of Reputation Institute. 2013 Reputation Institute,
Measuring and Reducing the Impact of Corruption in Infrastructure
 Public Disclosure Authorized WPS4099 Measuring and Reducing the Impact of Corruption in Infrastructure Public Disclosure Authorized Public Disclosure Authorized Charles Kenny 1 Abstract This paper examines
Upgrading workers skills and competencies: policy strategies
 Federation of Greek Industries Greek General Confederation of Labour CONFERENCE LIFELONG DEVELOPMENT OF COMPETENCES AND QUALIFICATIONS OF THE WORKFORCE; ROLES AND RESPONSIBILITIES Athens 23-24 24 May 2003
Statement of LANCE J. HOFFMAN. Professor, The George Washington University. before the
 Statement of LANCE J. HOFFMAN Professor, The George Washington University before the U. S. Senate Committee on Commerce, Science, and Transportation June 10, 1999 My name is Lance J. Hoffman. I am a professor
PISA 2009 in Hong Kong Result Release Figures and tables accompanying press release article
 PISA 2009 in Hong Kong Result Release Figures and tables accompanying press release article Figure 1-8 and App 1-2 for Reporters Figure 1 Comparison of Hong Kong Students' Performance in Reading, Mathematics
Differences in National IQs behind the Eurozone Debt Crisis?
 3 Differences in National IQs behind the Eurozone Debt Crisis? Tatu Vanhanen * Department of Political Science, University of Helsinki The purpose of this article is to explore the causes of the European
The Extraordinary Extent of Cultural Consumption in Iceland
 1 Culture and Business Conference in Iceland February 18 2011 Prof. Dr. Ágúst Einarsson Bifröst University PP 1 The Extraordinary Extent of Cultural Consumption in Iceland Prof. Dr. Ágúst Einarsson, Bifröst
ANNUAL SURVEY REPORT: BELARUS
 ANNUAL SURVEY REPORT: BELARUS 2 nd Wave (Spring 2017) OPEN Neighbourhood Communicating for a stronger partnership: connecting with citizens across the Eastern Neighbourhood June 2017 1/44 TABLE OF CONTENTS
Introduction: Summary of the Survey Results
 Introduction: Summary of the Survey Results The following is a chapter-by-chapter summary of the main points that became apparent as a result of this survey. The design of the survey form is similar in
REINVENTION WITH INTEGRITY
 REINVENTION WITH INTEGRITY Using the UN Convention against Corruption as a Basis for Good Governance Regional Forum on Reinventing Government in Asia Jakarta, Indonesia November, 2007 The Integrity Irony
Gal up 2017 Global Emotions
 Gallup 2017 Global Emotions Copyright Standards This document contains proprietary research, copyrighted materials and literary property of Gallup, Inc. It is for the guidance of your organization only
OECD Strategic Education Governance A perspective for Scotland. Claire Shewbridge 25 October 2017 Edinburgh
 OECD Strategic Education Governance A perspective for Scotland Claire Shewbridge 25 October 2017 Edinburgh CERI overview What CERI does Generate forward-looking research analyses and syntheses Identify
DAILY LIVES AND CORRUPTION: PUBLIC OPINION IN EAST AFRICA
 DAILY LIVES AND CORRUPTION: PUBLIC OPINION IN EAST AFRICA Transparency International is the global civil society organisation leading the fight against corruption. Through more than 90 chapters worldwide
Bachelorproject 2 The Complexity of Compliance: Why do member states fail to comply with EU directives?
 Bachelorproject 2 The Complexity of Compliance: Why do member states fail to comply with EU directives? Authors: Garth Vissers & Simone Zwiers University of Utrecht, 2009 Introduction The European Union