POLITICAL PARTICIPATION, CLIENTELISM AND TARGETING OF LOCAL GOVERNMENT PROGRAMS: Analysis of Survey Results from Rural West Bengal, India
|
|
|
- Primrose Lucas
- 6 years ago
- Views:
Transcription
1 POLITICAL PARTICIPATION, CLIENTELISM AND TARGETING OF LOCAL GOVERNMENT PROGRAMS: Analysis of Survey Results from Rural West Bengal, India Pranab Bardhan 1, Sandip Mitra 2, Dilip Mookherjee 3 and Abhirup Sarkar 4 February ABSTRACT This paper uses results of a household survey to study patterns of political participation (turnout, awareness, attendance at political and civic meetings, involvement in political campaigns, voting) and their relation to local governance in rural West Bengal, a state in Eastern India. With the exception of education and immigrant status, reported participation rates varied remarkably little with socio-economic status. Allocation of government-disbursed benefits within villages displayed no significant association with wealth, caste, education, gender or political affiliation of household head. In contrast, allocation of benefits across villages displayed bias against poor and low caste groups; these biases were larger in villages with more unequal land distribution and lower participation rates in village meetings. Political support among voters for the incumbent party dominating the local government was positively correlated with receipt of recurring benefits and help provided by local governments in times of personal need, but independent of more long-term, one-time benefits or local public goods provided. 1. INTRODUCTION This paper was based on a household survey funded by a research grant to Sandip Mitra and Abhirup Sarkar from the Economics Research Unit of Indian Statistical Institute, Calcutta. 1 Department of Economics, University of California, Berkeley CA (bardhan@econ.berkeley.edu) 2 Economics Research Unit, Indian Statistical Institute, 203 BT Road, Kolkata , India (sandipisi@gmail.com) 3 Department of Economics, 270 Bay State Road, Boston University, Boston MA (dilipm@bu.edu) (Corresponding Author) 4 Economics Research Unit, Indian Statistical Institute, 203 BT Road, Kolkata , India (abhirup@isical.ac.in)
2 A critical aspect of successful functioning of a democracy is its capacity to induce elected officials to be accountable to citizens. Accountability pressures depend critically on the pressures imposed on elected officials by citizens, through the way they vote, exercise voice and receive information about the actions of officials. If a large fraction of citizens either do not express their opinions, lack proper information or understanding of policy issues, a democracy would create no incentives for politicians to espouse or implement policies in the public interest. Governments can then be corrupt and captured by special interest groups, without facing any threat of displacement. Uneven patterns of political participation across different socio-economic groups may thus be a powerful cause of perpetuation of social and economic inequalities. These hypotheses necessitate empirical research on patterns of political participation and awareness among citizens, and how these relate to accountability of governments. Of particular interest is the functioning of local democracy. Many developing countries have recently embarked on experiments in decentralized development and local democracy. It has been noted by many authors that such experiments are prone to various pitfalls, most especially the possibility of elite capture of local governments. This is based on a presumption that democracy performs less well as an accountability mechanism at the local rather than the national level. While theoretical counter-arguments to such a presumption may be provided (Bardhan and Mookherjee (2000)), empirical research is required. To assess the promise of a decentralization as a strategy of economic development, one needs to assess patterns of political participation and accountability at the local level. The connection between political participation and socio-economic characteristics has been studied using household surveys in the context of a number of countries, such as the United States (Verba and Nie (1972), Delli Carpini and Keeter (1996), Rosenstone and Hansen (1993),
3 Przeworski (2006)), and Latin America (Gaviria, Panizza and Seddon (2002), Baiochhi, Chaudhuri, Heller and Silva (2006)). Przeworski (2006) provides an overview of many studies of electoral turnout across a wide cross-section of countries. A rough summary of the findings of this literature is that: (i) In general, political participation increases with measures of socioeconomic status, but the extent varies across countries; (ii) In the United States, political participation varies sharply with socio-economic status, with large and significant variations across race and income categories in voting turnout, participation in campaigns, and political awareness. 5 6 (iii) In most other countries both developed and developing for which data is available, patterns of political participation vary relatively little with socio-economic characteristics. 7 Yet with few exceptions (such as Baiochhi et al (2006) or Krishna (2006)), these studies do not correlate participation patterns with public policies such as targeting to different socio-economic groups. Hence they do not throw much light directly on the relation between political participation of citizens and government accountability. Nor do they pertain to local governments 5 Rosenstone and Hansen report that representation ratios (to demographic weight) in voting, contribution to political campaigns, attendance at political meetings in the highest quintile are between three to six times higher in the highest income quintile compared to the lowest, as well as between those with 16 years or more of schooling compared with those with less than eight years of schooling. 6 Przeworski (2006) reports from various studies that electoral turnout varies between 3 and 9 percentage points between top and bottom education quartiles across a large number of European countries, except Switzerland where the difference was 23 percent. In the United States this difference is nearly 40%. The turnout rate varies between 75 and 85% among lowest income or education levels in most European countries, compared with 50% in the United States. He summarizes that `` somehow in the United States the poor are successfully barred from electoral politics, in spite of universal suffrage, egalitarian ideology, and all the ostensible devotion to democracy. (Przeworski, 2006, p.30). 7 For instance, Gaviria et al find that across urban populations of 17 Latin American countries of widely varying levels of development, measures of participation and political attitudes are slightly (5 7 percentage points) lower for the bottom two quintiles than the rest of the population, but otherwise does not do not vary significantly across different income quintiles, after controlling for education and gender. Moreover, differences in participation rates between genders and between highest and lowest education categories are modest, usually within percentage points. Hence, despite very large extent of inequality in socio-economic status in many of these Latin American countries, there is not much evidence that weaker sections are excluded or marginalized in the political process.
4 specifically. This paper presents an empirical analysis of patterns of political participation (turnout, awareness, attendance at political and civic meetings, involvement in political campaigns, voting) in local governance across socio-economic categories in rural West Bengal, a state in Eastern India. We relate these to targeting of services administered by local governments. We also examine ways that citizens voted for different parties in a poll we administered (with secret ballots), and how these related to benefits they received from local governments. We discuss possible implications of these results concerning the nature of accountability pressure imposed on local governments in rural West Bengal over the past quarter century. The analysis is based on data collected from a household survey in a sample of 85 villages drawn from 15 major agricultural districts in West Bengal. This state is particularly interesting for a variety of reasons. It has a relatively long experience with local democracy spanning a quarter century, unlike other Indian states. Moreover, West Bengal is unique insofar as a coalition of Left parties has been repeatedly re-elected across six successive elections with an absolute majority, whereas other Indian states have witnessed incumbents losing elections regularly. However, the dominance of the Left in recent elections has been declining in the last two election rounds. The source of the political durability of the Left Front in West Bengal is therefore an intriguing question, as is the question of why it appears to be increasingly challenged in recent years. Has the durable political success of the Left in West Bengal resulted from its actions to relieve rural poverty via land reforms and broad-based distribution of benefits from development programs? Or does it reflect a strategy of clientelism which favored particular narrow groups to the exclusion of many others?
5 Details of the surveys are described in Section 2. An important drawback of our analysis must be acknowledged at the outset: it is based on a cross-sectional analysis in which any inference of causality is slippery. The correlations, particularly at the cross-village level, should be properly viewed as descriptive facts. Nevertheless, we believe that the underlying issues are important enough that such facts and their consistency with different hypotheses should still be of considerable interest. We shall also seek to corroborate these findings with others based on longitudinal village studies (e.g., with Bardhan and Mookherjee (2006) of the same set of villages spanning , but using different data sources). Section 3 examines patterns of political participation and awareness of citizens, and how they related to measures of socio-economic status. We examine both their averages and distribution across measures of socio-economic status. With few exceptions, we find that average levels of political participation in elections, village meetings, political campaigns as well as awareness of programs administered by GPs were high. We find no evidence of lower levels of participation or awareness among poor or low caste groups. The main determining factors are education, gender and immigrant status, rather than land or caste. These results are consistent with findings for other Indian states (e.g., for Rajasthan and Madhya Pradesh in Krishna (2006)) or many Latin American countries in Gaviria et al (2002)). Section 4 studies targeting of benefits disbursed by local governments. This can be classified into divided by targeting of resources: (a) within a village by the concerned local governments, and (b) across villages and corresponding local governments by upper levels. The former is subject to more direct pressures of democracy, given the high levels of information within communities of the needs and entitlements of different residents. The latter involves negotiation among elected representatives from different local governments at the lowest level, members of the state
6 bureaucracy, and representatives elected to higher echelons of the local government system (at the block and district levels). The nature of democracy is less direct in the latter, and the allocation process substantially less transparent. Within villages we find (with a few exceptions) little evidence of systematic biases on the basis of agricultural landownership, caste, gender, education or immigrant status. Moreover, there was no bias in favor of those voting for the party with a majority of seats in the GP. Nor was there a bias in favor of those actively involved in political campaigns. Therefore there is little evidence that local governments discriminated on the basis of wealth, education, caste or political partisanship in allocating benefits within villages. Across villages, however, we find considerable biases, against villages with a high fraction of landless households: villages with a high proportion of landless received fewer benefits per household from upper level governments. Villages with greater land inequality allocated a significantly lower share of benefits to scheduled castes (SC) and scheduled tribes (ST). Members of these groups have been historically disadvantaged in terms of their social and economic status. These results suggest greater accountability at the lowest level of local governments (gram panchayats (GPs), compared with higher levels of government located at the block or district levels. These results match those of Bardhan and Mookherjee (2006) based on village panel data collected directly from the records of the local governments. 8 8 The analysis of that paper is based on information about various benefit programs from the records of local governments themselves, which contain names of beneficiaries and the nature and timing of benefits. The socio-economic characteristics of the beneficiaries were obtained from an independent indirect (third-party) household survey, in which some prominent village citizens were asked to identify land, caste, education and occupation details of each household in the village in 1978 and In contrast, the analysis of this paper is based on a one-time direct household survey carried out in 2003, where each household was asked to report the benefits it has received in the past.
7 We subsequently examine how benefit delivery patterns were related to attendance and participation rates in the village gram sabha (GS). The gram sabha is a key forum within these villages for citizens to meet at least twice a year and discuss matters pertaining to the activities of the GP. We find evidence that villages with greater GS participation were also those which delivered more benefits to the landless and SC/ST population. And villages with lower incidence of landlessness and ST presence exhibited greater GS participation. This is consistent with the hypothesis that village meetings formed a channel of accountability of GPs to the poor and low caste groups. It does not, of course, provide evidence of a causal impact of village meetings on targeting --- the results are equally consistent with the hypothesis that village meeting participation and targeting both reflected the effect of deeper, unobserved characteristics of the community reflecting its `social capital. Section 5 examines voting patterns, in order to understand better the nature of electoral pressures, and sources of incumbency advantage of the Left. At the end of our survey, we conducted a secret ballot of respondents across major political parties active in the local area. We report how different kinds of benefits received, as well as measures of improvement of economic status since 1978, were correlated with the tendency for the respondent to cast a vote in favor of the local incumbent. We find that the likelihood a given respondent voted for the Left Front coalition in our survey was correlated with benefits received from programs administered by previous Left Front-dominated local governments. However, not all benefits nor all forms of improvement in economic status mattered equally. Receipt of recurring short-term benefits rather than one-time benefits or infrastructural improvements affected voting patterns. Improvements in income or housing per se did not matter, but improvements in agricultural land ownership did. Help provided by GPs dominated by the Left Front in the past with respect to easing difficulties faced in one s occupation, or in times of personal emergency --- classic symptoms of clientelism---
8 were also significantly correlated with voting in favor of the Left Front. Controlling for these factors, as well as other personal characteristics, poorer and SC/ST groups within a village were more inclined to vote Left. The support for the Left was also greater in areas with a higher incidence of agricultural occupations, controlling for other household and community characteristics. These findings are consistent with the view that the continued domination of local government (panchayat) elections by the Left Front over five successive election terms owed partly to dispensation of recurring short-term benefit programs (such as IRDP, credit, minikits, employment and relief programs) by Left-dominated GPs to weaker sections of the community. Personalized help and short-term benefits had a stronger effect on voter support, compared with infrastructural improvements or more substantial one-time benefits (such as receiving a land title, or getting a tenancy contract registered). The results also help explain why the political success of the Left (measured by vote or seat shares) in local government elections has been declining over the last fifteen years: rising population pressure, stagnation in agricultural yields and increasing urbanization have brought about a decline in agricultural land owned per capita and in the importance of agricultural occupations. At the same time, rising education and living standards have raised awareness and aspirations of citizens, and reduced their dependence on local governments. It is however difficult to draw any definitive inferences concerning the role of clientelism vis-àvis effective governance. The evidence can be interpreted in various ways. Proponents of the latter could argue that anti-poverty and relief programs have been distributed mostly to poorer, vulnerable sections of the population; and these sections have responded by voting in favor of the Left. There is no evidence that supporters of rival parties were excluded from benefits allocated,
9 or favoritism towards active political campaigners. On the other hand, there are also a number of symptoms of clientelism: voting tended to be more responsive to help provided in times of personal difficulty or receipt of recurring short-term private benefit programs, rather than onetime, long-term benefits or provision of local public goods. 2. SURVEY DETAILS Our surveys were carried out during They involved 2400 households in a sample of 85 villages in West Bengal. The village sample is a sub-sample of an original stratified random sample of villages selected from all major agricultural districts of the state (only Kolkata and Darjeeling are excluded) by the Socio-Economic Evaluation Branch of the Department of Agriculture, Government of West Bengal, for the purpose of calculating cost of cultivation of major crops in the state between 1981 and This sample has been described in more detail in Bardhan and Mookherjee (2004, 2006). Typically, a random sample of blocks was selected in each district, and within each block one village was selected randomly, followed by random selection of another village within a 8 Km radius. Our survey teams visited these villages between 2003 and 2005, carried out a listing of landholdings of every household, then selected a stratified random sample (stratifying by landownership) of approximately 25 households per village. Selected households were subsequently administered a survey questionnaire consisting of their demographics, land, economic status, economic activities, benefits received from various development programs administered by GPs, involvement in activities pertaining to local governments (gram panchayats (GPs)), politics and local community organizations.
10 While the National Election Surveys in India use household surveys to measure political participation and attitudes, until recently they did not allow these to be related to socio-economic characteristics of households. Moreover, most of the focus of those surveys is on national elections rather than local panchayat elections or processes of local governance. Studies of political participation in local governments have been carried out for three districts each of Rajasthan and Madhya Pradesh by Krishna (2006), and two Karnataka districts by Crook and Manor (1998). Ghatak and Ghatak (2002) have studied participation in village meetings (gram sansads) in a sample of 20 villages in Birbhum district of West Bengal. 3. POLITICAL PARTICIPATION AND AWARENESS Figure 1 and Table 1 describe household characteristics in our sample. Approximately half of all households are landless; another quarter are marginal owners with less than 1.25 acres of agricultural land. The interviews were conducted usually with the household head, 90% of which were male. Education measured by highest years of schooling across all household members rose from an average of 6.6 years among the landless to 13.9 years among the biggest landowners with more than 10 acres of agricultural land. One third belonged to scheduled castes (SCs) and 3.4% to scheduled tribes (STs). The proportion of SCs is negatively correlated with landholding, but this is not evident for STs. Excepting the landless, more than two-thirds were engaged in agriculture

11 as their primary occupation, and less than one-fifths had migrated into these villages since The landless in contrast were predominantly engaged in non-agricultural occupations and twofifths were newcomers. Table 1: Sample Characteristics: Household Heads Agricultural Land Ownership Age % Male Maximum education in household % SC % ST % Agriculture Occupation % Immigrants

12 Landless acres acres acres acres acres and above ALL Figure 2 presents voter registration rates, turnout and reports of voting disturbances, by land class. Reported registration and turnout are near universal for all excepting the landless, with the exception of landless: it is likely these have been subject to some degree of over-reporting. The
13 aggregate voter turnout rate is similar to that reported (95%) in Madhya Pradesh and Rajasthan by Krishna. Among the landless, more than a tenth said they were not registered or did not vote. A much larger fraction (15%) among the landless and marginal landowners also reported disturbances at or near the polling booth, or declined to answer this question, compared with 6-9% among the rest. 9 Table 2 reports conditional logit regressions for registration, turnout, and disturbances (either reported or declined to answer), with village fixed effects. Within villages, it shows that lower registration and turnout among the landless resulted from a combination of factors apart from their lack of ownership of land: higher incidence of immigrants, nonagricultural occupations and lower education were correlated with low registration and 9 Only 4 households in the entire sample reported not being able to cast their vote because of fear of disturbances, or because they discovered their vote had already been cast by someone else, or because they had to wait too long at the polling booth. So we describe instead their response to the question whether they faced any difficulties or disturbances when they went to vote (which does not seem to have prevented them from casting their vote). About 5% households reported facing difficulties disturbances in and around voting booths, and nearly 200 households did not respond to this question. This suggests that there is some substance to allegations in the media concerning incidence of polling disturbances, but it affected a small proportion of households (between 5 and 12%), and did not affect their ability to vote.
14 TABLE 2. Logit Regressions: Voter Registration/Turnout/Disturbance (All Regressions with Village Fixed Effects) Voter Registration Voter Turnout Disturbance Agricultural Land 1.40** (.70) (0.24) (0.05) Other Land * (2.70) (0.46) (0.47) Agriculture- Occupation 17.44*** 0.96*** -0.51*** (.25) (0.27) (0.16) Immigrant -2.67*** -2.75*** (.26) (0.27) (0.18) Max Education in hh.12*** 0.12*** (.03) (0.04) (0.02) ST (.06) (1.05) (0.52) SC -.70*** -0.66*** 0.10 (.20) (0.21) (0.19) Male ** 0.08 (.33) (0.35) (0.27) Age.03*** 0.12*** (.008) (0.04) (0.03) No. of observations psuedo-r 2 /p-value.36/ / Note: All three regressions also include interactions of North Bengal dummy with male, agricultural land, SC & ST only * Significant at 10%; ** significant at 5%; *** significant at 1% turnout. We shall see below that voters with low socio-economic characteristics (SECs) are more inclined to vote in favour of the Left Front, so these patterns of turnout and registration worked to the disadvantage of the Left. At the same time, it may have reduced accountability of elected officials towards the landless vis-à-vis other classes. But the difference in reported registration rates and turnouts are modest, more similar to the European patterns rather than the steep asymmetries in the United States. With regard to voting disturbances, there is no clear correlation with socio-economic status. Nor is there any indication that polling disturbances affected Leftleaning voters more or less than Congress-leaning voters.
15
16 TABLE 3: Political Activity Regressions: Attendance, Participation and Contribution (Conditional Logits) Attendance (Village Fixed Effects) Participation (Village Fixed Effects) Contribution to Political Campaigns (No Village Fixed Effects) Contribution to Political Campaigns (Village Fixed Effects) Agricultural Land -.076*** * (.028) (.026) (.032) (.038) Other Land **.231 (.101) (.089) (.216) (.171) Agriculture- Occupation.240** (.105) (.114) (.101) (.123) Immigrant -.274** -.344*** (.111) (.125) (.106) (.129) Max Education in hh.044***.067***.096***.103*** (.013) (.014) (.012) (.015) ST 1.237*** **.206 (.374) (.355) (.309) (.407) SC.567***.208*.601***.079 (.134) (.124) (.124) (.152) Male.407**.448**.371**.435** (.185) (.192) (.152) (.196) Age ** (.019) (.021) (.003) (.022) Other Land* North Bengal dummy ** -.701* (.238) (.322) (.324) (.374) SC* North Bengal dummy -.605*** (.224) (.296) Male* North Bengal dummy *** (.615) (.846) Agriculture Land* North Bengal dummy.206***.120 (.070) (.085) No. of observations 2384/ / Pseudo-R 2 /p-value.06/0.00 Std errors are reported in parentheses. ***,**,* denotes significant at 1%,5%,10% resp.
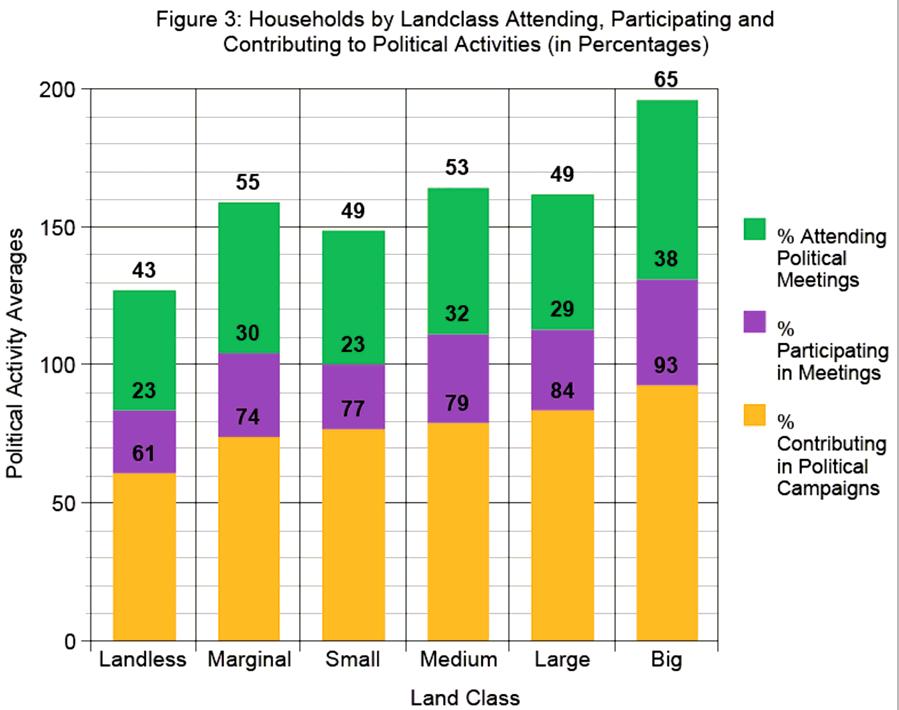
17 Figure 3 describes attendance in political meetings, such as rallies, election meetings called by political parties. Attendance rates were quite high, averaging 48% across the population, much higher than the corresponding attendance rate reported for Rajasthan and MP was 33% (Krishna (2006)). Attendance rates did not exhibit any marked unevenness across different land classes, lying above 40% for every land class, rising to 65% among big landowners. This is more likely to owe to higher education among the landed: the regression in the first column of Table 3 shows that attendance rates fell with landownership and rose with education levels, after controlling for other characteristics. Moreover they were higher among SC and ST households. As expected, males, non-immigrants, and those engaged in agricultural occupations were more likely to attend. Figure 3 and Table 3 also report on a more active form of political participation: in political campaigns. Approximately 26% of all households were engaged in campaigns. This is similar to the Karnataka districts studied by Crook and Manor (1998) ( where it was 23%), but lower than the Rajasthan and MP districts studied by Krishna (2006) (where it was 43%). In our sample this proportion was distributed quite evenly across different land classes, with the lowest proportion being 23% among the landless, and the highest participation rate being 38% among the biggest landowners. The regression results in Table 3 show no association with land or occupation. It is interesting to note the SC households are significantly more involved in campaigns, corroborating accounts of the increasingly active role played by some SC groups by Ruud (1999). A similar finding is reported for Karnataka, Rajasthan and MP by Crook and Manor (1998), and Krishna (2006) respectively. As with all other measures of participation, males and more educated heads are significantly more likely to be involved, and immigrants less likely to be involved. Finally, a staggering 69% of households reported making financial contributions to political campaigns, with the lowest proportion being 61% among the landless, rising from 74% among
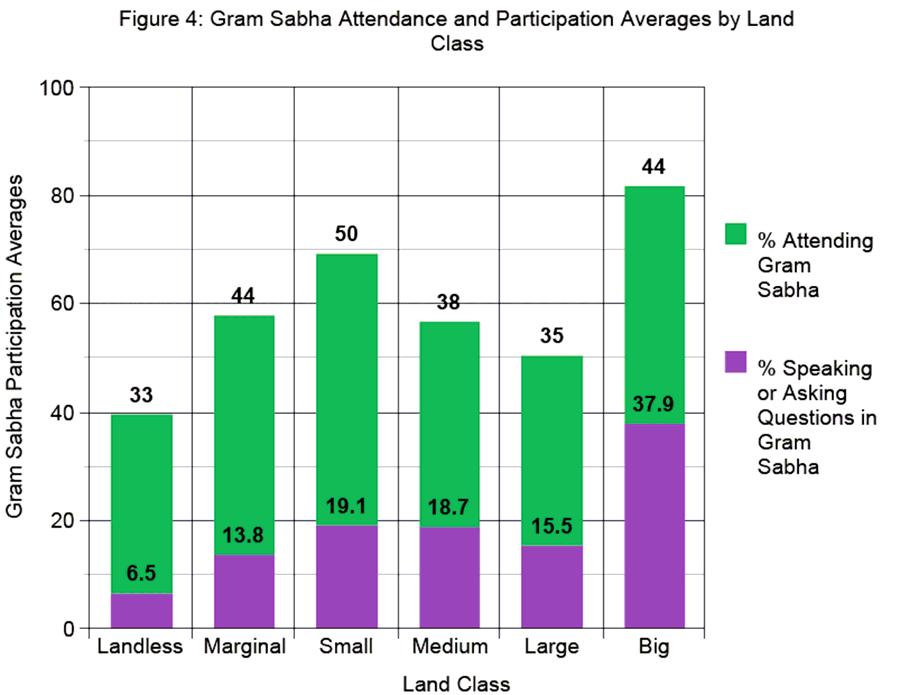
18 marginal landowners to 93% among the biggest. The regressions show some but limited association with land owned, and a stronger association with education. Figure 4 and Table 4 thereafter describe reported attendance and participation rates in gram sabhas. One-third of all households reported attending these within the previous three years, compared with 17% in the Karnataka districts studied by Crook and Manor (1998). Attendance rates exhibit some unevenness across land classes, rising from 33% among the landless to 44% among marginal landowners and 50% for those with between 1.25 and 2.5 acres, and falling thereafter to between 35 and 44% among those owning more land. The regressions in Table 4 show little association with land or caste status, but are correlated with education and immigrant status. Our survey included questions about the nature of active participation in gram sabhas: whether respondents were accustomed to standing up to speak or ask questions. These participation rates rose from 6.5% among the landless, to between 14 and 19% among marginal, small and medium landowners, and 38% among big landowners. Hence there is some unevenness in active participation in the village meetings only at the extreme ends of the economic spectrum. However, the regressions in Table 4 show the only significant predictors of active involvement in gram sabhas to be education, gender and immigrant status. For the vast majority of landowning households (i.e., excluding the top 1% of the population owning more than 10 acres of agricultural land) the likelihood of speaking in gram sabhas hardly varied. Moreover, SC/ST households were just as likely to speak up as non-sc/st households.
19
20 TABLE 4: Gram Sabha Attendance and Participation Regressions (Conditional Logits With Village Fixed Effects) Gram Sabha Attendance Conditional Logit Gram Sabha Participation Conditional Logit Agricultural Land (.029) (.036) Other Land (.090) (.109) Agriculture- Occupation (.110) (.164) Immigrant -.469*** -.713*** (.120) (.194) Max Education in hh.024*.160*** (.014) (.021) ST (.349) (.588) SC (.140) (.217) Male 1.052*** 1.301*** (.232) (.479) Age.072***.067* (.022) (.076) Other Land* North Bengal dummy (.280) (.235) SC* North Bengal dummy (.270) (.373) ST* North Bengal dummy (.661) (1.080) Agriculture Land* North Bengal dummy ** (.054) (.065) No. of observations 2191/ /69 Pseudo-R 2 /p-value /0.00 /0.00 Std. errors are reported in parentheses. ***,**,* denotes significant at 1%,5%,10% resp. 1. Also includes square of age
21 We now turn to evidence concerning political awareness. Figures 5,6 and 7 describe information sources concerning political and economic events. Figure 5 and Table 5 pertains to responses to questions pertaining to regularly watching (or hearing) political or economics news on TV (or radio). TV news exposure was positively associated with land status, as one might expect. The proportion rose from 31% among the landless, to 72% among big landowners. Table 5 shows it was significantly negatively associated with agricultural occupation, ST-SC status, and positively with education and male gender. With regard to radio news, the overall proportion was similar to TV( about 33%), but was much more even across socio-economic categories. Only education and gender were significantly correlated with exposure to radio news. Figure 6 and Table 6 describes principal sources of information concerning GP activities apart from the media. These are remarkably similar across different land classes, with the exception of the top 1% that own more than 10 acres. Between 43 and 48% get information from elected panchayat officials, between 29 and 38% from friends, relatives or neighbours, and between 18 and 25% from political party activists. Gram sabhas, or government bureaucrats do not have any significant role as information providers. The regressions indicate almost no pattern of variation with SECs, except for a slight tendency for more educated heads to rely less on informal sources (family, friends or party activists). These results imply homogenous access to information concerning GP activities across various socio-economic categories within villages. Figure 7 and Table 6 describes awareness of development or antipoverty programs administered by GPs. On average, less than 20% in most classes were aware of these programs, which seems quite low (and probably reflects the small scale of these programs: the average proportion of households that reported receiving benefits from any single program did not exceed 4%; and only in three or four programs did reported benefit rates exceed 1%). The raw averages show some
22 tendency for the top 1% of the population to be more aware, and the landless to be less aware, but otherwise awareness tends to vary little across land classes. The regressions show that those with less land were more likely to be aware, after controlling for education, immigrant status and gender. SC and ST heads were likely to be just as aware as anyone else, and in some cases (employment programs for STs and housing programs for SCs) were likely to be significantly more aware. There was a tendency for awareness to vary with need and/or entitlement: the landless were more aware of loan and employment programs; marginal landowners more aware of loan and seed programs. In summary, rates of political participation appeared high on average, and did not vary much with socio-economic characteristics such as land and caste, with some exceptions: lower voter turnouts and participation in gram sabhas among the landless and SC/ST groups. They did, however, vary significantly with education, gender and immigrant status. Controlling for these, there was little evidence of political marginalization or exclusion of weaker socio-economic groups. Marginal landowners, SC or ST populations seemed well integrated into local political life, often participating more vigorously than others, with access to similar information flows concerning GP activities. Only immigrants, women and those with low education seemed significantly less involved and aware.

23
 (3.857) (3.858) Agriculture- Occupation -.039.149.137 (.459) (.464) (.462) Immigrant.656.592 1.056 (.567) (.574) (.569) Max Education in hh -.079 -.129** -.128*** (.057) (.")
24 Table 5: Information Sources (Multinomial Logits ) Panchayat Members Political Party Activists Friends/ Relatives/ Neighbors Agricultural Land (0.175) (.176) (.176) Other Land (3.856) (3.857) (3.858) Agriculture- Occupation (.459) (.464) (.462) Immigrant (.567) (.574) (.569) Max Education in hh ** -.128*** (.057) (.057) (.057) ST (1.064) (1.080) (1.062) SC (.472) (.478) (.475) Male (.767) (.778) (.704) Other Land* North Bengal dummy (3.962) (3.979) (3.951)

25 (n=1991, pseudo R 2 =0.026)
26 TABLE 6: Information Regarding GP Administered Development Programs (Conditional Logit with Village Fixed Effects:) 1 Current GP programs New GP programs Past Loan Program Seed Program Employment Programs Construction /Housing Programs Agricultural Land * ** (.041) (.036) (.032) (.033) (.038) (.033) Other Land (.114) (.115) (.110) (.103) (.126) (.105) Agriculture- Occupation ***.986*** ** (.176) (.164) (.132) (.160) (.157) (.126) Immigrant -.527*** -.516*** -.521*** -.706*** -.339* -.419*** (.196) (.188) (.152) (.197) (.177) (.140) Max Education in hh.180***.123***.040**.120***.045**.016 (.024) (.022) (.016) (.020) (.020) (.016) ST.856* **.341 (.477) (.433) (.340) (.394) (.365) (.320) SC ** (.197) (.182) (.148) (.178) (.173) (.136) Male 1.167*** 1.606***.629** (.409) (.470) (.246) (.286) (.262) (.212) Age *** (.038) (.036) (.028) (.032) (.031) (.025) Other Land* North Bengal dummy (2.809) (.630) (.784) (.547) (.449) (.354) No. of observation s 1685/ / / / / /82 p-value Std. errors are reported in parentheses. ***,**,* denotes significant at 1%,5%,10% resp. 1. Includes age squared.
27 4. TARGETING PATTERNS AND GRAM SABHA ATTENDANCE In this section we consider the distribution of benefits within and across villages, the extent to which they were targeted to poor and SC/ST groups, and how these targeting patterns varied with one form of political participation attendance and participation in gram sabhas. Since we are relying on a one-time household survey, we can only examine cross-village regressions of targeting with political participation. Such cross-section regressions are fraught with all the customary qualifications: they do not establish causation, and may reflect the joint effect of unobserved community characteristics. These regressions merely represent one way of checking whether the evidence is consistent with the hypothesis that political participation affects accountability of elected government officials. One additional value of the exercise is that data concerning allocation of benefits of various public services is often lacking, while evidence on political participation is more easily available (e.g., by observing attendance rates in civic and political meetings). The results can inform us on the extent to which attendance rates be taken to be an indicator of how well the democratic process is functioning with regard to service delivery. Table 7 provides averages of various benefit programs (house, water, employment, minikits, IRDP, roads, relief against disasters or old-age or widow status, and ration card) that households reported receiving over the periods and over We report these two periods separately, as the reported benefits for the earlier period may be subject to greater recall bias. We see that the proportions reported receiving benefits of most kinds were substantially higher for the
28 later period. We therefore use reported benefits for the period subsequently in our analysis of targeting. Table 7 shows a large fraction of village households benefited from various programs during the period. The largest benefits were reported for roads (32%) and water (24%). Ration card and relief programs were reported by 12%, minikits and employment by 5% and 2-3% for IRDP and housing. Table 7 also indicates the high proportion of these benefits that were allocated to landless and SC/ST categories, consistent with the results in Bardhan and Mookherjee (2006) based on data collected for the period from local government records. Between 50-67% of houses constructed by the GP benefited SC/ST households, who collectively comprised less than 40% of the population. For other programs (with the single exception of minikit allocation to the landless) the proportions of landless and SC/ST households reported receiving benefits was approximately similar to or higher than their demographic weight. Table 8A examines determinants of the number of benefits (aggregating across different programs) received by a household over the period , controlling for village fixed effects. This indicates the nature of intra-village targeting. The first column shows that those with more non-agricultural land were somewhat likely to receive more benefits. Apart from this, there was no tendency to discriminate on the basis of education, caste or agricultural land. There was no noticeable bias against the poor, against women-headed households, or against immigrants. In villages with higher attendance rates in the gram sabha, the bias in favor of those with more non-agricultural land was significantly less, and there was better treatment of the SC households. The second column of Table 8A indicates the extent to which benefits received varied with how politically active the household was, and the way that the household voted. If benefits were
29 granted in a politically partisan manner, one would expect that controlling for other relevant characteristics, the party in power would discriminate in favor of those voting for it. We also see how benefits correlated with attendance in political meetings, and participation or contribution to political campaigns. We find no significant association with the way the household voted: those voting for the opposite party were likely to be treated the same way as its own supporters. The association with political meetings and campaigns is complex: with a bias in favor of those attending meetings and against those participating in campaigns in villages with low gram sabha attendance rates. These biases are significantly smaller in villages with high gram sabha attendance rates. Table 8B further explores the possible role of political partisanship in distribution of benefits, distinguishing further between swing voters and those voting consistently for one party over successive elections. In the next Section we shall see that almost half the sample reported voting for the Left in all past elections: we call these Left-secure voters. A substantially smaller fraction voted consistently for non-left parties in all past elections: we refer to them as non-left-secure voters. Those changing their allegiance are denoted as non-secure voters. Conceivably, the Left may seek to woo swing voters and favor them relative to Left-secure voters in the distribution of benefits. Alternatively, voters that have been treated worse by a Left-controlled GP may be more inclined to switch allegiance to a non-left party, so Left-secure voters may have been treated better than swing voters. Moreover, a party controlling a GP may discriminate against voters committed to the rival party, relative to swing or its own secure constituency. Four additional variables are included in the regression, based on the combination of majority party in the GP (Left, or non-left), and whether the voter is a Left-secure or non-left-secure voter. None of these turn out to be statistically significant, while other coefficients are unchanged compared with
30 Table 8A. Hence there appears to be no evidence of any partisan treatment by either Leftcontrolled or non-left-controlled GPs. Table 7: Average Percentage of Households Receiving Different Kinds of Benefits, for the period and House Water Employment Minikits IRDP Road Relief Ration card % HH Recd Ben ( ) % HH Recd Ben ( ) Fraction of benefits accruing to SC/ST ( ) Fraction of benefits accruing to SC/ST ( ) Fraction of benefits accruing to landless ( ) Fraction of benefits accruing to landless ( )
31 Table 8A: Intra Village Targeting Within Villages, Based on Household Responses (OLS Regression with Village Fixed Effects) Number of GP Benefits Received by Household Number of GP Benefits Received by Household Education -0.2 (0.04) (0.04) SC Dummy (0.36) (-0.59) ST Dummy 1.41 (1.02) 1.14 (1.09) Non agricultural land owned 0.70* (0.37) 0.72* (0.39) Agricultural Land Owned (0.07) (0.08) Political Meeting Attendance 0.95** (0.42) Dummy Political Campaign -0.87* (0.48) Involvement Dummy Campaign Contribution Made (0.40) Dummy Voted for Winning Party (0.34) Dummy GS Att Rate * Education (0.12) (0.13) GS Att. Rate * SC 1.98** (1.01) 1.51 (1.08) GS Att. Rate * ST (2.95) (2.98) GS Att Rate * Nonagr Land -1.84* (0.98) -2.05* (1.09) GS Att Rate * Agr Land 0.09 (0.19) 0.14 (0.19) GS Att Rate * Pol Meet -1.96* (1.13) Attendance Dummy GS Att Rate * Pol Campaign 3.17** (1.25) Involvement Dummy GS Att Rate * Campaign (1.22) Contribution Dummy GS Att Rate * Voted for Winning Party Dummy 0.28 (0.93) N, p-value 2176, , Note: Standard Errors in Parentheses Controls Include age, gender, occupation, immigrant dummy and interactions
32 Table 8B: Intra Village Targeting Within Villages, Based on Household Responses, including swing, Left-secure, non-left-secure dummy (OLS Regression with Village Fixed Effects) (1) (2) Number of GP Benefits Received by Household Number of GP Benefits Received by Household Education (0.045) (0.048) SC (0.366) (0.387) ST (1.024) (1.049) Non Agricultural land 0.704* 0.719* (0.376) (0.393) Agricultural land (0.078) (0.080) Education*GS Attendance (0.126) (0.133) SC*GS Attendance 2.008** (1.014) (1.090) ST*GS attendance (2.933) (2.992) Non agricultural land* GS * * Attendance (0.981) (1.106) Agricultural land*gs Attendance (0.194) (0.199) Winning party and Left Secure (0.137) (0.179) Winning party and Non Left Secure (0.349) (0.397) Non Winning party and Left Secure (0.276) (0.290) Non Winning party and Non Left Secure (0.179) (0.208) Political meeting participation 0.960** (0.424) Political campaign involvement * (0.481) Contribution to Campaign (0.407)
33 Winning party Dummy (0.382) Political meeting * participation Interaction (1.137) Political campaign 3.237** involvement Interaction (1.260) Contribution to Campaign Interaction (1.228) Winning party interaction (0.967) Observations Number of Numeric code of each village Standard errors in parentheses Significant at 10%; ** significant at 5%; *** significant at 1% Other controls include age, occupation, male, immigrant dummy and their interactions Table 9: Cross-Village Regression of Intra-Village Targeting Ratios Dependent Variable: Share of GP Benefits going to specified group in the village Landless % Share SC/ST % Share GS Attendance -0.35** -0.32** (0.15) 0.12 GS Att. * % Landless 1.69*** (0.41) % Landless (0.20) % SC (LL) (0.06) % ST (LL) (0.10) Land Gini *** (0.24) (0.21) Education Gini 0.33 (0.22) GS Att. * % SC Landless 6.02*** (2.28) GS Att. * % ST Landless 2.19*** (0.45) N, R-Squared 88, , 0.32 Note: Standard Errors in Par entheses; Controls Include average land, education
34 Table 9 examines how intravillage targeting ratios (aggregating across all benefits) for the period were correlated with gram sabha attendance rates across villages, besides measures of inequality in land and education (controlling for the demographic weights of the landless and SC/ST groups, and average land holdings and education in the village). A higher demographic weight of the landless indicates a higher incidence of landlessness in the village, given the average landholding in the village --- i.e., greater poverty. 10 Note that if per capita benefit received by members of a particular group do not vary with the relative size of the group, the share of this group as a whole would increase proportionally with the demographic weight of the group. If the per capita benefit accruing to the landless rises (resp. falls) with the extent of landlessness, the targeting share of the landless would be decreasing in their demographic weight. The first column shows an insignificant association of the targeting share of the landless with their demographic weight --- suggesting that their per capita benefit was declining significantly with the extent of landlessness. Moreover, there was a significant positive interaction between GS attendance rates and the demographic weight of the landless. This suggests that the per capita benefit was significantly higher in villages with higher GS attendance rates. Otherwise, the targeting share did not co-vary with land or education inequality. The second column provides corresponding results for the targeting share of the SC/ST group. Consistent with the results in Bardhan and Mookherjee (2006) based on an entirely different source and nature of data for the same villages covering the period , we find a significant 10 In Bardhan and Mookherjee (2006), increasing landlessness was associated with significantly lower wage rates for agricultural workers, controlling for village fixed effects and other time-varying village characteristics (such as rainfall, population density, agricultural yields and other measures of land distribution).
35 negative association with land inequality. 11 We also find a significant positive interaction between GS attendance rates and the demographic weights of these groups. Table 10A examines the pattern of inter-village allocation of benefits. The dependent variable is the number of benefits received per household (aggregating across all programs) in a village over the period Villages with a larger proportion of landless received significantly smaller benefits, indicating a perverse pattern of targeting by higher level governments. This is consistent with the results in Bardhan and Mookherjee (2006). Combined with Table 9, this indicates lower government accountability to the poor in villages with greater poverty: a village with more landless households got fewer resources as a whole from upper-level governments. And of the resources they obtained, they allocated a lower share to the landless. We do not see signs of any significant bias in cross-village allocations with respect to the proportion of SC/ST groups. The second column in Table 10A includes the share of the Left Front in local government seats during the period, and the third column also adds the square of this share. There is a significant U-shaped relation with the extent of Left domination of the local government, with a turning point at around 57%. This suggests a tendency to allocate more resources to GPs where the Left Front was solidly entrenched (i.e, had a two-third majority or higher), compared with those more evenly contested. Hence there seems to be evidence of political partisanship in the inter-village allocation, in contrast to intra-village allocations. 11 That paper was based on data concerning distribution of IRDP credit, minikits and employment from local government sources, and pertained to regressions of the targeting ratio for SC/STs on time-varying measures of land distribution in the village, controlling for village fixed effects.
36 Table 10A: Cross-Village Benefit Targeting Regressions (1) (2) (3) Number of Benefits per Household Number of Benefits per Household Number of Benefits per Household Proportion Landless ** *** *** (0.391) (0.400) (0.385) Proportion SC (0.385) (0.385) (0.370) Proportion ST (0.527) (0.527) (0.513) Left Share 98_ *** (0.715) (3.517) Left Share Squared 9.475*** (3.400) Constant 1.666*** 2.285*** 4.541*** (0.227) (0.454) (0.920) Observations R-squared Standard errors in parentheses * Significant at 10%; ** significant at 5%; *** significant at 1% Table 10B: Inter Village Targeting Ratios Across Villages Dependent Variable: Number of GP Benefits per Household in Village, Using GS Attendance Rate of all Using GS Attendance Rate of poor GS Attendance (1.95) (1.96) GS Att. * % Landless (2.63) (7.93) % Landless ** (1.36) (1.15) % SC ** (1.06) (0.88) % ST (0.96) (0.73) Land Gini (1.54) (1.48) Education Gini 5.01** 5.82*** (2.21) (1.90) GS Att. * % SC ** (2.49) (2.49) GS Att. * % ST (3.41) (4.86) GS Att * Ed Gini ** *** (5.25) (5.67) N, R-Squared 88, , 0.25
37 Note: Standard Errors in Parenthesis; Controls Include average land Table 11: GS Attendance/Speech Rates: Cross Village Regression Attendance (OLS) Attendance (District FE) Speech (OLS) Speech (District FE) % Landless -0.48** -0.36* (0.16) (0.20) (0.10) (0.11) % SC ** (0.07) (0.09) (0.04) (0.05) % ST -0.30** -0.38*** -0.11* -0.17** (0.10) (0.12) (0.06) (0.07) Land Gini (0.29) (0.32) (0.18) (0.19) Education Gini (0.21) (0.24) (0.13) (0.14) N, R-Squared 88, , , , 0.18 Controls Include Average Land Table 10B examines how inter-village allocations were affected by GS attendance rates within those villages. If we differentiate between villages with high and low attendance rates of the poor (the second column of Table 10B), the inter-village biases become even more sharply evident. Among villages with low attendance rates, those with more landless or SC households received significantly fewer benefits. In addition, villages with greater inequality in education were favored. These biases were substantially smaller in villages with high GS attendance rates of poor households. Hence the results indicate that gram sabha attendance rates were positively correlated with targeting in favor of landless and SC groups. Could gram sabha attendance represent one channel by which inequalities in land or social status were associated with poorer targeting? Recall from Table 4 that attendance rates were not significantly associated with land or caste at the household level. Table 11 examines how attendance and participation rates were correlated with village characteristics (across villages). Villages with a higher incidence of landlessness and ST status
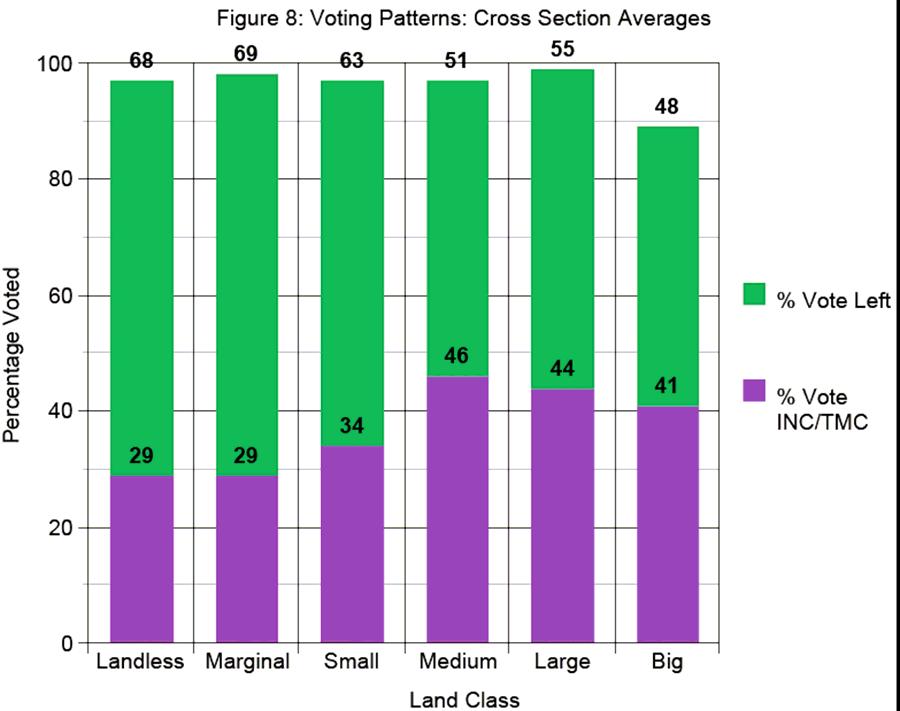
38 exhibited lower attendance rates, irrespective of whether we control for district fixed effects. Controlling for this, land or education inequality was not significantly associated with attendance rates. In summary, gram sabha attendance rates were correlated with measures of targeting to vulnerable sections of the population. They were also negatively correlated with landlessness and incidence of ST households. Hence gram sabha attendance represented one possible channel by which inequality in land and in social status translated into lower accountability of panchayat officials to the landless and SC/ST groups. 5. VOTING PATTERNS Figures 8 and 9 present voting patterns across different political parties in the secret ballot we administered at the end of the household survey. Each respondent was asked to select from symbols representing different parties used in elections, and cast the ballot into a sealed box. Ballots were marked by a code number for each respondent and opened later, and recorded in data sheets. A similar procedure has been used in National Election Surveys. Figure 8 reveals that approximately two thirds of small, marginal and landless households voted in favor of a Left Front party; the remainder voted for either the Indian National Congress (INC) or the Trinamul Congress (TNC). Among medium and large landowning families the proportion voting Left was slightly above 50%, and among the big landowners this proportion dropped below 50%, with a correspondingly higher share for the INC/TNC. Figure 9 provides average proportion of GP seats and vote shares secured by the Left Front in different panchayat elections between 1978 and The Left secured an absolute majority in
39 most panchayats throughout this period. However, its vote and seat share exhibit parallel fluctuations across different election years, with some secular decline over the period as a whole. In 1998, its vote share dropped below 50%, and seat share dropped below 60%, for the first time. Part of the continued domination of the Left Front has been associated with a large loyal base of voters. 45% of respondents reported that they vote the same way as their fathers, while an even higher proportion (67%) reported voting for the same party the last 25 years. The proportion that voted for Left Front parties in our ballot was 65%. Among those voting Left, the proportions of loyal voters were slightly higher than in the entire population: 48% reported voting like their father, and 76% reported having voted consistently for the same party the last 25 years. This implies approximately half of all voters have been loyal to the Left throughout the past quarter century.
40

41 Table 12 presents regressions predicting whether a respondent voted for a Left Front party in our ballot, on the basis of reported benefits and their timing, apart from various household characteristics. The first two columns use a 0-1 dummy for whether a given household received some benefit, as a measure of benefits received. This is interacted with the seat share of the Left Front in the year that the benefit was reportedly received, since the `gratitude of the voter will be directed to the party that was in power in the local government that directed the benefits. We separate the role of benefits received by the household in question, from those received by friends or kin, and the proportion of households in the village as a whole that received benefits. We also include help provided by the GP to the household in connection with difficulties faced by the
POLITICAL PARTICIPATION, CLIENTELISM AND TARGETING OF LOCAL GOVERNMENT PROGRAMS: Results from a Rural Household Survey in West Bengal, India 1
 POLITICAL PARTICIPATION, CLIENTELISM AND TARGETING OF LOCAL GOVERNMENT PROGRAMS: Results from a Rural Household Survey in West Bengal, India 1 Pranab Bardhan 2, Sandip Mitra 3, Dilip Mookherjee 4 and Abhirup
Political Stability, Local Democracy and Clientelism In Rural West Bengal 1
 Political Stability, Local Democracy and Clientelism In Rural West Bengal 1 Pranab Bardhan a, Sandip Mitra b, Dilip Mookherjee c and Abhirup Sarkar d April, 2008 Abstract The paper examines political awareness,
PANCHAYATI RAJ AND POVERTY ALLEVIATION IN WEST BENGAL: SUMMARY OF RESEARCH FINDINGS. Pranab Bardhan and Dilip Mookherjee.
 PANCHAYATI RAJ AND POVERTY ALLEVIATION IN WEST BENGAL: SUMMARY OF RESEARCH FINDINGS Pranab Bardhan and Dilip Mookherjee December 2005 The experience of West Bengal with respect to Panchayat Raj has been
Amongst all Indian states, West Bengal is the only one in
 local government in rural west Bengal Local Democracy and Clientelism: Implications for Political Stability in Rural West Bengal Pranab Bardhan, Sandip Mitra, Dilip Mookherjee, Abhirup Sarkar This paper
Pranab Bardhan. Sandip Mitra. Dilip Mookherjee. Anusha Nath
 Understanding Voting Patterns in Rural West Bengal: Role of Clientelism and Local Public Goods Pranab Bardhan University of California, Berkeley Sandip Mitra Indian Statistical Institute, Kolkata Dilip
A Clientelistic Interpretation of Effects of Political Reservations in West Bengal Local Governments
 A Clientelistic Interpretation of Effects of Political Reservations in West Bengal Local Governments Pranab Bardhan and Dilip Mookherjee September 2011 Bardhan and Mokherjee () Political Clientelism and
Political Reservation and Substantive Representation: Evidence from Indian Panchayats
 Political Reservation and Substantive Representation: Evidence from Indian Panchayats Esther Duflo (based on joint work with Lori Beaman, Raghabendra Chattopadhyay, Rohini Pande and Petia Topalova October
Women as Policy Makers: Evidence from a Randomized Policy Experiment in India
 Women as Policy Makers: Evidence from a Randomized Policy Experiment in India Chattopadhayay and Duflo (Econometrica 2004) Presented by Nicolas Guida Johnson and Ngoc Nguyen Nov 8, 2018 Introduction Research
Subhasish Dey, University of York Kunal Sen,University of Manchester & UNU-WIDER NDCDE, 2018, UNU-WIDER, Helsinki 12 th June 2018
 Do Political Parties Practise Partisan Alignment in Social Welfare Spending? Evidence from Village Council Elections in India Subhasish Dey, University of York Kunal Sen,University of Manchester & UNU-WIDER
Capture and Governance at Local and National Levels
 Capture and Governance at Local and National Levels By PRANAB BARDHAN AND DILIP MOOKHERJEE* The literature on public choice and political economy is characterized by numerous theoretical analyses of capture
Changing Voting Patterns in Rural West Bengal Role of Clientelism and Local Public Goods
 Changing Voting Patterns in Rural West Bengal Role of Clientelism and Local Public Goods Pranab Bardhan, Sandip Mitra, Dilip Mookherjee, Anusha Nath This paper uses two successive rounds of voter surveys
Accountability of Local and State Governments in India: An Overview of Recent Research 1
 Accountability of Local and State Governments in India: An Overview of Recent Research 1 Dilip Mookherjee 2 October 14, 2012 1 Text of the P.G. Kumar Memorial Lecture delivered at the Centre for Development
Resource Transfers to Local Governments: Political Manipulation and Voting Patterns in West Bengal
 Resource Transfers to Local Governments: Political Manipulation and Voting Patterns in West Bengal Pranab Bardhan, Sandip Mitra, Dilip Mookherjee and Anusha Nath October 28, 2015 Abstract This paper examines
Poverty Reduction and Economic Growth: The Asian Experience Peter Warr
 Poverty Reduction and Economic Growth: The Asian Experience Peter Warr Abstract. The Asian experience of poverty reduction has varied widely. Over recent decades the economies of East and Southeast Asia
Efficiency Consequences of Affirmative Action in Politics Evidence from India
 Efficiency Consequences of Affirmative Action in Politics Evidence from India Sabyasachi Das, Ashoka University Abhiroop Mukhopadhyay, ISI Delhi* Rajas Saroy, ISI Delhi Affirmative Action 0 Motivation
Political Clientelism and Capture: Theory and Evidence from West Bengal
 Political Clientelism and Capture: Theory and Evidence from West Bengal Pranab Bardhan and Dilip Mookherjee May 2011 Bardhan and Mokherjee () Political Clientelism and Capture May 9, 2011 1 / 1 Introduction
Openness and Poverty Reduction in the Long and Short Run. Mark R. Rosenzweig. Harvard University. October 2003
 Openness and Poverty Reduction in the Long and Short Run Mark R. Rosenzweig Harvard University October 2003 Prepared for the Conference on The Future of Globalization Yale University. October 10-11, 2003
Rural and Urban Migrants in India:
 Rural and Urban Migrants in India: 1983 2008 Viktoria Hnatkovska and Amartya Lahiri This paper characterizes the gross and net migration flows between rural and urban areas in India during the period 1983
LAND REFORM, DECENTRALIZED GOVERNANCE AND RURAL DEVELOPMENT IN WEST BENGAL 1. This version: May 22, 2006
 LAND REFORM, DECENTRALIZED GOVERNANCE AND RURAL DEVELOPMENT IN WEST BENGAL 1 Pranab Bardhan 2 and Dilip Mookherjee 3 This version: May 22, 2006 Abstract Since the late 1970s the West Bengal government
Vote Buying and Clientelism
 Vote Buying and Clientelism Dilip Mookherjee Boston University Lecture 18 DM (BU) Clientelism 2018 1 / 1 Clientelism and Vote-Buying: Introduction Pervasiveness of vote-buying and clientelistic machine
Rural and Urban Migrants in India:
 Rural and Urban Migrants in India: 1983-2008 Viktoria Hnatkovska and Amartya Lahiri July 2014 Abstract This paper characterizes the gross and net migration flows between rural and urban areas in India
There is a seemingly widespread view that inequality should not be a concern
 Chapter 11 Economic Growth and Poverty Reduction: Do Poor Countries Need to Worry about Inequality? Martin Ravallion There is a seemingly widespread view that inequality should not be a concern in countries
ANNUAL SURVEY REPORT: REGIONAL OVERVIEW
 ANNUAL SURVEY REPORT: REGIONAL OVERVIEW 2nd Wave (Spring 2017) OPEN Neighbourhood Communicating for a stronger partnership: connecting with citizens across the Eastern Neighbourhood June 2017 TABLE OF
BLISS INSTITUTE 2006 GENERAL ELECTION SURVEY
 BLISS INSTITUTE 2006 GENERAL ELECTION SURVEY Ray C. Bliss Institute of Applied Politics The University of Akron Executive Summary The Bliss Institute 2006 General Election Survey finds Democrat Ted Strickland
Publicizing malfeasance:
 Publicizing malfeasance: When media facilitates electoral accountability in Mexico Horacio Larreguy, John Marshall and James Snyder Harvard University May 1, 2015 Introduction Elections are key for political
Experiments in Election Reform: Voter Perceptions of Campaigns Under Preferential and Plurality Voting
 Experiments in Election Reform: Voter Perceptions of Campaigns Under Preferential and Plurality Voting Caroline Tolbert, University of Iowa (caroline-tolbert@uiowa.edu) Collaborators: Todd Donovan, Western
Georg Lutz, Nicolas Pekari, Marina Shkapina. CSES Module 5 pre-test report, Switzerland
 Georg Lutz, Nicolas Pekari, Marina Shkapina CSES Module 5 pre-test report, Switzerland Lausanne, 8.31.2016 1 Table of Contents 1 Introduction 3 1.1 Methodology 3 2 Distribution of key variables 7 2.1 Attitudes
Supplementary Materials for Strategic Abstention in Proportional Representation Systems (Evidence from Multiple Countries)
") Supplementary Materials for Strategic Abstention in Proportional Representation Systems (Evidence from Multiple Countries) Guillem Riambau July 15, 2018 1 1 Construction of variables and descriptive statistics.
Supplementary Materials for Strategic Abstention in Proportional Representation Systems (Evidence from Multiple Countries) Guillem Riambau July 15, 2018 1 1 Construction of variables and descriptive statistics.
ANNUAL SURVEY REPORT: ARMENIA
 ANNUAL SURVEY REPORT: ARMENIA 2 nd Wave (Spring 2017) OPEN Neighbourhood Communicating for a stronger partnership: connecting with citizens across the Eastern Neighbourhood June 2017 ANNUAL SURVEY REPORT,
Dimensions of rural urban migration
 CHAPTER-6 Dimensions of rural urban migration In the preceding chapter, trends in various streams of migration have been discussed. This chapter examines the various socio-economic and demographic aspects
Research Report. How Does Trade Liberalization Affect Racial and Gender Identity in Employment? Evidence from PostApartheid South Africa
 International Affairs Program Research Report How Does Trade Liberalization Affect Racial and Gender Identity in Employment? Evidence from PostApartheid South Africa Report Prepared by Bilge Erten Assistant
Why Political Reservations?
 Why Political Reservations? Esther Duflo September 2004 Abstract Many countries are amending their political systems to set aside positions to groups, such as women and racial or religious minorities that
ELITE AND MASS ATTITUDES ON HOW THE UK AND ITS PARTS ARE GOVERNED VOTING AT 16 WHAT NEXT? YEAR OLDS POLITICAL ATTITUDES AND CIVIC EDUCATION
 BRIEFING ELITE AND MASS ATTITUDES ON HOW THE UK AND ITS PARTS ARE GOVERNED VOTING AT 16 WHAT NEXT? 16-17 YEAR OLDS POLITICAL ATTITUDES AND CIVIC EDUCATION Jan Eichhorn, Daniel Kenealy, Richard Parry, Lindsay
Electoral competition and corruption: Theory and evidence from India
 Electoral competition and corruption: Theory and evidence from India Farzana Afridi (ISI, Delhi) Amrita Dhillon (King s College London) Eilon Solan (Tel Aviv University) June 25-26, 2018 ABCDE Conference,
Does political connections and affiliation affect allocation of benefits in the Rural Employment Guarantee Scheme: Evidence from West Bengal, India #
 Does political connections and affiliation affect allocation of benefits in the Rural Employment Guarantee Scheme: Evidence from West Bengal, India # Upasak Das * Abstract Decentralization at local level
The Redistributive Effects of Political Reservation for Minorities: Evidence from India
 The Redistributive Effects of Political Reservation for Minorities: Evidence from India Aimee Chin 1 and Nishith Prakash 2, 3 This Draft: February 2009 Abstract We examine the impact of political reservation
SIERRA LEONE 2012 ELECTIONS PROJECT PRE-ANALYSIS PLAN: INDIVIDUAL LEVEL INTERVENTIONS
 SIERRA LEONE 2012 ELECTIONS PROJECT PRE-ANALYSIS PLAN: INDIVIDUAL LEVEL INTERVENTIONS PIs: Kelly Bidwell (IPA), Katherine Casey (Stanford GSB) and Rachel Glennerster (JPAL MIT) THIS DRAFT: 15 August 2013
THE WORKMEN S CIRCLE SURVEY OF AMERICAN JEWS. Jews, Economic Justice & the Vote in Steven M. Cohen and Samuel Abrams
 THE WORKMEN S CIRCLE SURVEY OF AMERICAN JEWS Jews, Economic Justice & the Vote in 2012 Steven M. Cohen and Samuel Abrams 1/4/2013 2 Overview Economic justice concerns were the critical consideration dividing
Does Political Reservation for Minorities Affect Child Labor? Evidence from India. Elizabeth Kaletski University of Connecticut
 Does Political Reservation for Minorities Affect Child Labor? Evidence from India Elizabeth Kaletski University of Connecticut Nishith Prakash University of Connecticut Working Paper 2014-12 May 2014 365
Res Publica 29. Literature Review
 Res Publica 29 Greg Crowe and Elizabeth Ann Eberspacher Partisanship and Constituency Influences on Congressional Roll-Call Voting Behavior in the US House This research examines the factors that influence
Judicial Elections and Their Implications in North Carolina. By Samantha Hovaniec
 Judicial Elections and Their Implications in North Carolina By Samantha Hovaniec A Thesis submitted to the faculty of the University of North Carolina in partial fulfillment of the requirements of a degree
Does Political Competition Reduce Ethnic Discrimination?
 Does Political Competition Reduce Ethnic Discrimination? Evidence from the Samurdhi Food Stamp Program in Sri Lanka Iffath Sharif Senior Economist South Asia Social Protection February 14, 2011 Presentation
WomenasPolicyMakers:Evidencefroma Randomized Policy Experiment in India 1
 WomenasPolicyMakers:Evidencefroma Randomized Policy Experiment in India 1 by Raghabendra Chattopadhyay and Esther Duflo Abstract This paper uses political reservations for women in India to study the impact
From Banerjee and Iyer (2005)
") From Banerjee and Iyer (2005) History, Institutions, and Economic Performance: The Legacy of Colonial Land Tenure Systems in India American Economic Review, Vol. 95, No. 4 (Sep., 2005), pp. 1190-1213 Similar
From Banerjee and Iyer (2005) History, Institutions, and Economic Performance: The Legacy of Colonial Land Tenure Systems in India American Economic Review, Vol. 95, No. 4 (Sep., 2005), pp. 1190-1213 Similar
Robert H. Prisuta, American Association of Retired Persons (AARP) 601 E Street, N.W., Washington, D.C
 601 E Street, N.W., Washington, D.C") A POST-ELECTION BANDWAGON EFFECT? COMPARING NATIONAL EXIT POLL DATA WITH A GENERAL POPULATION SURVEY Robert H. Prisuta, American Association of Retired Persons (AARP) 601 E Street, N.W., Washington, D.C.
A POST-ELECTION BANDWAGON EFFECT? COMPARING NATIONAL EXIT POLL DATA WITH A GENERAL POPULATION SURVEY Robert H. Prisuta, American Association of Retired Persons (AARP) 601 E Street, N.W., Washington, D.C.
Non-Voted Ballots and Discrimination in Florida
 Non-Voted Ballots and Discrimination in Florida John R. Lott, Jr. School of Law Yale University 127 Wall Street New Haven, CT 06511 (203) 432-2366 john.lott@yale.edu revised July 15, 2001 * This paper
প রত ধ বত the Echo. Volume-III, Issue-I July
 প রত ধ বত the Echo Pratidhwani the Echo A Peer-Reviewed Indexed International Journal of Humanities & Social Science Published by: Dept. of Bengali Karimganj College, Karimganj, Assam, India Website: https://www.thecho.in
THE EFFECT OF EARLY VOTING AND THE LENGTH OF EARLY VOTING ON VOTER TURNOUT
 THE EFFECT OF EARLY VOTING AND THE LENGTH OF EARLY VOTING ON VOTER TURNOUT Simona Altshuler University of Florida Email: simonaalt@ufl.edu Advisor: Dr. Lawrence Kenny Abstract This paper explores the effects
Democratization, Decentralization and the Distribution of Local Public Goods. in a Poor Rural Economy. Andrew D. Foster Brown University
 Democratization, Decentralization and the Distribution of Local Public Goods in a Poor Rural Economy Andrew D. Foster Brown University Mark R. Rosenzweig University of Pennsylvania November 2001 The research
Ohio State University
 Fake News Did Have a Significant Impact on the Vote in the 2016 Election: Original Full-Length Version with Methodological Appendix By Richard Gunther, Paul A. Beck, and Erik C. Nisbet Ohio State University
Hungary. Basic facts The development of the quality of democracy in Hungary. The overall quality of democracy
 Hungary Basic facts 2007 Population 10 055 780 GDP p.c. (US$) 13 713 Human development rank 43 Age of democracy in years (Polity) 17 Type of democracy Electoral system Party system Parliamentary Mixed:
Economics 270c. Development Economics. Lecture 6 February 20, 2007
 Economics 270c Development Economics Lecture 6 February 20, 2007 Lecture 1: Global patterns of economic growth and development (1/16) The political economy of development Lecture 2: Inequality and growth
A Tale of Two Villages
 Kinship Networks and Preference Formation in Rural India Center for the Advanced Study of India, University of Pennsylvania West Bengal Growth Workshop December 27, 2014 Motivation Questions and Goals
The Case of the Disappearing Bias: A 2014 Update to the Gerrymandering or Geography Debate
 The Case of the Disappearing Bias: A 2014 Update to the Gerrymandering or Geography Debate Nicholas Goedert Lafayette College goedertn@lafayette.edu May, 2015 ABSTRACT: This note observes that the pro-republican
British Election Leaflet Project - Data overview
 British Election Leaflet Project - Data overview Gathering data on electoral leaflets from a large number of constituencies would be prohibitively difficult at least, without major outside funding without
Corruption, Political Instability and Firm-Level Export Decisions. Kul Kapri 1 Rowan University. August 2018
 Corruption, Political Instability and Firm-Level Export Decisions Kul Kapri 1 Rowan University August 2018 Abstract In this paper I use South Asian firm-level data to examine whether the impact of corruption
ANNUAL SURVEY REPORT: AZERBAIJAN
 ANNUAL SURVEY REPORT: AZERBAIJAN 2 nd Wave (Spring 2017) OPEN Neighbourhood Communicating for a stronger partnership: connecting with citizens across the Eastern Neighbourhood June 2017 TABLE OF CONTENTS
The Political Economy of Gram Panchayats in South India: Results and Policy Conclusions From a Research Project
 India The Political Economy of Gram Panchayats in South India: Results and Policy Conclusions From a Research Project April 10, 2006 Agricultural & Rural Development Unit South Asia Region The World Bank
Working Paper. Why So Few Women in Poli/cs? Evidence from India. Mudit Kapoor Shamika Ravi. July 2014
 Working Paper Why So Few Women in Poli/cs? Evidence from India Mudit Kapoor Shamika Ravi July 2014 Brookings Ins8tu8on India Center, 2014 Why So Few Women in Politics? Evidence from India Mudit Kapoor
Income Distributions and the Relative Representation of Rich and Poor Citizens
 Income Distributions and the Relative Representation of Rich and Poor Citizens Eric Guntermann Mikael Persson University of Gothenburg April 1, 2017 Abstract In this paper, we consider the impact of the
The Cook Political Report / LSU Manship School Midterm Election Poll
 The Cook Political Report / LSU Manship School Midterm Election Poll The Cook Political Report-LSU Manship School poll, a national survey with an oversample of voters in the most competitive U.S. House
Partisan Advantage and Competitiveness in Illinois Redistricting
 Partisan Advantage and Competitiveness in Illinois Redistricting An Updated and Expanded Look By: Cynthia Canary & Kent Redfield June 2015 Using data from the 2014 legislative elections and digging deeper
Political Selection and the Quality of Government: Evidence from South India
 Political Selection and the Quality of Government: Evidence from South India Timothy Besley (LSE) Rohini Pande (Yale) and Vijayendra Rao (World Bank) Abstract This paper uses household data from India
How To. Conduct a Gram Sabha. December 2016
 How To December 2016 Conduct a Gram Sabha Gram Sabha (GS) or Village Assembly is the examples of democracy at its best as it was envisioned by our freedom fighters. It has been put in place to ensure that
Are Caste Categories Misleading? The Relationship Between Gender and Jati in Three Indian States
 Are Caste Categories Misleading? The Relationship Between Gender and Jati in Three Indian States Shareen Joshi (Georgetown University) Nishtha Kochhar (Georgetown University) Vijayendra Rao (World Bank)
! # % & ( ) ) ) ) ) +,. / 0 1 # ) 2 3 % ( &4& 58 9 : ) & ;; &4& ;;8;
 ) ) ) ) +,. / 0 1 # ) 2 3 % ( &4& 58 9 : ) & ;; &4& ;;8;") ! # % & ( ) ) ) ) ) +,. / 0 # ) % ( && : ) & ;; && ;;; < The Changing Geography of Voting Conservative in Great Britain: is it all to do with Inequality? Journal: Manuscript ID Draft Manuscript Type: Commentary
! # % & ( ) ) ) ) ) +,. / 0 # ) % ( && : ) & ;; && ;;; < The Changing Geography of Voting Conservative in Great Britain: is it all to do with Inequality? Journal: Manuscript ID Draft Manuscript Type: Commentary
14.11: Experiments in Political Science
 14.11: Experiments in Political Science Prof. Esther Duflo May 9, 2006 Voting is a paradoxical behavior: the chance of being the pivotal voter in an election is close to zero, and yet people do vote...
Characteristics of the Ethnographic Sample of First- and Second-Generation Latin American Immigrants in the New York to Philadelphia Urban Corridor
 Table 2.1 Characteristics of the Ethnographic Sample of First- and Second-Generation Latin American Immigrants in the New York to Philadelphia Urban Corridor Characteristic Females Males Total Region of
LABOUR-MARKET INTEGRATION OF IMMIGRANTS IN OECD-COUNTRIES: WHAT EXPLANATIONS FIT THE DATA?
 LABOUR-MARKET INTEGRATION OF IMMIGRANTS IN OECD-COUNTRIES: WHAT EXPLANATIONS FIT THE DATA? By Andreas Bergh (PhD) Associate Professor in Economics at Lund University and the Research Institute of Industrial
NBER WORKING PAPER SERIES THE REDISTRIBUTIVE EFFECTS OF POLITICAL RESERVATION FOR MINORITIES: EVIDENCE FROM INDIA. Aimee Chin Nishith Prakash
 NBER WORKING PAPER SERIES THE REDISTRIBUTIVE EFFECTS OF POLITICAL RESERVATION FOR MINORITIES: EVIDENCE FROM INDIA Aimee Chin Nishith Prakash Working Paper 16509 http://www.nber.org/papers/w16509 NATIONAL
Corruption and business procedures: an empirical investigation
 Corruption and business procedures: an empirical investigation S. Roy*, Department of Economics, High Point University, High Point, NC - 27262, USA. Email: sroy@highpoint.edu Abstract We implement OLS,
This note analyzes various issues related to women workers in Malaysia s formal private
 Enterprise Surveys Enterprise Note Series Gender Women Workers in Malaysia s Private Sector World Bank Group Enterprise Note No. 35 17 Mohammad Amin and Amanda Zarka This note analyzes various issues related
Supplementary Materials A: Figures for All 7 Surveys Figure S1-A: Distribution of Predicted Probabilities of Voting in Primary Elections
 Supplementary Materials (Online), Supplementary Materials A: Figures for All 7 Surveys Figure S-A: Distribution of Predicted Probabilities of Voting in Primary Elections (continued on next page) UT Republican
Corrupt States: Reforming Indian Public Services in the Digital Age
 Corrupt States: Reforming Indian Public Services in the Digital Age Jennifer Bussell Lyndon B. Johnson School of Public Affairs University of Texas at Austin Delivering Public Services Public service provision
Does Participation Strengthen Civil Society?
 Chapter six Does Participation Strengthen Civil Society? Participatory development projects often include building social capital and hearing the voices of the poor as key objectives. This chapter reviews
Minnesota Public Radio News and Humphrey Institute Poll. Dayton Jumps to Double-Digit Lead Over Emmer
 Minnesota Public Radio News and Humphrey Institute Poll Dayton Jumps to Double-Digit Lead Over Emmer Report prepared by the Center for the Study of Politics and Governance Humphrey Institute of Public
Iowa Voting Series, Paper 4: An Examination of Iowa Turnout Statistics Since 2000 by Party and Age Group
 Department of Political Science Publications 3-1-2014 Iowa Voting Series, Paper 4: An Examination of Iowa Turnout Statistics Since 2000 by Party and Age Group Timothy M. Hagle University of Iowa 2014 Timothy
UC Berkeley IGS Poll. Title. Permalink. Author. Publication Date
 UC Berkeley IGS Poll Title Release #2018-10: Poll of voters in eight of the state s GOP-held congressional districts shows Democratic candidates lead in two, hold a small advantage in two others, and in
MIGRATION AND URBAN POVERTY IN INDIA
 1 Working Paper 414 MIGRATION AND URBAN POVERTY IN INDIA SOME PRELIMINARY OBSERVATIONS William Joe Priyajit Samaiyar U. S. Mishra September 2009 2 Working Papers can be downloaded from the Centre s website
Can Elected Minority Representatives Affect Health Worker Visits? Evidence from India. Elizabeth Kaletski University of Connecticut
 Can Elected Minority Representatives Affect Health Worker Visits? Evidence from India Elizabeth Kaletski University of Connecticut Nishith Prakash University of Connecticut Working Paper 2014-19 August
Can information that raises voter expectations improve accountability?
 Can information that raises voter expectations improve accountability? A field experiment in Mali Jessica Gottlieb Stanford University, Political Science May 8, 2012 Overview Motivation: Preliminary studies
ANNUAL SURVEY REPORT: BELARUS
 ANNUAL SURVEY REPORT: BELARUS 2 nd Wave (Spring 2017) OPEN Neighbourhood Communicating for a stronger partnership: connecting with citizens across the Eastern Neighbourhood June 2017 1/44 TABLE OF CONTENTS
IS THE MEASURED BLACK-WHITE WAGE GAP AMONG WOMEN TOO SMALL? Derek Neal University of Wisconsin Presented Nov 6, 2000 PRELIMINARY
 IS THE MEASURED BLACK-WHITE WAGE GAP AMONG WOMEN TOO SMALL? Derek Neal University of Wisconsin Presented Nov 6, 2000 PRELIMINARY Over twenty years ago, Butler and Heckman (1977) raised the possibility
The Role of Migration and Income Diversification in Protecting Households from Food Insecurity in Southwest Ethiopia
 The Role of Migration and Income Diversification in Protecting Households from Food Insecurity in Southwest Ethiopia David P. Lindstrom Population Studies and Training Center, Brown University Craig Hadley
Democratization and the Distribution of Local Public Goods. in a Poor Rural Economy. August Andrew D. Foster Brown University
 Democratization and the Distribution of Local Public Goods in a Poor Rural Economy August 2004 Andrew D. Foster Brown University Mark R. Rosenzweig Harvard University August 2004 The research for this
EUROBAROMETER 71 PUBLIC OPINION IN THE EUROPEAN UNION SPRING
 Standard Eurobarometer European Commission EUROBAROMETER 71 PUBLIC OPINION IN THE EUROPEAN UNION SPRING 2009 Standard Eurobarometer 71 / SPRING 2009 TNS Opinion & Social Standard Eurobarometer NATIONAL
The California Primary and Redistricting
 The California Primary and Redistricting This study analyzes what is the important impact of changes in the primary voting rules after a Congressional and Legislative Redistricting. Under a citizen s committee,
Remittances and the Brain Drain: Evidence from Microdata for Sub-Saharan Africa
 Remittances and the Brain Drain: Evidence from Microdata for Sub-Saharan Africa Julia Bredtmann 1, Fernanda Martinez Flores 1,2, and Sebastian Otten 1,2,3 1 RWI, Rheinisch-Westfälisches Institut für Wirtschaftsforschung
Supporting Information for Do Perceptions of Ballot Secrecy Influence Turnout? Results from a Field Experiment
 Supporting Information for Do Perceptions of Ballot Secrecy Influence Turnout? Results from a Field Experiment Alan S. Gerber Yale University Professor Department of Political Science Institution for Social
On the Causes and Consequences of Ballot Order Effects
 Polit Behav (2013) 35:175 197 DOI 10.1007/s11109-011-9189-2 ORIGINAL PAPER On the Causes and Consequences of Ballot Order Effects Marc Meredith Yuval Salant Published online: 6 January 2012 Ó Springer
FINAL REPORT. Public Opinion Survey at the 39th General Election. Elections Canada. Prepared for: May MacLaren Street Ottawa, ON K2P 0M6
 FINAL REPORT Public Opinion Survey at the 39th General Election Prepared for: Elections Canada May 2006 336 MacLaren Street Ottawa, ON K2P 0M6 TABLE OF CONTENTS List of Exhibits Introduction...1 Executive
Political Selection and Bureaucratic Productivity
 Political Selection and Bureaucratic Productivity James Habyarimana 1 Stuti Khemani 2 Thiago Scot 3 June 25, 2018 1 Georgetown 2 World Bank 3 UC Berkeley 1 Motivation: understanding local state capacity
Levels and Dynamics of Inequality in India: Filling in the blanks
 Levels and Dynamics of Inequality in India: Filling in the blanks Peter Lanjouw (Vrije University Amsterdam) Summary of Findings from the India Component of the UNU-WIDER Inequality in the Giants Project
What Role do Political Factors Play in the Allocation of Public Resources to Communities Within Districts? Leah Horowitz and Nethra Palaniswamy
 International Food Policy Research Institute (IFPRI) - Ghana Strategy Support Program (GSSP) Workshop on Agricultural Services, Decentralization, and Local Governance, June 3, 2010, Accra Paper Summary
The Determinants of Low-Intensity Intergroup Violence: The Case of Northern Ireland. Online Appendix
 The Determinants of Low-Intensity Intergroup Violence: The Case of Northern Ireland Online Appendix Laia Balcells (Duke University), Lesley-Ann Daniels (Institut Barcelona d Estudis Internacionals & Universitat
INDIAN SCHOOL MUSCAT SENIOR SECTION DEPARTMENT OF SOCIAL SCIENCE CLASS: IX: DEMOCRATIC POLITICS CHAPTER: 4- ELECTORAL POLITICS WORKSHEET - 11
 INDIAN SCHOOL MUSCAT SENI SECTION DEPARTMENT OF SOCIAL SCIENCE CLASS: IX: DEMOCRATIC POLITICS CHAPTER: 4- ELECTAL POLITICS WKSHEET - SUMMARY: The most common form of democracy in our times is for the people
Preliminary Effects of Oversampling on the National Crime Victimization Survey
 Preliminary Effects of Oversampling on the National Crime Victimization Survey Katrina Washington, Barbara Blass and Karen King U.S. Census Bureau, Washington D.C. 20233 Note: This report is released to
The Rights of the Child. Analytical report
 Flash Eurobarometer 273 The Gallup Organisation Analytical Report Flash EB N o 251 Public attitudes and perceptions in the euro area Flash Eurobarometer European Commission The Rights of the Child Analytical
Politics as Usual? Local Democracy and Public Resource Allocation in South India
 Politics as Usual? Local Democracy and Public Resource Allocation in South India Timothy Besley LSE and CIFAR Rohini Pande Harvard University Revised September 2007 Vijayendra Rao World Bank Abstract This
Online Appendix: Robustness Tests and Migration. Means
 VOL. VOL NO. ISSUE EMPLOYMENT, WAGES AND VOTER TURNOUT Online Appendix: Robustness Tests and Migration Means Online Appendix Table 1 presents the summary statistics of turnout for the five types of elections