Working Paper. Why So Few Women in Poli/cs? Evidence from India. Mudit Kapoor Shamika Ravi. July 2014
|
|
|
- Emil Lester
- 6 years ago
- Views:
Transcription
1 Working Paper Why So Few Women in Poli/cs? Evidence from India Mudit Kapoor Shamika Ravi July 2014 Brookings Ins8tu8on India Center, 2014
2 Why So Few Women in Politics? Evidence from India Mudit Kapoor and Shamika Ravi July 7, 2014 Abstract In this paper we analyze women as political candidates in Indian democracy. Using 50 years of assembly elections data at the constituency level from the Indian states, we show that women are more likely to contest elections in those constituencies where gender ratio of the electors is less in favor of women. For example, women are more likely to contest elections in backward states like Bihar and Uttar Pradesh where the gender ratio of electors is in favor of men than in socially developed states like Kerala where the gender ratio of electors is more in favor of women. We present a citizens candidates model of representative democracy and show that our empirical results are consistent with the theoretical predictions of this model. Our results challenge existing policy of random reservation of seats for women. JEL Classication: P16, J10, J11 Keywords: gender, median voter, political economy mudit_kapoor@isb.edu shamika_ravi@isb.edu 1
3 Introduction The International Political Science Association reports that women representatives account for 20.3 percent of all parliamentarians in the world, as of January 2013 (gure 1). This highlights the severity of worldwide unrepresentation of women in political positions. According to Norris and Inglehart (2000), the gap between men and women has narrowed least in political representation when compared to education, legal rights and economic opportunities. However, despite the magnitude of this problem, there is little understanding regarding factors that might be causing this. Why are there so few female representatives in political positions, relative to their share in the population and electoral rolls? In this paper, we present an answer to this fundamental question. We use a simple citizen candidate model of representative democracy to show women's decision to contest elections. We test the predictions of the model using data from assembly elections in India, over 50 years. We show that women are signicantly more likely to contest elections in those constituencies where gender ratio of the electors is less in favor of women. For example, women are more likely to contest elections in backward states like Bihar and Uttar Pradesh where the gender ratio of electors is in favor of men than in socially developed states like Kerala where the gender ratio of electors is more in favor of women. The results also reveal that though more women contest in contituencies with unfavourable gender ratios, they are less likely to win in these contituencies. In the light of our ndings, we would argue that blanket quotas for women might not be the best policy prescription to enhance political participation by women. Over the last 20 years, 17 countries have legislated reservations in seats for women candidates and 44 countries have legislated quotas for women in political parties candidate lists (see gures 2 and 3). There is growing evidence in the literature to show that reservation policies have improved women's representation (Jones, 1998 and Norris, 2001). There is also evidence to show that women's reservation has an impact on policy decisions. While Chattopadhyay and Duo (2004) exploit a randomized controlled setting in India to show that reservation of village council seats for women aects the type of public goods provided, Besley and Case (2000) control for state and year xed eects and show that compensation for workers and child support policies are more likely to be introduced in places where there are more women in parliament. Dollar Fisman and Gatti (2001) do a cross sectional comparison and nd a negative correlation between representation of women in parliament and corruption. However, despite growing evidence of causal eect of women's representation on policy decisions, we have little understanding of why so few women participate in active politics as representatives. The rationale for reservation in favor of women is that women have higher costs of running for oce than men. As a result, several countries have legislated randomly reserved seats for women. In India, one third of village council positions have been randomly reserved for women. Our results challenge such reservation policy, and instead, suggest that if the objective of reservation is to 2
4 promote and safeguard the interests women, then it should be aimed towards those constituencies where women are electorally a minority. Our results reveal that women are more likley to contest elections in places where the gender ratios of the electorate is stacked aginst them. For reservation policies to have a bite and aect the political representation of women, they must be implemented in contituencies where women are electoral minorities. Reservations should be for those contituencies which have unfavourable sex ratio of electorates because, though signicantly more women candidates contest elections, yet the probability of winning is signicantly lower in these places than elsewhere. The rest of the paper is structured as follows: section 2 has the simple citizen candidate model of Chattopadhyay and Duo (2004) which is build on the framework of Osborne and Slivinski (1996) and Besley and Coate (1997). Section 3 describes the empirical strategy. Section 4 has the details of the Election Commission of India data that we use for the analysis. Section 5 has the results and section 6 concludes. Theory For our empirical analysis we use the theoretical model developed by Chattopadhyay and Duo (2004) (henceforth referred to as CD). Their model builds on the framework developed in Osborne and Slivinski (1996) and Besley and Coate (1997) where the political candidates are citizen candidates. The political process is modeled as a three stage game. In stage one each citizen decides whether or not to become a political candidate. In the second stage, the citizens vote for the political candidates and in the third and nal stage, the candidates with the maximum number of votes chooses the policy. This structure implies that the candidate who wins will implement their preferred policies and cannot credibly commit to do otherwise. While voting, citizens take this into account and vote for the candidates on the basis of their policy preferences and abilities. Citizens then decide whether or not to run for oce depending on who else will enter the electoral race. The candidates, therefore, face a trade o between the probability of winning the election and the xed cost of contesting the election. The model developed by CD has two distinguishing features. Firstly, the cost of contesting an election is higher for a women than for men. Secondly, the the nal policy outcome that is implemented by the winning candidate is the mixture of a preferred policy and a policy option preferred by a local elite (which is dierent from what the winning candidate would prefer). This could either reect the capture of decentralized government by local elite (Bardhan and Mookherjee, 2000; Besley and Coate, 2001) or that the elected representative is under the control of the elected state government and assembly. This framework developed by CD captures to a very large extent the reality of the electoral process in India. Every citizen is eligible to vote and to contest election by standing as a political candidate. The political candidate who garners the maximum number of 3
5 votes wins the election and is in a position to implement policies, but is also subjected to control by elected state government and assembly. The key features of the CD model are as follows. The citizens of a constituency will implement a policy which is chosen in the interval between [0, 1]. Each citizen has a preferred policy option, ω i, and women and men have dierent policy preferences. This aspect of the model is reected in their detailed empirical work. More specically, it is assumed that women's preferences are distributed over [0, W ] and the men's preference is distributed over the interval [M, 1]. The cost of contesting the election for the women is δ w, and the cost of contesting the election for the men is δ m, where δ w > δ m. The utility to citizen i with a preferred policy option ω i, if the outcome x j is implemented is x j ω i if citizen i is not a candidate, and x j ω i δ i if citizen i is a candidate. The policy which is implemented by the winning candidate x j = αω j + (1 α)µ, where µ is the policy option preferred by the local elite, and α is the weight given to the candidate's own preference. This implies that if no one runs for the election then citizen i s utility is given by µ ω i. Its also assumed in the model µ > m, where m is the preference of the median voter. Citizens are fully aware of the lobbying process and take it into account for the voting decision. In this paper, we will focus exclusively on the decision of female candidates to contest elections. Moreover, we will only analyze circumstances in which the woman candidate faces an opposition, if she chooses to contest elections. The reason for limiting our analysis to this scenario is because in our data on elections at the constituency level, we have not come across a single constituency where a women ran an election unopposed. Besley and Coate (1997) have shown that if two candidates contest an election then each one of them should have an equal chance of winning, therefore, the policy outcome they would implement needs to be symmetrical around the median voter preference. In the CD framework this implies that a women who is the furthest away from the median voter has the policy preference 0 and would implement policy outcome (1 α)µ if she is elected. For another candidate to contest election against such a candidate implies that she would have to implement a policy outcome 2m (1 α)µ, which is symmetric around the median voter, to have an equal probability of winning. This implies that for the women with preference 0 (who is furthest from the median voter) to contest election, it must be the case that she gets a higher utility from contesting the election than accepting the policy implemented by the opposing candidate. More specically, this implies that Expected utility from contesting = 1 2 ( (1 α)µ ) ( 2m (1 α)µ ) δ w Utility from not contesting = 2m (1 α)µ. 4
6 Hence, she will contest if and only if 1 2 ( (1 α)µ ) ( 2m (1 α)µ ) δ w > 2m (1 α)µ, or m (1 α)µ > δ w. This implies that if the cost of contesting an election for a women candidate with an extreme policy preference 0 relative to the median voter preference is high, such that she will not contest the election, then no other women would contest the election. In other words if δ w > m (1 α)µ, (1) then there is no equilibrium where a women will contest the election. Equation 1 captures the key factors that inuence the women's decision to contest elections. In addition to the cost of contesting the election it depends on the median voter preference m, the lobbying eort of the political elite (1 α), and the policy option preferred by the local elite µ. In particular the key implications of the model are (i) if the median voter preference is more in favor of the women then it is less likely that women will contest elections, cetris paribus. For example, consider two constituencies (say A and B) which are identical in all respects except that the median voter preference in A is more in favor of the women than in B, in other words m A < m B, then for given values of δ w, (1 α) and µ it is possible that m B (1 α)µ > δ w > m A (1 α)µ. This implies that in constituency B, women will contest the election while in constituency A she will not contest the election. This forms the fundamental basis of our empirical work. (ii) For a given cost of contesting election for women and the median voter preferences, the higher the lobbying eort of the political elite (1 α), and/or the policy option preferred by the local elite µ, then its less likely for the women to contest the election. Empirical Strategy Equation 1 forms the basis of our empirical strategy. We study the eect of the median voter preference on the probability of a women contesting the election at the constituency level using the PROBIT estimation. Since we do not directly observe the median voter preference we use the gender ratio of electors at the constituency level as a proxy for the median voter preference. The gender ratio of the electors is the total number of female electors divided by the total number 5
7 of male electors. Higher gender ratio of electors implies a median voter preference more towards the women. We use state xed eects to control for other factors like the the lobbying eort of the political elite (1 α), and the policy option preferred by the local elite µ. We also allow the state xed xed eects to interact with time dummies to capture any time varying changes in the lobbying eort of the political elite and also their policy preference. In particular we run the following regression P r(y it = 1) = Φ(const + βgender ratio of electors it + state F E + time dummies t + state F E time dummies t + error it ), (2) where y it = 1 is equal to 1 if the women contest elections in constituency i in year t, and 0 otherwise. state F E is the state xed eects which captures state level factors such as the extent of discrimination towards the women, lobbying eorts and the capture by the political elite, time dummies t is a dummy which controls for time eects. Typically, assembly elections are held every ve years so there are two elections in a decade. Since we use the constituency level data from 1969 to 2012, we use a decade dummies which takes a value equal to 1 for the decade in which the election was held and 0 otherwise. We use 1970 to 1979 as a decade for the 70s, similarly from 1980 to 1989 is the decade for the 80s, 1990 to 1999 is the decade for the 90s, 2000 to 2009 is the decade for the 2000s and 2010 to 2012 is the decade of the 2010s. For example, consider the elections held in constituency i in 1972 then time dummies t would be time dummies 1970, which is equal to 1 and 0 for all other decades. Similarly if the election was held in 1982 then time dummies t would be timedummies 1980 which is equal to 1 while all other time dummies are 0. We also use an interaction term state F E time dummies t, which captures all the time varying state level factors that could vary over time. For example, this could capture time varying changes in attitudes towards women, or the changes in the lobbying eorts of the political elite or the capture by the political elite. Data The data that we use for our analysis is from the Election Commission of India (ECI). The ECI was vested by the constitution of India to oversee, direct and control the entire process of the conduct of free and fair elections to the Parliament and the Legislative Assemblies of states and union terretories. The ECI collects and documents election data for each and every parliamentary and the state assembly constituency. For each constituency it reports data on the total number of electors and voters which are segregated by gender, the name and gender of each candidate contesting the election, party aliation of each contestant and if the candidate is not aliated to any party then the candidate is categorized as an independent, and the total number votes secured 6
8 by each candidate in the election. This data is available for every general election held in the parliamentary and the state assembly constituency from 1951 till For our analysis we use data at the constituency level for the state assembly elections held for 16 large states from 1962 till These 16 large states represent more than 93 percent of the total electors in India. Next we describe the construction of the variables of interest using the data at the constituency level. sex ratio of voters st = sex ratio of electors st = ( Ns ( Ns i=1 female voters it Ns i=1 male voters it i=1 female electors it Ns i=1 male electors it ) ) 1000, (3) 1000, (4) where s is the state, t is the year in which the election is held for the state assembly, i is the assembly constituency in state s, and N s is the total number of assembly constituencies in state s. We describe the trends in sex ratio of electors and voters in our data from 1970s through 2010s. In Table 1a, we show the number of female electors per 1000 male electors over time. As would be expected, there are no statistically signicant changes in electorate sex raio over time. However, when we study each state separately, we note that Haryana, Madhya Pradesh, Rajasthan and Uttar Pradesh have witnessed worsening sex ratio of electorates since The sex ratio of electorate reects the general sex ratio in the population and these are the traditionally backward states in India. Insert T ables 1a Table 1b shows the sex ratio of India voters over time. It has the number of female voters per 1000 male voters in the big states, over time. We discover a signicant and persistent reduction in gender inequality when we analyze voter turnout in all state elections in India, over past 50 years. We study this trend and its implications in Kapoor and Ravi (2013). In order to understand whether this positive development has an impact on election outcomes, we study the Bihar state re-elections of 2005, which were held within a short span. Our results strongly suggest that an increase in the female voters turnout negatively eected the probability of re-election for a political party in a given constituency. And in contrast, the results also show that male voters increased the probability of re-election of political parties, in a given constituency. The two results together show that men and women voted dierently. While women voted for change, the men voted for status quo. These results highlight the signicant role of rising women voters in modern representative democracy. 7
9 Insert T ables 1b Next, we show the data of the size of constituencies measured in number of electors and voters, over time. Table 2a and 2b show the trend in number of total electors and total voters per constituency in a state. As expected, the size of constituencies have increased signicantly over time reecting the increase in population in India over last 50 years. Insert T ables 2a and 2b Table 3, we have the average number of constituencies per state, over time. There have been some changes in the number of assembly constituencies in each state, over time, largely due to formation of newer states. Table 4a and 4b reveal the staggering dierence in the average number of female and male candidates per election per constituency for every decade. While the average number of female candidates per constituency per election has been going up over time, the dierence across states is persistent. Backward states like Bihar and UP have more than twice the number of female candidates per constituency compared to developed states like Kerala and Tamil Nadu. These dierences across states have remained persistent over last 50 years. Insert T ables 4a and 4b Results Following the empirical specication outlined in section 3, our main results are presented in Table 5, columns 1 to 4. This is a PROBIT analysis which explains the probability of female candidates contesting an assembly election in India. The unit of observation is a constituency in all state assembly elections, over 5 decades. The dependent variable takes value 1 if the constituency has at least one female contestant in the election and 0 otherwise. We start with a very simple specication where (column 1) we only use the gender ratio of electors at the constituency level as an explanatory variable. Consistent with theory, we nd that higher the gender ratio of the electors (that is, median voter preference is in favor of the women) then it is less likely that a woman candidate will contest the election. The coecient is negative and highly signicant at the conventional levels of signicance at 1% level. Insert T able 5 In column 2, we introduce the state xed eects. Our results do not change - we nd that with 8
10 higher gender ratio of electors, it is less likely that a woman candidate will contest the election in that constituency. Our ndings are not aected when we introduce time dummies with and without the interaction eect. The results without the interaction term are presented in column 3 and with the interaction term are in column 4. The coecients remain economically and statitically signicant. It is important to note that changes in opportunity cost of contesting an election for women, as measured by female wages and labor force participation are controlled through the interaction of state and time dummies. These do not change our basic nding in any way. Next, we run an OLS regression to study the determinants of actual number of female candidates who contest an election. The results are reported in Table 6. The dependent variable is logarithm of number of female candidates per constituency. There are several constituencies across various elections where no women candidates contested. To take care of this, we transform the dependent variable appropriately. We follow the same specications as outlined in our empirical strategy and as used in the previous PROBIT analysis. In column 1, we only use the gender ratio of electors at the constituency level as an explanatory variable. Once again, consistent with theory, we nd that higher the gender ratio of the electors (that is, median voter preference is in favor of the women) then it is less likely that a woman candidate will contest the election. The coecient is negative and highly signicant at the conventional levels of signicance at 1% level. Insert T able 6 As before, in column 2, we introduce the state xed eects which not change our results. We nd that with higher gender ratio of electors, it is less likely that a woman candidate will contest the election in that constituency. Our ndings are not aected when we introduce time dummies with and without the interaction eect. The results without the interaction term are presented in column 3 and with the interaction term are in column 4. The coecients remain economically and statistically signicant. Finally, we study the probability of winning an election for a female candidate. Table 7 reports the results of the PROBIT analysis where the dependent variable takes value 1 when a female candidate is declared winner in a constituency for an assembly election, and 0 otherwise. This analysis is conditional on women candidates contesting from a particular constituency. That is why the number of observations are fewer because there are several constituencies in dierent elections where no female candidates contested. Insert T able 7 The results reveal a striking nding. Women are signicantly less likely to win elections from constituencies where the sex ratio of electors are unfavorable. That is, when there are fewer female 9
11 electors compared to male electors, women candidates are less likely to win. Together with the previous results, this implies that though more female candidates contest elections from backward constituencies, fewer are likely to actually win and politically represent women electors. Conclusion The gender gap between men and women in political representation is signicant and persistent over time. This is particularly puzzling given that the gender gap has been narrowing in other areas such as education, labor force participation and legal rights. In this paper, we address this problem and provide an explanation. Use a simple citizen candidate model of representative democracy to show women's decision to contest elections. We test the predictions of the model using data from assembly elections in India, over 50 years. We show that women are signicantly more likely to contest elections in those constituencies where gender ratio of the electors is less in favor of women. For example, women are more likely to contest elections in backward states like Bihar and Uttar Pradesh where the gender ratio of electors is in favor of men than in socially developed states like Kerala where the gender ratio of electors is more in favor of women. The results also reveal that though more women contest in contituencies with unfavourable gender ratios, they are less likely to win in these contituencies. In the light of our ndings, we would argue that blanket quotas or random quotas for women might not be the best policy prescription to enhance political participation by women. Our results challenge such reservation policy, and instead, suggest that if the objective of reservation is to promote and safeguard the interests women, then it should be aimed towards those constituencies where women are electorally a minority. References [1] Bardhan and Mookherjee Capture and Governance at Local and National levels. American Economic Review. [2] Besley and Case Unnatural Experiment? Estimating the Incidence of Endogenous Policies. Economic Journal. [3] Besley and Coate An Economic Model of Represntative Democracy. Quaterly Journal of Economics. [4] Chattopadhyay, Raghabendra, and Esther Duo Women as Policy Makers: Evidence from a Randomized Policy Experiment in India. Econometrica. 72 (5):
12 [5] Dollar, Fisman and Gatti Are Women Really the Fairer Sex? Corruption and Women in Government. Journal of Economic Behavior and Organization. [6] Downs An Economic Theory of Democracy. New York. Harper Collins. [7] Jones Gender Quotas, Electoral Laws, and the Election of Women: Lessons from the Argentine Provinces. Comparative Political Studies [8] Mudit Kapoor and Shamika Ravi Women Voters in Indian Democracy: A Silent Revolution. Working Paper. [9] Norris Breaking teh Barriers: positive Discrimination Policies for Women. [10] Norris and Inglehart Cultural Barriers to Womens Leadership: A Worldwide Comparison. IPSA 2000 paper [11] Osborne and Slivinski A Model of Political Comnpetition with Citizen Candidates. Quaterly Journal of Economics. 11
13 Figure 1: Percentage of female representatives in parliaments across the world Lower House 5 Upper House Note: data source is the Quota Project, International IDEA, Stockholm University and Inter Parliamentary Union Figure 2: Legislated quota (percentage) for women candidates in a political party Note: data source is the Quota Project, International IDEA, Stockholm University and Inter Parliamentary Union
14 Figure 3: Percentage seats reserved for women candidates in parliament Note: data source is the Quota Project, International IDEA, Stockholm University and Inter Parliamentary Union
15 Table1a: Number of female electors per 1000 male electors Andhra Pradesh Assam Bihar Gujarat Haryana Himachal Pradesh Karnataka Kerala Madhya Pradesh Maharashtra Orissa Punjab Rajasthan Tamil Nadu Uttar Pradesh West Bengal Table 1b: Number of female voters per 1000 male voters Andhra Pradesh Assam Bihar Gujarat Haryana Himachal Pradesh Karnataka Kerala Madhya Pradesh Maharashtra Orissa Punjab Rajasthan Tamil Nadu Uttar Pradesh West Bengal
16 Table2a: Average size of constituency in number of electors Andhra Pradesh Assam Bihar Gujarat Haryana Himachal Pradesh Karnataka Kerala Madhya Pradesh Maharashtra Orissa Punjab Rajasthan Tamil Nadu Uttar Pradesh West Bengal Table 2b: Average size of constituency in number of voters Andhra Pradesh Assam Bihar Gujarat Haryana Himachal Pradesh Karnataka Kerala Madhya Pradesh Maharashtra Orissa Punjab Rajasthan Tamil Nadu Uttar Pradesh West Bengal
17 Table 3: Average number of constituencies Andhra Pradesh Assam Bihar Gujarat Haryana Himachal Pradesh Karnataka Kerala Madhya Pradesh Maharashtra Orissa Punjab Rajasthan Tamil Nadu Uttar Pradesh West Bengal
18 Table 4: Number of candidates per election Female candidate Male Candidate Female candidate Male Candidate Female candidate Male Candidate Female candidate Male Candidate Female candidate Male Candidate Andhra Pradesh Female candidate Assam Bihar Gujarat Haryana Himachal Pradesh Karnataka Kerala Madhya Pradesh Male Candidate Maharashtra Orissa Punjab Rajasthan Tamil Nadu Uttar Pradesh West Bengal
19 Table 5: Average female candidate per constituency States 1960s 1970s 1980s 1990s 2000s 2010s BIMARU Bihar Madhya Pradesh Rajasthan Uttar Pradesh Southern States Tamil Nadu Karnataka Kerala Andhra Pradesh Other Major states Punjab Maharashtra Gujarat West Bengal Orissa Haryana Himachal Pradesh Assam
20 Table 6: Ratio of female to male candidate Andhra Pradesh Assam Bihar Gujarat Haryana Himachal Pradesh Karnataka Kerala Madhya Pradesh Maharashtra Orissa Punjab Rajasthan Tamil Nadu Uttar Pradesh West Bengal
21 Table 7: Probability of Female Candidates Contesting an Election DEPENDANT VARIABLE Female Candidate dummy (1) (2) (3) (4) Gender ratio of electors 0.649*** 0.493*** 0.665*** 0.757*** [ 9.025] [ 5.241] [ 7.034] [ 7.659] Total Voters 0.000*** 0.000*** 0.000*** 0.000*** [38.572] [38.347] [6.752] [5.644] Time dummy 1970s 0.221*** [ 3.963] [ 0.265] Time dummy 1980s 0.244*** 0.583*** [4.488] [3.379] Time Dummy 1990s 0.648*** 1.264*** [11.449] [7.245] Time Dummy 2000s 0.835*** 1.358*** [14.130] [7.834] Time dummy 2010s 1.150*** 1.445*** [16.389] [10.285] Constant 0.811*** 0.753*** 0.718*** 0.944*** [ ] [ 6.556] [ 5.647] [ 5.121] State fixed effect No Yes Yes Yes State *time fixed effects No No No Yes Pseudo R Akaike's criterion Schwartz's criterion Observations 33,012 33,012 33,012 33,012 Note: dependent variable takes value 1 if the constituency has at least one female contestant in an election; 0 otherwise. Robust z statistics in brackets; *** p<0.01, ** p<0.05, * p<0.1
22 Table 8: Determinant of female candidate contesting an election DEPENDANT VARIABLE log (1+ number of female candidates per constituency) (1) (2) (3) (4) Gender ratio of electors 0.238*** 0.269*** 0.293*** 0.278*** [ 3.597] [ 3.155] [ 3.584] [ 3.405] Total Voters 0.000*** 0.000*** 0.000** 0.000** [10.178] [9.994] [2.229] [2.479] Time dummy 1970s 0.031* [ 1.851] [ 1.585] Time dummy 1980s 0.059*** 0.098*** [2.679] [6.737] Time Dummy 1990s 0.226*** 0.777*** [5.595] [40.136] Time Dummy 2000s 0.227*** 0.270*** [6.549] [11.298] Time dummy 2010s 0.323*** 0.281*** [3.777] [9.628] Constant State fixed effect No Yes Yes Yes State *time fixed effects No No No Yes Pseudo R Observations Note: OLS regression with number of female candidates per constituency as the dependent variable; Robust z statistics in brackets; *** p<0.01, ** p<0.05, * p<0.1
23 Table 9: Probability of winning an election for a female candidate DEPENDANT VARIABLE Female candidate winning conditional on contesting (1) (2) (3) (4) Gender ratio of electors 0.694*** 0.784*** 0.771*** 0.741*** [4.256] [3.834] [3.768] [3.531] Total Voters 0.000*** 0.000*** 0.000*** 0.000*** [ 8.394] [ 8.14] [ 4.986] [ 4.509] Time dummy 1970s [ 0.120] [ 1.240] Tme dummy 1980s [0.964] [ 0.153] Time Dummy 1990s 0.221* [ 1.676] [0.311] Time Dummy 2000s [0.007] [0.567] Time dummy 2010s [0.386] [ 0.155] Constant 1.157*** 1.222*** 1.178*** 1.170*** [ 7.103] [ 4.91] [ 4.219] [ 2.840] State fixed effect No Yes Yes Yes State *time fixed effects No No No Yes Pseudo R Akaike's criterion Schwartz's criterion Observations 8,990 8,990 8,990 8,990 Note: OLS Robust z statistics in brackets; *** p<0.01, ** p<0.05, * p<0.1

")
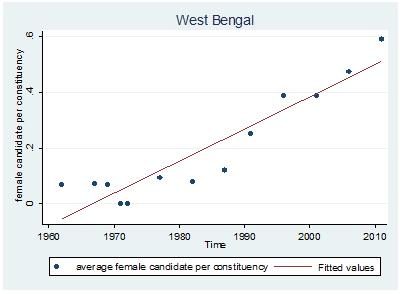
24 Figure 4 a) Number of female candidates per constituency: Backward (BiMaRU) states

25 Figure 4b) Number of female candidates per constituency: Southern States


26 Figure 4c) Number of female candidates per constituency Other large States
27
WomenasPolicyMakers:Evidencefroma Randomized Policy Experiment in India 1
 WomenasPolicyMakers:Evidencefroma Randomized Policy Experiment in India 1 by Raghabendra Chattopadhyay and Esther Duflo Abstract This paper uses political reservations for women in India to study the impact
Women as Policy Makers: Evidence from a Randomized Policy Experiment in India
 Women as Policy Makers: Evidence from a Randomized Policy Experiment in India Chattopadhayay and Duflo (Econometrica 2004) Presented by Nicolas Guida Johnson and Ngoc Nguyen Nov 8, 2018 Introduction Research
POLITICAL PARTICIPATION AND REPRESENTATION OF WOMEN IN STATE ASSEMBLIES
 POLITICAL PARTICIPATION AND REPRESENTATION OF WOMEN IN STATE ASSEMBLIES Manpreet Kaur Brar Research Scholar, Dept. of Political Science, Punjabi University, Patiala, India ABSTRACT Throughout the world,
Online appendix for Chapter 4 of Why Regional Parties
 Online appendix for Chapter 4 of Why Regional Parties Table of Contents The text reference column lists locations in Chapter 4 that refer to the online appendix. The description of content column explains
The Impact of NREGS on Urbanization in India
 The Impact of NREGS on Urbanization in India Shamika Ravi, Mudit Kapoor and Rahul Ahluwalia August 9, 2012 Abstract This paper tests the impact of the National Rural Employment Guarantee Scheme (NREGS)
Are Female Leaders Good for Education? Evidence from India.
 Are Female Leaders Good for Education? Evidence from India. Irma Clots-Figueras Department of Economics, London School of Economics JOB MARKET PAPER October 2005 Abstract This paper studies the impact
Does Political Reservation for Minorities Affect Child Labor? Evidence from India. Elizabeth Kaletski University of Connecticut
 Does Political Reservation for Minorities Affect Child Labor? Evidence from India Elizabeth Kaletski University of Connecticut Nishith Prakash University of Connecticut Working Paper 2014-12 May 2014 365
Prologue Djankov et al. (2002) Reinikka & Svensson (2004) Besley & Burgess (2002) Epilogue. Media and Policy. Dr. Kumar Aniket
 Reinikka & Svensson (2004) Besley & Burgess (2002) Epilogue. Media and Policy. Dr. Kumar Aniket") Media and Policy EC307 ECONOMIC DEVELOPMENT Dr. Kumar Aniket University of Cambridge & LSE Summer School Lecture 2 created on June 6, 2010 READINGS Tables and figures in this lecture are taken from: Djankov,
Media and Policy EC307 ECONOMIC DEVELOPMENT Dr. Kumar Aniket University of Cambridge & LSE Summer School Lecture 2 created on June 6, 2010 READINGS Tables and figures in this lecture are taken from: Djankov,
EXTRACT THE STATES REORGANISATION ACT, 1956 (ACT NO.37 OF 1956) PART III ZONES AND ZONAL COUNCILS
 PART III ZONES AND ZONAL COUNCILS") EXTRACT THE STATES REORGANISATION ACT, 1956 (ACT NO.37 OF 1956) PART III ZONES AND ZONAL COUNCILS Establishment of Zonal Councils. 15. As from the appointed day, there shall be a Zonal Council for each
EXTRACT THE STATES REORGANISATION ACT, 1956 (ACT NO.37 OF 1956) PART III ZONES AND ZONAL COUNCILS Establishment of Zonal Councils. 15. As from the appointed day, there shall be a Zonal Council for each
corruption since they might reect judicial eciency rather than corruption. Simply put,
 Appendix Robustness Check As discussed in the paper, many question the reliability of judicial records as a proxy for corruption since they might reect judicial eciency rather than corruption. Simply put,
Corrupt States: Reforming Indian Public Services in the Digital Age
 Corrupt States: Reforming Indian Public Services in the Digital Age Jennifer Bussell Lyndon B. Johnson School of Public Affairs University of Texas at Austin Delivering Public Services Public service provision
A Comparative Study of Human Development Index of Major Indian States
 Volume-6, Issue-2, March-April 2016 International Journal of Engineering and Management Research Page Number: 107-111 A Comparative Study of Human Development Index of Major Indian States Pooja Research
Who Put the BJP in Power?
 Decoding the Government s Mandate Center for the Advanced Study of India, University of Pennsylvania August 7, 2014 Orienting Questions Introduction Orienting Questions BJP s Overall Performance BJP won
Democracy in India: A Citizens' Perspective APPENDICES. Lokniti : Centre for the Study of Developing Societies (CSDS)
") Democracy in India: A Citizens' Perspective APPENDICES Appendix 1: The SDSA II (India component) covered states of India. All major states were included in the sample. The smaller states of North East
Democracy in India: A Citizens' Perspective APPENDICES Appendix 1: The SDSA II (India component) covered states of India. All major states were included in the sample. The smaller states of North East
INDIA ELECTORAL LAWS
 INDIA ELECTORAL LAWS The President and Vice-President The President of India Election of President Manner of election of President Term of office of President 52. The President of India.- There shall be
Women in National Parliaments: An Overview
 Journal of Politics & Governance, Vol. 6 No. 1, March 2017, Pp. 5-11 ISSN: 2278473X Women in National Parliaments: An Overview Sourabh Ghosh * Abstract Post the ratification of the Beijing Platform for
Policy for Regional Development. V. J. Ravishankar Indian Institute of Public Administration 7 th December, 2006
 Policy for Regional Development V. J. Ravishankar Indian Institute of Public Administration 7 th December, 2006 Why is regional equity an issue? Large regional disparities represent serious threats as
Women s Education and Women s Political Participation
 2014/ED/EFA/MRT/PI/23 Background paper prepared for the Education for All Global Monitoring Report 2013/4 Teaching and learning: Achieving quality for all Women s Education and Women s Political Participation
The Efficacy of Parochial Politics: Caste, Commitment, and Competence in Indian Local Governments
 The Efficacy of Parochial Politics: Caste, Commitment, and Competence in Indian Local Governments Kaivan Munshi Mark Rosenzweig May 2008 Abstract This paper proposes a novel explanation for the emergence
The turbulent rise of regional parties: A many-sided threat for Congress
 The turbulent rise of regional parties: A many-sided threat for Congress By: Sanjay Kumar Sanjay Kumar is a Fellow at Centre for the Study of Developing Societies (CSDS) Delhi REGIONAL PARTIES CHALLENGE
Ethnic Politics, Group Size, and the Under-Supply of Local Public Goods
 Ethnic Politics, Group Size, and the Under-Supply of Local Public Goods Kaivan Munshi Mark Rosenzweig May 2017 Abstract This paper examines the role of political incentives in determining the under-supply
The Redistributive Effects of Political Reservation for Minorities: Evidence from India
 The Redistributive Effects of Political Reservation for Minorities: Evidence from India Aimee Chin 1 and Nishith Prakash 2, 3 This Draft: February 2009 Abstract We examine the impact of political reservation
The Efficacy of Parochial Politics: Caste, Commitment, and Competence in Indian Local Governments
 The Efficacy of Parochial Politics: Caste, Commitment, and Competence in Indian Local Governments Kaivan Munshi Mark Rosenzweig April 2009 Abstract This paper explores the possibility that community involvement
BJP s Demographic Dividend in the 2014 General Elections: An Empirical Analysis ±
 BJP s Demographic Dividend in the 2014 General Elections: An Empirical Analysis ± Deepankar Basu and Kartik Misra! [Published in Economic and Political Weekly, Vol. 50, No. 3] 1. Introduction In the 2014
Perspective on Forced Migration in India: An Insight into Classed Vulnerability
 Perspective on in India: An Insight into Classed Vulnerability By Protap Mukherjee* and Lopamudra Ray Saraswati* *Ph.D. Scholars Population Studies Division Centre for the Study of Regional Development
NBER WORKING PAPER SERIES THE REDISTRIBUTIVE EFFECTS OF POLITICAL RESERVATION FOR MINORITIES: EVIDENCE FROM INDIA. Aimee Chin Nishith Prakash
 NBER WORKING PAPER SERIES THE REDISTRIBUTIVE EFFECTS OF POLITICAL RESERVATION FOR MINORITIES: EVIDENCE FROM INDIA Aimee Chin Nishith Prakash Working Paper 16509 http://www.nber.org/papers/w16509 NATIONAL
POLITICAL PARTICIPATION OF WOMEN IN INDIA: A CASE OF UTTAR PRADESH
 POLITICAL PARTICIPATION OF WOMEN IN INDIA: A CASE OF UTTAR PRADESH Dr.Chitwan Varma, Associate Professor Department of English Shri.J.N.P.G. College, Lucknow INTRODUCTION For democratic governments to
International Institute for Population Sciences, Mumbai (INDIA)
") Kunal Keshri (kunalkeshri.lrd@gmail.com) (Senior Research Fellow, e-mail:) Dr. R. B. Bhagat (Professor & Head, Dept. of Migration and Urban Studies) International Institute for Population Sciences, Mumbai
Kunal Keshri (kunalkeshri.lrd@gmail.com) (Senior Research Fellow, e-mail:) Dr. R. B. Bhagat (Professor & Head, Dept. of Migration and Urban Studies) International Institute for Population Sciences, Mumbai
Can Elected Minority Representatives Affect Health Worker Visits? Evidence from India. Elizabeth Kaletski University of Connecticut
 Can Elected Minority Representatives Affect Health Worker Visits? Evidence from India Elizabeth Kaletski University of Connecticut Nishith Prakash University of Connecticut Working Paper 2014-19 August
Political Selection and the Quality of Government: Evidence from South India
 Political Selection and the Quality of Government: Evidence from South India Timothy Besley (LSE) Rohini Pande (Yale) and Vijayendra Rao (World Bank) Abstract This paper uses household data from India
Short-term Migration, Rural Workfare Programs and Urban Labor Markets: Evidence from India
 Short-term Migration, Rural Workfare Programs and Urban Labor Markets: Evidence from India Clément Imbert and John Papp November 28, 2014 JOB MARKET PAPER Abstract We study the eect of a large rural public
Quality of Institutions : Does Intelligence Matter?
 Quality of Institutions : Does Intelligence Matter? Isaac Kalonda-Kanyama 1,2,3 and Oasis Kodila-Tedika 3 1 Department of Economics and Econometrics, University of Johannesburg, South Africa. 2 Department
Inequality in Housing and Basic Amenities in India
 MPRA Munich Personal RePEc Archive Inequality in Housing and Basic Amenities in India Rama Pal and Neil Aneja and Dhruv Nagpal Indian Institute of Technology Bobmay, Indian Institute of Technology Bobmay,
Election goals and income redistribution: Recent evidence from Albania
 European Economic Review 45 (2001) 405}423 Election goals and income redistribution: Recent evidence from Albania Anne Case* Department of Economics and the Woodrow Wilson School, Princeton University,
Calculating Economic Freedom
 2 Calculating Economic Freedom Laveesh Bhandari 1 Background As discussed in the previous chapter, the term economic freedom can have many connotations and depending upon which one is used the measurement
Short-term Migration Costs: Evidence from India
 Short-term Migration Costs: Evidence from India Clément Imbert and John Papp This version: April 2017. First version: January 2014. Abstract This paper provides new evidence on short-term (or seasonal)
NBER WORKING PAPER SERIES NETWORKS, COMMITMENT, AND COMPETENCE: CASTE IN INDIAN LOCAL POLITICS. Kaivan Munshi Mark Rosenzweig
 NBER WORKING PAPER SERIES NETWORKS, COMMITMENT, AND COMPETENCE: CASTE IN INDIAN LOCAL POLITICS Kaivan Munshi Mark Rosenzweig Working Paper 19197 http://www.nber.org/papers/w19197 NATIONAL BUREAU OF ECONOMIC
Politics as Usual? Local Democracy and Public Resource Allocation in South India
 Politics as Usual? Local Democracy and Public Resource Allocation in South India Timothy Besley LSE and CIFAR Rohini Pande Harvard University Revised September 2007 Vijayendra Rao World Bank Abstract This
NBER WORKING PAPER SERIES THE EFFICACY OF PAROCHIAL POLITICS: CASTE, COMMITMENT, AND COMPETENCE IN INDIAN LOCAL GOVERNMENTS
 NBER WORKING PAPER SERIES THE EFFICACY OF PAROCHIAL POLITICS: CASTE, COMMITMENT, AND COMPETENCE IN INDIAN LOCAL GOVERNMENTS Kaivan Munshi Mark Rosenzweig Working Paper 14335 http://www.nber.org/papers/w14335
On Adverse Sex Ratios in Some Indian States: A Note
 CENTRE FOR ECONOMIC REFORM AND TRANSFORMATION School of Management and Languages, Heriot-Watt University, Edinburgh, EH14 4AS Tel: 0131 451 4207 Fax: 0131 451 3498 email: ecocert@hw.ac.uk World-Wide Web:
Business Associations, Bureaucratic and Political Corruption: An Empirical Analysis of Lobby Group Membership. Eugene Kiselev.
 Business Associations, Bureaucratic and Political Corruption: An Empirical Analysis of Lobby Group Membership Eugene Kiselev Brandeis University International Business School October 2, 2012 Abstract This
The NCAER State Investment Potential Index N-SIPI 2016
 The NCAER State Investment Potential Index N-SIPI 2016 The NCAER Study Team 20 December, 2016 Structure of presentation 1. India: Socio-political & economic dynamics 2. Methodology 3. The Five Pillars
WomeninPolitics. EvidencefromtheIndianStates
 WomeninPolitics. EvidencefromtheIndianStates IrmaClots-Figueras Department of Economics, Universidad Carlos III de Madrid September 11, 2008 Abstract Thispaperusespaneldatafromthe16largerstatesinIndiaduringtheperiod1967-2000
Why Political Reservations?
 Why Political Reservations? Esther Duflo September 2004 Abstract Many countries are amending their political systems to set aside positions to groups, such as women and racial or religious minorities that
Online Appendix: Conceptualization and Measurement of Party System Nationalization in Multilevel Electoral Systems
 Online Appendix: Conceptualization and Measurement of Party System Nationalization in Multilevel Electoral Systems Schakel, Arjan H. and Swenden, Wilfried (2016) Rethinking Party System Nationalization
National Consumer Helpline
 National Consumer Helpline Centre for Consumer Studies, Indian Institute of Public Administration, Indraprastha Estate, Ring Road, New Delhi-110002 Summary Report December 2016 Project of Union Ministry
How Unequal Access to Public Goods Reinforces Horizontal Inequality in India ASLI DEMIRGUC-KUNT LEORA KLAPPER NEERAJ PRASAD
 How Unequal Access to Public Goods Reinforces Horizontal Inequality in India ASLI DEMIRGUC-KUNT LEORA KLAPPER NEERAJ PRASAD Summary I. Using National Sample Survey between 1993 and 2012, we find that inequality
Elections to Lok Sabha
 Elections to Lok Sabha A Statistical Analysis M Ramchandra Rao The statistical analysis of the 1962 elections to the Lok Sabha attempted here shows that though the Congress party has once again won a comfortable
Warwick Economics Research Paper Series Short-term Migration Rural Workfare Programs and Urban Labor Markets - Evidence from India
 Warwick Economics Research Paper Series Short-term Migration Rural Workfare Programs and Urban Labor Markets - Evidence from India Clément Papp March, 2016 Series Number: 1116 ISSN 2059-4283 (online) ISSN
MIGRATION AND URBAN POVERTY IN INDIA
 1 Working Paper 414 MIGRATION AND URBAN POVERTY IN INDIA SOME PRELIMINARY OBSERVATIONS William Joe Priyajit Samaiyar U. S. Mishra September 2009 2 Working Papers can be downloaded from the Centre s website
Political participation and Women Empowerment in India
 Political participation and Women Empowerment in India Dr Satyavrat Singh Rawat Associate Professor, Department of Economics NREC College Khurja Abstract Political participation is a mechanism which enables
Fragmentation and Decline in India s State Assemblies: A review
 Fragmentation and Decline in India s State Assemblies: A review 1967-2007 Francesca Refsum Jensenius and Pavithra Suryanarayan This is a pre-copyedited version of an article forthcoming in Asian Survey
University of Bristol - Explore Bristol Research. Peer reviewed version. Link to publication record in Explore Bristol Research PDF-document
 Nandy, S., & Daoud, A. (Accepted/In press). Political regimes, corruption, and absolute child poverty in India a multilevel statistical analysis. Paper presented at FISS Conference, Sigtuna, 2014, Sigtuna,
RECENT CHANGING PATTERNS OF MIGRATION AND SPATIAL PATTERNS OF URBANIZATION IN WEST BENGAL: A DEMOGRAPHIC ANALYSIS
 46 RECENT CHANGING PATTERNS OF MIGRATION AND SPATIAL PATTERNS OF URBANIZATION IN WEST BENGAL: A DEMOGRAPHIC ANALYSIS Raju Sarkar, Research Scholar Population Research Centre, Institute for Social and Economic
PARTY WISE SEATS WON AND VOTES POLLED (%),LOK SABHA 2009
,LOK SABHA 2009") PARTY WISE AND (%),LOK SABHA 2009 S. NO. PARTY NAME PARTY STATE NAME TOTAL ELECTORS 1 All India Anna Dravida Munnetra Kazhagam S Tamil Nadu 30390960 41620460 9 6953591 22.88 2 All India Forward Bloc S
PARTY WISE AND (%),LOK SABHA 2009 S. NO. PARTY NAME PARTY STATE NAME TOTAL ELECTORS 1 All India Anna Dravida Munnetra Kazhagam S Tamil Nadu 30390960 41620460 9 6953591 22.88 2 All India Forward Bloc S
Supplementary Materials for Strategic Abstention in Proportional Representation Systems (Evidence from Multiple Countries)
") Supplementary Materials for Strategic Abstention in Proportional Representation Systems (Evidence from Multiple Countries) Guillem Riambau July 15, 2018 1 1 Construction of variables and descriptive statistics.
Supplementary Materials for Strategic Abstention in Proportional Representation Systems (Evidence from Multiple Countries) Guillem Riambau July 15, 2018 1 1 Construction of variables and descriptive statistics.
Opinion Polls in the context of Indian Parliamentary Democracy
 Opinion Polls in the context of Indian Parliamentary Democracy Director Chennai Mathematical Institute rlk@cmi.ac.in Opinion Polls in the context of Indian Parliamentary Democracy - 1 Contents How can
Estimates of Workers Commuting from Rural to Urban and Urban to Rural India: A Note
 WP-2011-019 Estimates of Workers Commuting from Rural to Urban and Urban to Rural India: A Note S Chandrasekhar Indira Gandhi Institute of Development Research, Mumbai September 2011 http://www.igidr.ac.in/pdf/publication/wp-2011-019.pdf
Public Affairs Index (PAI)
") Public Affairs Index (PAI) A Closer look at Andhra Pradesh NOTE: All the data and rankings presented in PAI represent the united Andhra Pradesh (before the bifurcation) Contents of the Presentation About
Public Affairs Index (PAI) A Closer look at Andhra Pradesh NOTE: All the data and rankings presented in PAI represent the united Andhra Pradesh (before the bifurcation) Contents of the Presentation About
Female parliamentarians and economic growth: Evidence from a large panel
 Female parliamentarians and economic growth: Evidence from a large panel Dinuk Jayasuriya and Paul J. Burke Abstract This article investigates whether female political representation affects economic growth.
THE TAMIL NADU LEGISLATIVE COUNCIL BILL, 2010
 TO BE INTRODUCED IN THE RAJYA SABHA Bill No. XXX of 2010 THE TAMIL NADU LEGISLATIVE COUNCIL BILL, 2010 A 43 of 1950. 5 BILL to provide for the creation of Legislative Council for the State of Tamil Nadu
IMMIGRATION AND PEER EFFECTS: EVIDENCE FROM PRIMARY EDUCATION IN SPAIN
 IMMIGRATION AND PEER EFFECTS: EVIDENCE FROM PRIMARY EDUCATION IN SPAIN Florina Raluca Silaghi Master Thesis CEMFI No. 1103 June 2011 CEMFI Casado del Alisal 5; 28014 Madrid Tel. (34) 914 290 551. Fax (34)
Does trade openness affect manufacturing growth at the Indian state level?
 MPRA Munich Personal RePEc Archive Does trade openness affect manufacturing growth at the Indian state level? Sayantan Ghosh Dastidar and C Veeramani University of Dundee, UK, Indira Gandhi Institute of
Insolvency Professionals to act as Interim Resolution Professionals and Liquidators (Recommendation) (Second) Guidelines, 2018
 (Second) Guidelines, 2018") Insolvency Professionals to act as Interim Resolution Professionals and Liquidators (Recommendation) (Second) Guidelines, 2018 Provisions in the Insolvency and Bankruptcy Code, 2016 30 th November, 2018
Insolvency Professionals to act as Interim Resolution Professionals and Liquidators (Recommendation) (Second) Guidelines, 2018 Provisions in the Insolvency and Bankruptcy Code, 2016 30 th November, 2018
Chapter 6. A Note on Migrant Workers in Punjab
 Chapter 6 A Note on Migrant Workers in Punjab Yoshifumi Usami Introduction An important aspect of Industry-Agriculture, or Urban-Rural Linkage, is that of through labor market. Unlike the backward and
Effects of Trade Liberalization on the Gender Wage Gap: Evidences from Panel Data of the Indian Manufacturing Sector *
 Effects of Trade Liberalization on the Gender Wage Gap: Evidences from Panel Data of the Indian Manufacturing Sector * Manabu Furuta Prabir Bhattacharya Takahiro Sato March 26, 2018 Abstract This paper
Lunawat & Co. Chartered Accountants Website:
 MINISTRY OF FINANCE DEPARTMENT OF REVENUE CENTRAL BOARD OF EXCISE AND CUSTOMS NOTIFICATION NO. 04/2016-SERVICE TAX New Delhi, the 15 th February 2016 26 Magha, 1937 Saka G.S.R (E).- In exercise the powers
ELECTION NOTIFICATION
 National Neonatology Forum Office of Election Committee (NNF Election-2018) Child Central, 717/1, 16 th Main, 6 th B Cross, Koramangala, 3 rd Block, Bangalore-560034 Email-nnfelection@gmail.com, Contact-+917022283535
June Technical Report: India State Survey. India State Survey Research Program
 June 2016 Technical Report: India State Survey India State Survey Research Program TABLE OF CONTENTS Overview... 3 Sampling Methodology... 3 Target Population/Coverage... 3 Sampling Frame... 3 Stratification/Sample
Does political turnover adversely affect the state. expenditure policy? Evidence from Indian state. legislative elections
 Does political turnover adversely affect the state expenditure policy? Evidence from Indian state legislative elections Yogesh Uppal October 22, 2008 Abstract I examine the effect of political turnover
GUIDE 1: WOMEN AS POLICYMAKERS
 GUIDE 1: WOMEN AS POLICYMAKERS Thinking about measurement and outcomes This case study is based on Women as Policy Makers: Evidence from a Randomized Policy Experiment in India, by Raghabendra Chattopadhyay
ELECTION COMMISSION OF INDIA
 ELECTION COMMISSION OF INDIA Nirvachan Sadan, Ashoka Road, New Delhi 110 001. No. ECI/PN/13/2009 Dated: 2 nd March, 2009 PRESS NOTE SUBJECT: SCHEDULE FOR GENERAL ELECTIONS, 2009 The term of the 14 th Lok
Land Conflicts in India
 Land Conflicts in India AN INTERIM ANALYSIS November 2016 Background Land and resource conflicts in India have deep implications for the wellbeing of the country s people, institutions, investments, and
Short-term Migration and Rural Workfare Programs: Evidence from India
 Short-term Migration and Rural Workfare Programs: Evidence from India Clément Imbert and John Papp August 1, 2014 JOB MARKET PAPER Abstract We study the eect of a large rural public works program on short-term
ISAS Insights No. 71 Date: 29 May 2009
 ISAS Insights No. 71 Date: 29 May 2009 469A Bukit Timah Road #07-01, Tower Block, Singapore 259770 Tel: 6516 6179 / 6516 4239 Fax: 6776 7505 / 6314 5447 Email: isassec@nus.edu.sg Website: www.isas.nus.edu.sg
Growth and Election Outcomes in a Developing Country. Poonam Gupta. Arvind Panagariya *
 Growth and Election Outcomes in a Developing Country Poonam Gupta Arvind Panagariya * Abstract With the exception Brander and Drazen (2008), who use a comprehensive cross-country database consisting of
Political Reservation and Substantive Representation: Evidence from Indian Panchayats
 Political Reservation and Substantive Representation: Evidence from Indian Panchayats Esther Duflo (based on joint work with Lori Beaman, Raghabendra Chattopadhyay, Rohini Pande and Petia Topalova October
The Impact of Reservation in the Panchayati Raj: Evidence from a Nationwide Randomized Experiment
 The Impact of Reservation in the Panchayati Raj: Evidence from a Nationwide Randomized Experiment by Raghabendra Chattopadhyay and Esther Duflo November 2003 1 Introduction The 73rd Amendment paved the
The Acceleration of Immigrant Unhealthy Assimilation
 DISCUSSION PAPER SERIES IZA DP No. 9664 The Acceleration of Immigrant Unhealthy Assimilation Osea Giuntella Luca Stella January 2016 Forschungsinstitut zur Zukunft der Arbeit Institute for the Study of
Efficiency Consequences of Affirmative Action in Politics Evidence from India
 Efficiency Consequences of Affirmative Action in Politics Evidence from India Sabyasachi Das, Ashoka University Abhiroop Mukhopadhyay, ISI Delhi* Rajas Saroy, ISI Delhi Affirmative Action 0 Motivation
Social diversity, Fiscal policy, and Economic growth An empirical study with state wise data in India. Atsushi Fukumi 1 June 2004.
 Social diversity, Fiscal policy, and Economic growth An empirical study with state wise data in India Atsushi Fukumi 1 June 2004 Abstract It is well-known that, in India there exist huge differences of
The Organization of European Multinationals
 Discussion Paper No. 367 The Organization of European Multinationals Dalia Marin * Linda Rousová ** * University of Munich and BRUEGEL ** European Central Bank November 2011 Financial support from the
PRESS RELEASE. NCAER releases its N-SIPI 2018, the NCAER-STATE INVESTMENT POTENTIAL INDEX
 For more information, please contact: Shilpi Tripathi at +91-11-23452605, stripathi@ncaer.org Sudesh Bala at +91-11-2345-2722, sbala@ncaer.org PRESS RELEASE NCAER releases its N-SIPI 2018, the NCAER-STATE
INDIA JHPIEGO, INDIA PATHFINDER INTERNATIONAL, INDIA POPULATION FOUNDATION OF INDIA
 INDIA JHPIEGO, INDIA PATHFINDER INTERNATIONAL, INDIA POPULATION FOUNDATION OF INDIA Expanding Advocacy Efforts Geographical expansion Partnership expansion Expanded to two states: Assam and Maharashtra
DELHI PUBLIC SCHOOL, SURAT
 Series : DPS/ST/SS-SA-2/10-11 Code: 087 DELHI PUBLIC SCHOOL, SURAT SOCIAL SCIENCE (SAMPLE PAPER) SUMMATIVE ASSESSMENT Roll No : Marks : 80 Class : IX Time : 3 Hours Instructions : 1. The question paper
Classical papers: Osborbe and Slivinski (1996) and Besley and Coate (1997)
 and Besley and Coate (1997)") The identity of politicians is endogenized Typical approach: any citizen may enter electoral competition at a cost. There is no pre-commitment on the platforms, and winner implements his or her ideal policy.
The identity of politicians is endogenized Typical approach: any citizen may enter electoral competition at a cost. There is no pre-commitment on the platforms, and winner implements his or her ideal policy.
PANDIT DEENDAYAL PETROLEUM UNIVERSITY SCHOOL OF LIBERAL STUDIES MASTER OF ARTS PROGRAMME ENTRANCE TEST Time: AM 12.
 PANDIT DEENDAYAL PETRLEUM UNIVERSITY SCHL F LIBERAL STUDIES MASTER F ARTS PRGRAMME ENTRANCE TEST Date: 28 th June 2013 Time: 11.00 AM 12.30 PM Section B P U B L I C A D M I N I S T R A T I N 31. According
II. MPI in India: A Case Study
 https://ophi.org.uk/multidimensional-poverty-index/ II. in India: A Case Study 271 MILLION FEWER POOR PEOPLE IN INDIA The scale of multidimensional poverty in India deserves a chapter on its own. India
INTERNATIONAL JOURNAL OF BUSINESS, MANAGEMENT AND ALLIED SCIENCES (IJBMAS) A Peer Reviewed International Research Journal
 A Peer Reviewed International Research Journal") RESEARCH ARTICLE Vol.4.Issue.4.2017 Oct-Dec INTERNATIONAL JOURNAL OF BUSINESS, MANAGEMENT AND ALLIED SCIENCES (IJBMAS) A Peer Reviewed International Research Journal THREE TIER MECHANISM OF CONSUMER DISPUTES
RESEARCH ARTICLE Vol.4.Issue.4.2017 Oct-Dec INTERNATIONAL JOURNAL OF BUSINESS, MANAGEMENT AND ALLIED SCIENCES (IJBMAS) A Peer Reviewed International Research Journal THREE TIER MECHANISM OF CONSUMER DISPUTES
Benefit levels and US immigrants welfare receipts
 1 Benefit levels and US immigrants welfare receipts 1970 1990 by Joakim Ruist Department of Economics University of Gothenburg Box 640 40530 Gothenburg, Sweden joakim.ruist@economics.gu.se telephone: +46
THE GAZETTE OF INDIA EXTRAORDINARY PART-1 SECTION 1 PUBLISHED BY AUTHORITY MINISTRY OF POWER. RESOLUTION Dated 29 th November, 2005
 THE GAZETTE OF INDIA EXTRAORDINARY PART-1 SECTION 1 PUBLISHED BY AUTHORITY MINISTRY OF POWER RESOLUTION Dated 29 th November, 2005 F.No.23/1/2004-R&R - In this Ministry s Resolution F.No. 23/1/2004-R&R
Trans. Inst. Indian Geographers. Fig.2 : Consistency in the seats won by the BJP: (See page 66 for text)
") Trans. Inst. Indian Geographers Fig.2 : Consistency in the seats won by the BJP: 1989-2004 (See page 66 for text) Transactions Vol. 36, No. 1, 2014 61 Trans. Inst. Indian Geographers Fig.3 : Consistency
Trans. Inst. Indian Geographers Fig.2 : Consistency in the seats won by the BJP: 1989-2004 (See page 66 for text) Transactions Vol. 36, No. 1, 2014 61 Trans. Inst. Indian Geographers Fig.3 : Consistency
Corruption, Political Instability and Firm-Level Export Decisions. Kul Kapri 1 Rowan University. August 2018
 Corruption, Political Instability and Firm-Level Export Decisions Kul Kapri 1 Rowan University August 2018 Abstract In this paper I use South Asian firm-level data to examine whether the impact of corruption
The Effect of Ballot Order: Evidence from the Spanish Senate
 The Effect of Ballot Order: Evidence from the Spanish Senate Manuel Bagues Berta Esteve-Volart November 20, 2011 PRELIMINARY AND INCOMPLETE Abstract This paper analyzes the relevance of ballot order in
Exporters and Wage Inequality during the Great Recession - Evidence from Germany
 BGPE Discussion Paper No. 158 Exporters and Wage Inequality during the Great Recession - Evidence from Germany Wolfgang Dauth Hans-Joerg Schmerer Erwin Winkler April 2015 ISSN 1863-5733 Editor: Prof. Regina
A case study of women participation in Mahatma Gandhi National Rural Employment Guarantee Act (MGNERGA) in Kashmir
 in Kashmir") International Journal of Allied Practice, Research and Review Website: www.ijaprr.com (ISSN 23-1294) A case study of women participation in Mahatma Gandhi National Rural Employment Guarantee Act (MGNERGA)
International Journal of Allied Practice, Research and Review Website: www.ijaprr.com (ISSN 23-1294) A case study of women participation in Mahatma Gandhi National Rural Employment Guarantee Act (MGNERGA)
Immigration and the use of public maternity services in England
 Immigration and the use of public maternity services in England George Stoye PRELIMINARY - PLEASE DO NOT CITE 29th September 2015 Abstract Immigration has a number of potentially signicant eects on the
Social Science Class 9 th
 Social Science Class 9 th Poverty as a Challenge Social exclusion Vulnerability Poverty Line Poverty Estimates Vulnerable Groups Inter-State Disparities Global Poverty Scenario Causes of Poverty Anti-Poverty
Issues in Political Economy, Vol 22, 2013, 56-76
 Issues in Political Economy, Vol 22, 2013, 56-76 Reservation Policy and Criminal Behavior in India: The Link Between Political Reservation and Atrocities Against Scheduled Castes and Tribes Raahil Madhok,
GOVERNMENT OF INDIA MINISTRY OF HOME AFFAIRS
 GOVERNMENT OF INDIA MINISTRY OF HOME AFFAIRS LOK SABHA STARRED QUESTION NO.*158 TO BE ANSWERED ON THE 8 th MARCH, 2016/PHALGUNA 18, 1937 (SAKA) FLOOD RELIEF *158. SHRIMATI KOTHAPALLI GEETHA: SHRI CHHEDI