The California Primary and Redistricting
|
|
|
- Brendan Booker
- 5 years ago
- Views:
Transcription
1 The California Primary and Redistricting This study analyzes what is the important impact of changes in the primary voting rules after a Congressional and Legislative Redistricting. Under a citizen s committee, California s redistricting promoted zero-sum, two party competitions between the major two political parties, resulting in a strongly partisan plan, with one-dominant party, competition within the minor political party, and very little influence of nonpartisan or third political parties. Inasmuch the redistricting uniformly produced a range of safe to marginally secure districts for Congressional, one-half of the State Senate and House elections, most of the variances in the primary levels of partisan contestations are explained by differences in candidate entry in the Republican versus Democrat or open districts. Because the voting rule allows for two members of the same political party to qualify for a runoff, the general election determined by the Primary has generated a range of partisan contestations with most Congressional, State Senate and House districts having a Democrat and Republican candidate. There are also some concerns about assuming ordinal rankings with multiple candidates, where the number of candidates in California districts ranged from one to thirteen, may limit the usefulness of studying all possible rank orderings, and therefore limit the analysis of any polling information available.
2 The 2010 Primary in California was administered under a new structure, consisting of different voting and redistricting procedures. This new structure changed the campaign for nomination and election with new districts. In the absence of these procedural changes, there may have been substantially fewer candidates contesting for nomination, inclusive of the more typical post-redistricting situations with increased numbers of uncontested districts, electing a single partisan candidate. Most of the increases in contestations are explained by third party competition and the listing of independent candidates, on the ballot, and those with no party preference (NPP). The redistricting process was lead by a citizen s committee with goals for attaining greater contestation and competition under the new voting procedure. This bipartisan commitment to having a new structure for district elections, where these new districts would contain a reduction in the margins of victory for the winning candidates, a more even division of the vote in the primary election, greater numbers of candidates in primary elections, fewer oneparty districts, an increased in the number of political parties contesting for election, fewer single candidate primaries, and fewer single candidate general elections. This effort to reduce partisanship, or at least monopoly control by the two major political parties, generally failed to the exchange for third party and nonpartisan candidate votes from two party competition. Instead, the evidence suggests partisan competition remains only between the two major political parties, even though the State Republican Party won fewer than one-third of the Assembly and Senatorial Districts. At the state level, there were no differences by types of districts in partisan voter registration, primary and general election vote shares, and electoral margins for the winning candidates. Among the Assembly, Senatorial, and Congressional Districts the only differences were in terms of the number of votes cast and the number of political parties contesting elections. With regard to the outcomes of the primary and general elections, under the new districts, the citizen s committee attained the goals established to reduce partisan differences and variance among Legislative Districts that are generally not contained within each other. The California Citizens Redistricting Commission had other goals pertaining to the design of districts, but these are somewhat distinct from efforts to reduce partisanship by design and provide for more competitive elections with greater turnouts. What the changes in the redistricting process did not produce was a reduction in the competition between the two major political parties. Instead, this study finds the changes produced district elections which generated substantial variances in numbers of political parties, electoral margins, and partisanship. This study also finds lessor differences in the outcomes, in terms of votes cast and numbers of candidates. In summary, the changes did produce changes in the outcomes, and these outcomes generated variance among district elections held in somewhat more distinctly, if not bifurcated, partisan areas of California. By making the districts safer, this could have resulted in uncontested primaries and general elections along with substantial increases in electoral margins in those seats with a primary or general election opponent, but it did not because of the design of the district elections. There were some challenges to the new voting procedure similar to previous litigation concerning open primaries, top-two or blanket primaries, and other procedural changes to what are primaries with plurality rule. Besides California, there are currently three other states with 1
3 voting procedures nominating the top two vote getters, Louisiana, Nebraska, and Washington. Some of the issues specific to this change in California involved the role of nonpartisan candidates in Congressional elections and primaries for third political parties. After the primary, some additional consideration was given by candidates who prefer to not continue with a second campaign against the same candidate. Lastly, the partisan registration data indicated a decline in the base of the State Republican Party, and therefore a likely decrease in the number of Assembly, Senatorial, and Congressional Districts held by Republicans. This decrease in voter registration, term limits for the Legislature, and population displacement of constituencies all contributed to some incumbents either opting out of contesting for reelection or pursuing other elective offices. Among the retirements from elective offices included a member that had successfully won reelection through four previous redesigns of Assembly and Congressional Districts. The 2010 redistricting process also overtly attempted to not equate redistricting to partisan registration, and therefore limit the drawing of new district lines to the manipulation to fit partisan voter registration. As a result, the design of the districts, and subsequent district elections are seemingly the product of ongoing population trends in the State, some emphasis on county boundaries and bipartisan agreement with some willingness to compromise on incumbency displacement. All of the incumbents that contested for reelection to the Assembly, the Senate, or The House of Representatives but one member of the Congressional delegation, were renominated. The numerous adjustments following redrawing of the one hundred and seventy threedistrict boundaries provide a general description of redistricting effects. Even so, district elections produced candidates from the two major political parties, in approximately eighty percent of the legislative districts holding elections. The findings indicate the nonpartisan and third political parties were irrelevant alternatives, with only minor differences in the outcomes between the district elections resulting in a Republican versus a Democrat. This study finds electoral competition was zero-sum between the major parties and linearly determined within each the major political parties by partisan registration and primary vote shares, even though new redistricting and voting procedures were implemented for the purposes of limiting manipulation of boundaries by voter s partisan registration. Models of Primary Elections with Voting Procedures Besides Plurality Rule The formal results on primary elections represented these elections as either less predictable, in terms of forecasting outcomes, or structurally designed with the intent to make it easier to select winning alternatives. Forecasting the outcomes in the absence of partisan comparisons is considerably less accurate, and because of the voting procedures used, may be sometimes determined by the structure imposed for voting. Given substantive differences among states, with the voting procedures described as closed, open, and a blanket hybrid/clopen primary, some of the uncertainty in modeling voter turnout and numbers of candidates, may be the result of both differing and changing voting rules for nominating candidates. The variance in outcomes attained under primary election voting procedures, may therefore be considered positively associated with the thresholds necessary to qualify for positions on a general election ballot. 2
4 In the case of the California Primary, this matter is complicated by the introduction of nonpartisan or independent candidates and the lack of an elective nomination process for third party candidates. The issue is generally whether to place third party candidates directly on the general election ballot. Independent candidates running with a Peace and Freedom designation were placed on the general election ballot, without a primary contestation, and in some cases these candidates had a greater vote share in the general election than either the Libertarian or Green Parties in the primary. In the absence of a primary contest, third political party alternatives differ ideologically from the major political parties, but these campaigns are similar procedurally to independent campaigns organized within only a few districts. The results of Campaign 2010 indicate that neither the Libertarian nor the Green Parties strengthened in the general election, with these third parties minor vote shares substantially greater in the primary than general election. Candidates running independently of partisan preference also campaigned in both the primary and general election, with the vote for these nonpartisan candidates collapsing to fractions of the primary vote share in the general election. Where voters did vote for the nonpartisan candidate, these campaigns were substantively located in districts where the vote shares of the second major political party collapsed in the primary election campaign. Inasmuch NPP candidates opposed both Democrats and Republicans in the 2010 General Election as the second candidates, wherever the other major party failed to qualify for nomination. The difficulty of using polling to measure voter preferences appears to explain why polling is less accurate in predicting the outcomes of primary campaigns. Given a somewhat greater level of uncertainty concerning vote shares, primaries introduce other complexities associated for measuring ordinal preferences among candidates with significantly varying numbers of votes cast (by district in this case), varying numbers of candidates in the same political party, and varying numbers of political parties under the voting procedure implemented in California. Given these complexities, it is not surprising polls fail to accurately predict electoral margins in primary elections. Additional trends in partisan registration also contributed, in California, to some of imprecision in forecasting vote shares, since partisan registration and Republican party registration both decreased more substantially than what could be administered through a normal redistricting process. These trends in partisan registration contributed to the inability to design safe districts for the Republican Party, and also resulted in emphasizing competition between partisans, third party alternatives, and supporting the inclusion of nonpartisan candidates to provide some competition in vote shares in an electorate with significant declines in the second major political party. As competition collapses for either major political parties, competition between partisans in a runoff, general, election replaced duopoly competition under the new voting procedure. Inasmuch polls are uncertain measures of voter preferences for primary candidates, and any formal analysis is both speculative and by assumption. By considering all of the possibilities, for small numbers of candidates, there may be interpretations of the polling results for the purposes of generating plausible ordinal rankings, even if this analysis is too imprecise to provide accurate point estimates of vote shares. The rationale for this may not be useful in practical situations where testing of new techniques for vote mobilization is relevant to predicting voter turnout in a primary election. 3
5 Any construction of a formal model of primary elections begins with uncertain voter preferences and may not provide direct implications for predicting electoral margins in vote shares. The problems created by a large number of candidates is also more than a slight difficulty for constructing models of primary election voting, because either indifference or preference may be inferred (from polling data) for distinguishing amongst candidates on a long primary ballot. The inclusion of multiple political parties introduces the potential for multidimensional voting, because partisan registration and vote shares, composes a single factor or dimension. In the California Primary and General Election, the major political party registration and vote shares represent a single dimensional voting space, whereas the inclusion of nonpartisan and third party registration and vote shares, in the primary and general election, consist of a second factor. By emphasizing nonpartisan and third party alternatives, the 2010 Campaign introduced a two-dimensional vote space for the purposes of nominating and electing candidates for the new districts. Based on a description of the election returns, and not voter registration data, the findings indicate the nonpartisan and third party alternatives were generally not relevant for the purposes of constructing ordinal voter preferences to alternatives in any primary election, with multiple major party candidates and additional minor party and independent candidates for nomination. Given the variance in the number of candidates, any description for considering all possible combinations of ordinal preferences, inclusive of indifference between alternatives, is rendered somewhat less precise because of the existence of large numbers of candidates in a few districts. The theoretical basis for a model of primary elections remains a consideration of the number of alternatives, however, any comparison may be imprecise in terms of measuring voter preferences for a large number of multidimensional alternatives. Because the outcome space is single dimensional, and the voting theory suggests the importance of comparisons across large numbers of alternatives, in multidimensional space, any model of primary elections consists of the logical consideration of outcomes in the vote space. An analysis of the logically possible outcomes, in the vote space, is a better description of the formal model than limiting analysis of voter preferences to general elections only or interpreting data that is too inaccurate to be useful. Even so, the implementation of district elections under new voting rules, suggests a formal model of the voting procedure with emphasis on the logically possible voting outcomes. The model of the voting procedure is described in FIGURE 1, with the basic analysis of the change in the California Primary in FIGURE 1.2. FIGURE 1.1 through 1.4 provide a comparison of some of the state voting procedures classified as the traditional primary (and general) election model, the runoff election only model with two rounds of voting, and a partisan primary with a runoff election. Because the outcomes possible are different, under each voting procedure, most empirical classifications of primary elections suggest there is no unique representation of a model of primary elections, although most descriptions imply the top vote getter in the primary is nominated, in the first round of voting, with the general election between partisan candidates representing the two major political parties in second round of voting comprising general election for Assembly, Senatorial, and Congressional Districts. 4
6 The legacy of primary elections as a reform model is perhaps best understood by the many variations in voting procedures adopted and frequent innovations in primaries enacted by The States. In the absence of a unique voting procedure, such as plurality rule with single member districts, the distinctions between categories such as closed, open, clopen, and top vote getting primaries, may be based on either the number of rounds required to nominate candidates, or the vote shares required for nomination. Given the voting procedures used, it is clear that both the number of rounds of voting and vote share thresholds are relevant to any description and classification of different types of State primaries held. After a partisan redistricting, into more secure districts, the traditional primary model implies a reduction in contestations in numbers of primary candidates and in competition in vote shares. Given two rounds of voting, shown in FIGURE 1.1, assume redistricting produces either one or two candidates contesting for nomination in each of the major political parties. If there is a single candidate, in the primary and general election, once nominated, the campaign is over and this candidate is declared the winning candidate in what is termed an uncontested election. If there are two candidates, and a nominee for both major parties, the primary involves the selection of one of two candidates, and then a pairing of Democrat and Republican candidate for general election. Whether more votes are cast in the Democrat or Republican primaries might be only relevant for forecasting an election, and in terms of constructing vote preferences for the candidates. For other purposes, including the construction of a formal model of primary elections, the outcomes essentially consist of three outcomes: {D, D R, R}. What is important may not involve the distinction between D > R and R > D numbers of votes cast, and therefore DR or RD vote preferences, but whether there were one or two primary candidates. The distinction between contested and uncontested nominations imply not only variance in vote mobilization, and therefore votes cast, but substantive differences in vote preferences, DD > R or RR > D, and thus a magnitude difference in DR or RD vote preferences. Additional candidates, such as three or more primary candidates DDD > R, only increases the potential for greater differences in the vote shares and therefore forecasted vote margins. Since the purpose of primary is to nominate, primaries filter the number of candidates to a single choice. In the 2010 Campaign, however, Republican candidates, qualified for the general election, did not run in the primary. Additionally, Peace and Freedom designated candidates, held no primary, but were placed on the general election ballot. Since candidate entry and exit determines the number of candidates, and this is procedurally controlled by political parties and State election law, some of the differences in descriptions and therefore classification of primaries is the consequence of candidate entry and exit decisions. In summary, voting procedures go beyond the number of signatures required to be placed on the ballot, to encompass which round the candidates are placed on the ballot and how many votes are required to qualify for the next round of voting. In the traditional model, voting is either one and done, or a pairing with a campaign generally between only two alternatives; a legacy of election history prior to that consisted of frequent elections, long ballots, multiple candidates elected, and nonpartisan or third political party alternatives. By filtering the number of alternatives, this places greater control over the ballot under State Election Law, with the intent to reduce the number of candidates and political parties too smaller, if not small, numbers of alternatives for voters to construct preferences. 5
7 The California Primary of 2010 was administered under the voting procedure nominating the top two vote getters, by plurality rule, regardless to the number of candidates or political parties. The voting procedure also allowed for the comparison of all the alternatives, a procedure sometimes described as an open primary, or more precisely as a blanket primary because it covers all of the alternatives. In Louisiana, all of the candidates contested the primary as independents, with no party designation, with only nominees declaring their party preference on the general election ballot. In California, candidates declared their partisan preferences for the ballot, with no party preference equated to a nonpartisan alternative. Unlike independent candidates that have some partisan preferences, but no party endorsement, these NPP candidates contested for both nomination and general election in the California Primary. Introducing nonpartisan alternatives requires a third alternative, with third party alternatives thereafter constituting forth, and fifth alternatives. In this study, the 2010 six alternatives were the State Democrat, Republican, NPP-no party preference, Green and Libertarian, and Peace and Freedom candidates. Given the empirical findings, only the D and R candidate party preferences were relevant in terms of the electoral outcomes. In this bipartisan primary model, the four contested outcomes are DD, DR, RD, and RR. Under a traditional primary, at most one D and R candidate would be nominated with a second, general comparison of the D and R candidates for election. Instead, the California Primary reduced the number of candidates to two, and then paired the top two vote getters regardless to their partisan preference. In the case of a traditional primary, and certainly in California elections, a D candidate would be favored to win election, given D > R votes cast in the primary. Thus, the DR outcome predicts a D winner, in a second round of voting, and RD outcome predicts an R winner. This was generally the case in the 2010 elections, with Democrat candidates winning after the DD and DR primary outcomes, and Republicans winning election in RD and RR situations. The principal differences were in terms of the numbers of candidates contesting the election, which are presumably greater than would have been under a different redistricting process, and perhaps more to the point, because of the second round of competition required in DD and RR outcomes. Unlike a traditional primary and general model, such as the model described in FIGURE 1.1, the California model required a second round of voting, even if there were only two candidates in the primary, regardless to the partisan preferences of the candidates reported in FIGURE 1.2. Because there were more candidates than expected, after a redistricting into more secure Democrat and Republican districts, there were fewer majority winners in the primary, more than two partisan candidates within one or both of the major parties contesting nomination, and fewer uncontested campaigns winning election. Taking the contestation decisions into account, there were a small number of uncontested (re)elections of candidates in The outcome of D or R only occurred less frequently under the California voting procedure, and the interpretation is that happened in far fewer newly created districts than what could be expected, given the decline in Republican registration, and the redrawing of new districts. By having more candidates contest the 2010 Primary, including NPP and third party candidates, this diminished vote shares below a simple majority, more frequently, and resulted in more competitively even vote shares than what would be expected after redistricting. After reducing the number of candidates and political parties to two alternatives, this voting procedure produces four contested and competitive outcomes instead of two. 6
8 Given the fewer number of Republican districts, and the increased proportion of the electorate registered as other than the major two political parties, the speculation is that there will be more NPP candidates in the future, and that these independent candidates will be more successful in winning nomination as the second alternative. Whether this becomes true, and therefore implies adding a third alternative to {D, R} is somewhat different from holding an open primary, implementing a blanket primary, or the Louisiana nonpartisan model of primary elections. Instead this is more similar to states, such as North Dakota and Nebraska that had active nonpartisan, leagues of municipalities, with candidates designated on the ballot with no party preference (N). Unlike independent candidates (I), or alliance candidates (ICM), or candidates elected from state political parties with other campaign or factional endorsements (IR or ID and J-D), these are the same as candidates elected on a nonpartisan ballot that choose not to declare their partisan preference after nomination. Whether this represents either an unknown partisan affiliation to voters or no party registration on the part of the candidate, may be less important than providing a second, and not a third, alternative to one of the major political parties in a general election campaign. Under the Louisiana primary model, the initial voting procedure nominated candidates without partisan designation. Candidates then affiliated with one of the major political parties for the general election. In the case of a candidate winning a majority in the primary, the candidate could wait until being seated in the legislature to affiliation with a political party. As a result, these officials were technically elected as nonpartisans, although they usually had a general election opponent which revealed both candidates partisan preferences in a runoff election. Even so, electing NP-R or NP-D candidates were sufficiently confusing, and somewhat controversial, because of the frequency of occurrence, that Louisiana was forced to amend the voting procedure to allow for partisan designation on the primary ballot. Voters still voted for all the candidates, inclusive of those affiliated with D and R, or without partisan designation (N). For this reason, after amendment, the Louisiana and California primary are similar, although the goal for the 2010 California Primary appears to have been to make sure there would be two alternatives in each campaign for district election. Instead of a third alternative, the intent appears to have been to make certain the district elections would be contested and there would be some competition in both the primary and general election vote shares. Rather than producing uncontested and landslide two candidate elections, the addition of nonpartisan and minor political parties alternatives introduced more complicated, two dimensional voting, in numbers of candidates and numbers of political party alternatives. This is distinctly different from adding a third alternative to the existing two major alternatives. It is also different from previous campaigns when candidates filed petitions in both the Republican and Democrat, closed, primaries. When cross filing occurred, this frequently produced R-D and D-R candidates, winning both primaries and therefore winning election during the first round of voting. The election of fusion tickets, with R-D or D-R candidates, happened in many states, including California. The legacy of cross filing with candidates competing against each other, regardless to partisan designation, in a closed primary model, is therefore being part of electoral history. Even though the DR and RD outcomes are not the same, because there are two candidates, the inclusion of all candidates in a single, consolidated, and therefore open or blanket primary is similar to allowing for cross filing in both major political parties. 7
9 Candidates that cross filed should not be considered nonpartisan candidates, or a third alternative, although a fusion ticket candidate may have been elected with more than a two party endorsement. In states with minor political parties, these endorsements produced multi candidate and party designated candidates in both the primaries and general election. Where these minor political parties are dropped from the ballot, a candidate may be considered nonpartisan because there is no party designation or partisan preference designated on the ballot. In situations where the major political parties endorse or nominated other candidates, these candidates may still qualify for the ballot, and contest as independent candidates or independent candidates with partisan preferences designated on the ballot. The substance of the California Election Law and voting procedure seems to allow for some of this multidimensional voting in order to generate outcomes associated with improved contestation and a greater range of competition. In states with a large majority for one political party, candidates were historically selected by local party caucus and state party conventions. The advent of primary election for nomination and two rounds of voting to elect candidates was modified in one-party states to allow for a primary and runoff election. In these states, the first election reduced the number of candidates to two, and the second elected the winning candidate between the two candidates nominated. In states with two political parties, but a large number of one-party districts, the same two rounds of voting could be used to reduce the number of candidates and pair the top two vote getters for the purposes of election. Given the current landslide conditions in most legislative districts, throughout the United States, it is not atypical for electoral margins to exceed supra majorities. In these situations, the greatest degree of competition may sometimes occur within the primary election, and not in the general election. In these districts, competition could be enhanced by allowing for the top two vote getters to oppose each other in a runoff election. However, this is clearly not what is specified by the traditional primary model that was designed to filter candidates or choose a candidate and then pair candidates from the major political parties. The runoff voting procedure shown in FIGURES 1.3 & 1.4 consists of two rounds of voting for the purposes of reducing a large number of primary election candidates to two candidates, to select one from the same political party. As shown in FIGURE 1.3, the two stages of what may be considered a primary election (I & II) may produce several outcomes. First, this may reduce the outcomes to a single candidate, by endorsement and therefore nomination, something that states with active caucus and convention methods approved. Secondly, candidates may have voluntarily exited the campaign after receiving fewer votes in the first round of voting, leaving only one or two candidates at most left to campaign in a second round of voting. Thirdly, as demonstrated in FIGURE 1.4, larger numbers, of three or more candidates may be reduced to two nominated candidates, and then one candidate elected. Forth, members of both parties may be elected from one-party districts, in which case both major political parties would administer two rounds of voting to elect candidates. In FIGURE 1.3, the primary election model describes competition in a oneparty system with monopoly voting agenda control. In the two party systems with bipartisan or duopoly voting agenda control, this represents a generalized binomial search through the set of alternatives within each of the political parties. 8
10 Some Results on Voter Preferences in Primary Election Models Given a range of outcomes, describing contestation decisions, polling indicates information concerning individual voter preferences for the candidates in a primary. Some of this information is reducible to partisan identification, so that Democrat voters strictly prefer Democrat candidates to Republican candidates for nomination and therefore election. Any searching through the alternatives, for strong partisan identifiers, may generate D: D R and R: R D. Third party voters would prefer their party s nominees to those in the major two political parties. And it is not quite so obvious as to how to represent independent identifiers voter s preferences, such as those with no party preference. Whether these voters are considered nonpartisan voters, holding preferences for either party, bipartisan in their voting, with a preference for one political party, or preferring some other alternative, such as fusion candidates are all possibilities which could be added to the formal analysis as a third alternative. For those with a major political party preference, the numbers of the voters are relatively small, varying by other registration preferences and numbers of minor candidates, that may make a difference in specific district elections. For most voters, including those in the 2010 California Primary, the vote shares of the minor candidates imply these are irrelevant alternatives. For most voters, preference for a third alternative, is just that, generating voter preference s D: D R T and R: R D T. As a result, inclusion of a third alternative is not relevant for voter preferences between the major political parties. For those voters identifying with a third political party, this would be considered their first choice to elect T: T D R or T R D. Given the relatively small vote shares for third party candidates, and the relatively large shares of voters registered in the other category, it is clear that partisan identification for third party alternatives exceeds vote shares for minor political party candidates. Even so, the existence of third party alternatives represents a range of five to ten percent of the primary and general election returns, and it appears to be the second choice for more voters in one party district s where the second major political party has no chance of winning the nomination or election. In these district elections, the third alternative is preferred by some proportion voter s with preferences for the major political parties. In these instances, some combination of new districts, term limits and an open position, an unpopular incumbent, no contestation by the second major political party, and a strong third party candidate all seemingly comes together to produce the third party as the second choice. Like the Reform Party, this requires a coalition between D, R, and independent voters, where the voters preferences for the third party are distinct from their preferences for the major political parties, and these individuals may be relatively evenly divided in their preference for the major political parties. Within the Reform Party, this alliance between D and R voters divided after the failure of the Reform Party with the alliance between partisans remaining longer intact than the coalition for Reform Party candidates that contained approximately one third independent registered voters and two-thirds partisan Democrats or Republicans. As a result, third-party voter preferences should be generally specified as the first or second choice, with strong partisans preferring a third party, such as the Libertarian or Green Party, with other voters who occasionally prefer a third party alternative as the second choice in district elections where the second major political party is either not contesting the election or there is almost no chance of winning election and there is a 9
11 strong third party candidate: D: D T R or R: R T D. Whether these candidates are relevant, in terms of vote shares, makes a difference in the accuracy of statewide polling because of the uncertain effects on district voter turnout and the relatively small numbers of viable third party candidates, that may be considered by voters as an alternative to the major party likely to win within their district. Given a second candidate, in states with a closed partisan primary, this requires voters to establish a preference amongst candidates within their political party. For D voters in a primary with two candidates, D: D 1 D 2 R, and R: R 1 R 2 D. For strong partisan identifiers, D: DD R and R: RR D, indicating strong preference for any of the candidates from a major party to those nominated by the other major political party. For somewhat more independent voters, or those who prefer, usually either a challenger to an unpopular incumbent, or partisans for an open seat, the second choice may be from the second major party, which is different from their partisan preference generally. In these instances, D: D 1 R D 2 or R: R 1 D R 2, there is some potential for the second major political party to win votes from partisans, but this is usually because their first choice may not have been nominated. In a traditional primary with two rounds of voting, candidates may be nominated from either of the major parties that are viable to general election voters from the other major political party. These voters are not indifferent amongst the candidates, nor do these support third party candidates as a second choice. Instead, some of the indifferent voters may be very strong partisans who prefer either their first or second candidates to the opposition major political party s nominee, with D voters : D 1 D 2 R, and R voters : R 1 R 2 D. Independent voting preferences may also be distinguished among those with partisan preferences and a preference for competing with two-party alternatives, instead of voting in a one-party district. For these voters, the preference R: RD RR indicates a preference for the pairing of a Republican and Democrat candidate in a second round of voting, with an expected preference for the Republican candidate to have the best chance of winning the general election. In these RD districts, more votes were cast for Republican candidates in the 2010 Primary than for Democrats. In one-party districts, any third party or nonpartisan alternatives may become part of the voter s preferences as a second alternative, with examples such as 1) R: R 1 NPP R 2, 2) R: R 1 L R 2, and 3) R: R 1 G R 2. More generally, an R: RD RR preference may be produced by voter s that prefer safer partisan districts, an independent set of partisan candidate alternatives, such as R: R 1 D R 2, or a preference for an incumbent likely to win reelection, R: DR RR RD DD with R: D 1 R 1 R. 2 There are other examples of Independent Republican (IR) voting preferences. The legacy of cross filing in primary elections and voting on a nonpartisan basis with bipartisan agreement, is part of the organizational history of the California Republican Party. Similar to elections in other states with nonpartisan ballots, and a legislative caucus to determine majority party status, the preference for nonpartisan candidates, fusion D-R tickets, and RD districts, is somewhat unique to the states with nonpartisan local elections and more recent statehood. The voting rule changes for the 2010 California Primary are consistent with these voters preferences, such as IR: NPP D R & IR: NPP RD R D, allowing for more independent candidates to contest as nonpartisan alternatives to what would otherwise be one-party districts. 10
12 Among other partisan registrants, and majority party Democrat s, the legacy of independent voting is somewhat different because it is related to individual campaigns or factional preferences that may also be related to individual candidates. For these voters, a very weak form of independent voting preferences would be something like ID: DR D NPP R, with a preference for a Democrat winning the district to one-party uncontested elections. A nonpartisan alternative may also be relevant as a second choice, even though these voters prefer Democrat to Republican alternatives generally. A stronger form of independent Democrats may prefer a third party, factional designation, such as ID: P&F D R, to regular Democrat nominees. Lastly, amongst those with a third party preference, some of those voters may be included in with other independent voters having registered with no party preference. By not indicating partisan preference, some of the Green and Libertarian Party voters may be considered independent Democrats or Republicans, holding G: G R D or G D R or L: L R D or L D R preferences for candidates. Given the outcomes in FIGURE 1, the major or primary alternatives to consider involve a set of partisan alternatives, with emphasis on two-party contestation decisions and competition between the major political parties. Whether this occurs in the primary, or in two rounds of voting, consisting of a primary and general election is procedurally relevant for reconciling limited polling information on voter preferences, partisan registration data by district, and primary and general election returns in district elections. Under the one hundred and fifty-three Assembly (80), Senatorial (20), and Congressional (53) Districts, the primary election outcomes were generally from the set of alternatives {D, DD, DR, RD, RR, R}, modeled in FIGURE 1.2 above. Voter preferences to these alternatives comprise most of the primary voting electorates. In this model, the contestation decision is included, allowing for voter preferences for a single candidate from their preferred major political party. In each instance, within the California Democrat Party, this involved an incumbent running uncontested for reelection under the new district plan. Assuming these candidates where the first choice amongst major partisan voters within the primary, no second candidate emerged within the Democrat Party, or from among third party or nonpartisan alternatives, so that these candidates won simultaneously won renomination and reelection. For strong partisan voters, the general voting preference is a linear ordering from uncontested reelection, to competitive elections, to electing the opposition party in district elections. These voting preferences allow for competition, between DR and RD, with D: D DD DR RD RR R and R: R RR RD DR DD D. Given the small number of uncontested nominations, the primary preferences are generally D: DD DR RD RR or R: RR RD DR DD for this set of relevant alternatives. Including the minor alternatives and two or more major party candidates for nomination, generates additional preference orderings. Amongst those with a Democrat partisan preference, some of the possibilities are: D 1 D 2 R, D 1 R D, 2 D 1 R G/L, D 1 NPP R, D 1 P&F R, P&F D R, D 1 D 2 R D 3, and D 1 D 2 D 3 R. Similar preferences may be constructed for Republicans, but given increased majority status of the California Democrat Party after redistricting, the discussion of independent voting may provide a more accurate description of Republican voter preferences than voting with multiple candidates, third party designation, and some split ticket voting by Democrats in the majority. 11
13 Instead of describing these as factional differences, voter preferences with two or more candidates in the majority party may include Republican, third party, and nonpartisan (NPP) candidates. Additionally, these voters preferences incorporate an implicit preference for contestation, in the form of candidate entry, and some degree or amount of competition in vote shares. In the absence of either, there are one-party districts with uncontested reelection. On this basis, it is possible to construct preferences for the primary electorate, based on the election returns, consisting of DD RD D DDD = DR RR = R. These voters preferences indicate distinct preferences for the majority party, competition, bipartisan competition, some bipartisan preference that is similar to nonpartisanship, contestations, the third alternatives as only a second choice, and very few voters having a minor party preference. In the new districts, any gerrymandering that made the districts safer, in partisan terms, generated more distinct preferences. In district elections with an incumbent preference, the D 1 or R 1 candidate won renomination one hundred percent of the time. In this model, summarized in FIGURE 1.2, the outcomes of the 2010 Primary also indicate a preference for a fusion ticket statewide and bipartisanship in district elections, by electing members of either major political party. The voting procedure filters the number of candidates by nominating the top two for general election. The results indicate a preference for the traditional primary, with approximately four-fifths of the districts nominating both a Democrat and Republican candidate. Results that also indicate the new districts and voting procedure is approximately eight percent effective, in terms of producing the outcomes of a traditional primary. Similar to a traditional primary, there are only two rounds of voting, to choose nominees and elect candidates, instead of the third rounds to guarantee a simple majority rule winning candidate. The preference for two rounds of voting is also consistent with one-party districts, or states, requiring a second round of elections, usually described as a runoff election, to produce a majority rule winning candidate from more than two candidates in a single political party. The outcomes of the 2010 Campaign indicate a preference for bipartisanship, with a fusion ticket set of outcomes in the General Election. Instead of a large number of one-party districts, and uncontested elections in secure major party districts, the new districts and voting procedure seemingly reveal a voter preference for some larger number of candidates, even if some of the districts fail to nominate both Republican and Democrat candidates for general election. In this voting space, the preference for a number of candidates and political parties is determinative of the outcomes of the number of rounds in a voting agenda, in the form of primary and general elections. On this basis, voters also express preferences for the number of rounds of voting they prefer. In some instances, such as a popular incumbent, there may be zero rounds of voting with an uncontested election for renomination and reelection. In others, with the inclusion of a simple majority requirement, this may involve a voting agenda consisting of three rounds of voting, with two primaries and a general election. In most The States, voters neither appear to prefer uncontested one-party districts nor three rounds of voting. However, there may come a time when additional runoff elections are preferred to blanket primaries, so that voters have larger numbers of candidates in both political parties, a primary reducing the number of candidates to two, a runoff within each of the major political parties to nominate, and then a third election to elect one of the two major political parties candidates. The voting agenda sequence of 12
14 candidate entry and contestation, to produce a large field of candidates, is clearly a nonpartisan election, with subsequent elections between candidates in the same and then different political parties to produce a majority rule winning alternative. In the absence of a majority preferred candidate, or political party, the new districts and voting procedure indicate some willingness to change the traditional primary and still only requirements campaigning for two rounds of voting. Given the decline in one of the two major political parties voters registration, and the introduction of third alternatives by litigation, there is also some preference for two or multidimensional voting over the traditional zero-sum competition between the major political parties. The existence of two party competition may be diminishing in certain aspects, at the district level, yet it is also clear there is no voting agenda structure or limited number of preference combinations for attaining a consensus to replace either duopoly competition in single member districts, or a bipartisan voting agenda. There are some voters with preferences for third party alternatives, with these alternatives as either a first or second choice. Even so, the 2010 California election results indicate these preferences are limited by the smaller number of candidates involved, the willingness for third party campaigns to pay for two rounds of voting, and the number of districts where a third alternative becomes a viable second choice. Instead of a preference for multidimensional voting, this suggests a preference for two-dimensional votes where a third alternative becomes the second alternative, generally in one-party districts, where the other major political party fails to contest for election. The fact that these third alternatives are generally the third choice implies these are irrelevant alternatives in terms of constructing a statewide majority. By attaining first choice status among only a few voters, and viability as a second choice with only a few candidates, the effect of third alternatives involves only a few district elections in each campaign, implying the viable contestations, and therefore relevant electoral comparisons involve single dimensional-two party competition. A Generalized Primary Election Voting Mechanism The formal results describe the theoretical importance of the new redistricting and primary procedure. The bipartisan commitment to a new, single-member district plan and the implementation of a top two vote getting, plurality rule voting procedures result in a mixture of two rounds of voting. In this mixture, there is a traditional primary and general election structure that remains the same, two-stage one-party runoff elections, and third alternatives which are some substitutes in the general election for one of the two major political parties nominees. Generally speaking, the adoption of these new procedures for district planning and voting agenda design, changed the two rounds of voting, tournament structure, of primaries and general elections with candidate entry and exit strategies, partisan contestation decisions, and zero-sum two-party competition on a single dimension between the major political parties. 13
15 Definition 1 N a finite integer set of voters, N = {1,..., n}. Definition 2 Given N, the voter s preferences = {U 1, U 2,..., U i,..., U n} = U(N) set or distribution of voter s preferences. Definition 3 U n = U U... U... U product space. Definition 4 U U... U... U number of voter preference combinations. Definition 5 P(N) (finite) integer partition set of potential coalitions. Definition 6 (N) group decision space. Definition 7 vote space = { 1, 2,..., i,..., n} = n. Definition 8 simple majority rule (SMR) M = N/ Definition 9 simple majority decision, method of majority decision, SMR > ½ U. Definition 10 simple majority voting procedure, (M; 1, 2,..., i,..., n). Definition 11 2 M - 1 simple majority (rule) voting game. Definition 12 voting procedure {voting rule; finite integer set of votes} = (voting rule; 1, 2,..., i,..., n) = (threshold; distribution of votes).. Definition 13 U n = U U... U... U D(N) decision space and profile. Definition 14 D(N) = ( U n) decision structure and filter. Definition 15 ( U n) = {D(N); 1, 2,..., i,..., n} agenda design. Definition 16 ( U n) = { 1, 2,..., i,..., n} voting agenda. Definition 17 ( U n) = { ; 1, 2,..., i,..., n} voting on a set of alternatives, agenda sequence. Definition 18 ( U n) = {J; 1, 2,..., i,..., n} agenda structure, jurisdictional extension and implementation authority. Definition 19 ( U n) = {D( ); 1, 2,..., i,..., n} delegated authority, local. Definition 20 (N 0) minor group, minor political party, such as a third party alternative, controls a minor share of votes or seats contesting for viability, and therefore minor party status. Definition 21 (N 1) major group, major political party, contesting for majority party status. Definition 22 (N 1) (N 0) = { } Hausdorff condition. Definition 23 { ; (N 1), (N 0)} set of political alternatives, e.g., state party competition, two party competition, a multiparty contestation, numbers of candidates, number of political parties. Definition 24 ( U n) = { ; i = 1, 2,..., i} voting agenda, range and density solution. Definition 25 ( U n) = { ( ); i = 1, 2,..., i} agenda design, range and density solution. Definition 26 (U U... U... U) = D decision or preference profile mapping. Definition 27 (M; 1, 2,..., i,..., n) = n vote and decision space. Definition 28 ( ; 1, 2,..., i,..., n) = U n voter preferences & decision space. Definition 29 (J; P(N) = (N 1), (N 0)) = U n polling data, ordinal voter s preference. Definition 30 (J; P(N) = (N 1), (N 0)) = n election returns in vote shares. Definition 31 simple game [P(N) = < (N 1), (N 0) >] = 0 or 1; (N) = 0 or 1. Definition 32 majority voting game = 0 or 1. n 14
16 Conjecture 1 Proposition 1 Conjecture 2 Proposition 2 Proposition 3 Theorem 1 Theorem 2 Lemma 1 Lemma 2 Lemma 3 Lemma 4 Conjecture 3 Any change in the number of candidates and voting agenda represents a change in the number of alternatives deliberated for nomination and election. A bipartisan voting agenda reduces the number of candidates to two alternatives by requiring plurality rule in the first, of two rounds of voting, consisting of nominating the top two candidates in a nonpartisan primary. The larger the number of candidates the more complicated the voting agenda. Duopoly control of the voting agenda limits consideration to the two major partisan alternatives. The partisan alternatives relevant to the construction of voter preferences define major party status. (Third-Party) Minor party status satisfies the condition of independence of irrelevant alternatives (IIA). Proof. An alternative is irrelevant if the alternative may be introduced or eliminated from consideration without changing the selection from amongst the choice set of alternatives ( C x.). The selection is therefore independent of the irrelevant alternatives (IIA). Assume vote preferences for a third alternative is D: D R T and R: R D T. If T is either introduced or eliminated, the third (T) alternative makes no difference in the general comparison and therefore selection of D or R. As a result, inclusion of a third alternative is not relevant for voter preferences between the major political parties. (Contestation) Contestation decisions by minor partisan candidates are irrelevant to the outcome of any voting agenda. Proof. Define a voting agenda as a tree diagram for the purposes of deliberating and then comparing alternatives with formal votes. A group decision to select an alternative is limited to the relevant alternatives. An irrelevant alternative may be introduced or eliminated from consideration without changing the selection from amongst the choice set of alternatives. Given a choice between only two political parties, there are no third partisan alternatives. Assume a third alternative exists through contestation decisions. Given the major political parties are preferred to the minor political parties, but the minor partisan alternatives are IIA. Assuming the IIA condition, the minor political parties are irrelevant to any outcome of a voting agenda for comparing the major partisan alternatives. Two party competition zero-sum. Zero-sum (partisan) competition simple (voting) game. Majority rule voting game (PMR) simple game two alternatives. Two alternatives SMR. (Schlesinger) Two-party competition exists (e.g., in voter registration concentration and electoral vote shares). 15
17 Theorem 3 Theorem 4 Theorem 5 Theorem 6 Theorem 7 (State Competition) Two-party competition is zero-sum amongst the set of alternatives with major party status. Proof. Two-party competition only two relevant alternatives. Duopoly competitions between two alternatives majority rule voting game. Majority rule voting game simple game [0,1]. Simple game [0,1] zero-sum competition. (Duopoly Competition) Two-party competition is a majority rule voting game in best reply correspondences. Proof. Assuming major party status: two-party competition is equal to a negative one correlation in vote shares. Partisan zero-sum competition is equal to a simple game. (Zero-sum hypothesis) Partisan zero-sum competition is a simple game. Proof. Two-party competition exists in vote and seat shares. The exchange in vote and seat shares between political parties is a zero-sum competition. The best reply correspondence in this voting game is nonlinear in the votes and seats relationship. The vote-seat curve or ratio is determined by district plan and voting procedure. (Competition Hypothesis) Major party competition is single dimensional. Proof. Given only relevant alternatives, two-party competition is equal to a perfect negative correlation in vote or seat shares. The correlation dimension is equal to one. (SMR) Classification of simple majority rule results. two-party competition SMR zero-sum competition amongst two major political parties SMR majority rule voting game with two alternatives SMR two partisan competition on a single dimension SMR unidimensional competition with two alternatives SMR perfect competition in district elections SMR duopoly voting agenda SMR (model 1 shown in FIGURE 1.1) a traditional primary with two rounds of voting, the first round selecting an alternative in each major party by plurality rule, the pairing of the top vote getters in the second round for general election SMR (model 2, FIGURE 1.2) two rounds of voting, nominating the top two vote getters in the first round, and a pairing of the top two (plurality winning, but yet primary alternatives with major status) for general election SMR (model 3, FIGURE 1.3) monopoly voting agenda, a large number of candidates within one-party reduced to two alternatives in the first round of voting, and a pairing of the top two vote getters in a second, runoff for general election SMR 16
18 Theorem 8 Assumption 1 Assumption 2 Theorem 9 (model 4, FIGURE 1.4) binomial grid search and choice through a voting agenda consisting of three rounds of voting, beginning with a reduction from large number of candidates and political parties, a second round to reduce the number of alternatives to only two with comparisons in the same political party, and a third round pairing the two winners nominated in the runoff for purposes of two-party competition and general election SMR duopoly competition two alternatives SMR Classification of single dimensional results two party competition in vote and seat shares single dimensional the vote or seat share measure space for two major political parties single dimensional the outcomes for two rounds of duopoly voting agenda single dimensional a duopoly partisan correspondence in the form of a vote-seat curve or ratio single dimensional competition in a vote space with two major parties or primary partisan alternatives single dimensional Single dimensional (outcomes) measure space Single dimensional voting space, (either the alternatives on the voting agenda or contained in the choice set equal to major partisan outcomes) (State party competition) State party competition index single dimensional measure space Conditionality. Assumption 1 in vote or seat concentration ratios or shares. Model averaging may be used to construct a single dimensional index. Evidence (see also Theorem 9). Major political parties single dimensional competition Major political parties two party competition two party competition single dimensional set of outcomes voting space with a small number of relevant alternatives number of combinations in the set of outcomes two party competition zero-sum state party competition for majority status simple voting game two alternatives voting space (with a small number of alternatives) number of combinations in the set outcomes single dimensional 17
19 Theorem 10 Condition 1 Condition 2 Condition 3 Condition 4 Condition 5 Condition 6 Condition 7 Condition 8 Condition 9 Lemma 5 Theorem 11 Theorem 12 Theorem 13 Theorem 14 (Existence Hypothesis) Two-party competition exists. Proof. Conjecture 3. Given a measure space equal to zero a Banach Space a fixed point exists: (Condition 1) equal to perfect competition; (Condition 2) equal to an even division in vote shares or concentration ratios; (Condition 3) in best reply correspondence in a votes-seats curve or relationship; (Condition 4) in majority party status, in legislative seat shares; (Condition 5) in equal proportionate time of partisan control of majority status; (Condition 6) equal to perfect duopoly competition; (Conditions 7 & 8) equal to competition between two alternatives on a single dimension or a single factor index reducible from multiple dimensions; (Condition 9) equal to spatial competition in location and distance; (Condition 10) equal in range and division to the intersection of spatial competition; (Condition 11) on bipartisan voting agendas. Assembly Districts Senatorial Districts Assembly Districts Congressional Districts Senatorial Districts Congressional Districts Assembly District County Senatorial District County Congressional District County min county lines Assembly Districts County Jurisdiction(s) Senatorial Districts County Jurisdiction A boundary function partitions the space into separable, interior and exterior, and a continuous boundary line Jordan curve. Proof. Areal(Interior Boundary External). Boundary area ( ) Banach Space, measure zero ( ). Area of the intersection closed border ( ) open frontier ( ). Any partition of a space into an interior and exterior ( ), range and division Jordan curve. (District Planning) State partisan competition is zero-sum in the measure space. Proof. Theorem 9. Assume a range of competition in district elections. Construct vote share measures for each district election. Competition between the major political parties is zero sum by district. District planning and partisan contestation guarantees the existence of (at least) two party competition. Two party competition in district elections guarantees the existence of state partisan competition. (District representation theorem) Perfect, Bertrand, duopoly competition in district elections guarantees the existence of two alternatives under an SMD plan. 18
20 Theorem 15 Theorem 16 (Competitive equilibrium) Duopoly partisan contestations and competitions are necessary to attain the conditions for a perfectly competitive, two-party, equilibrium. Conditional Proof. A bipartisan equilibrium exists in a negotiated cooperate game. Assuming a non cooperative game, contestation between only two partisan alternatives duopoly competitions on a voting agenda a bipartisan voting agenda contestation between major partisan alternatives, with minor alternatives satisfying the IIA condition voluntary entry and exit decisions that generate zero sum competition entry barriers to maintain two alternatives (traditional primary) two rounds of voting, with the primary vote reducing a large number of alternatives to two by nomination and then general election a voting agenda consisting of implementing a plurality (voting) rule in the first round, and simple majority rule in the second round of voting (Schumpertarian equilibrium) Duopoly partisan competitions are evolutionary stable strategies (ESS). Proof. Assume the independence of irrelevant partisan alternatives (IIA condition) is sustainable third party alternatives remain minor political parties, independent candidates remain independent, a major partisan contestations remain viable. ESS 2 alternatives. But ESS 1 dominant party and effectively 1.5 political party competition. Two competitive equilibriums emerge: m < 1.38 and m > Define this as a Schumpetarian equilibrium, with m and m. Define a Hausdorff number, dimension, with ESS ranging from one party to strong dominant majority party status. Define a Nakamura number, consisting of a range of competition from weak dominant majority party status toward two party competition. Schumpterian competition coalition adjustment (m), 1 (m) (m) 2. 19
21 Theorem 17 Theorem 18 (Dimensionality) The number of dimensions is reducible in the number of partisan alternatives. Proof. Set the number of dimensions at two or more. For the major partisan alternatives, the concentration ratio in vote shares is single dimensional. Any addition in numbers of partisan alternatives, such as by adding a third party, increases the number of dimensions the correlation dimension and therefore in the number of factor dimensions. Assume a single third party is introduced as an additional, third partisan alternative. This increases the number of dimensions, from one to two, increasing the dimensionality of voting from single dimensional competition to twodimensional votes. The competitors are asymmetric, given the third party is generally an irrelevant alternative, such that the third alternative is not viable as a first choice. The third party introduces another dimension to voting, with entry in some of the district elections, including one-party districts with entry of only one of the major political parties. In these districts the third party is second choice. In all the districts, the third party is the least preferred, but a variance in the third-party vote shares generates a second factor in the comparison among the candidates. (Dimensionality) The number of dimensions is reducible in the number of political parties. Proof. As the number of political parties increases, the number of dimensions in the vote space increases. As the number of political parties increases, the number of combinations of outcomes also increases, such that the number of combinations of outcomes for voters to deliberate increases in the number of partitions of the outcomes. Given the dimensionality of the vote space determines the number of outcomes; any increase or decrease in the number of political parties determines the number of dimensions in the measure space. 20
22 Theorem 19 Theorem 20 Theorem 21 Theorem 22 (Dimensionality) The number of dimensions is reducible in the equilibrium number of political parties. Proof. Assume a range in the equilibrium number of political parties, consisting of a finite integer set = {1, 2, 3,..., p}. If the ESS = 2, then number of dimensions = 1, with zero-sum competition. If the ESS 2, assume a one-party district, D or R only. In those districts, in the absence of some third alternatives, there are no second choice, and the number of dimensions reduces to a single fixed point a measure space equal to zero in noncompetitive districts. If the ESS 2, assume multiparty competition, m {D, R, T,..., NPP}. Assume the third political parties are the third most preferred alternatives in voters preferences, and second choice, in one-party districts. Given sustainable IIA, the number of dimensions is fewer than the number of third parties; no more than a single composite second dimension for all of the third-party alternatives shares combined; reducible to two for minor political parties contesting as the second choice in a small number of districts; reducible to a single dimension with minor political parties. (Condorcet voting cycle) The existence of third-party candidates or partisan alternatives introduces the potential for a voting cycle in comparisons of three or more alternatives. Proof. Given two major political parties, the minor political parties are third alternatives. Assume other alternatives are relevant alternatives in contestation decisions, and competition with two primary alternatives. The probability of voting cycles is nonzero in comparisons of three or more other alternatives. Comment. Assuming an unrestricted domain condition any of the logically possible combinations of the three alternatives are possible as outcomes in terms of either voter preferences or agenda design. In the districts with a viable third party, this introduces the possibility of a voting cycle covering two primary alternatives. With any introduction of a third alternative, no unique PMR winning alternative exists. Triopoly competition s SMR. Political parties can be classified into two groups, major and minor political parties. The evolutionary stable strategy (ESS) in primary and general election, voting agendas is contained in a Banach Space, with measure zero. Evidence. partisan and nonpartisan voter registration. primary contestation, numbers of candidates entry-exit decisions. general election competition, margins in vote shares. equilibrium numbers of political parties. 21
23 Theorem 23 (Two-party competition theorem, competitive equilibrium) The Nash Equilibrium is one candidate from each of the major political parties. Proof. The extensive form is shown in FIGURE 2.0. A partisan contestation in a traditional primary generates a voting agenda, in extensive form, shown in FIGURE 2.0. Lemmas 1 through 4. The normal forms are of the primary and general election competition. R D DR competition RD competition ,1 1,0 2 0,1 1,1 Strategy R: 1 R: 2 D: 1 D: R D DR competition RD competition ,1 0,1 2 1,0 1,1 Strategy R: 1 R: 2 D: 1 D:
24 R D DR competition RD competition ,1 1,1 2 1,1 1,0 Strategy R: 1 R: 2 D: 1 D: R D DR competition RD competition ,0 1,1 2 1,1 0,1 Strategy R: 1 R: 2 D: 1 D:
25 Theorem 24 (California Primary theorem) The Nash Equilibrium is two candidates or alternatives. Proof. Extensive form, shown in FIGURE 2.0. D R ,1 2,0 2 0,2 1,1 Strategy R: 1 R: 2 D: 1 D: D R ,1 0,2 2 2,0 1,1 Strategy R: 1 R: 2 D: 1 D: D R ,2 1,1 2 1,1 2,0 Strategy R: 1 R: 2 D: 1 D: D R ,0 1,1 2 1,1 0,2 Strategy R: 1 R: 2 D: 1 D:
26 Theorem 25 (Partisan Contestation theorem, traditional primary equilibrium) The Nash Equilibrium is in partisan contestation decisions and duopoly competitions. Proof. Extensive form, shown in FIGURE 2.0. D R ,0 1,0 1 0,1 1,1 Strategy R: 1 R: 2 D: 1 D: Theorem 26 Partisan contestation simple game zero-sum competition. Proof. Theorem 23. Assume two party competition, with the possibility of a third alternative. In district elections, both major political parties may contest for election, one of the two political parties, or neither of the two major political parties. If both political fail to field a candidate, both major political parties lose the seat and position. If both contest for election, both win nominations to stand for general election. In one-party districts, the seat or position is uncontested. Assuming at least one of the major political parties contests for election, this is a simple game, generating zero sum competition between two political parties competing for majority status. 25
27 Theorem 27 (Partisan Contestation theorem, runoff election equilibrium) The Nash Equilibrium is in primary competition and runoff elections. Proof. Extensive form, shown in FIGURE 2.0. D R ,0 2,0 1 0,2 1,1 Strategy R: 1 R: 2 D: 1 D: Proposition 4 Theorem 28 Theorem 29 Lemma 6 Nonpartisan alternatives represent a third alternative, in comparison to the two major political parties as primary partisan alternatives. Nonpartisan alternatives generate two-dimensional competition. Proof. Nonpartisan alternatives compete against the two major partisan alternatives, which are also in competition with each other. The relevant comparisons on the voting agenda are D and R vs NPP, and D vs R. The correlation dimension represents a two dimensional voting space, assuming bipartisan contestation and D: D NPP R and R: R NPP D, and the candidates with no partisan preference are the second choice in one-party districts. The existence of two party competition is consistent with SMR. Conditional Proof. the existence of two party competition generates two alternatives. two party competitions produce one or two partisan alternatives. partisan contestations in district elections generate state party competition for majority status. only two partisan alternatives are viable exceed thresholds established by voting procedures. duopoly competitions generate zero to two partisan alternatives, with the ESS equal to two partisan alternatives competing on a single dimension. third alternatives satisfy the IIA condition. nonpartisan alternatives satisfy the IIA condition. If the vote space is IIA, the set of outcomes contains only relevant combinations in the choice set. 26
28 Theorem 30 Theorem 31 Theorem 32 Proposition 5 (Structure-induced equilibrium) SIE classification of results. bipartisan control of voting agendas two alternatives SMR. introduction of a third party alternative: duopoly competitions two major party alternatives and one minor party alternative. duopoly competitions ESS = at least one candidate and two partisan alternatives. triopoly competition ESS = at least two candidates and three political parties. stochastic dueling with two alternatives two candidates and two political parties. stochastic truelling at least three alternatives nonzero probability of a voting cycle among the three alternatives. voting agenda set of (electoral) outcomes. single member district plan voting procedure two alternatives. district elections two alternatives. voting procedure (plurality rule in two partisan primaries), top vote getter at least one candidate and two political parties. voting procedure (plurality rule in a primary), top two vote getters two candidates and one political party. voting procedure (plurality rule in the primary election), top two vote getters two candidates and three (or more) political parties. (Primary Election theorem) Given a set of viable alternatives, a primary election filters the set of outcomes in two rounds of voting. Proof. Define a traditional primary system as consisting of a primary election, for the purposes of nominating candidates from the set of those contesting for election. Nonpartisan primaries may select the top two candidates, for the purposes of general election to a single seat or position. Partisan primaries nominate one candidate for each major political party, for the purposes of general election. Assuming a large number of candidates in either a(n) (open) primary or (closed partisan) primaries, two rounds of voting reduce the number of alternatives to two. (Tournament Structure theorem) Given a large number of alternatives, two primary elections are required to filter the set of outcomes. Proof. Given a binomial grid search and choice, such as demonstrated in FIGURE 1.4, and three or more candidates. The voting agenda consists of a first round, for nominating the top vote getting candidates, a second round pairing of two alternatives in the same political parties, and a third round pairing two alternatives in different political parties. The first round is considered a traditional primary, the second a runoff election, and the third a general election. The voting agenda contains three rounds of voting. (Agenda Design) Regular elections consisting of two rounds of voting are preferred to three or more rounds of voting. 27
29 Theorem 33 Theorem 34 Theorem 35 Theorem 36 The ESS is too reduce the number of dimensions in two rounds of voting. Proof. Assume the ESS is two rounds of voting, on a voting agenda or calender schedule consisting of a primary and general election. The first round of voting is a group decision to nominate or select a candidate. The second round of voting is a group decision to establish majority party status. Introducing a third alternative generates two dimensional state party competition. A two-dimensional vote space is reducible to a single dimension of combinations or outcomes, given a partitioning of the alternatives in groups or clusters defined as major and minor party alternatives or dimensions in competition. The groups satisfy the condition of independence of irrelevant alternatives, such that irrelevant alternatives are not contained in the combinations of choice. By separating groups into minor and major party dimensions, competition is single dimensional between two contesting alternatives. A partisan contestation on major and minor party dimensions implies multiparty zerosum competition amongst a large number of candidates, with only major partisan alternatives competing of majority party status, and therefore relevant for two parties, states competition. The ESS may sustain a number of alternatives less than or equal to two, with convergence to fewer than two candidates per-primary and general election (i.e., uncontested elections), uncontested reelection, single-party control inclusive of a large number of candidates contesting for nomination and a runoff primary for the purposes of election in a one-party district, and multiparty contestation amongst a small number of candidates for nomination, and therefore effectively fewer than two political parties competing for majority status. (Schattschneider) Introducing more than two alternatives forms a multidimensional voting space. Proof. The existence of two party competition is single dimensional. The introduction of third alternative produces two-dimensional votes. Primary elections filter the number of alternatives to be considered and deliberated for purposes of nomination and general election. Proof. Theorems 29 through 32, and Proposition 4. Primary elections filter the number of candidates to be considered and deliberated for purposes of nomination and general election. Proof. Setting the number of candidates equal to the number of alternatives, the size, large or small, determines the number of rounds of voting. The voting agenda may range from one to three rounds of voting based on the size of the number of candidates. The number partisan candidates are equal to the range of partisan contestation for nomination and general election. 28
30 Lemma 7 Theorem 37 Theorem 38 Theorem 39 Theorem 40 Theorem 41 Theorem 42 (Linear Vote Space) A near-linearly correlated, dimension is a dependent subset of alternatives, and whenever contained on an agenda generates the number of combinations in a set of outcomes. Primary elections filter the number of political parties to be considered and deliberated for purposes of nominating and generally electing a majority. Proof. Setting the number of political parties equal to the number of partisan alternatives, the alternatives are distinguishable by the IIA (independence of irrelevant alternatives) into binary classifications of major and minor political parties. The number of political parties determines the number of viable candidates, contesting for nomination and general election to office, by seat or position. The IIA establishes a condition for comparing a set of alternatives, with combinations of voter preferences, to a set of outcomes in a voting space. Where a group decides majority party status, some alternatives are not relevant for forming a voting majority, such as minor 1) third-party alternatives 2) independent candidates and 3) nonpartisan ballots or fusion tickets. Evidence. major political parties = two alternatives SMR. minor political parties = third alternatives third choice, if the third alternative is IIA choice is among the major political parties majority status choice between two alternatives SMR. minor political parties = third alternatives second or third choice, if these alternatives are IIA choice between one and two alternatives SMR. minor political parties = third alternatives second choice substitute for one of the two major political parties choice between two alternatives SMR. The Primary choice set is equal to the number of candidate entry and exit decisions and the number of political parties. The dimensionality of the choice set is equal to number of (partisan and nonpartisan) alternatives contesting for nomination. The ESS in the primary vote mechanism is two alternatives contesting for nomination and single dimensional competition. The primary choice set equals Duverger s Law. Proof. Given a new redistricting process, new single member districts, and two rounds of voting. The evidence demonstrates a primary vote mechanism generating two alternatives from four candidates based on plurality rule. Primary contestation decisions generate two-dimensional competition within a finite integer range of candidates and political parties. 29
31 Lemma 8 Theorem 43 Theorem 44 Lemma 9 Theorem 45 Theorem 46 The number of combinations generated is determined by a finite integer set of candidates and political parties. A partition of a finite integer range of candidates and political parties generates the number of dimensions in partisan competition. Primary elections filter the dimensionality of the set of outcomes to be considered and deliberated for purposes of nominating and generally electing a majority. Proof. Two party competition hypothesis two partisan alternatives contesting for nominating and general election SMR majority rule voting game simple game. Zero-sum competition hypothesis convergence to two partisan alternatives. Evidence (see also Theorem 9). Major political parties single dimensional competition. Major political parties two party competition. two party competition single dimensional set of outcomes. voting space with a small number of relevant alternatives number of combinations in the set of outcomes. two party competition zero-sum state party competition for majority status simple voting game two alternatives voting space (with a small number of alternatives) number of combinations in the set of outcomes single dimensional. (Agenda Design) structure of voting agendas determines the number of outcomes. Proof. Voting agendas tree diagram. Voting agendas Decision space. Groupings of major and minor political alternatives to be deliberated and considered. Partitioning the decision space structure a set of group decisions. Measure space is single dimensional in the number of combinations. (Agenda Design) structure of primary nomination and general election filters. Proof. Voting agenda two rounds of voting, in sequences of nominating and electing candidates for seats or positions. (Agenda Design) two rounds of voting require plurality rule, first-past-thepost, or top vote getter to determine nomination of candidates for general election. Proof. Two primaries filter a large number of candidates to two alternatives. 30
32 Theorem 47 Theorem 48 Definition 33 Definition 34 Definition 35 Definition 36 Definition 37 Definition 38 Definition 39 Theorem 49 Theorem 50 Theorem 51 Theorem 52 Theorem 53 Theorem 54 (Agenda Design) four types of voting agendas in two rounds of voting, with plurality rule, top vote getting thresholds, as the voting procedures for nominating and electing candidates. Proof. Agenda sequences consisting of a partisan primary and general election, partisan primary and runoff election, nonpartisan primary and general election, nonpartisan primary and partisan or runoff election. Partisan convention nomination of candidates and then general election on nonpartisan ballots is not a primary and general election sequence. A voting agenda and procedure filter the set of alternatives. Proof. A given agenda design filter. Number of rounds of sequential voting Tournament Structure or Filter. Filter Decision Space tree diagram time line agenda sequence or calender schedule of decisions string of information. Sequential votes are neither staggered, nor proportionate in time, nor repeating, in round robin format. Agenda sequences are in acyclic paths reducing the number of alternatives. Description. (Model 4, FIGURE 1.4) binomial grid search and choice through a voting agenda consisting of three rounds of voting, beginning with a reduction from large number of candidates and political parties, a second round to reduce the number of alternatives to only two with comparisons in the same political party, and a third round pairing the two winners nominated in the runoff for purposes of two-party competition duopoly contestation and (competitive) general election SMR. x set of alternatives, major and minor elements. x X a set of alternatives in a vote or policy space. x < X \ {x} > binary relation quotient space an agenda design proposals in a coordinate or measure space. x (X) elements in a group decision space. x (X) number of combinations in a set of outcomes. x C(X) selections in a choice set. < 1 2 > = -1 zero-sum competition in a correlation dimension The independence of irrelevant alternatives is a set of alternatives such that for each x, x X. The independence of irrelevant alternatives is a set of alternatives such that for each x, x < X \ {x} >. The independence of irrelevant alternatives is a set of alternatives such that for each x, x (X). The independence of irrelevant alternatives is a set of alternatives such that for each x, x (X). The independence of irrelevant alternatives is a set of alternatives such that for each x, x C (X). The independence of irrelevant alternatives is a set of alternatives such that for each x, < > =
33 Theorem 55 (Reducibility theorem) The evolutionary stable strategy (ESS) is too reduce the number of alternatives into two groups, in two rounds of voting. Evidence. contestation decisions by introducing alternatives. the set of partisan alternatives contesting for primary nomination and general election. partisan and nonpartisan contestation decisions. the number of candidates, large or small. reducibility of the number of candidates in two rounds of voting. reducing the number of candidates for nomination in a primary and runoff election. reducing the number of partisan candidates to two, by nominating two major party candidates. general election balloting on two alternatives. extending and implementing a voting procedure. voting rules with a threshold requirement in vote shares to attain endorsement or nomination and election. plurality rule voting, for the top vote getter, top two vote getters simple majority rule voting for pure majority rule winning alternatives. the number of rounds of voting, one, two, or three. district planning, new districts designed from redistricting, single or multi-member district elections. major or minor partisan alternatives, multi or third party alternatives, independent candidates, and cross filing to attain no partisan designation for general election (D and R in the Primary, N in the General Election), a fusion ticket, slate, or ballot consisting of partisan, bipartisan, multiparty, or no partisan designation. group decision to endorse or nominate and elect candidates in two rounds of voting. number of political parties. number of dimensions in the vote or decision space. number of voter preference combinations for the set of alternatives. number of dimensions in partisan competition. degree of complexity of the voting agenda, agenda design. number of rounds of voting whenever a voter preference majority for a candidate or political party exists. uncontested elections, term limitations, incumbency reelection. team component, nominate the top two. runoff election, same two. only two alternatives, two rounds of voting. 32
34 Empirical Analysis of Partisan Contestation in Campaign 2010 What is the result of the new voting procedure, under the new districts enacted for the 2010 California Primary and General Election? In terms of partisan contestation, the two major political parties, the State Democrat and Republican Party s were the first choice, the first and second choice, and both choices in the aftermath of the Primary. Under the new district plan, the most frequent outcome was to have nominated a Democrat and Republican candidate, with a greater number of votes having been cast for the Democrat candidate. In the 153 Assembly, Senatorial, and Congressional seats up for election in Campaign 2010, a DR outcome occurred in 81 of these districts. These DR outcomes represent the modal outcome after redistricting. In terms of partisan contestation, the findings reported in GRAPH 1.1, demonstrated electoral outcomes consisting of DR > RD > DD > RR as a result of the new districts and voting procedure. As shown in the table below GRAPH 1.1, approximately three-quarters, or 75.8%, of the voting outcomes were the same as though a regular primary and general election had been held. In these districts, both a Democrat and Republican candidates were nominated, and then proceeded to campaign for general election to these legislative positions. In the other quarter of these legislative districts, either two Democrats or two Republicans were nominated. Instead of a general election, a runoff election was held between the two candidates in the same political party, for the purposes of election to office. After the redistricting process, this results indicate the new districts and voting procedure generated oneparty districts. Like one-party districts in other states, the two rounds of voting proceeded with a primary and then runoff election between the candidates in the same political party. The one-party districts clearly diverge from a traditional primary and general election. Generally speaking, after a redistricting, the expectation is that there are a greater proportion of districts with only one political party contesting for election. In some instances, the explanations involve incumbency reelection, so that a partisan contestation by the opposition political party may be made more expensive and complicated in new districts. However, under this voting procedure, there were two major candidates contesting for election, guaranteeing a greater level of contestation in the general election. In the absence of the new voting procedure, there may been an even number of districts, than eight, with uncontested primary and general elections. In GRAPH 1.1 (and Appendix I), the analysis of variance among these outcomes produces a measure space that included uncontested elections in the same category as those with two candidates from the same political party. Since there were only 8 instances, of Democrats running uncontested for election, this analysis combines the districts with a DD or D outcome in the same category to test the models and theory presented in this study. There were no instances of an uncontested Republican, nomination and election, producing three outcomes different from a traditional primary: D, DD, & RR consisting of 8, 20, and 9 districts. As a proportion of the voting outcomes, these outcomes represent the more controversial changes for district elections. However these instances are interpreted, they would not be possible under a traditional primary and general election. Even so, the trends in voter registration and likely effects of redistricting on outcomes imply that there would have been an increase in the number of one-party districts, and uncontested elections. Under the new districts and voting procedure, there were somewhat competitive intra-party campaigns in 29 of these 37 one-party districts. 33
35 Inasmuch partisan contestations increased, after redistricting into a greater proportion of one-party districts, the new voting procedure made some difference in candidate entry decisions and the number of partisan alternatives. In analysis, not fully reported here, the number of candidates ranged from 1 to 13 candidates, with an average range between 1 to 6 and a median of 3 candidates contesting for nomination. According to simulation results, the distribution of the number of candidates, across the 153 legislative districts, is similar, but not approximately equal to a chi-square distribution with three degrees of freedom, and a Pareto distribution with skewness equal to 3.6 and minimum value too at least one candidate. The impact of introducing additional alternatives is described in GRAPH 1.2. In this comparison, there is no distinction between DR and RD, because this categorization depends on analysis of election returns to determine numbers of votes and vote shares or concentration ratios. Instead, this finding describes pairings of Democrat and Republican candidates nominated and then contesting for general election as if a traditional primary had been held. This outcome represents 112 of the 153 districts being elected, or 73.2% of these newly designed legislative districts. The number of one-party elections after redistricting is a little less straightforward since these districts now represent a range of partisan contestations, from uncontested election, two candidates nominated for a runoff election, and a nonpartisan alternative as the second choice for election, instead of the other major party s candidate. More generally, the results in GRAPH 1.2 indicate the irrelevance of third party and nonpartisan alternatives. Specifically, in only a very few districts were third political party candidates viable, and these campaigns can best be described as situations where the second major party did not contest the election. Based on voter registration data, the new districts suggest these are generally one-party districts, or districts, with a relatively small base of votes for the second major party. Under the traditional primary, it is likely that both political parties would have nominated candidates, and the weaker of the two major political parties, would be expected to lose the general election by a large margin. How important is it to have the second political party contest, in legislative districts where candidates are likely to attain less than one third of the vote? Under the new voting procedure, having the top two vote getters nominated produce two candidates in one-party districts. What types of voting outcomes are likely to occur, in these oneparty districts? As reported in the table below GRAPH 1.2, some of the one-party districts were uncontested, but either another challenger from the same political party, or a nonpartisan alternative provided a second choice to the major political party in these otherwise noncompetitive districts. Given the chances of a second candidate, from the same political party, winning election, this is likely to provide a more even division of the votes, in the runoff election, than a general election contest against a weak major political party s candidate. Because all of the incumbents won renomination the new districts and voting procedure resulted in all of the incumbents that ran for reelection, finishing amongst the top two vote getters in the primary. Since none of the nonpartisan, no party preference, or third party candidates won election, only D and R candidates were relevant alternatives. When either D or R did not finish in the top two, or there was a one-party district, the second choice was an NPP candidate and not a third party alternative. 34
36 The findings, so far, indicate the strength of the two major political parties in contesting for nomination and election. Of the two political parties, the Democrat Party won more districts, and fielded more candidates. However, the districts with RD or RR outcomes, fielded more candidates, had some nonpartisan opposition, and produced more votes cast. In both the RD and RR districts, the average margin of victory, in vote shares, was significantly less than districts with a DR outcome. In summary, the Republican districts were more competitive under the new district plan, and the voting procedure had little impact on the outcomes in the Republican districts, with the exception that this may have produced a slightly greater division amongst two or three Republican candidates narrowing to two and then one, being elected, from a primary and a runoff instead of a general election. The Democrats districts had less partisan contestation, but there were more districts with a Republican opponent or a stronger primary challenger, forcing a runoff election, than there would have been with a traditional primary. The placement of Peace and Freedom, Democrat candidates on the general election ballot also created a second choice, in a few of the one-party districts that either were uncontested or had no Republican candidate. The first two findings, with regard to a partisan contestation in the primary election, describe the number of candidates and candidate entry decisions. The numbers of partisan alternatives produced by these contestation decisions vary most by the second choice: R, D, or NPP. The number of somewhat viable partisan alternatives ranged from one to five, with nonpartisan candidates a sixth alternative. The sets of partisan alternatives include D and R, the third political parties, the Libertarian Party (L) and Green Party (G), and the Peace and Freedom, Democrat, endorsement. Inasmuch the introduction of the third alternative makes a difference in partisan contestation and competition there is some evidence of two dimensional voting in a few districts with a third party or nonpartisan alternative as the second choice. In most of the districts, however, the important contestation decisions were from the State Democrat and Republican Parties, and not from the introduction of a third alternative. The noncompetitiveness of the third parties will be indicated later, in terms of vote shares, and the viability of the political parties attaining threshold percentages, such as five percent of the vote. Even in the districts with somewhat viable third parties, these candidates may not have been relevant to the voting outcome, at least in terms of generating a voting cycle among the three partisan alternatives. Given the small number of state political parties potentially able to contest for major party status, the three third parties remained in a group of minor political parties, at least until after the 2010 Election. By district, there was a range, from one to five, in the number of political parties contesting for election. There was only one Congressional District, of the fifty-three, that had all five of the major and minor political parties contesting for the seat or position in the California delegation. The modal category, in 101 of the 153 contests, is two partisan alternatives. As an outcome, this occurred even though there were no limits on the number of political parties. The new voting procedure pertains to the top two vote getters, yet any of political parties or the nonpartisan alternative could have been selected as first or second choice. What is important is that the number of political parties are determinative of the number of dimensions voted on. In this setting, the number of political parties is effectively two, generating the set of outcomes observed in GRAPHS 1.1 &
37 The findings in GRAPH 1.3 indicate the tendency of partisan contestation decisions to generate two alternatives. This tendency occurred in two-thirds of the district elections. Even so, there were thirty-one districts, comprising approximately one-fifth of the district elections where a third alternative contested for nomination. These third alternatives did not qualify amongst the top two alternatives confirming these as minor partisan alternatives to those competing for major party status. Under the new districts and voting procedure, district elections were uncontested by the introduction of a nonpartisan alternative as the second choice, or only one candidate, generally an incumbent, contesting for (re)election. In those 17 districts, half the uncontested elections involved no second candidate (8, 1D), with the second choice in the other 9 districts a candidate with no partisan preference (NPP). Given this result, the effect of nonpartisan candidates on district elections was the most successful introduction of third alternatives to D and R partisan contestation decisions. However, these results also indicate NPP only as a second choice in the absence of an R or D partisan contestation. Because these candidates do not file petition signatures in both political parties since the 1958 Election, their nomination and potential election requires the new voting procedure for a nonpartisan primary, with the top two vote getters nominated to contest for general election. The obvious effect to change both the redistricting process and electoral institutions, in a bipartisan direction, implies a set of voting rules restoring previous California traditions in nonpartisanship. The use of a blanket primary, similar to those in four other states, including the nonpartisan Louisiana Primary, suggests how this intended to provide a nonpartisan primary and general election structure: something which is only possible by removing partisan designation from all the candidates. Another method for attaining a nonpartisan general election is to allow partisan, D or R, candidates to file petition signatures for nomination in both political parties. By cross filing, if the candidate wins both primaries, no partisan designation (an N) is listed on the general election ballot. In some instances, depending on which primary the candidate won the most votes, and had a partisan preference, the campaigns may be reported as R-D or D-R candidates, so that the party winning majority status included members nominated by both political parties: a fusion ticket. This latter system, which was in extensive use in California before the 1961 redistricting, maintained the major status of the R and D political parties. The designation of nonpartisan candidates for general election is not the same as a nonpartisan primary, with the potential for electing candidates with no party preference. In the 2010 campaign, the NPP designation was more frequently contesting Democrat candidates as the second choice. Unlike the previous nomination system that seemed to favor Republican candidates, this current situation seems to involve districts where the Republican Party would have contested under the previous voting procedure, but did not do so under the new rule because no candidate would have qualified among the top two vote getters. Instead, a third or second Republican candidates contested in safer districts, increasing primary competition in those districts, and therefore creating opportunities for a third alternative to contest for nomination in the one-party Democrats districts. The result of the new single member districts and voting procedure is still two party D & R competition, with the primary reducing the number of candidates to two alternatives, for the purposes of simple majority rule in the general election. 36
38 The tendency of single member districts, and in this case, new single member districts, to produce two political parties is demonstrated in GRAPH 1.3. In the 2010 Campaign, the new districts averaged 2.2 political parties, with a range from 1 to 3 political parties contesting for nomination. By averaging 2 political parties, and this constituting both the modal and median category in numbers of political parties, the tendency toward two party competition is verified by the results on the 2010 Primary. Whereas the new districts, and trends in partisan registration, may have been expected to produce fewer than two alternatives. These findings confirm partisan contestation decisions, reported in GRAPH 1.4 averaging four candidates per-district primary, ranging from two to six alternatives. Findings that demonstrate the new voting rule generated two alternatives. Not only were two alternatives the outcome of district elections, but there was more extensive primary competition, in terms of numbers of candidates and fewer one-party districts, or districts with uncontested elections. By supplementing two party competition, at a time of decline in one of the two major partisan alternatives, the new procedure produced more competitive general elections with a second alternative consisting of the strongest challenges from within the same political parties, a nonpartisan second alternative in the absence of R or D candidates, and in a few instances, third parties endorsement after the Primary. As a consequence, the new single member districts were consistent with two party competition, and there is some evidence the new districts increased state partisan competition in the primary and general election. In the presence of two party competition, the evidence also confirms partisan contestation decisions resulted in 1D and 1R candidate nominated in three quarters of the district elections. By generally reducing the number of alternatives to the same two political parties, the new districts and voting procedure made only minor differences in the district elections, providing for a third alternative as a second choice. Considering these second choices as also irrelevant alternatives, reduces the set of outcomes to four: DD, DR, RD, RR. Duverger s Law, in the case of California Primary, implies reducibility of a set of alternatives, including third parties and nonpartisan candidates, to two alternatives and four outcomes relevant for the combinations of voter preference and two party competition. The implications of partisan contestation decisions are several, with effects on the numbers of political parties and dimensionality of state partisan competition. In this case, partisan contestation decisions produced a large number candidates in some districts, and consistently produced four alternatives for nominating and two alternatives, usually one from each of the major political parties, for campaigning in the general election. Whereas candidate entry and exit decisions were influenced by new districts, and erosion of voter registration in both major political parties, the bipartisan redistricting and nonpartisan primary may have also increased the number of primary candidates and encouraged more primary competition, and therefore runoff elections, than would have been the case with a partisan district plan and a large number of uncontested districts. 37
39 The reducibility of the outcomes to two, and therefore four combinations is important, given any changes in the primaries requirements for nominating or endorsing candidates to qualify for election. Given the problems in maintaining two party competition, changes in partisan registration, candidate entry and exit decisions, redistricting processes, and new district boundaries imply fewer than two outcomes, with possibilities of mostly D and RD outcomes. When the numbers of alternatives are relevant, in terms of voter registration, partisan contestation decisions, and introducing viable third alternatives, voting and partisan competition is multidimensional and therefore generates a more complicated set of information requirements for voters to construct preference combinations. Once constructed, voter preference combinations that include third alternatives may be necessary for voters to participate in a primary election, where they will need to rank candidates in the same political, perhaps that they prefer, rank candidates in the other major party, that they do not prefer, and take into account the possibilities of third party or nonpartisan alternatives. Given the election returns, once these nominating elections are completed, the voters preferences require a comparison of two partisan alternatives from different political parties, the same political party, or a comparison of one of the major political parties candidates, a frontrunner, to either a nonpartisan candidate or an endorsed factional candidate contesting as a third alternative. Because the third alternatives were the second choice, the two rounds of voting still reduced the number of alternatives to two and then produced a simple majority rule winning alternative between the parties contesting for majority status. The effect of reducing the set of outcomes, to the four to six alternatives (= {D, DD, DR, RD, RR, R}) specified in FIGURE 1.2, explains substantial amounts of the variance in partisan contestation and competition in the 2010 California Primary and General Election. The analysis of variance explains outcomes in partisan contestation, frequencies, categories summarized in charts by (House, Senate, & Congressional) District, number of political parties, and numbers of candidates. Some of this ANOVA is reported throughout GRAPH 2 and TABLE 1, with graphs of the results in TABLE 1 presented in an appendix. Among the set of four electoral outcomes (={DD, DR, RD, RR}), there were some marginal differences in the numbers of votes cast in the primary election, with the most cast in the RD districts. New districts with more votes cast for Republican than Democrat candidates. Within each of the four outcomes, there was no significant difference in the numbers of votes cast, indicating the principal differences are for comparisons between these political parties and not among the candidates. The findings in GRAPH 2.1 also reveal significant differences in the number of votes in Assembly, Congressional, and Senatorial Districts. By explaining thirty six percent of the differences in the numbers of primary votes cast, the tabulated results describe some of the differences in the size of the electorates voting for House, Congressional Representative, and Senate candidates in new districts. With uncontested elections producing, by far, the least numbers of votes, the ANOVA votes cast by legislative district type finds substantial differences in the numbers of votes cast for candidates elected to serve in the same legislature. There is also some evidence, shown in GRAPH 2.2, of marginal differences in the number of candidates, contesting for nomination. The largest average number of candidates was in the districts with two Republican candidates finishing among the top two vote getters. The 38
40 significantly lower number of candidates in the RD districts, suggests there was primary competition between two Republican and one Democrat in these districts. In the safest Republican districts, in terms of partisan voter registration data, the large number of candidates also indicates primary competition among two or three Republican candidates for nomination, by placing in the top two. For the State Republican Party, in minority status in The Legislature, the new districts and voting procedure increased competition in the primary. It did not produce an increase, in the size of the Republican delegations, instead resulting in fewer than one third of the positions electing Republicans to Assembly and Senatorial Districts. By attaining veto proof ness, the California House and Senate Chambers became less competitive from the new districts and primary voting procedure, as a result in the decline of two party competition. The findings in GRAPH 2.2 are also generally revealing with regard to partisan contestation decisions. In the RR districts, there were more than four candidates contesting for nomination. By comparison, in the RD districts, the most two party competitive districts, the number of candidates averaged three candidates, one D and two R candidates contesting for nomination. Only the DR outcome had approximately four candidates, either three Democrats and one Republican, or two candidates from each political party contesting for nomination. In the DR districts the (fifteen percent) difference in vote shares between the leading Democrat candidate, and either another Democrat or a Republican indicated that these are not two party competitive districts. In the general election, Democrats won all of these elections, in the largest category of new districts. Democrats also competed for and won a small percentage of the RD districts with vote mobilization in the general election than far exceed a primary election turnout. Given the two party competitions for RD districts, it is likely that the new voting rule increased partisan contestations in the RR, DR, and DD districts, with more candidates entering because they have a chance to finish in the top two and therefore qualify for a position in the general election campaign. In the absence of this incentive, there would likely have been two or fewer candidates in the RR and DR districts, and more uncontested D districts given the trends in two party competition by districts and statewide partisan competition for legislative majority status. The findings in GRAPH 2.3 indicate significant differences in the number of political parties by outcome, implying some variance in the number of dimensions in partisan competition. As expected, the number of political parties is more than two in the RD and DR districts, the districts with the most two party competition. The marginal difference greater than two indicates some introduction of third alternatives, resulting in multiparty, two-dimensional partisan competition. The presence of third alternatives in the minority party-republican (RR) districts also indicate the contestation to substitute other, nonpartisan and third party, alternatives as the second choice in these Republican districts. Given the implosion of partisan registration, which took place in some of the safer Republican districts, which had incumbents, this may indicate some of the weakness of increasingly less than two party competition for majority status in The Legislature. These findings suggest the third alternatives were most active in the Republican districts (RD & RR), with more than four candidates and two political parties. The safe D, DD, districts had the fewest candidates and consistently a second Democrat nominee, a minor Republican Party candidate, or a third party as the second choice. Among the RR & RD districts, a set of minor third (Libertarian and Green) party and nonpartisan (NPP) candidates provided additional electoral challenges to Republican contesting in these new districts. 39
41 Empirical Analysis of Partisan Competition in Campaign 2010 Besides the dimensionality of competition generated by partisan contestation decisions, the other testable hypothesis in this model of voting involves the existence of two party competition. As demonstrated by the previous findings, partition contestations determines the number of alternatives, and this is generally reducible to two with a primary and general election system. In addition to determining the number of candidates, partisan contestations establish the information requirements for state partisan competition, for majority status. For voters, at least in a primary election, the number of preference combinations is greater than what remains as outcomes of a primary, for the purposes of generally electing candidates. The comparisons voters have to make vary, under different district boundaries and voting rules so that it is possible to generate different numbers of candidates, numbers of political parties, and therefore the dimensionality of competition. Since only relevant outcomes matter, in terms of constructing legislative majorities, the competition for major party status implies a reducibility of the number of viable, major and minor, alternatives to two or fewer alternatives. By doing so, this reduces competition to a single dimension, involving zero-sum competition between two alternatives, where state party competition constitutes a simple game, with majority rule winners and losers in pursuit of legislative majority status. Organizing the majority political party is therefore the established as the principal outcome in a majority rule voting game. As suggested by the previous findings, the set of alternatives may be classified into major and minor alternatives, with most third party and nonpartisan alternatives relegated to minor party status. The introduction of a third alternative generally does not produce sets of alternatives likely to generate voter preference combinations consistent with voting cycles. Instead, the third alternatives are consistently the third choice, with the two major party alternatives both preferred to the third alternatives. When there are one-party districts, based on voter preferences, or changes resulting from the design of new districts with status quo incumbent elective officials, introducing a third alternative may provide a second choice in some district elections. In other districts, there may be only one alternative, an incumbent, two alternatives, the incumbent and a challenger, and at most one candidate in the minor, second political party contesting in the general election. In these situations, redistricting produces uncontested reelections, with some partisan advantage, usually for the majority party, and for the incumbents in both political parties. Given the absence of single dimensional competition, between the major political parties, introducing third alternatives may provide second choices in a second dimension of competition. This competition is not directly zero-sum with either one of the major political parties, but multiparty competition in several dimensions can be zero-sum where there are no additional (e.g., independent) candidates and (e.g., nonpartisan) alternatives. Given multiple alternatives, as the second choice, in one-party districts, the competition is multidimensional and not zero-sum. Testing the two-party competition hypothesis involves estimating the zero-sum exchange, in this case, of legislative districts resulting from competition for vote shares. As demonstrated by this case, the competition in votes shares occur in two rounds of voting, with a primary and general election. By establishing a new voting agenda, the vote shares in the California Primary were formed under new districts. 40
42 The campaigns won nomination in a setting where the incentive to form teams may encourage the local political parties to contest nomination, with two candidates, instead of the traditional endorsement of a single candidate. By nominating two candidates, the political parties not only guarantee winning the district, both insure the largest vote mobilization for their candidates in a primary election. Given the decrease in votes cast, with uncontested elections generating the fewest votes cast, the use of a top two, vote getting, plurality rule establishes not only an organizational incentive for a partisan contestation, but an incentive for candidates to enter the campaign to contest for nomination in what would otherwise be relatively secure Democrat (D, DD, DR) or Republican (RR) districts. This incentive to form teams may have decreased the number of uncontested primaries and encouraged more candidates to enter and contest primaries in what is secure for one or the other major political parties. By encouraging the formation of teams, sets of two candidates from the same political party may contest against the other candidates and partisan alternatives. By both winning nomination, this not guarantees partisan control but increases partisan over candidate competition. By doing so, this increases the importance of major party status, decreases the importance of candidate entry and third party contestation, and increases competition for nomination and election. Under the new single member districts (SMDs) and voting procedure, the primary establishes a multi member district to contest for nomination, and a then majority voting between two alternatives for election. The analysis of ternary graphs reveals the evolutionary stable strategy, from constructing new districts with partisan voter registration, through the nomination and election of candidates to SMD legislative seats. In GRAPH 3, the ESS converges to two parties, zero-sum, competition to win SMD elections. Assuming a status quo, in partisan registration, redistricting establishes a new status quo by redrawing the boundary lines for, in this case, 80 Assembly Districts, 40 Senatorial Districts, and 53 Congressional Districts in the House of Representatives. The new SMDs provides a status quo for a primary and general election, in partisan registration. The new redistricting process, adopted by statewide referendum, emphasized the importance of bipartisan agreement, to prevent boundary adjustments from being manipulated by the party with majority status, to produce more secure districts for the majority party in areas with no incumbent, and to secure renomination and election of incumbents in the majority party contesting for reelection. Because a citizen s committee is not an independent Board or Commission, and therefore part of State Government, the committee did not propose district plans to The Legislature, or the Governor s Cabinet. Instead, the committee engaged in strategic planning with the stated intent to draw lines to produce improvements in district planning and attain bipartisan agreement on a single member district plan. The new process was adopted to prevent manipulation of boundaries by the majority party, which had occurred in the 1951 and 1981 redistricting, and to encourage multi candidate and multiparty competition at a time of two party erosions in partisan registration and a decline in the competitiveness of the State Republican Party in legislative districts. 41
43 As the redistricting committee organized public meetings, the process drifted from promoting more competitive districts to redesigning the districts to provide incentives to compete on some basis in each district. The process began as an effort at reapportionment, more closely approximating county boundaries in line drawing, and to prevent any manipulation of boundaries for candidate and/or partisan advantage. Lastly, the committee attempted to draw district boundaries that would produce the same levels of partisan contestation and two party competition in Assembly, Senatorial, and Congressional Districts, so that it would not be the case that candidates and political parties competing for one type of legislative districts would have different advantage than candidates at the other level do not. The perception that the 1981 plan had advantaged Democrat incumbents at one level, and favored Democrats in newly created districts at another, appeared to provide the information for opposing creating, for example more Republican districts in one chamber of the legislature, securing Democrat incumbents in the other, and providing similar districts so that incumbents would have a better chance at reelection at the federal level. Instead, the statements from the committee maintained bipartisan agreement that the goals for both the redrawing the lines and establishing a new district plan was neither for the purposes of partisan nor incumbency manipulation. The public discussion appears to have considered and deliberated getting away from two party competition, and any form of strategic manipulation of district boundaries. Some of those suggested a more open process, in support of the new primary election and voting rule. Other discussions emphasize redrawing lines that fit local conditions, and therefore improving connections between local and state government. Still other public comments contained some discussion of what to do about districts in areas with declining partisan registration, increasing percentages of voters registered under other categories, ballot structure with large numbers of independent or minor party candidates. Besides the long ballot, and thus, a concern about multidimensional partisan competition, there was greater support for improving competition in the primaries, with additional second and third choices, larger fields of candidates, and other suggestions for reducing the importance of two party competition, in the form of repeated duopoly competitions between the Democrat and Republican Party that either result in landslide general elections safe one-party districts, or uncontested reelection of incumbents. Firstly, because district boundaries are not contained or overlapping, the formation of new districts required with the same average level of partisan contestation and competition in vote shares was a complicated task. Yet the rest of the ANOVA findings, not reported here, indicate there were no significant, and only random, differences in partisan registration or vote shares by Assembly, Senatorial, and Congressional Districts. The only significant variance among legislative districts is reported, in terms of numbers of votes cast. Given the substantial differences in population, a variance in the numbers of votes cast is not surprising for comparing across these three types of legislative districts. What is surprising is the significant amount of the variance, reported in GRAPH 2.1, in ranges of votes cast within categories of districts. Secondly, there seems to have been a bipartisan effort to reduce partisan or candidatebased manipulation of districts. Reduce partisan and incumbent influence over drawing the lines, and therefore design district boundaries with strategic planning instead of a Board or Commission responsibility, with Legislative and Gubernatorial approval. The redistricting process was not intended to eliminate two party competition, or does nothing but react to changes 42
44 in state population. There may have been public sentiment to reduce the influence of partisanship, introduce new alternatives to the field of candidates, and improve the primaries by making them more organized and competitive. The findings in GRAPH 3.1 indicate the plurality status of the California Democrat Party, the increasingly less than one-third of the electorate California Republican Party, and the increasing proportion of voters registered in some other category. The citizen s committee drew district boundaries in an environment where the steady erosion of two party registration, and Republican registration was already a matter of public discussion. Prior to the redistricting process, there had been an abrupt decline in Republican registration, and a slight increase in two party registration, indicating a surge in support for the Democratic Party. The finding in GRAPH 3.1 indicates three parties, or triopoly, competition in voter registration shares. This finding confirms the preference for another alternative: a finding consistent with the introduction of a third alternative, viable enough to introduce the possibility of voting cycles and multidimensional competition. Because redistricting ends with a new set of single member districts, the partisan voters registration data for the new districts represents the beginning of the primary and election process. Campaigning starts for incumbents running for reelection and other candidates entering prior to the completion of redistricting, with filing statements declaring the intent to pursue election before the districts are finalized. Politically, as redistricting ends, electioneering began in Campaign 2010 with a new voting procedure. The vote shares in the Primary are reported in GRAPH 3.2. Ternary plot analysis reveals the importance of two party competition in reducing the dimensions of partisan competition from two to one. In the absence of viable alternatives, the introduction of a third alternative has little or no impact on what constitutes major political party competition or major party status. The results in GRAPH 3.2 highlight the nomination contests where the third alternatives were either the second or third choice. These findings indicate the potential for a voting cycle at the district level, in a few of the legislative election, but not in terms of state partisan competition for majority status. The results in GRAPH 3.3 demonstrate the ESS in duopoly competitions, with new districts and two rounds of voting. With the exception of a few nonpartisan candidates (NPP) and those Democrat candidates with a Peace and Freedom designation on the general election ballot, the primary and general election campaigning converge to two party competition in a single dimension. The findings in GRAPH 3.3 describe the potential for vote cycle, in state partisan competition because of the introduction of viable second choices, in one-party Democrat and Republican districts. The results indicate the outcome in the 2010 Election, with the introduction of third alternatives to contest Democrat candidates with Peace and Freedom candidates, and Republican candidates with some nonpartisan alternatives. Even with a few second place finishes, the primary and general election greatly reduce two-dimensional competition, and therefore any potential for a statewide voting cycle consisting of Democrat majority Republican & Nonpartisan majority Republican majority Democrat & Nonpartisan majority Democrat majority. 43
45 As demonstrated by ternary plot analysis of GRAPHS 3.1, 3.2, & 3.3, the ESS in (partisan) contestation decisions converge to the two-party competition hypothesis and simple majority rule. Any two rounds of voting in a primary and general election provide the mechanism for this convergence. However, the new districts and voting procedure in the California Primary were seemingly designed to generate at least two, and perhaps, multidimensional competition. Given the decline in Republican Party registration, and the erosion in major party registration, this would appear to be a setting where district elections and state party contestation and competition might change somewhat from two parties, Democrat- Republican, government and opposition. The surprising strength of the two major parties in more secure districts, and the willingness of candidates to contest for districts more likely to elect either Democrat or Republican suggests why the primary and general election mechanism converged so extensively, if not strongly, to two party competition. Even so, the sustained zerosum, major political party, competition is somewhat surprising given the redistricting process for creating new districts. To analyze the potential for a voting cycle, consider the vote shares as weights for three alternatives (a D, R, and either NPP or PF-D). If the vote shares are equally divided, into thirds, with probabilities of a voting cycle determined by set of alternatives and number of voter preference combinations. If the vote shares are unequally divided, with concentrations in only one or two alternatives, the only potential for a voting cycle is at the district level. Voting cycles may occur in single member district elections with three viable alternatives. However, this would have little or no impact on competition for a majority of the seats in a legislature. In the few districts where a third alternative makes a difference, these elections may be of greater interest to the public, but they are unlikely to change statewide totals or make a difference in the partisan composition of a legislature. If the third alternative s finishes second in a large number of districts, and most districts are one-party Democrat or Republican, then introducing the third alternatives as the second choice frequently may change state partisan competition, with for example, some members of the majority or minority switching political parties, forming groups with endorsements from the third alternatives, or contesting for elections in a fusion ticket with some members of the legislature elected with major party affiliation only (D or R) and others with additional third party or nonpartisan designation (PF-D, R-NPP). To test for this possibility, Herfindahl indices were constructed from the summation of squared vote shares. The more equal the vote shares, the closer the Herfindahl index is to an equal division determined as one divided by the number of alternatives. As the vote shares concentrate in favor of one or two of the alternatives, the index converges toward one, a monopoly concentration ratio, or.5, a duopoly concentration ratio. With two alternatives, the concentration ratio implies SMR and perfect two party competition. The probability of a voting cycle becomes relevant only with three or more alternatives, with this probability increasing as the Herfindahl index converges to zero. The distributions of the Herfindahl indices are reported in FIGURES 4.1, 4.2, & 4.3. These three measures describe any inequality in the distributions of partisan registration, and primary and general election vote shares. Like analysis of ternary plots, the findings reveal a concentration of vote shares, increasing from relatively division in registration shares, to increasingly more concentrated votes for one of the two major parties in each district. 44
46 The inequality of the alternatives increases with two rounds of voting, with the primary vote mechanism converging to two party competition. Where only the two major political parties are relevant, the choice is between a D and an R candidate, and this set of candidates could be nominated through a traditional primary election for the purposes of general election. In 2010 Election, the results for the partisan registration indicate concentration of 37.8, which is significantly greater than one-third, or an equal division in D, R, and other % shares. The vote shares increase in concentration from 37.8 to 60.1% in the Primary. Additionally, the increase in the standard deviation, from 4.13 to 15.88%, describes the ratio of increased concentration in the major two parties. The change in concentration toward bipartisan control increases to 63.6%, with a standard deviation equal to 18.87% in the general election vote shares. Even though this represents a smaller increase in concentration than the change from the registered voting electorate, this still remains significantly below one hundred percent concentrations of vote shares in single party control. The results for the Herfindahl index also suggest greater concentration of vote shares, in more secure district elections for either D or R, than what would be expected assuming the two-party competition hypothesis and an even division in vote shares. By comparing the distributions in FIGURES 4.1 & 4.2, and 4.2 & 4.3, there is some evidence of convergence toward one-party control in the DD and RR districts, with two-party competition emergent in the RD and to a lessor extent the DR districts. The primary election mechanism reduces the number of districts below a fifty percent concentration ratio far below the voters registration data by districts. As a consequence, this primary attained what would result from a traditional primary, a pairing of a Republican and Democrat candidate, with very few uncontested districts. Reducing the number of candidates to two, still did not result in all of the districts concentration ratios greater than or equal to.5, since some additional Republican Party candidates, and those with a Peace & Freedom designation were placed on the general election ballot. Still, these concentration ratios indicate substantial declines in competition, with electoral margins averaging in general election vote shares. This finding indicates the bipartisan control that resulted in the 2010 Election suggests the redistricting process created secure new districts for both political parties. The distributions of vote shares are reported in TABLE 3.1, with the estimated parameters revealing the average D and R vote shares equal too 60-40% divisions in the general election, 57-41% divisions in the primary, and 45-30% divisions of voter registration. This analysis of two party competition in a single dimension indicates the State Democrat majority party status, in district elections. The proportionate share of the Republican candidates is significantly less than fifty percent, and the margin of difference between political parties increases from the registered voting electorate to the general election outcomes. In addition to the one-party strength in competing for majority party status, these results also indicate that neither political party has a majority of the electorates. The State Democrat Party is a plurality rule majority, constructed in two rounds of voting, within a primary voting mechanism. The State Republican Party is increasingly less than a one-third political party, competitive in under a majority of the district elections. As additional erosion of the two party registration continues, and the concentration of the two-party vote shares increases in the State Democrat Party, third parties, nonpartisan alternatives, and independent candidates are more likely to be the second choice in either secure Democrat or Republican districts. 45
47 The results reported in TABLE 3.1 also reveal the 10-25% average difference in partisan registration to voting shares. Of the two district measures of partisan strength, there is far less dispersion in the party registration vote shares, averaging standard deviations equal too 10 to 11% across the districts. In comparison, the primary and general election vote shares fluctuate in a much larger, 21 to 25% or so range. Given the differences between registration and electioneering, these findings suggest the importance of partisan contestation and candidate entry decisions for vote mobilization. The campaigns for nomination and election produce a range of outcomes, from DD to RR, where introducing varying numbers of candidates influences the vote shares attained by the major political parties. Similar analysis of the third party distributions of votes in TABLE 3.2 confirms these are minor alternatives to two party, D and R, competition. The Green and Libertarian Parties both averaged approximately one-third of a percentage of the vote in the primary election, with Peace & Freedom designated independent candidates also averaging approximately one-third percentage in the general election. The distributions of votes indicate these political parties were the second choice in a few districts, a third choice in others, and did not viably contest for nomination and election in most districts. The new districts and voting procedure in the 2010 Election did not, therefore, produce a large surge in the vote shares of the third political parties. By contesting for nomination, and qualifying for general election, these third parties used the primary voting mechanism to clear the threshold and compete as second choices in a few districts. Introducing a nonpartisan alternative did not produce candidates representing a majority of voters registered as something else besides D or R. As contained in TABLES 3.2 & 3.3 introducing a third alternative generally involves distinctly third choices, with either D or R T. Considering these irrelevant alternatives, their inclusion or exclusion makes little difference in most district nominations or elections, and no difference in state partisan competition for majority status in The Legislature. The NPP candidates won approximately 2% vote shares in the primary and 1% vote share in the general election. Both results are far less than the no party registration category, or total share of voters registering for some other partisan alternative. Descriptive analysis of the measures in TABLE 3.4 provides a summary of partisan contestation and competition in the 2010 Election. As shown in TABLE 3.4 the average margin of victory, for D or R candidates, in these single member district elections was 63.22%. Given these results, how competitive were the new districts? Given an average dispersion in vote share margins equal to 10.08%, and the estimates of the shape and concentration of vote shares, there is some evidence of bifurcated outcomes with the Democrat vote shares converging to DR and DD outcomes, and the Republican vote shares converging to RD competitive and RR outcomes. Because most of the margins of victory are above sixty percent of the vote, the bipartisan agreement on the citizen s committee produced relatively safe D or R districts, that were only marginally competitive in general election vote shares. These results are more competitive than what is usually the case after redistricting, in elections with more potential for one-party control, uncontested elections, and less than 40% vote shares for the second choice. With regard to primary competition, the number of candidates averaged between 3 to 4 candidates, within a range from 1 to 5 candidates entered to contest for nomination. As reported in TABLE 3.4, the increase in primary competition involved a larger field of candidates, 46
48 generally contesting in the more secure new districts. It is quite likely more Republican candidates contested for nomination, on a per-district basis, because of the greater chance of victory in these districts. Given the smaller number of Republican Districts, the larger number of candidates in these RR districts confirms there were districts with two or three candidates from the same political party contesting for nomination against one or two candidates from the other political party. The introduction of third alternatives is in addition to the partisan contestation decisions of the major political parties. In the secure RR districts, partisan contestations resulted in three or more Republican candidates, one or two Democrat candidates, and third alternatives consisting of NPP and third party candidates. In the secure DD districts, these districts either were uncontested, with Democrat candidates only, or minor political alternatives consisting of a Republican or nonpartisan candidate. In the DR districts, there were two or three Democrat candidates, and one or two Republican candidates, with additional third alternatives. In the most competitive districts, those with more Republican primary votes cast, but less than 60% vote shares, there were fewer candidates, such as one or two Republican or Democrat candidates. Because the DR and RD districts represent third-quarters or 75% of the districts, any increase in the numbers of candidates or numbers of political parties in these districts produced greater amounts of partisan competition in vote shares. The findings in TABLE 3.4 & GRAPH 5.1 summarize the relationship between partisan contestation and competition implied by the models in FIGURES 1 & 2. The number of political parties contesting for nomination in the 2010 California Primary averaged approximately two political parties per-district. The distribution of the number of political parties is shown in GRAPH 1.3. The inequality, or shape and concentration, of vote shares in partisan registration, and in two rounds of voting, confirms the primary vote mechanism reduces the number of alternatives to two, with some of the districts two party competitive, and others secure one-party districts with only primary competition in numbers of candidates and numbers of political parties. The findings demonstrate vote shares increased in concentration from vote registration and redistricting to nomination to election, with significant increases in two party control and safe margins of victory. The findings in TABLE 3.4 also reveal significant decreases in the dimensionality of party competition, from vote registration and redistricting to nomination and then election. As shown in GRAPH 5.1, the importance of introducing a third alternative explains 30% of the variation in the number of candidates contesting for nomination in California. The Primary choices available are therefore approximately two-thirds or more explained by candidate entry and exit decisions, with the rest accounted for by the number of political parties contesting for nomination. The evolutionary stable strategy (ESS) in the primary vote mechanism verifies Duverger s Law with a new redistricting process, new single member districts, and two rounds of voting. Given the relatively small numbers of candidates and political parties, contestation decisions structure the set of alternatives with a range, and therefore determine the choice set available for nomination, and the outcomes on the voting agenda for general election. Given the infeasibility of third alternatives, competition is multidimensional in the primary, and single dimensional in the general election. Contestation decisions generate twodimensional primary competition within a finite integer range of candidates and political parties. 47
49 The last set of results demonstrates how the structure of new districts, SMD elections and a new voting procedure induced outcomes with a primary vote mechanism. This analysis reveals partisan competition in vote shares is determined by voter registration and contestation decisions. The ESS is to produce duopoly competitions for majority party status, for competition to converge from two to single dimensional zero-sum competition in vote shares, and for margins to increase sufficiently greater than or equal to simple majority rule. In this setting, the decision space contained a redistricting process with some uncertainty concerning voter registration data. Given the trends in voter registration, there is some error in the measurement of partisan vote shares, or percentages of Democrat, Republican, and other registration. As vote mobilization occurs, including during the redistricting process, these figures change and they may vary somewhat after the district boundaries are known. Precise estimates of partisan vote shares are therefore never exact, but estimated by district with trends in voter registration. When either surges occur in voter registration, or district boundaries change, changes occur with error in the measurement of partisan vote shares. At any point in time, during a campaign, partisan vote shares are uncertain to some degree of error. Redistricting produces a new set of district boundaries with a different distribution of partisan vote shares, which may introduce some delay for measuring partisan vote shares from voter registration data. The Quality Control GRAPH (5.2) provides an estimate of the range in districts, from Democrat to Republican, at the time of the Primary Election in The Deming analysis of partisan control is reported in Appendix II (TABLE 3.2). The estimated coefficient of the regression model is equal to indicating zero-sum partisan competition, given uncertainty in percentages of voters registered as Democrat and Republican. These findings suggest a range in districts, from exact zero-sum competition to majority party status and some introduction of third alternatives. The findings in GRAPHS 5.3 & 5.4 estimate the relationship between partisan voter registration percentages and vote shares in the primary election. The results for a jacknifed regression model are reported in GRAPHS 5.3 & 5.4, where the bootstrap simulation accounts for differences in individual districts vote shares. The jacknife re samples each Democrat and Republican vote share, subtracting one district in each simulation. These replications produce a set of one hundred and fifty-three simulations indicating the consistency of the estimates, given district variation in partisan vote shares. Because the distribution of both political parties primary vote shares were not excessively skewed, or concentrated, these findings suggest the averages provide point estimates of representative partisan vote shares, in the new districts, equal to 57% Democrat and 41% Republican. The findings in both GRAPH 5.3 & 5.4 & TABLE 4.1 provide evidence of positive association between partisan vote shares by partisan voter registration. Mapping the simulated results onto the actual data and a one-to-one reference line, implies district boundaries determine levels of primary competition in vote shares. The effects of the redistricting generate district variance, and a range of districts in partisan registration, that imply a range of single dimensional, zero-sum, competition in vote shares. Whereas the citizen s committee may have appeared to have preferred a nonpartisan district plan, the mapping of partisan registration to primary vote shares indicates all the districts are either Democrat or Republican controlled. 48
50 Any small discrepancies in the districts may be less important than whether the district is Democrat or Republican. The simulation results indicate district variances and some differences between the Democrat and Republican vote shares. Findings that confirm redistricting makes a difference in the fairness and effectiveness of attaining vote shares based on registered voters preferences. Under the new district plan, these findings indicate some differences between the political parties and district variance that provides evidence of a range of effective competition within both political parties. Whether this provides some evidence of asymmetries between the political parties, by majority and minority party status, requires interpreting the actual data above a one-to-one mapping as vote packing. Again, given the decline in the Republican registration percentage, a surge in the Democrats partisan registration percentage, and a trend toward erosion in two party registration, some packing of votes may have been required to guarantee any Republican districts, and a Democrat majority, and not a plurality, in the others. The range of competition established by this redistricting implies bipartisan control and single dimensional competition in vote shares. The factor and correlation analysis reported in TABLE 4.1 demonstrate the single dimensionality of two party competition in vote shares. These findings provide evidence of the reducibility of the two party competition to a single dimension. The findings in TABLE 4.1 imply partisan competition is reducible to single vote share factor or measure space. The approximately linear range of competition is therefore a mapping of zero-sum competition, implying a negative one (linear) correlation between political parties competing for vote shares. The implications of this range of competition are important for analyzing the effects of redistricting and in this case, trends in registration, and a new voting procedure in the primary election. Some of the competitive pressures under this new structure involve producing district majorities or electoral margins by number of political parties, number of candidates, concentration ratios or inequality of the vote shares. The introduction of a nonpartisan alternative and trends toward other registered besides D or R suggest the possibility of substituting for the major partisan alternatives. The empirical results in TABLE 4.2 confirm significant correlations between the number of political parties, the number of candidates, the concentration ratios of vote shares, the nonpartisan votes share, and percentage in other than the State Democrat and Republican Parties. The findings indicate that four political parties are necessary to guarantee two partisan alternatives, with the rest of the unexplained variance in the number of candidates attributable in individual candidate entry and exit decisions. These findings also indicate increasing the number of political parties, under the new primary law, reduced the electoral margins by a little more than one-fifth. Increasing the number of political parties in the primaries also significantly, by more than two-thirds, reduced the inequality of votes in the primary. Increased partisan contestations also contributed to approximately one-fifth more equal vote shares in the general election, suggesting ballot access in the primary was related to slightly more competitive general elections. The number of political parties was also positively related to the NPP vote, and unrelated to the % other registration, suggesting the existence of some competition among the third political party contestation and a nonpartisan alternative. Neither the number of political parties nor number of candidates was correlated with the % other registration, but this % other was correlated with approximately a one-quarter increase in the general election margin. 49
51 Increased candidate contestations produced a twenty-five percent decrease in the general election margin. Taken together, these findings suggest offsetting effects, influencing zero-sum competition between the major political parties. In this case, the more voters with a preference for a third or nonpartisan preference are correlated with substantially less competitive, if not landslide electoral outcomes, in vote shares. In direct comparison, a large number of candidates reduce these electoral margins by the same amount, suggesting the importance of larger numbers of candidates to increase partisan competition. Because the size of the field of candidates is distinct from the number of political parties, these results also imply candidate entry decisions increase competition in addition to third party or nonpartisan contestation decisions. The introduction of a nonpartisan alternative not only was positively correlated with the number of political parties contesting for nomination, but reduced the amount inequality of vote shares in the primary election by approximately one-fifth. A result that demonstrates the inclusion of a nonpartisan alternative reduced the concentration of votes in the major political parties. Lastly, in TABLE 4.2, the single dimensionality of the measures of inequality suggests not only competition in vote shares, but concentration of ratios of votes in the major political parties is also single dimensional. As the concentration ratio in the two major political parties increases in voter registration, this produces two-thirds and one-half increases in concentrations of primary and general election vote shares. The stronger the two major political parties are, in terms of partisan voter registration by district, the stronger the duopoly partisan control, in this case, over majority party status. Major two party competition is estimated within the structure of a primary vote mechanism, from the voter registration data, and the outcomes in terms of vote shares in the primary and general election. In the ternary plot analysis this data was shown to converge toward two party competition. The ESS is in duopoly competitions between D and R candidates for nomination and election. The quality control, regression chart also allows for uncertainty in vote shares, and therefore in both district variance indicated in bivariate regressions with a jacknife computation of district variance and state partisan competition for majority status. Any probability of a vote cycle is greatly reduced by the bipartisan consensus, for the major two political parties, divided into relatively secure Democrat and Republican plurality, if not majority, districts by voter registration preference. The descriptive analysis reveals an asymmetric duopoly competition between a plurality rule winner, and a minority political party, with majorities in a few districts. In TABLE 4.3 Jacque-Bera tests for single dimensional normality indicates the new districts contained a normal distribution of Democrat vote shares, a normal distribution of the Republican general election vote shares, but asymmetrically skewed and concentrated Republican primary and voter registration shares. In the general election, the findings provide evidence of Downsian spatial competition between the Democratic and Republican Parties on a single dimension. The competition is zero-sum in vote shares between the major parties, contesting in new districts to form a State majority party in The Legislature. The results of the tests of normality indicate the introduction of a third alternative, in third party and nonpartisan vote shares were asymmetrically distributed across the districts, confirming concentrated impacts new voting alternatives as a second choice in only a few districts. Not enough to make a difference in election of only D and R candidates, nor to sustain a second dimension in partisan competition. 50
52 Given evidence of Downs spatial model of party competition, a multi-equation model is specified to major two party competition under the conditions of new, single member, districts and a primary voting mechanism using plurality rule for nominating the top two vote getters. The multi-equation model takes the citizens committee district plan into account by examining partisan registration data, vote shares, margins, and numbers of candidates and political parties contesting for nomination. The importance of contestation decisions, by political parties and candidates is also directly specified in relation to partisan contestation and competition in potentially multiple dimensions, across potentially cyclic alternatives. The fact that new, third alternatives, such as the NPP candidates did not make enough of a difference in state partisan competition as the % of voters not registered as Democrat or Republican, failed to introduce instability in majority rule in these elections, but still may make some difference in future contests either between D and R primary candidates or in districts where the third alternative evolves into the second choice. The analysis estimates multiparty competition that allows for nonzero sum two-dimensional competition with third alternatives. The eight equation model is reported in TABLE 5.0. The basic features are a sixequation model of voter registration and competition in vote shares. The additional two equations incorporate levels of partisan contestation and competition into the analysis. Besides distinguishing between partisan and candidate contestation decisions, these latter two equations measure the size and scope of the field of candidates campaigning for nomination and election. The fact that entry and exit decisions were made in Campaign 2010, during redistricting and the administration of the first elections under plurality rule, the top two nomination rule structures any outcome in terms of the number of political parties, candidates, and therefore margins in the general election. The single equation results, including the ternary plot analysis, quality control regression, and bootstrap simulation, each imply zero-sum competition between the major political parties in contestation decisions and vote shares. These findings also provide evidence of positive association, if not linear correlation, in partisan voter registration and single dimensional vote shares. The multi-equation controls for the impact of zero-sum competition between the major political parties and positive association in the effectiveness and fairness of the concentrations ratios in vote shares by partisan voter registration and round of voting. The findings suggest the outcomes only approximately in a linear space, constituting a range of competition. There are asymmetries among the political parties, between partisan and nonpartisan alternatives, and some evidence suggesting the primary vote mechanism structures the convergence from the registered voting electorate (in this case in new districts) to votes in two rounds for nomination and election. These votes are ESS in a single dimension of competition, with minor alternatives ruled out as generating a cycle among three alternatives, providing a substitute for either of the major partisan alternatives, or being a relevant alternative for the purposes of constructing a majority. The model significantly explains the variance in (Republican, Democrat, and Nonpartisan) primary vote shares, (Republican, Democrat, and Nonpartisan) general election vote shares, the number of candidates in the primary, and the vote margin of the winning candidates. This model is least accurate in explaining the NPP candidate-nonpartisan primary vote, because this is uncorrelated with the percent other registered voters. 51
53 The findings suggest an approximately a linear space in the range of competition, because of the introduction of a nonpartisan alternative. The model explains half the variance in this nonpartisan vote for candidates with no partisan preference listed on the general election ballot. The model also explains thirty percent of the variance in the number of primary candidates and voting majorities in the district elections. This model significantly explains variances in the sequential two rounds of voting, an accounting for the effects of redistricting, a new voting rule, introduction of third alternatives, and partisan contestation and competition. The findings confirm asymmetries in the duopoly competitions, sometimes confronting a third alternative. Primary votes are explained in TABLE 5.0, Model 1, followed by vote shares (Model 2), vote margins (Model 3) and number of candidates (Model 4). The Republican primary vote shares were determined principally by the Republican voters registration base, but this primary vote was also explained by multiparty competition with greater vote shares in districts with fewer Democrat and other registered voters. The Democrats primary votes were marginally more balanced in determination by the Democrat and Republican registration bases, with third parties winning greater vote shares in districts where the Democrat candidate also controlled a larger share of the vote. The percentage registered for third alternatives had a marginally stronger positive impact on the Democrat s primary vote shares, again, suggesting the primary voting mechanism structured the vote to allow for those not registered as D or R to influence the D and R vote shares. Instead of voting for nonpartisan candidates, these voters, not surprisingly voted for Democrat, Republican, and NPP candidates, increasing the vote shares of Democrat candidates the most. Primary votes for the NPP candidates were randomly distributed, uncorrelated with D or R registration %, third party primary vote shares for the Green and Libertarian Parties. The coefficients estimated for the % other voters registered indicate a variation in positive but differential association with the NPP primary vote (.20), the Republican primary vote (.35) and Democrat s primary vote (.45). Reducing the number of candidates to two, lowers the correlation in a second round of voting with a larger range in competition. Because of the DD and RR outcomes, vote shares range from 0-100%, with runoff elections in approximately one-quarter of the districts. Even with a diminishment in coefficients estimated, the models continue to explain eighty percent of the vote shares in the second round of voting. The findings reveal the Republican general election vote is determined by the Republican primary vote, and unrelated to the other dimensions of partisan competition in votes shares or third alternatives. This result indicates the Republican vote shares in the general election were unrelated to the NPP candidate s entry and vote shares in the primary. Having NPP candidates in the primary may not have reduced general election support for the Republican candidates, but the inclusion of Peace & Freedom, Democrat candidates in the general elections provided a significant substitute for the Democrat vote share. The coefficients also reveal a similar impact of Democrat and Republican primary on general election vote shares, providing some evidence of an ESS in two rounds of voting. In the first round, there are significant influences on competition depending on the balance of the political parties, the introduction of third alternatives, and some asymmetry in duopoly competitions. By the second round, there is convergence toward two party competition with similar tradeoffs in vote shares R(2/3, 1/3), and D(2/5, 3/5). As bipartisan control increases, this results in zero-sum triopoly competition, reducing support for the nonpartisan alternative. 52
54 The voting majority is most correlated with the % Democrat and other registration base. Again, suggesting the importance of redistricting, since the margin of victory is significantly related to the size of the majority party in the district. By far the safest Democratic districts produced the most noncompetitive, landslide elections in terms of vote shares. The size of the margin also increased with greater percentages of other voter affiliations than D or R. Given the relatively lower, less than 60% margins in the RD districts, the most competitive elections were held in the Republican Districts. In comparison, the number of primary candidates was uncorrelated with partisan voter registration bases, but significantly related to the number of political parties contesting for nomination. This result suggests redistricting into more secure partisan control does not explain the increase in the numbers of candidates, even though it would seem like more candidates would enter if the districts were more likely to elect a member of their political party. Drawing district boundaries to provide more secure Democrat and Republican districts does not explain the increase in the number of candidates from the more secure to most competitive districts. Instead, the large number of candidates, from the same party, in the DD and RR districts is better explained by a model of candidate entry and exit decisions, taking into account incumbency, new districts, and term limitations. The introduction of third alternative does, however, explain significant amounts of the variance in the number of candidates, predicting large numbers of candidates based on partisan contestation decisions and the existence of a nonpartisan alternative. Given zero-sum, single dimensional, partisan competition, any two dimensional models of voting are likely only to explain competition in the primary election varying with the successful introduction of another option to the choice between the major partisan alternatives. In two rounds of voting, with redistricting effects on the balance of voter registration preferences, there is some evidence of two-dimensional partisan competition. To test for what would be a bivariate normal, model of spatial competition in two dimensions, least angle regression models are estimated and reported in TABLES providing supporting evidence for the multiequation model. The results reported in TABLES indicate Democrat votes are reducible from the Democrat and Republican primary vote, the Republican vote is determined by Republican primary vote, and the Nonpartisan vote is related to all three, the D, R, and NPP primary votes. The results in TABLES confirm the Democrat and Republican primary votes are determined by bipartisan voter registration bases, and the Nonpartisan (NPP) vote is generally uniformly circular, but significantly related too, the percentage other voter registration. The results for these tests are presented in TABLE 6.7 with the basic finding that the introduction of the nonpartisan alternative produces some uniform, two-dimensional randomness in competition. The findings suggest that not only is the partisan competition not twodimensional, but it is possible to reject three specifications of multidimensional partisan competition: both the bivariate and multi-variate normal distribution in primary and general election vote shares, and an even more dispersed, uniform circular distribution. The effect of introducing another alternative is eliminated through major party competition, where two rounds of voting converges to a linear range of competition. Drawing a circle around the estimated range of competition produces a circular distribution, a two-dimensional model that is rejected by the evidence demonstrating far more linearly zero-sum competition along the line or range of competition, between the two major political parties, and not three or more alternatives. 53
55 Implications for Primary Vote Mechanisms The multi-equation model estimates ranges of competition, reducible to a linear space, consistent with zero-sum competition in a single dimensional, Downsian model of spatial competition. As shown in this study, reform changed the voting procedures and therefore provided a different voting agenda to nominate and elect candidates. The very partisan contestation we may have come to expect changed, as third parties were included in the primary and general election cycle. Other votes may have been given a greater say in nominating candidates, as the nonpartisan primary allowed for independent candidates to contest for nomination and general election. Thus reform changed the two rounds of voting, instituting a runoff election for districts that nominated two candidates from the same party, something which happened in one-quarter of the districts. Whether we consider this outcome to be seventy-five percent as effective as the traditional primary, or a twenty-five percent improvement, depends on the field of candidates and any preferences voters have for competition over one-party control and uncontested low voter turnout elections. The top two vote getting requirements cannot be changed without introducing another round of voting, allowing for a reduction in the number of candidates. Given the large numbers of candidates contesting for nomination, the use of plurality rule to determine nominees provided for strategic interactions among the candidates, encouraging candidate s entry and exit decisions, providing for not only transitions from term limitations, but incentives to organize second and third alternatives to contest for nomination. In the absence of the top two rule, the primary vote mechanism would not have filtered the number of alternatives to two, for the purposes of majority decision. The structure of this voting agenda should encourage a larger in size and diversity in scope field of candidates. In this multidimensional space of partisan competition, contestation decisions are generally more important, in terms of modeling competitive equilibrium, than analysis of the general election vote shares. As this case suggests, the contestation decisions are inclusive of the number of political parties, nonpartisan alternatives, and voters other than those in the major two political parties. Where independent or third alternatives matter, there are voting cycles and other candidate based, entry and exit decisions, relevant to the analysis of electoral outcomes. In the pursuit of statewide voting majorities, increased vote mobilization, and more competition within districts, contestation decisions are less important than analysis of such factors as redistricting, or district level partisan registration bases and base trends. After the 2008 Election in California, any redistricting was likely to produce fewer Republican seats. The effects of terms limitations, and the previous history of redistricting favoring the majority party, communities of interest, and incumbency, created a condition different from postwar partisan gerrymanders which seem to be part of the nonpartisan tradition in opposition too organized two party competition throughout the State. Dividing the State into safe Democrat and Republican areas would seem to have been a task elective officials could have performed, yet this is not what voters preferred given the previous sixty years of redistricting experience. As reported in this study, the citizen s committee did form Assembly, Senatorial and Congressional districts with same partisan composition even though district boundaries are not overlapping. The bipartisan agreements produced a plan with more secure Democrat and 54
56 Republican districts, which were not less partisan, but exactly zero-sum competitive in vote shares. The new primary vote mechanism and new districts result in a large number of candidates, including those preferring an alternative to the major political parties, that had supported a new redistricting and primary voting procedure, for the purposes of nomination. The consequences are a nonpartisan primary, zero-sum, single dimensional partisan competition in vote shares between the major political parties, a few third alternatives that were nominated as a second choice, and a two-thirds veto proof Legislature. How important was the redistricting process, for zero-sum partisan contestation decisions and competition in vote shares? Given the strategic planning process, based on local public hearings to determine district boundaries, and any efforts by committee members to follow county and municipal jurisdictional lines, district planning produced new district boundaries and a district plan for this decade s voting agenda of nominations and elections. However the lines were drawn, district boundaries still contain voter registration preferences and candidates that make exit and entry decisions. In a Democratic partisan registration surge, many suggested it might not be possible to draw Republican districts, given the implosion in registration and willingness of incumbents to fight over district boundary changes. The losses of three marginal districts and the inclusion of NPP candidates in Congressional elections are matters likely to continue to be considered and deliberated in time lines of the redistricting process. Besides leading to the retirement of long term members of Congress, the almost random effects of term limits and staggered terms for electing State Senators, and the incentives to contest for new districts, left some seats without incumbents, some uncontested incumbents, and others in districts they arguably could not and did not win. Because the citizen s committee made the shapes of some of the districts more regular, and followed county and municipal lines to a greater extent, there may have been less manipulation of district boundaries than previous efforts at redistricting since The twenty remaining State Senate district elections to be elected in a midterm Congressional election imply completion of the redistricting process in Because some of the State Legislative candidates failed to win reelection and others did not win election to Congress, and term limits continue, contestation, exit and entry decisions and competition in numbers of candidates and evenness of division of a vote still matter for deciding this contest for change. Despite the better efforts of voters, and a citizen committee, the new districts are two party competitive and manipulable through incumbency and sometimes incomplete partisanship. By describing contestation decisions, this generates a more complicated voting agenda than a traditional primary and general election. Even with two rounds of voting, this study suggests the ESS is too, allow a primary vote mechanism to clear two alternatives to determine a voting majority. In most instances, the voting procedure doesn t matter, but there is no attempt to attain simple majority rule (SMR). Top vote getting procedures simply elect the top vote getters, however many are required to fill the seats or positions. Nonpartisanship is also no cause for concern since many local government elections and state judicial elections are held in two rounds of nomination and election without partisan designation of candidates. The voting procedures in these nonpartisan primaries and elections require choosing two or more candidates. Yet in this case, the experiences in Louisiana, Nebraska, Washington, and Minnesota ( ), suggest the inclusion of nonpartisan alternatives and not nominating one member from each of the major political parties change voting, introducing, a second dimension. 55
57 The change in voting, for voters, is neither produced by the voting procedure, nor does any redistricting fix what has been changed in terms of partisan alternatives, electoral outcomes, or some other consideration in two rounds of voting. Whether the campaigns are different, or the districts are different, etc., the redistricting process and the primary vote mechanism were different and these may produce changes in partisan contestation and competition. Any additional changes in the voting procedure will change the reducibility in the size (large or small) number candidates, and this may also influence candidate entry and exit decisions independently of term limitations, redistricting, and changes in partisan registration. The bipartisan commitment to a nonpartisan primary appears to fix somewhat any reductions in partisan contestations. Yet the imposition of the term limits and secure districts imply less contestation, and not more, more uncontested reelections in a term limit district election cycle, and genuinely fewer alternatives to choose from even if these are voter partisan preference majorities and popular incumbents. Adding alternatives and requiring voting majorities, implies more than two rounds of voting and a separation runoff from general election pairings. As drawn in FIGURE 1.4, a voting agenda with three rounds is sufficient to guarantee a majority rule winning alternatives, that would likely pair 1D and 1R in most, but not all, district elections. However, most agree three or more rounds of voting create even more expensive campaigns, and the experience in other states suggests the first round could better be administered within partisan caucuses or by partisan convention selection. In states with partisan endorsement, the state political party s regular candidate frequently is defeated in a runoff primary against a reform candidate, so that endorsements should probably not be used as a replacement for a primary or runoff election. 56
58 References Adams, James and Samuel Merrill. Candidate and Party Strategies in Two-Stage Elections Beginning with a Primary, American Journal of Political Science, Volume 52, Number 2, April 2008, pp (16). Aldrich, John H., James E. Alt, and Arthur Lupia, editors. Positive Changes in Political Science: The Legacy of Richard D. McKelvey s Most Influential Writings. University of Michigan Press, Allen, Don A. Legislative Sourcebook: The California Legislature and Reapportionment: Assembly of the State of California. Argersinger, Peter H. Structure, Process, and Party: Essays in American Political History. M. E. Sharpe, Atkeson, L. R. Sure, I Voted for the Winner! Overreport of the Primary Vote for the Party Nominee in the National Election Studies, Political Behavior, Volume 21, Number 3, September 1999, pp (19). Batten, Lynn Margaret. Combinatorics of finite geometries, Second Edition. Cambridge, Bibby, John F. and Sandy Maisel. Two Parties or More? The American Party System. Westview Press, Bushnell, Eleanore. Impact of Reapportionment on the Thirteen Western States. University of Utah Press, Chen, K-P, and S-Z Yang. Strategic Voting in Open Primaries, Public Choice, Volume 112, Number 1, July 2002, pp (30). Cherry, T. L. and S. Kroll. Crashing the Party: An Experimental Investigation of Strategic Voting in Primary Elections, Public Choice, Volume 114, Numbers 3-4, March 2003, pp (34). Cooper, A. and M. C. Munger. The Unpredictability of Primaries with Many Candidates: Simulation Evidence, Public Choice, Volume 103, Numbers 3-4, June 2000, pp (19). Farquharson, Robin. Theory of Voting. Yale, Gerber, E. R., and R. B. Morton. Primary Election Systems and Representation, Journal of Law, Economics, and Organization, Volume 14, Number 2, Oct. 1998, pp (21). 57
59 Hanks, C. and B. Grofman. Turnout in gubernatorial and senatorial primary and general elections in the South, : A rational choice model of the effects of short-run and long-run electoral competition on relative turnout, Public Choice, Volume 94, Numbers 3-4, 1998, pp (15). Heckelman, J. C. Sequential elections and overlapping terms: voting for US Senate, Journal of Economic Behavior and Organization, Vol. 42, Number 1, May 2000, pp (12). Jensen, Richard J., Steven L. Piott, and Christopher C. Gibbs. Grass Roots Politics: Parties, Issues, and Voters, Greenwood Press, Karp, Jeffrey A. and Caroline J. Tolbert. Polls and Elections: Support for Nationalizing Presidential Elections, Presidential Studies Quarterly, Volume 40, Number 4, December 2010, pp (23). Kohl, Lawrence Frederick. The Politics of Individualism: Parties and the American Character in the Jacksonian Era. Oxford University Press, Kritzer, Herbert M. Competitiveness in State Supreme Court Elections, , Journal of Empirical Legal Studies, Volume 8, Number 2, June 2011, pp (23). Mayer, William G. Retrospective Voting in Presidential Primaries, Presidential Studies Quarterly, Volume 40, Number 4, December 2010, pp (26). Russell, A. and D. Zuckerman. Perfect Information Leader Election in log n+o(1) Rounds, Journal of Computer and System Sciences, Volume 63, Number 4, December 2001, pp (15). Shefter, Martin. Political Parties and the State: The American Historical Experience. Princeton University Press, Silbey, Joel H. Political Ideology and Voting Behavior in the Age of Jackson. Prentice-Hall, Inc., Steger, Wayne P. Polls and Elections: How Did the Primary Vote Forecasts Fare in 2008? Presidential Studies Quarterly, Volume 39, Number 1, March 2009, pp (14). Strumpf, K. S. Strategic Competition in Sequential Election Contests, Public Choice, Volume 111, Numbers 3-4, April 2002, pp (21). Ware, Alan The American Direct Primary: Party Institutionalization and Transformation in the North. Cambridge University Press. 58
60 LA Times Archives
61 60
62 61
63 62
64 63
65 64
66 Outcome Frequency Percent Valid Percent Cumulative Percent RR RD DR DD Total Not Elected Panel
67 Partisan Contestation Frequency Percent Valid Percent Cumulative Percent 2 R R R & 1 NPP D & 1 R D & 1 NPP D D Total Not Elected Panel
68 Number of Political Parties Frequency Percent Valid Percent Cumulative Percent Total Not Elected Panel
69 Number of Candidates Frequency Percent Valid Percent Cumulative Percent Total
70 District N Lower Upper min max House Senate Congress Total ANOVA F-Statistic d. f. 1 d. f. 2 P(F) < 2 Levene Test F-test
71 Outcome N Lower Upper min max RR RD DR DD Total ANOVA F-Statistic d. f. 1 d. f. 2 P(F) < 2 Levene Test F-test
72 Outcome N Lower Upper min max RR RD DR * 4 DD Total ANOVA F-Statistic d. f. 1 d. f. 2 P(F) < 2 Levene Test F-test *Republican candidates qualified for the General Election ballot Assembly District 31 and Senatorial District 3. 71
73 TABLE 1.0 Analysis of Variance in District Elections by Numbers of Votes Cast, Number of Candidates, Number of Political Parties, Percentage Electoral Margin or Vote Share of Winning Candidate, Republican, Democrat, and Other Partisan Registration, Percentage Republican, Democrat, NPP Primary Election Vote Share, and Percentage Republican, Democrat, NPP General Election Vote Share Measure Levene Statistic P(F)< F-Test P(F)< 2 Votes Cast Number of Candidates Number of Political Parties Electoral Margin Republican Democrat other Republican Primary Democrat Primary Nonpartisan Primary Republican General Democrat General Nonpartisan General d. f. 1 = 3, d. f. 2 =
74 73
75 74
76 75
77 76
78 77
79 78
80 TABLE 2.0 Measures of Equality of the Distribution of Voter Registration, Primary Election, & General Election Voting Shares Measure Dem % Rep % Dem Primary Vote Rep Primary Vote Dem General Election Atkinson epsilon = Rep General Election Atkinson epsilon = relative mean deviation coefficient of variation standard deviation of logs Gini Coefficient Mehran measure Piesch measure Kakwani measure Theil entropy measure Theil mean log deviation
81 TABLE 3.1 Descriptive Analysis of Democrat and Republican General Election Vote %, Primary Election Vote %, Partisan Registration % TABLE 3.2 Descriptive Analysis of Third Party General & Primary Election Vote % TABLE 3.3 Nonpartisan General & Primary Election Vote %, Other Registration % 80
82 TABLE 3.4 Descriptive Analysis of Winning Margin %, Number of Candidates, Number of Political Parties, and Herfindahl Concentration Ratios of Partisan Registration %s, Primary Vote Share %s, & General Election Vote Share %s 81
83 82
84 83
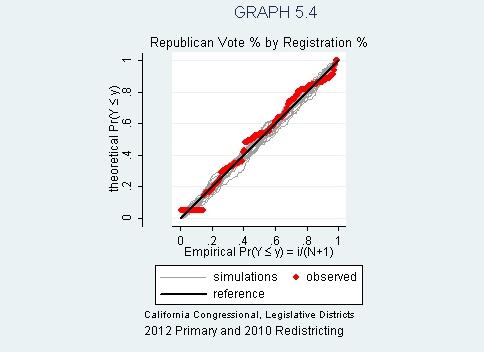
85 84
Primary Election Systems. An LWVO Study
 Primary Election Systems An LWVO Study CONSENSUS QUESTIONS with pros and cons Question #1. What do you believe is the MORE important purpose of primary elections? a. A way for political party members alone
Connecticut Republican. State Central Committee. Rules and Bylaws
 Connecticut Republican State Central Committee Rules and Bylaws Index Page Article I: State Central Committee 2 Article II: Town Committee 14 Article III: State Conventions 21 Article IV: District Conventions
Partisan Advantage and Competitiveness in Illinois Redistricting
 Partisan Advantage and Competitiveness in Illinois Redistricting An Updated and Expanded Look By: Cynthia Canary & Kent Redfield June 2015 Using data from the 2014 legislative elections and digging deeper
TOP TWO CANDIDATES OPEN PRIMARY ACT
 TOP TWO CANDIDATES OPEN PRIMARY ACT BACKGROUND On June 8, 2010, California voters approved Proposition 14, which created the Top Two Candidates Open Primary Act. Allows all voters to choose any candidate
Designing Weighted Voting Games to Proportionality
 Designing Weighted Voting Games to Proportionality In the analysis of weighted voting a scheme may be constructed which apportions at least one vote, per-representative units. The numbers of weighted votes
To understand the U.S. electoral college and, more generally, American democracy, it is critical to understand that when voters go to the polls on
 To understand the U.S. electoral college and, more generally, American democracy, it is critical to understand that when voters go to the polls on Tuesday, November 8th, they are not voting together in
Oregon Progressive Party Position on Bill at 2017 Session of Oregon Legislature:
 March 23, 2017 411 S.W. 2nd Avenue Suite 200 Portland, OR 97204 503-548-2797 info@progparty.org Oregon Progressive Party Position on Bill at 2017 Session of Oregon Legislature: HB 2211: Oppose Dear Committee:
Federal Primary Election Runoffs and Voter Turnout Decline,
 Federal Primary Election Runoffs and Voter Turnout Decline, 1994-2010 July 2011 By: Katherine Sicienski, William Hix, and Rob Richie Summary of Facts and Findings Near-Universal Decline in Turnout: Of
CITIZEN ADVOCACY CENTER
 CITIZEN ADVOCACY CENTER Congressional Redistricting: Understanding How the Lines are Drawn LESSON PLAN AND ACTIVITIES All rights reserved. No part of this lesson plan may be reproduced in any form or by
PARTISANSHIP AND WINNER-TAKE-ALL ELECTIONS
 Number of Representatives October 2012 PARTISANSHIP AND WINNER-TAKE-ALL ELECTIONS ANALYZING THE 2010 ELECTIONS TO THE U.S. HOUSE FairVote grounds its analysis of congressional elections in district partisanship.
CHAPTER 9: Political Parties
 CHAPTER 9: Political Parties Reading Questions 1. The Founders and George Washington in particular thought of political parties as a. the primary means of communication between voters and representatives.
Julie Lenggenhager. The "Ideal" Female Candidate
 Julie Lenggenhager The "Ideal" Female Candidate Why are there so few women elected to positions in both gubernatorial and senatorial contests? Since the ratification of the nineteenth amendment in 1920
Utah Citizens Initiative Petition
 Utah Citizens Initiative Petition www.countmyvoteutah.org Mission: Every vote should count All Utah voters should Have a voice Count My Vote is a non-partisan, broad-based effort to IMPROVE participation
Rules of The Republican Party of The Town of Darien, Connecticut
 Rules of The Republican Party of The Town of Darien, Connecticut (Filename:Darien RTC Rules 2014 Website) Rules of the Republican Party of the Town of Darien, Connecticut Table of Contents ARTICLE I: PURPOSES...
Testimony of FairVote The Center for Voting and Democracy Jack Santucci, Program for Representative Government. October 16, 2006
 Testimony of FairVote The Center for Voting and Democracy Jack Santucci, Program for Representative Government Given in writing to the Assembly Standing Committee on Governmental Operations and Assembly
Texas Elections Part I
 Texas Elections Part I In a society governed passively by free markets and free elections, organized greed always defeats disorganized democracy. Matt Taibbi Elections...a formal decision-making process
AP US GOVERNMENT: CHAPER 7: POLITICAL PARTIES: ESSENTIAL TO DEMOCRACY
 AP US GOVERNMENT: CHAPER 7: POLITICAL PARTIES: ESSENTIAL TO DEMOCRACY Before political parties, candidates were listed alphabetically, and those whose names began with the letters A to F did better than
Name: Class: Date: ID: A
 Class: Date: Chapter 5 Test Matching IDENTIFYING KEY TERMS Match each item with the correct statement below. You will not use all the terms. Some terms may be used more than once. a. coalition b. political
SOUPER SUPPER and CONSENSUS MEETING ON PRIMARY ELECTIONS
 The Voter Newsletter of LEAGUE OF WOMEN VOTERS OF BOWLING GREEN OHIO January 2017 PO Box 873 Bowling Green OH 43402 www.wcnet.org/~lwvbg SOUPER SUPPER and CONSENSUS MEETING ON PRIMARY ELECTIONS Tuesday
Political Parties. Chapter 9
 Political Parties Chapter 9 Political Parties What Are Political Parties? Political parties: organized groups that attempt to influence the government by electing their members to local, state, and national
Purposes of Elections
 Purposes of Elections o Regular free elections n guarantee mass political action n enable citizens to influence the actions of their government o Popular election confers on a government the legitimacy
EXAM: Parties & Elections
 AP Government EXAM: Parties & Elections Mr. Messinger INSTRUCTIONS: Mark all answers on your Scantron. Do not write on the test. Good luck!! 1. All of the following are true of the Electoral College system
Empowering Moderate Voters Implement an Instant Runoff Strategy
 Empowering Moderate Voters Implement an Instant Runoff Strategy Rep. John Porter Summary U.S. elections and the conduct of elected representatives in recent years have been characterized by excessive partisanship
Putting an end to Gerrymandering in Ohio: A new citizens initiative
 Putting an end to Gerrymandering in Ohio: A new citizens initiative Gerrymandering is the practice of stacking the deck in favor of the candidates of one party and underrepresenting its opponents by drawing
POSITIONS FROM OTHER LEAGUES
 POSITIONS FROM OTHER LEAGUES A5.1 LEAGUE OF WOMEN VOTERS STATE POSITIONS A5.1.1 ARIZONA The League of Women Voters of Arizona believes in the election system principle of greater vote representation. The
The Georgia Green Party Nominating Convention Rules & Regulations
 The Georgia Green Party Nominating Convention Rules & Regulations as adopted by consensus, May 4, 1996, and as amended by Council, 4/23/98, 11/24/98, 12/12/98, 5/1/00, 4/16/01, 6/10/01, 8/18/01, 12/15/02,
Federal Primary Election Runoffs and Voter Turnout Decline,
 Federal Primary Election Runoffs and Voter Turnout Decline, 1994-2012 July 2013 Summary of Facts and Findings Near-Universal Decline in Turnout: Of 171 regularly scheduled primary runoffs in U.S House
Possible voting reforms in the United States
 Possible voting reforms in the United States Since the disputed 2000 Presidential election, there have numerous proposals to improve how elections are conducted. While most proposals have attempted to
Discussion Guide for PRIMARIES in MARYLAND: Open vs. Closed? Top Two/Four or by Party? Plurality or Majority? 10/7/17 note without Fact Sheet bolded
 Discussion Guide for PRIMARIES in MARYLAND: Open vs. Closed? Top Two/Four or by Party? Plurality or Majority? DL: Discussion Leader RP: if also have Resource Person from Study 10/7/17 note: It takes about
Congressional Elections, 2018 and Beyond
 Congressional Elections, 2018 and Beyond Robert S. Erikson Columbia University 2018 Conference by the Hobby School of Public Affairs, University of Houston Triple Play: Election 2018; Census 2020; and
WHERE WE STAND.. ON REDISTRICTING REFORM
 WHERE WE STAND.. ON REDISTRICTING REFORM REDRAWING PENNSYLVANIA S CONGRESSIONAL AND LEGISLATIVE DISTRICTS Every 10 years, after the decennial census, states redraw the boundaries of their congressional
APGAP Reading Quiz 2A AMERICAN POLITICAL PARTIES
 1. Which of the following is TRUE of political parties in the United States? a. Parties require dues. b. Parties issue membership cards to all members. c. Party members agree on all major issues or they
THE NOMINATING PROCESS
 THE NOMINATING PROCESS There are 5 major ways in which nominations can be made. VUS6b NOMINATIONS This is one of the important functions of political parties. A nomination is the official naming of the
WISCONSIN SUPREME COURT ELECTIONS WITH PARTISANSHIP
 The Increasing Correlation of WISCONSIN SUPREME COURT ELECTIONS WITH PARTISANSHIP A Statistical Analysis BY CHARLES FRANKLIN Whatever the technically nonpartisan nature of the elections, has the structure
Redrawing the Map: Redistricting Issues in Michigan. Jordon Newton Research Associate Citizens Research Council of Michigan
 Redrawing the Map: Redistricting Issues in Michigan Jordon Newton Research Associate Citizens Research Council of Michigan 2 Why Does Redistricting Matter? 3 Importance of Redistricting District maps have
Competitiveness of Legislative Elections in the United States: Impact of Redistricting Reform and Nonpartisan Elections
 Competitiveness of Legislative Elections in the United States: Impact of Redistricting Reform and Nonpartisan Elections Introduction Anti competitive state laws detract from the power and purpose of elections
Chapter 5: Political Parties Section 1
 Chapter 5: Political Parties Section 1 Objectives 1. Define a political party. 2. Describe the major functions of political parties. 3. Identify the reasons why the United States has a two-party system.
DEMOCRATS DIGEST. A Monthly Newsletter of the Conference of Young Nigerian Democrats. Inside this Issue:
 DEMOCRATS DIGEST A Monthly Newsletter of the Conference of Young Nigerian Democrats Inside this Issue: Primary Election I INTRODUCTION Primary Election, preliminary election in which voters select a political
TOP TWO PRIMARY By Harry Kresky, openprimaries.org INTRODUCTION
 TOP TWO PRIMARY By Harry Kresky, openprimaries.org INTRODUCTION Much of the debate about various political reforms focuses on outcomes does the reform in question bring about the desired results. There
Elections and Voting Behavior
 Elections and Voting Behavior Running for Office: 4 step process Presidential election process: Nomination caucus/primary national convention general election slate of candidates election held with in
Battleground 59: A (Potentially) Wasted Opportunity for the Republican Party Republican Analysis by: Ed Goeas and Brian Nienaber
 Wasted Opportunity for the Republican Party Republican Analysis by: Ed Goeas and Brian Nienaber") Battleground 59: A (Potentially) Wasted Opportunity for the Republican Party Republican Analysis by: Ed Goeas and Brian Nienaber In what seems like so long ago, the 2016 Presidential Election cycle began
Battleground 59: A (Potentially) Wasted Opportunity for the Republican Party Republican Analysis by: Ed Goeas and Brian Nienaber In what seems like so long ago, the 2016 Presidential Election cycle began
A positive correlation between turnout and plurality does not refute the rational voter model
 Quality & Quantity 26: 85-93, 1992. 85 O 1992 Kluwer Academic Publishers. Printed in the Netherlands. Note A positive correlation between turnout and plurality does not refute the rational voter model
Amy Tenhouse. Incumbency Surge: Examining the 1996 Margin of Victory for U.S. House Incumbents
 Amy Tenhouse Incumbency Surge: Examining the 1996 Margin of Victory for U.S. House Incumbents In 1996, the American public reelected 357 members to the United States House of Representatives; of those
Illinois Redistricting Collaborative Talking Points Feb. Update
 Goals: Illinois Redistricting Collaborative Talking Points Feb. Update Raise public awareness of gerrymandering as a key electionyear issue Create press opportunities on gerrymandering to engage the public
The Center for Voting and Democracy
 The Center for Voting and Democracy 6930 Carroll Ave., Suite 610 Takoma Park, MD 20912 - (301) 270-4616 (301) 270 4133 (fax) info@fairvote.org www.fairvote.org To: Commission to Ensure Integrity and Public
Applying Ranked Choice Voting to Congressional Elections. The Case for RCV with the Top Four Primary and Multi-Member Districts. Rob Richie, FairVote
 Applying Ranked Choice Voting to Congressional Elections The Case for RCV with the Top Four Primary and Multi-Member Districts Rob Richie, FairVote American Exceptionalism: Inescapable Realities for Reformers
ELECTION SYSTEMS. Plurality-Majority
 ELECTION SYSTEMS (The following mini-study Kit was written as an insert for the Sacramento VOTER. A member of that League, Pete Martineau, also an Election Systems study committee member, authored the
Political Attitudes &Participation: Campaigns & Elections. State & Local Government POS 2112 Ch 5
 Political Attitudes &Participation: Campaigns & Elections State & Local Government POS 2112 Ch 5 Votes for Women, inspired by Katja Von Garner. http://www.youtube.com/watch?v=lvqnjwkw7ga We will examine:
Fair Representation and the Voting Rights Act. Remedies for Racial Minority Vote Dilution Claims
 Fair Representation and the Voting Rights Act Remedies for Racial Minority Vote Dilution Claims Introduction Fundamental to any representative democracy is the right to an effective vote. In the United
The Midterm Elections (And a Peek Toward 2016) Andrew H. Friedman The Washington Update
 Andrew H. Friedman The Washington Update") The Midterm Elections (And a Peek Toward 2016) Andrew H. Friedman The Washington Update With fiscal deadlines out of the way for 2014, attention is now turning toward the 2014 midterm elections. This white
The Midterm Elections (And a Peek Toward 2016) Andrew H. Friedman The Washington Update With fiscal deadlines out of the way for 2014, attention is now turning toward the 2014 midterm elections. This white
Chapter 7 Political Parties: Essential to Democracy
 Key Chapter Questions Chapter 7 Political Parties: Essential to Democracy 1. What do political parties do for American democracy? 2. How has the nomination of candidates changed throughout history? Also,
Bylaws of the Libertarian Party of Ohio
 The bylaws of the Libertarian Party of Ohio (the Party ), Ohio s official affiliate of the national Libertarian Party, govern its operating guidelines and promote the cause of liberty. The Constitution
9 Advantages of conflictual redistricting
 9 Advantages of conflictual redistricting ANDREW GELMAN AND GARY KING1 9.1 Introduction This article describes the results of an analysis we did of state legislative elections in the United States, where
Forecasting the 2018 Midterm Election using National Polls and District Information
 Forecasting the 2018 Midterm Election using National Polls and District Information Joseph Bafumi, Dartmouth College Robert S. Erikson, Columbia University Christopher Wlezien, University of Texas at Austin
EXTENDING THE SPHERE OF REPRESENTATION:
 EXTENDING THE SPHERE OF REPRESENTATION: THE IMPACT OF FAIR REPRESENTATION VOTING ON THE IDEOLOGICAL SPECTRUM OF CONGRESS November 2013 Extend the sphere, and you take in a greater variety of parties and
Campaigns & Elections. US Government POS 2041
 Campaigns & Elections US Government POS 2041 Votes for Women, inspired by Katja Von Garner. http://www.youtube.com/watch?v=lvqnjwk W7gA For Discussion Do you think that democracy is endangered by the
CITIZEN ADVOCACY CENTER
 CITIZEN ADVOCACY CENTER Voting Systems: What is Fair? LESSON PLAN AND ACTIVITIES All rights reserved. No part of this lesson plan may be reproduced in any form or by any electronic or mechanical means
ELECTING CANDIDATES WITH FAIR REPRESENTATION VOTING: RANKED CHOICE VOTING AND OTHER METHODS
 November 2013 ELECTING CANDIDATES WITH FAIR REPRESENTATION VOTING: RANKED CHOICE VOTING AND OTHER METHODS A voting system translates peoples' votes into seats. Because the same votes in different systems
Patrick J. Lingane February 7, 2008 A Letter to the Author Improvements to Spitzer s Chapter on Elections
 Patrick J. Lingane February 7, 2008 A Letter to the Author Improvements to Spitzer s Chapter on Elections Although Spitzer (et al.), in the sixth chapter of their book Essentials of American Politics,
connect the people to the government. These institutions include: elections, political parties, interest groups, and the media.
 Overriding Questions 1. How has the decline of political parties influenced elections and campaigning? 2. How do political parties positively influence campaigns and elections and how do they negatively
 LEARNING OBJECTIVES After studying Chapter 10, you should be able to: 1. Explain the functions and unique features of American elections. 2. Describe how American elections have evolved using the presidential
Rules of the Republican Party of The Town of Darien, Connecticut
 Rules of the Republican Party of The Town of Darien, Connecticut The Rules of the Darien Republican Town Committee Table of Contents PREAMBLE... 1 ARTICLE I: THE DARIEN REPUBLICAN TOWN COMMITTEE ( DARIEN
Chapter 2 The Electoral College Today
 Chapter 2 The Electoral College Today Abstract Today s Electoral College and the one created by the Founding Fathers are two different election mechanisms. The Founding Fathers might have expected that
Candidate s Handbook for the June 7, Presidential Primary Election
 Candidate s Handbook for the June 7, 2016 2016 Presidential Primary Election Orange County Registrar of Voters 1300 S. Grand Avenue, Bldg. C Santa Ana, CA 92705 714-567-7600 Visit ocvote.com/candidates
Moral Values Take Back Seat to Partisanship and the Economy In 2004 Presidential Election
 Moral Values Take Back Seat to Partisanship and the Economy In 2004 Presidential Election Lawrence R. Jacobs McKnight Land Grant Professor Director, 2004 Elections Project Humphrey Institute University
Introduction What are political parties, and how do they function in our two-party system? Encourage good behavior among members
 Chapter 5: Political Parties Section 1 Objectives Define a political party. Describe the major functions of political parties. Identify the reasons why the United States has a two-party system. Understand
CH. 9 ELECTIONS AND CAMPAIGNS
 APGoPo - Unit 3 CH. 9 ELECTIONS AND CAMPAIGNS Elections form the foundation of a modern democracy, and more elections are scheduled every year in the United States than in any other country in the world.
What to Do about Turnout Bias in American Elections? A Response to Wink and Weber
 What to Do about Turnout Bias in American Elections? A Response to Wink and Weber Thomas L. Brunell At the end of the 2006 term, the U.S. Supreme Court handed down its decision with respect to the Texas
- 1 - Second Exam American Government PSCI Fall, 2001
 Second Exam American Government PSCI 1201-001 Fall, 2001 Instructions: This is a multiple choice exam with 40 questions. Select the one response that best answers the question. True false questions should
DRAFT GPCA ELECTIONS CODE SECTIONS PROPOSED REVISIONS NOV. 3, 2005
 DRAFT GPCA ELECTIONS CODE SECTIONS PROPOSED REVISIONS NOV. 3, 2005 DIVISION 6. PRESIDENTIAL ELECTIONS PART 1. PARTISAN PRESIDENTIAL PRIMARIES Chapter 5 (commencing with Section 6960) is added to Part 1
Electoral College Reform: Evaluation and Policy Recommendations
 Electoral College Reform: Evaluation and Policy Recommendations Albert Qian, Alex Hider, Amanda Khan, Caroline Reisch, Madeline Goossen, and Araksya Nordikyan Research Question What are alternative ways
Chapter 9: Political Parties, Elections, and Campaigns Test Bank
 Chapter 9: Political Parties, Elections, and Campaigns Test Bank Multiple Choice 1. Although parties may seem strong in California because three-quarters of registered Californians belong to a political
Voting in Maine s Ranked Choice Election. A non-partisan guide to ranked choice elections
 Voting in Maine s Ranked Choice Election A non-partisan guide to ranked choice elections Summary: What is Ranked Choice Voting? A ranked choice ballot allows the voter to rank order the candidates: first
TEMPORARY & PROPOSED RULES SENATE DISTRICT 34 DFL CONVENTION
 TEMPORARY & PROPOSED RULES SENATE DISTRICT 34 DFL CONVENTION GOVERNING AUTHORITY AND AGENDA 1. Upon all matters not governed by the Official Call, the State DFL Party Constitution and Bylaws, the Senate
The second step of my proposed plan involves breaking states up into multi-seat districts.
 Multi-Seat Districts The second step of my proposed plan involves breaking states up into multi-seat districts. This will obviously be easy to do, and to understand, in a small, densely populated state
An Increased Incumbency Effect: Reconsidering Evidence
 part i An Increased Incumbency Effect: Reconsidering Evidence chapter 1 An Increased Incumbency Effect and American Politics Incumbents have always fared well against challengers. Indeed, it would be surprising
UNIVERSITY OF MASSACHUSETTS LOWELL MASSACHUSETTS U.S. SENATE POLL Sept , ,005 Registered Voters (RVs)
") UNIVERSITY OF MASSACHUSETTS LOWELL MASSACHUSETTS U.S. SENATE POLL Sept. 22-28, 2011-1,005 Registered Voters (RVs) Sampling error on full sample is +/- 3.8 percentage points, larger for subgroups and for
UNIVERSITY OF MASSACHUSETTS LOWELL MASSACHUSETTS U.S. SENATE POLL Sept. 22-28, 2011-1,005 Registered Voters (RVs) Sampling error on full sample is +/- 3.8 percentage points, larger for subgroups and for
Chapter 6: Public Opinion and Political Action Topics Key Questions Key Terms. on American politics.
 Chapter 1: Introduction to Government Government Identify the key functions of government and explain why they matter. political participation Politics The Policymaking System Democracy in America Define
Fair Division in Theory and Practice
 Fair Division in Theory and Practice Ron Cytron (Computer Science) Maggie Penn (Political Science) Lecture 5b: Alternative Voting Systems 1 Increasing minority representation Public bodies (juries, legislatures,
Election Campaigns GUIDE TO READING
 Election Campaigns GUIDE TO READING Main Idea Every two years for Congress and every four years for the president, voters respond to political campaigns by going to the polls and casting their ballots.
ILLINOIS (status quo)
") (status quo) KEY POINTS: The state legislature draws congressional districts, subject only to federal constitutional and statutory limitations. The legislature also has the first opportunity to draw state
(status quo) KEY POINTS: The state legislature draws congressional districts, subject only to federal constitutional and statutory limitations. The legislature also has the first opportunity to draw state
Voter turnout in today's California presidential primary election will likely set a record for the lowest ever recorded in the modern era.
 THE FIELD POLL THE INDEPENDENT AND NON-PARTISAN SURVEY OF PUBLIC OPINION ESTABLISHED IN 1947 AS THE CALIFORNIA POLL BY MERVIN FIELD Field Research Corporation 601 California Street, Suite 900 San Francisco,
Colorado 2014: Comparisons of Predicted and Actual Turnout
 Colorado 2014: Comparisons of Predicted and Actual Turnout Date 2017-08-28 Project name Colorado 2014 Voter File Analysis Prepared for Washington Monthly and Project Partners Prepared by Pantheon Analytics
When Is Cumulative Voting Preferable To Single- Member Districting?
 Touro College Jacob D. Fuchsberg Law Center From the SelectedWorks of Michael E Lewyn April, 1995 When Is Cumulative Voting Preferable To Single- Member Districting? Michael E Lewyn, Florida Coastal School
Presidential Race Nip and Tuck in Michigan
 SOSS Bulletin Preliminary Draft 1.1 Presidential Race Nip and Tuck in Michigan Darren W. Davis Professor of Political Science Brian D. Silver Director of the State of the State Survey (SOSS) and Professor
Iowa Voting Series, Paper 6: An Examination of Iowa Absentee Voting Since 2000
 Department of Political Science Publications 5-1-2014 Iowa Voting Series, Paper 6: An Examination of Iowa Absentee Voting Since 2000 Timothy M. Hagle University of Iowa 2014 Timothy M. Hagle Comments This
Political Parties CHAPTER. Roles of Political Parties
 CHAPTER 9 Political Parties IIN THIS CHAPTERI Summary: Political parties are voluntary associations of people who seek to control the government through common principles based upon peaceful and legal
Candidate s Handbook. for the June 5, 2018 Statewide Direct Primary Election
 Candidate s Handbook for the June 5, 2018 Statewide Direct Primary Election Orange County Registrar of Voters 1300 S. Grand Avenue, Bldg. C Santa Ana, CA 92705 714-567-7600 Your vote. Our responsibility.
THE CALIFORNIA LEGISLATURE: SOME FACTS AND FIGURES. by Andrew L. Roth
 THE CALIFORNIA LEGISLATURE: SOME FACTS AND FIGURES by Andrew L. Roth INTRODUCTION The following pages provide a statistical profile of California's state legislature. The data are intended to suggest who
BLISS INSTITUTE 2006 GENERAL ELECTION SURVEY
 BLISS INSTITUTE 2006 GENERAL ELECTION SURVEY Ray C. Bliss Institute of Applied Politics The University of Akron Executive Summary The Bliss Institute 2006 General Election Survey finds Democrat Ted Strickland
A New Electoral System for a New Century. Eric Stevens
 A New Electoral System for a New Century Eric There are many difficulties we face as a nation concerning public policy, but of these difficulties the most pressing is the need for the reform of the electoral
CRS Report for Congress
 Order Code RS20273 Updated September 8, 2003 CRS Report for Congress Received through the CRS Web The Electoral College: How It Works in Contemporary Presidential Elections Thomas H. Neale Government and
CRS Report for Congress Received through the CRS Web
 CRS Report for Congress Received through the CRS Web Order Code RS20273 Updated January 17, 2001 The Electoral College: How it Works in Contemporary Presidential Elections Thomas H. Neale Analyst, American
The RULES OF THE COBB COUNTY REPUBLICAN COMMITTEE. Adopted March 20, 1999 Last Amended October 24, 2017 March 6, 2018
 The RULES OF THE COBB COUNTY REPUBLICAN COMMITTEE Adopted March 20, 1999 Last Amended October 24, 2017 March 6, 2018 1 Table of Contents 1 2 3 4 5 6 7 8 9 10 11 12 13 14 15 16 17 18 19 20 21 22 23 24 25
2017 CAMPAIGN FINANCE REPORT
 2017 CAMPAIGN FINANCE REPORT PRINCIPAL AUTHORS: LONNA RAE ATKESON PROFESSOR OF POLITICAL SCIENCE, DIRECTOR CENTER FOR THE STUDY OF VOTING, ELECTIONS AND DEMOCRACY, AND DIRECTOR INSTITUTE FOR SOCIAL RESEARCH,
9. Some industries like oil and gas companies largely support candidates. A) Democrats B) Republicans C) Libertarians D) Independent candidates
 Democrats B) Republicans C) Libertarians D) Independent candidates") Name: Date: 1. is the constitutional clause that delegates control of elections to the state governments. A) Time, place, and manner clause B) Time and place clause C) Time clause D) Election clause 2.
Name: Date: 1. is the constitutional clause that delegates control of elections to the state governments. A) Time, place, and manner clause B) Time and place clause C) Time clause D) Election clause 2.
Ivy Global. Reading Passage 3: History with Graph Practice for the New SAT (2016)
") Reading Passage 3: History with Graph Practice for the New SAT (2016) Problem Set 3: 11 Questions Reading: Social Science/History Passage with Graph Line 5 10 15 20 25 30 35 Questions 23-33 are based on
Reading Passage 3: History with Graph Practice for the New SAT (2016) Problem Set 3: 11 Questions Reading: Social Science/History Passage with Graph Line 5 10 15 20 25 30 35 Questions 23-33 are based on
Why are there only two major parties in US? [party attachments below]
![Why are there only two major parties in US? [party attachments below]](/thumbs/75/72155264.jpg "Why are there only two major parties in US? [party attachments below]") Why are there only two major parties in US? [party attachments below] A. Institutional Constraints on 3 rd Parties 1. Election System Single-member districts (SMDs) Winner-take-all first-past-the-post
Why are there only two major parties in US? [party attachments below] A. Institutional Constraints on 3 rd Parties 1. Election System Single-member districts (SMDs) Winner-take-all first-past-the-post
Texas Voting & Elections (Chapter 04) Dr. Michael Sullivan. Texas State Government GOVT 2306 Houston Community College
 Dr. Michael Sullivan. Texas State Government GOVT 2306 Houston Community College") Texas Voting & Elections (Chapter 04) Dr. Michael Sullivan Texas State Government GOVT 2306 Houston Community College AGENDA 1. Current Events 2. Political Participation in Texas 3. Voting Trends 4. Summary
Texas Voting & Elections (Chapter 04) Dr. Michael Sullivan Texas State Government GOVT 2306 Houston Community College AGENDA 1. Current Events 2. Political Participation in Texas 3. Voting Trends 4. Summary
Official Call Revised 2 December 2017, Rev B. of the Democratic-Farmer-Labor Party of Minnesota CAUCUS, CONVENTION AND ELECTION DATES
 Revised 2 December 2017, Rev B 2018-2019 Official Call of the Democratic-Farmer-Labor Party of Minnesota CAUCUS, CONVENTION AND ELECTION DATES Minnesota DFL State Central Committee 651-293-1200 1-800-999-7457