ASIAN AMERICAN STUDIES INSTITUTE
|
|
|
- Dora Stone
- 5 years ago
- Views:
Transcription

1 ASIAN AMERICAN STUDIES INSTITUTE ASIAN AMERICANS IN CONNECTICUT CENSUS 2 RACE, ETHNICITY, HOUSEHOLD AND FAMILY RESEARCH PAPER SERIES Volume 3, Number 1 Fall 24 UNIVERSITY OF CONNECTICUT
2 ASIAN AMERICANS IN CONNECTICUT CENSUS 2 RACE, ETHNICITY, HOUSEHOLD AND FAMILY By Anjana Narayan and Debarashmi Mitra Data Source: U.S. Census 2 Maps by Paul Fernald Series Editor: Bandana Purkayastha, Ph.D. Asian American Studies Institute University of Connecticut
3 Dear Reader, FOREWORD In pursuit of its mission to document the history and current state of the Asian American community in Connecticut, the University of Connecticut s Asian American Studies Institute is pleased to present this sophisticated and authoritative demographic report. It is a follow-up to ASIANS IN CONNECTICUT: A DEMOGRAPHIC FACT BOOK (Volume I), which was based on the 199 Census. Its authors are two doctoral candidates in the Department of Sociology, Debarashmi Mitra and Anjana Narayan, who worked with series editor Dr. Bandana Purkayastha, Assistant Professor of Asian American Studies and Sociology. The third volume in this series on the Asian American presence in Connecticut, this report is based on a vast amount of data gleaned from the currently available data from the Census 2 and the data generously shared by Dr. John Logan of SUNY Albany, from the Lewis Mumford Center. In setting the stage for this timely study, the authors define what is meant by "Asian Americans" and present a comparison between the 199 and 2 Census as it pertains to Connecticut s Asian American community. Next they turn to the objective of the report, it s organization, and its limitations. The authors offer rich chapters, each with impressive empirical strength, on "Race and Ethnicity", "Household and Family" and "Racial Composition and Poverty Profiles in Metropolitan Area Schools". The report s analysis highlights a number of important points, among them the rapid growth of the Asian American community, particularly Asian Indians. The core of this report is an impressive number of superbly crafted tables, maps, figures and connected explanatory essays. Thanks to their skillful reading of the Census data and other sources, their impressive mastery of wealth of data from primary and secondary sources, the authors have made an invaluable contribution of Asian American studies. In so doing, the authors have produced a work that will be worthy of interest to both specialists and generalists. This study and the forthcoming supplements will contribute to the body of research on ethnicity, gender, family and the history of the State of Connecticut. I have no doubt that the depth of their research will also vitalize studies on Asian Americans and cause scholars and students to rethink class and ethnic identities and the cultural hierarchies within which they have been constructed. Please share this publication with your friends and colleagues. Those interested in obtaining copies of this as well as other publications can place their orders by calling (86) Cordially, Roger N. Buckley Director, Asian American Studies Institute
4 TABLE OF CONTENTS Introduction 1 Summary 5 Race and Ethnicity I. Population by Race in Connecticut 7-11 II. Asian American Ethnic Groups in Connecticut 13-2 III. Population Under 18 for the Metropolitan Statistical Areas in Connecticut Household and Family I. Asian American Households in Connecticut 25-3 II. Asian American Families in Connecticut III. Living Arrangement of Asian Americans by Group Quarters 33 Racial Composition and Poverty Profiles in Metropolitan Area Schools I. Ethnic and Racial Composition in Schools II. Poor (%) in the Schools in Metropolitan Statistical Areas Appendices Appendix 1. Asian American Population (%)- Regional Distribution: 2 43 Appendix 2. Asian American Population in U.S Appendix 3. Asian American Population (%)- State-wise Distribution: Appendix 4. Ten Largest Places in Total Population and in Asian American Population: 2 45 Appendix 5. Ten Places with Highest Percentage of Asian American Population 45 Appendix 6. Asian American Population by Detailed Group: 2 46 Appendix 7. English Language Proficiency of Asian Americans and Pacific Islanders 47
5 Appendix 8. Sex by Occupation for the Employed Civilian Population 16 Years and Over Asian American : Appendix 9. Poverty Status in the Past 12 months by Age - Asian Americans 5 Glossary References 57 List of Figures Figure 1. Population by Race in Connecticut 7 Figure 2. Asian American Population in Connecticut, Combination of Races 8 Figure 3. Asian American Population, Two or More Races 9 Figure 4. Asian American Population, Three or More Races 9 Figure 5. Asian American Population, Four or More Races 1 Figure 6. Asian American Population, Five or More Races 1 Figure 7. Asian Americans with Ethnic Group Affiliation for Connecticut 11 (Selected Groups) Figure 8. Asian Americans by Ethnicity for Connecticut 13 Figure 9. Asian Americans by Ethnicity for Fairfield County, CT 14 Figure 1. Asian Americans by Ethnicity for Hartford County, CT 14 Figure 11. Asian Americans by Ethnicity for New Haven County, CT 15 Figure 12. Asian Americans by Ethnicity for Litchfield County, CT 15 Figure 13. Asian Americans by Ethnicity for Middlesex County, CT 16 Figure 14. Asian Americans by Ethnicity for New London County, CT 16 Figure 15. Asian Americans by Ethnicity for Tolland County, CT 17 Figure 16. Asian Americans by Ethnicity for Windham County, CT 17 Figure 17. Asian Americans by Cities- Danbury, PMSA 18 Figure 18. Asian Americans by Cities- Hartford, PMSA 18 Figure 19. Asian Americans by Cities- New Haven, PMSA 19 Figure 2. Asian Americans by Cities- New London, PMSA 19
6 Figure 21. Asian Americans by Cities- Stamford-Norwalk, PMSA 2 Figure 22. Asian Americans by Cities- Waterbury, PMSA 2 Figure 23. Bridgeport, PMSA 21 Figure 24. Danbury, PMSA 21 Figure 25. Hartford, MSA 22 Figure 26. New Haven-Meriden, PMSA 22 Figure 27. New London-Norwich, RI MSA 23 Figure 28. Stamford-Norwalk, PMSA 23 Figure 29. Waterbury, PMSA 24 Figure 3. Multiracial Population Under Age 18 in Connecticut 24 Figure 31. Household Type by Household Size-Asian Americans 25 Figure 32. Race of Householder in Connecticut 26 Figure 33. Asian American Population in Occupied Housing Units by Tenure 27 Figure 34. Tenure by Race of Householder in Connecticut 28 Figure 35. Tenure by Age of Householder Asian Americans 29 Figure 36. Tenure by Household Size-Asian Americans 29 Figure 37. Non-Relatives by Household Type-Asian Americans 3 Figure 38. Asian American Families in Connecticut 31 Figure 39. Group Quarters by Sex by Age-Asian Americans 33 Figure 4. Bridgeport, PMSA 35 Figure 41. Danbury, PMSA 35 Figure 42. Hartford, MSA 36 Figure 43. New Haven-Meriden, PMSA 36 Figure 44. New London-Norwich, RI MSA 37 Figure 45. Stamford-Norwalk, PMSA 37 Figure 46. Waterbury, PMSA 38 Figure 47. Bridgeport, PMSA 39 Figure 48. Danbury, PMSA 4 Figure 49. Hartford, MSA 4 Figure 5. New Haven-Meriden, PMSA 41 Figure 51. New London-Norwich, RI MSA 41
7 Figure 52. Stamford-Norwalk, PMSA 42 Figure 53. Waterbury, PMSA 42 List of Tables Table 1. Comparison of Asian Americans (%) by Ethnic Groups Across PMSAs 2 Table 2. Asian American Children by Age Group in Connecticut 21 Table 3. Asian American Children by Age Group in U.S. 21 Table 4. Race of Householder in Connecticut 26 Table 5. Non Relatives by Family (Selected Groups), Connecticut 3 Table 6. Asian American Children Under Age 18 by Family Type in Connecticut 32 Table 7. Family Type and Ages of Children for Whites, African American and or Latino in Connecticut 32 List of Maps Connecticut Counties and Metropolitan Areas 59 Map 1. Asian American Ethnic Groups, Connecticut Counties 199/2 61 Map 2. Asian American Ethnic Groups, Connecticut Towns 2 63 Map 3. Asian American Population Under 18, Connecticut Metropolitan Areas 199/2 65
8 INTRODUCTION Who are Asian Americans? There is a lack of clear definition of who comprises Asian Americans. Asian Americans are interestingly viewed as a model minority referring to a homogeneous group with a relatively higher socio-economic status as compared to other minority ethnic groups in the United States. However, it is important to indicate right at the outset that contemporary Asian Americans are an extremely heterogeneous group of people whose ancestry can be traced to different countries in East, Southeast, and South Asia. Since the Census definition of Asian or Asian American has changed over the years, exactly who belongs to this pan ethno-racial group has changed through the 19 th and 2 th centuries. For instance, in 199, the United States Census Bureau used the broad term Asian and Pacific Islanders in its population count which includes Native Hawaiians, Samoans, Guamanians, etc. Researchers, on the other hand, often used the term Asian Americans to emphasize groups of Asian ancestry in the United States. This trend has been recognized by the 2 Census, which distinguishes Asians from Native Hawaiians and Pacific Islanders. This document focuses on the following detailed Asian and ethnic categories as reported in the Census 2 - Asian Indian, Bangladeshi American, Cambodian American, Chinese American except Taiwanese, Filipino American, Hmong American, Indonesian American, Japanese American, Korean American, Laotian American, Malaysian American, Pakistani American, Sri Lankan American, Taiwanese American, Thai American, Vietnamese American and other Asian Americans. Asian Americans: 199 and 2 Between 199 and 2, the Asian American population has nearly doubled from 7.2 million to 12.3 million. The same trend can be noticed with regard to the Asian American share to the total US population, which increased from 2.9 % to 4.4%. A comparison between the 199 and 2 Census indicates that the Chinese Americans are the largest group constituting 22.6 % and 22.3% respectively of the total Asian American population. The second prominent Asian American group is the Filipino Americans who made up 19.3 % of the Asian American population in 199 and 2. 1
9 Asian Indians comprise the third largest and the fastest growing Asian American group and have grown 133% over the last decade. Asian Americans in Connecticut The primary objective of this document is to present information on Asian Americans in Census 2 for the state of Connecticut. Like the US, Connecticut has a large proportion of Chinese and Filipino Americans. It has, however, a much larger proportion of Asian Indians. The Asian American population is widely dispersed all over the state. In general, Asian Americans in Connecticut include people who have been here for generations as well as recent immigrants. A large number are educated, professionally trained, and fairly affluent. The Asian Indians are among the most affluent ethnic group in Connecticut. The average family income for Connecticut's Asian Indian population is the highest among other Asian American ethnic groups with the Japanese Americans not far behind. The Cambodian Americans have the lowest average family income in Connecticut. (Radhakrishnan, 1999) Organization of the Report Given the ethnic, cultural, and economic diversity of Asian Americans, this report begins with a demographic profile. It features an overview and analysis of the latest data released on Asian Americans by the United States Census Bureau in 22. Although this report focuses on Asian Americans in the State of Connecticut, we have also highlighted significant information on Asian Americans in the United States. An important focus of the report also includes demographic changes that have occurred between the Census periods of 199 and 2. The report is organized into the following sections: Race and Ethnicity I. Population by Race in Connecticut II. Asian American Ethnic Groups in Connecticut III. Population Under 18 for the Metropolitan Statistical Areas in Connecticut 2
10 Household and Family I. Asian American Households in Connecticut II. Asian American Families in Connecticut III. Living Arrangement of Asian Americans by Group Quarters Racial composition and Poverty Profiles in Metropolitan Area Schools I. Ethnic and Racial Composition in Schools II. Poor (%) in the schools in Metropolitan Statistical Areas of Connecticut Limitations of the Report This report does not present data on income, employment, ethnic entrepreneurship, poverty, higher education, health, political participation, Asian Americans in media, gender, criminal activity, ancestry, citizenship, disability, educational attainment, income, industry, language spoken at home, marital status, migration, occupation, place of birth, and place of work. While some of the data on the above are available for Asian American ethnic groups in the US, the data on the State of Connecticut is yet to be released. However, we intend to update the report as soon as the State-wide Census Data for 2 is available. We hope this report will give the reader an insight into the multifaceted character of this fast growing population segment in Connecticut. 3
11 SUMMARY Asian Indians (29%) are the largest Asian American group in Connecticut followed by Chinese Americans (23%) and Filipino Americans (9%). Asian Indians, Chinese Americans and Filipino Americans together account for 61% of the total Asian American population in Connecticut. The total Asian American category has increased in 199 from 5,698 to 83,789 in 2. Fairfield County has the largest share (35%) of Asian American population. Hartford has the second largest (25%) and Windham County has the smallest proportion (1%) of Asian American population in Connecticut. Asian Indian population has increased in all the 8 counties between 199 and 2. Japanese American population has decreased in all the counties of Connecticut. Asian Indian is the largest ethnic group in all the Metropolitan areas in Connecticut except New Haven and New London, where Chinese Americans are the majority. The Asian American population under 18 is 21,372, which constitutes 2.5% of the total under-18 population (841,688) in Connecticut. Mansfield town ranks 1 st with 7.5% Asian American population under age 18. Among the Primary Metropolitan Statistical Area (PMSA) and the Metropolitan Statistical Area (MSA) in Connecticut, the population under age 18 in Stamford- Norwalk and Waterbury has nearly doubled. In 199, Asian American and Pacific Islanders made up 1% of the total householders in Connecticut, whereas Asian Americans alone comprise 2% of the total householders in Census 2 in Connecticut. Out of the total Asian American households in Connecticut, 74% are family households, whereas 26% are non-family households. In Connecticut, 56% of the Asian Americans population live in owner occupied households, whereas 44% are in renter occupied households. 5
12 44% Asian American nonrelatives are housemates or roommates, roomer or boarder, who live in family households. Majority (86%) of Asian American families are married - couple families. 5% are Asian American families with male householders with no wife present, whereas 9% are female householders with no husband present. The highest percent (9.1%) of Asian American children live in married couple families whereas the lowest (9.1%) of Asian American children, live in singleparent families. The majority of the Asian American population is noninstitutionalized. Hartford MSA has the largest number (3%) of all races of Asian American children in public schools in 2, whereas Waterbury PMSA has the least number (2%) of all races. The percentage of poor in the schools attended by Asian Americans in all the 7 PMSAs and MSAs is lower than the percentage of poor for non- African American and s. 6
13 I. RACE AND ETHNICITY: Population by Race in Connecticut FIGURE 1. POPULATION BY RACE IN CONNECTICUT 9% 2% % % 4% 2% The race data collected in Census 2 include six major categories: White African American American Indian and Alaska Native Asian American Native Hawaiian and Pacific Islander 83% White African American American Indian and Alaska Native Asian American Native Haw aiian and other Pacific Islander Some Other race alone Tw o or more races Some other race alone. The last category was included in Census 2 for respondents unable to identify with the other five race categories. (See Glossary) Source: U.S. Census Bureau, 2 The Census 2 also consists of a category, Two or more races, for individuals who chose more than one of the six race categories. Figure 1 shows that the number of respondents who identified as White is 83% (2,78,355)*. Approximately 9% (39,843)** identified as African Americans. The number of respondents reported as American Indian and Alaska Native and Native Hawaiian and other Pacific Islander is negligible approximating to % (9,639 and 1,366 respectively). The percentage of respondents who reported only Asian American is 2% (82,313) of the total population in Connecticut. Of the total United States population, 3.6% (1.2 million) are reported as Asian Americans. A comparison between the 199 and 2 Census indicates that the share of Asian American population in the total population in Connecticut remains unchanged at 2%. This is despite the change introduced in Census 2, which separates Asian Americans from Pacific Islanders. * White Population in Census 199 contributed 87% of the total State population. ** Black population in Census 199 was 8% of the total population in Connecticut. 7
14 FIGURE 2. ASIAN AMERICAN POPULATION IN CONNECTICUT COMBINATION OF RACES 9, 8, 7, 6, 5, 4, 3, 2, 1, Asian American alone 82,313 Two or more races 11,856 Population of four races Population of three races Population of six races Population of five races Source: U.S. Census Bureau 2 The racial categories of the earlier U.S. censuses made it extremely difficult to capture the diversity of any specific race. The same has been addressed by Census 2. The data collected by the Census 2 on race can be divided into two broad categories, based on race alone, and race in combination. People who responded to the question on race by indicating only one race are referred to as the race alone population. Individuals who reported more than one of the six races are referred to as the race in combination population. In keeping with the above categorization, the Asian American population in Census 2 is the total number of people who identified entirely or partially as Asians. Figure 2 shows respondents reporting Asian Americans alone constitute 87% (11,856) of the total Asian American population in Connecticut. Asian Americans in combination with Two or more races or Three or more races contribute to 12% and 1% respectively. As presented in Figure 2 Asian Americans who reported in combination with more than three races are very few in Connecticut. There has been an increase in the census figures of the Asian American population in the United States between 199 and 2 due to these changes on the question on race in Census 2. 8
15 FIGURE 3. ASIAN AMERICAN POPULATION TWO OR MORE RACES 2738 Of the total U.S. Population, 1.2 million people reported as only Asian American. An additional 1.7 million reported as Asian American in combination*. The most common combinations were Asian American and White (52%), Asian American and some other race (15%), Asian American and Native Hawaiian and other White; Asian American African American;Asian American American Indian and Alaska Native; Asian American Asian American ; Native Hawaiian and other Pacific Islander Asian American ; Some other Race Pacific Islander (8.4%), and Asian American and African American (6.4%). (Barnes and Bennett, 2) Similarly in Connecticut (Figure 3) the most common combination is Source: U.S. Census Bureau, 2 Asian American and White (62%) followed by FIGURE 4. ASIAN AMERICAN POPULATION THREE OR MORE RACES Asian American and White; African American;Asian American 191 White;American Indian and Alaska Native; Asian American White American;Asian;Native Hawaiian and other Pacific Islander White;Asian American;Some other Race some other race (23%), Asian American and African American (8%), Asian American and Native Hawaiian and other AfricanAmerican; American Indian and Alaska Native; AsianAmerican AfricanAmerican; Asian American; Native Hawaiian and other Pacific Islander AfricanAmerican; AsianAmerican;Some other Race Pacific Islander (4%), Asian American and American Indian and Alaska Native (3%). American Indian and Alaska Native; AsianAmerican;Native Hawaiian and other Pacific Islander American Indian and Alaska Native; AsianAmerican;Some other Race AsianAmerican;Native Hawaiian and other Pacific Islander;Some other Race For other combinations of races refer to Figures 4, 5, and 6. Source: U.S. Census Bureau, 2 9
16 FIGURE 5. ASIAN AMERICAN POPULATION FOUR OR MORE RACES White; African American;American Indian and Alaska Native; AsianAmerican White; African American;AsianAmerican; Native Hawaiian and other Pacific Islander White; African American;AsianAmerican;Some other Race White;American Indian and Alaska Native; AsianAmerican; Native Hawaiian and other Pacific Islander White;American Indian and Alaska Native; AsianAmerican;Some other Race White;Asian American;Native Hawaiian and other Pacific Islander;Some other Race 2 1 African American; American Indian and Alaska Native;Asian American; Native Hawaiian and other Pacific Islander African American;American Indian and Alaska Native; Asian American; Some other race African American;Asian American;Native Hawaiian and other Pacific Islander;Some other race Source: U.S. Census Bureau, 2 FIGURE 6. ASIAN AMERICAN POPULATION IN CONNECTICUT FIVE OR MORE RACES Source: U.S. Census Bureau, 2 Only 2 respondents in Connecticut reported in the category of six-races combination. 54 White;African American; American Indian and Alaska Native;AsianAmerican; Native Hawaiian and other pacific Islander White;African American; American Indian and Alaska Native;AsianAmerican;Some other race White;African American; American Indian and Alaska Native;AsianAmerican;Native Hawaiian and other pacific Islander;Some other race African American; American Indian and Alaska Native;AsianAmerican;Native Hawaiian and other pacific Islander;Some other race *Among the various Asian American groups in U.S., Japanese were most likely to be in combination with one or more other race, whereas Vietnamese were least likely to be in combination. (Barnes and Bennett 2) 1
17 According to Census 2, Chinese FIGURE 7. ASIAN AMERICANS WITH ETHNIC GROUP AFFILIATION FOR CONNECTICUT (SELECTED GROUPS) % 3% % 3% 1% 1% 9% % 2% 29% Americans made up the largest Asian American group (2.7 million alone or in combination) in the U.S. Asian Indians (1.9 million alone or in combination) and Filipino Americans (1.7 million alone or in combination) were the next two largest groups. 9% 5% % % 9% Asian Indian Cambodian Filipino Indonesian Korean Malaysian Sri Lankan Thai Other Asian 1% 3% 23% Bangladeshi Chinese, except Taiwanese Hmong Japanese Laotian Pakistani Taiwanese Vietnamese Other Asian not specified Source: U.S. Census Bureau, 2 In comparison, Asian Indians (24,28) are the largest Asian American group in Connecticut (Figure 7) followed by Chinese Americans (19,34) and Filipino Americans (7,825). Asian Indians, Chinese Americans and Filipino Americans together account for 61% of the total Asian American population in Connecticut. In the U.S. these three largest groups account for 58% of the Asian American population. All the censuses prior to 2 had six response categories for Asians: Asian Indian, Chinese, Filipino, Japanese, Korean and Vietnamese. Census 2, however, added a separate response category, Other Asian which provided respondents the opportunity to indicate specific ethnicities. Resultantly, Census 2 recognizes smaller Asian American ethnic groups such as Bangladeshi, Sri Lankan, Pakistani, Indonesian, Malaysian, and Taiwanese. Barnes and Bennett (2) note that the first United States decennial Census in 179 collected data on race but no distinction was made for people of Asian descent. Data have been collected on the Chinese population since the 186 census and on the Japanese population since the 187 census. The racial classification was expanded in the 191 census to obtain separate figures on other groups such as Filipinos and Koreans. However data on these other groups were collected on an intermittent basis through the 197 census. 11
18 II. RACE AND ETHNICITY: Asian American Ethnic Groups in Connecticut FIGURE 8. ASIAN AMERICANS BY ETHNICITY FOR CONNECTICUT OUTER CIRCLE 2 INNER CIRCLE % 19% 23% 28% Asian Indian 11,112 26,654 Chinese 11,82 21,216 Filipino 5,16 1,19 8% 8% Japanese 3,811 5,767 8% 1% 22% Korean 5,126 8,11 6% 8% 1% 22% Vietnamese 4,85 8,271 1% Other Asian 9,679 17,291 Asian Indian Chinese American Filipino American Japanese American Korean American Vietnamese American Other Asian American Source: U.S. Census Bureau, 2 The Asian American population has increased in Connecticut between 199 and 2. The total Asian American category tallied in 199 was 5,698 and the number reported for 2 is 83,789. There has been a significant growth in the Asian Indian population in Connecticut, which increased from 11,755 in 199 to 26,654 (alone or in combination) in 2 (Figure 8). The Chinese Americans and Filipino Americans have experienced considerable growth numerically, however, their share of the total population in Connecticut has remain unchanged. Over the years Asian Americans have achieved considerable visibility in Connecticut. The census projects that the Asian American population in Connecticut will increase to 134, in 215. With regard to the Asian American population in the U.S., demographers project that they could be as large as 2 million by 22. (Fong, 1998) 13
19 FIGURE 9. ASIAN AMERICANS BY ETHNICITY FOR FAIRFIELD COUNTY,CT OUTER CIRCLE 2 INNER CIRCLE 199 8% 7% 9% 7% 16% 7% Asian Indian 2% 12% 9% Filipino American Korean American Other Asian American 9% 24% 21% 21% 3% Chinese American Japanese American Vietnamese American FIGURE 1. ASIAN AMERICANS IN HARTFORD COUNTY,CT OUTER CIRCLE 2 INNER CIRCLE % 8% Asian Indian 16% 13% 2% 33% 26% 1% 4% 2% Filipino American Korean American 7% Other Asian American Source: U.S. Census Bureau, 2 7% 2% 19% Chinese American Japanese American Vietnamese American Source: U.S. Census Bureau, Asian Indian 4,118 8,663 Chinese American 3,579 6,152 Filipino American 1,466 2,52 Japanese American 1,986 2,448 Korean American 1,239 1,998 Vietnamese American 1,278 2,293 Other Asian 3,516 4,633 The distribution of the Asian American population in Connecticut varies across counties. According to Census 2, Fairfield County has the largest share (35%) of Asian Americans. Hartford has the second largest (25%) Asian American population followed by New Haven (23%). Windham County has the smallest share (1%) of the Asian American population in Connecticut Asian Indian 3,52 6,61 Chinese American 2,596 3,825 Filipino American 953 1,543 Japanese American Korean American 1,323 1,73 Vietnamese American 1,674 3,175 Other Asian American 2,582 3,418 14
20 FIGURE 11. ASIAN AMERICANS BY ETHNICITY FOR LITCHFIELD COUNTY,CT OUTER CIRCLE 2 INNER CIRCLE 199 7% 9% 4% 19% 6% 14% 2% 7% 8% Asian Indian Filipino American Korean American Other Asian American 7% 26% 23% 22% 28% Chinese American Japanese American Vietnamese American FIGURE 12. ASIAN AMERICANS BY ETHNICITY FOR MIDDLESEX COUNTY,CT OUTER CIRCLE 2 INNER CIRCLE 199 7% 19% 6% 2% Source: U.S. Census Bureau, 2 23% 26% Asian Indian American Chinese American Filipino American Japanese American Korean American Vietnamese American Other Asian American A comparison between the 199 and 2 census indicates that there has not been a substantial change in the distribution of the Asian American population across counties. Only New Haven (2% in 199 to 23% in 2) and Tolland counties (6% in 199 to 4% in 2) have experienced a change in the concentration of the Asian American population. 9% 14% 22% 4% 8% 7% 28% 7% Asian Indian Chinese American Filipino American Japanese American Korean American Vietnamese American Other Asian American Source: U.S. Census Bureau, Asian Indian Chinese American Filipino American Japanese American Korean American Vietnamese American Other Asian American
21 FIGURE 13. ASIAN AMERICANS BY ETHNICITY FOR NEW HAVEN COUNTY, CT OUTER CIRCLE 2 INNER CIRCLE 199 6% 1% 4% Asian Indian 6% 12% 8% Filipino American Korean American 15% 14% 7% 9% Other Asian American 23% 29% 28% 29% Chinese American Japanese American Vietnamese American FIGURE 14. ASIAN AMERICANS BY ETHNICITY FOR NEW LONDON COUNTY,CT OUTER CIRCLE 2 INNER CIRCLE % 4% 6% 3% 9% 7% 3% 7% Source: U.S. Census Bureau, 2 15% 19% 18% Asian Indian 2,395 5,389 Chinese American 2,917 5,49 Filipino American 979 1,61 Japanese American Korean American 1,282 1,999 Vietnamese American 626 1,183 Other Asian American 1,52 2,844 An analysis of Asian American ethnic groups by county (Figures 9-16) reveals that the Asian Indian population has increased in all the 8 counties between 199 and 2. The same trend can be noticed with Chinese Americans, whose population has increased in all counties except Hartford and New Haven. New London has the largest concentration of Filipino Americans in the state. 25% 41% 32% Asian Indian Chinese American Filipino American Japanese American Korean American Vietnamese American Other Asian American Source: U.S. Census Bureau, 2 Asian Indian Chinese American 576 1,567 Filipino American 1,3 1,286 Japanese American Korean American Vietnamese American Other Asian American
22 FIGURE 15. ASIAN AMERICANS BY ETHNICITY FOR TOLLAND COUNTY, CT OUTER CIRCLE 2 INNER CIRCLE % 5% 7% 12% 12% Asian Indian 17% 31% 3% 6% Filipino American Korean American Other Asian American 25% 16% 3% 21% 3% Chinese American Japanese American Vietnamese American Source: U.S. Census Bureau, Asian Indian Chinese American Filipino American Japanese American Korean American Vietnamese American Other Asian American In the last decade, however, there has been a drastic reduction in the Filipino American population in New London, from 41% in 199 to 25% in 2. FIGURE 16. ASIAN AMERICANS BY ETHNICITY FOR WINDHAM COUNTY, CT OUTER CIRCLE 2 INNER CIRCLE % 5% Asian Indian 37% 5% 11% 13% Filipino American Korean American Other Asian American 4% 16% 8% 18% 15% 8% 9% 2% Chinese American Japanese American Vietnamese American Source: U.S. Census Bureau, 2 It must also be noted that the Japanese American population has decreased in all the counties of Connecticut. The most visible change has occurred in Tolland County, where the Japanese American population decreased from 31% in 199 to 8% in Asian Indian Chinese American Filipino American Japanese American 57 4 Korean American Vietnamese American Other Asian American
23 3, 2,5 2, 1,5 1, 5 Asian Indian 1, 9, 8, 7, 6, 5, 4, 3, 2, 1, Chinese American Asian Indian Chinese American FIGURE 17. ASIAN AMERICAN BY CITIES DANBURY, CT PMSA Filipino American Japanese American Korean American Vietnamese American Other Asian American FIGURE 18. ASIAN AMERICANS BY CITIES HARTFORD, CT PMSA Filipino American Japanese American Korean American Vietnamese American Other Asian American Source: US Census Bureau, 199 and Source: US Census Bureau, 199 and 2 Asian Indian (Refer to Figure 17-22) is the largest ethnic group in all the Metropolitan areas in Connecticut except New Haven and New London, where the Chinese Americans are in the majority. In New London, the Chinese American population has increased from 2% in 199 to 29% in 2. Whereas in New Haven the Chinese American population has decreased by 1% from 199 to 2, from 29% to 28%. The Korean American population in Hartford City has increased from 11% in 199 to 19% in 2. In all other metropolitan areas, the Korean population has either decreased or remained unchanged, similar to trends observed in the counties in relation to Japanese Americans. 18
24 6, 5, 4, 3, 2, 1, Asian Indian Chinese American FIGURE 19. ASIAN AMERICANS BY CITIES NEW HAVEN, CT PMSA Filipino American Japanese American Korean American Vietnamese American Other Asian American Source: US Census Bureau, 199 and 2 Cities, namely Danbury, Hartford, New Haven, New London and Stamford- Norwalk in Connecticut have also witnessed a decline in the percentdistribution of the Japanese American population. There has been a marginal increase in the Japanese American population in Bridgeport, from 3% in 199 to 5% in 2, and Waterbury, from 4% in 199 to 6% in 2. The data shows that the FIGURE 2. ASIAN AMERICANS BY CITIES NEW LONDON, CT PMSA Vietnamese American population is largely concentrated in Bridgeport (13% in 2). Stamford- Norwalk has the least number of Vietnamese Americans (3% in 2). Danbury has the highest Other Asian American groups (28% in 2). Asian Indian Chinese American Filipino American Japanese American Korean American Vietnamese American Other Asian American Source: US Census Bureau, 199 and 2 The metropolitan regions with the largest Asian population in the United States in Census 2 are Los Angeles (11% of the national total), New York (8%), and The Bay Area in Northern California, which includes San Francisco, Oakland, and San Jose (11%). 19
25 FIGURE 21. ASIAN AMERICANS BY CITIES STAMFORD-NORWALK, CT PMSA FIGURE 22. ASIAN AMERICANS BY CITIES WATERBURY, CT PMSA 6, 14 5, 12 4, 3, 2, 1, Asian Indian Chinese American Filipino American Japanese American Korean American Vietnamese American Other Asian American Source: US Census Bureau, 199 and 2 Asian Indian Chinese American Filipino American Japanese American Korean American Vietnamese American Other Asian American Source: US Census Bureau, 199 and 2 Table1. Comparison of Asian Americans by Ethnic Groups Across PMSA (199-2) BRIDGEPORT DANBURY HARTFORD NEW HAVEN Asian Indian 25% 27% 28% 3% 26% 29% 21% 23% Chinese American 17% 16% 17% 18% 21% 19% 29% 28% Filipino American 6% 7% 8% 8% 7% 8% 9% 9% Japanese American 3% 5% 4% 3% 4% 4% 7% 5% Korean American 8% 8% 8% 6% 11% 19% 13% 11% Vietnamese American 1% 13% 8% 7% 11% 12% 5% 6% Other Asian American 31% 24% 27% 28% 2% 19% 16% 18% NEW LONDON STAMFORD- NORWALK WATERBURY Asian Indian 14% 16% 22% 3% 29% 36% Chinese American 2% 29% 26% 26% 19% 16% Filipino American 36% 28% 11% 12% 14% 12% Japanese American 7% 6% 22% 14% 4% 6% Korean American 7% 6% 7% 7% 9% 6% Vietnamese American 3% 4% 4% 3% 11% 9% Other Asian American 13% 11% 8% 8% 14% 15% 2
26 III. RACE AND ETHNICITY: Population Under 18 for the Metropolitan Statistical Areas, CT 8, 7, 6, 5, 4, 3, 2, 1, FIGURE 23. BRIDGEPORT, CT PMSA Non White Non Black Asian Source: Lewis Mumford Center for Comparative Urban and Regional Research Whites make up 75.2% of the total population under 18 in Connecticut. Among the Non-White population under 18, the African American and the American Indian and Alaska Native constitute 11.8% and.3%, respectively. Total Population Under , ,875 The Asian American population under 18 is 21,372,* which constitutes 2.5% of the total under 18 population in Connecticut (841,688). Table 2. ASIAN AMERICAN CHILDREN BY AGE GROUP IN CONNECTICUT Under 5 years 6923 (32%) 5 to 9 years 586 (27%) 1 to 14 years 5475 (26%) 15 to 17 years 3168 (15%) 5, 45, 4, 35, 3, 25, 2, 15, 1, 5, FIGURE 24. DANBURY, CT PMSA Non White Non Black Asian Source: Lewis Mumford Center for Comparative Urban and Regional Research Source: KIDS Census Data Online, www. aecf.org Table 3.ASIAN AMERICAN CHILDREN BY AGE GROUP IN USA Under 5 years 67,46(27%) 5 to 9 years 68,536 (28%) 1 to 14 years 684, 525 (28%) 15 to 17 years 429,532 (17%) Source: KIDS Census Data Online, www. aecf.org Total Population Under , ,822 * Connecticut ranks 16 in percent of Asian American population under age 18. Hawaii ranks 1 st (29.9%) followed by California (9.5%) and New Jersey (6.%). Among New England towns, Monhegan, ME ranks first at 25% for population under age 18, while Mansfield, CT ranked 19 th, and Danbury, CT ranked 2 th. (Kids Count Census Online, www. aecf.org) 21
27 25, 2, FIGURE 25. HARTFORD, CT MSA Total Population Under , ,183 15, 1, 5, Non White Non Black Asian Source: Lewis Mumford Center for Comparative Urban and Regional Research Among Connecticut towns, Mansfield ranks 1 st with 7.5% of the Asian American population under age 18 followed by Danbury, Greenwich (6.4%), West Hartford (6.2%), and Woodbridge with 5.4%. The data presented in figures is for metropolitan regions, which includes metropolitan statistical area (MSA) or primary metropolitan statistical area (PMSA). They comprise a central city (or sometimes two or more central cities) and the surrounding suburbs. The figures here are for the FIGURE 26. NEW HAVEN-MERIDEN, CT PMSA under age 18 population, 9, 8, 7, 6, classified into categories of non- white, non- black,, 5, 4, and Asian. 3, 2, 1, Non White Non Black Asian Total Population Under , ,349 Source: Lewis Mumford Center for Comparative Urban and Regional Research 22
28 7, 6, 5, 4, 3, 2, 1, FIGURE 27. NEW LONDON- NORWICH, CT-RI MSA Non White Non Black Asian Source: Lewis Mumford Center for Comparative Urban and Regional Research Total Population Under , ,685 The figures show, there has been an increase in the Asian American population under age 18 between 199 and 2 in all the MSA and PMSA in Connecticut. The population under age 18 in Stamford-Norwalk (2,198 in 199 to 4,31 in 2) and Waterbury (532 in 199 to 1,7 in 2) has nearly doubled. Waterbury still has the least number of Asian Americans under age 18, while Hartford (MSA) has the largest number with 8,455 according to Census 2. 7, 6, 5, FIGURE 28. STAMFORD-NORWALK, CT PMSA Total Population Under , ,246 4, 3, 2, 1, Non White Non Black Asian Source: Lewis Mumford Center for Comparative Urban and Regional Research The second largest (4,31) Asian American population under age 18 is in Stamford- Norwalk (PMSA), followed by New Haven-Meriden (3,994) and Bridgeport (3,533). 23
29 45, 4, 35, FIGURE 29. WATERBURY, CT PMSA Total Population Under , ,6 3, 25, 2, Figure 3 shows the 15, 1, 5, Non White Non Black Asian combination of races for the population under age 18 in Connecticut. Asian American and White Source: Lewis Mumford Center for Comparative Urban and Regional Research make up 13 % (4,44) of the total (74,848) multiracial population. FIGURE 3. MULTIRACIAL POPULATION UNDER AGE 18 IN CONNECTICUT African American and White constitute 26% 29% 26% 7% (8,52) of the population under age 18. White and Some Other Race and All Other Combinations of Two or More Races together 24% 13% 1% White and Black or African American White and American Indian or Alaska native White and Asian American White and native Hawaiian or other Pacific Islander White and some other race All other combinations of two or more races make up for 53% (16,94) of the total multiracial population under age 18 in Connecticut*. Source: KIDS Census Data Online, www. aecf.org *The total multiracial population under age 18 in the U.S. is 2,856,886. The number of White and Asian Americans in the U.S. is 445,82. White and Some Other Race and all other combinations of two or more races have a population of 1,465,342 under age 18. (KIDS Census Data Online, www. Aecef.org) 24
30 I. HOUSEHOLD AND FAMILY: Asian American Households in Connecticut 2, 18, 16, 14, 12, 1, 8, 6, 4, 2, FIGURE 31. HOUSEHOLD TYPE BY HOUSEHOLD SIZE-ASIAN AMERICANS Family Households Total 1-person household 2-person household 3-person household 4-person household 5-person household 6-person household 7-or more person household Non-family household Source: U.S. Census Bureau, 2 Total households USA (Asian Americans) :3,13,263 Total households Connecticut :1,31,67 Total households- Connecticut (Asian Americans)* :25,1 Census 2 (SF 1) Average household size -USA (Asian Americans) 3.11 Average household size -Connecticut 2.53 Average household size Connecticut (Asian Americans) 3. Census 2 (SF 1) Population in households USA (Asian Americans) 9,725,483 Population in households - Connecticut 3,297,626 Population in households - Connecticut (Asian Americans) 75,391 Census 2 (SF 1) According to the Census, a household includes all the people who occupy a housing unit as their usual place of residence. Figure 31 depicts the household type by household size among Asian Americans in Connecticut. The Census distinguishes between two types of householders: a family householder involves householders living with one or more people related to him or her by birth, marriage, or adoption and a non-family householder is a householder living alone or with non-relatives only. Household size in the Census is defined as the total number of people who live in a housing unit. Source: U.S. Census Bureau, 2 Out of the 25,1 Asian American households in Connecticut, 18,594 (74%) are family households, whereas 6,56(26%) are non-family households. Within the family households, 27% live in 2-person households and 26% each in 2 and 3-person households. In the nonfamily households, a majority (72%) live in 1-person households and 2% live in 2-person households. *The total number of households for the White population in Connecticut is 1,13,65 (Family households-74,355, Nonfamily households-363,295). The total number of households for the African American population in Connecticut is 16,398 (Family households-72,37, Non-family households-34,28). The total number of households for the or Latino population in Connecticut is 9,66 (Family households-7,74 Non-family households-2, 586). (Census 2) 25
31 FIGURE 32. RACE OF HOUSEHOLDER IN CONNECTICUT 3% % 2% % 8% 2% White African American alone American Indian and Alaska Native alone Asian American Native Hawaiian and Other Pacific Islander alone Some other race alone Two or More races 85% Source: U.S. Census Bureau, 2 Source: U.S. Census Bureau, 2 A householder is defined by the Census Bureau as the person, or one of the people in whose name the home is owned, being bought, or rented. (Refer to Glossary) In 199, Asian American and Pacific Islanders made up 1% (13,558) of the total householders in Connecticut, whereas in Census 2 Asian American alone comprise 2% (25,1) of the total householders in Connecticut. The total number of Asian American householders is 3,13,263 (3%) in the United States. In 199 the total number of Asian and Pacific Islanders was 2,13,735 (13%). Table 4. RACE OF HOUSEHOLDER IN CONNECTICUT (199) White 1,96,812 (9%) African American 9,882 (7%) American Indian, Eskimo or Aleut 2,383 (%) Asian American and Pacific Islander 13,558 (1%) Other Race 261,884 (2%) Source: U.S. Census Bureau, 2 26
32 FIGURE 33. ASIAN AMERICAN POPULATION IN OCCUPYING HOUSING UNITS BY TENURE 45, 42,36 4, 35, 33,31 3, 25, 2, 15, 1, 5, Owner Occupied Renter Occupied Source: U.S. Census Bureau, 2 Average Household Size of Occupied Housing Units by Tenure-Asian Americans, Connecticut Total :3. Owner Occupied :3.51 Renter Occupied :2.53 Census 2 (SF 1) Average Household Size of Occupied Housing Units by Tenure-Asian Americans, USA Total :3.11 Owner Occupied :3.49 Renter Occupied :2.67 Census 2 (SF 1) As defined by the Census Bureau, tenure refers to the distinction between owner occupied and renter occupied housing units. A housing unit is owner occupied if the owner or the co-owner lives in the unit even if it is mortgaged or not fully paid for. On the other hand, a renter occupied household refers to the housing units, which are not owner occupied, whether they are rented for cash or occupied without payment of cash rent. As can be seen in figure 33, in Connecticut, * 56%( 42,36) of the Asian Americans population live in the owner occupied households, whereas 44%( 33,31) are in renter occupied households. *The total population in occupied housing units by tenure for Whites in Connecticut is 2,72,523 (owner occupied 77% and renter occupied 23%). The total population in occupied housing units by tenure for African Americans in Connecticut is 289,95 (owner occupied 41% and renter occupied 59%). The total population in occupied housing units by tenure for s or Latino in Connecticut is 296,712 (owner occupied 3% and renter occupied 7%). (Census Bureau, 2) 27
33 FIGURE 34. TENURE BY RACE OF HOUSEHOLDER IN CONNECTICUT* INNER CIRCLE OWNER OCCUPIED OUTER CIRCLE RENTER OCCUPIED Total number of Asian American householder in USA Owner Occupied: 1,672,46 Renter Occupied: 1,457,83 Census 2 (SF 1) White African American American Indian and Alaska Native Asian American Native Hawaiian and Other Pacific Islander Some Other Race Two or More Races According to Census 2, 1% (12,66) of owner occupied householders in Connecticut are Asian Americans. They make up 3% (13,34) of the renter occupied householders. The comparable figures for Asian Americans in the U.S. are 1% and 4%. * (The table below is in reference to Figure 34) Source: U.S. Census Bureau, 2 Owner Occupied Renter Occupied White 799,951 33,699 African American 38,784 67,614 American Indian and Alaska Native 1,45 1,832 Asian American 12,66 13,34 Native Hawaiian and Other Pacific Islander Some Other Race 9,181 32,631 Two or More Races 8,149 12,939 Whites constitute the majority (93%) among the owner occupied householders followed by African Americans at 4%. Similarly, Whites continue to be the majority (7%) among renter occupied householders in Connecticut. African Americans make up 16% of the renter occupied householders. In the 199 census, Asian Americans together with Pacific Islanders made up 1% of the owner occupied householders, and 2% of renter occupied householders in Connecticut. 28
34 FIGURE 35. TENURE BY AGE OF HOUSEHOLDER ASIAN AMERICANS 9 8 Renter Occupied 7 Owner Occupied Householder 25to 34 years Householder 15 to 24 years 14, 12, 1, 8, 6, 4, 2, Householder 45 to 54 years Householder 35 to 44 years Total Householder 65 to 74 years Householder 55 to 64 years 2-person household Householder 75 to 84 years 4-person household Householder 85 years and above FIGURE 36.TENURE BY HOUSEHOLD SIZE- ASIAN AMERICANS OWNER OCCUPIED RENTER OCCUPIED 6-person household Source: U.S. Census Bureau, 2 Source: U.S. Census Bureau, 2 As can be seen in Figure 35, there is a variation between renter occupied and owner occupied Asian American householder across various age groups. Out of the 7,757 Asian American householders in the age group of years, 5,886 (76%) are in renter occupied household units. And the remaining 1,871 (24%) are in owner occupied housing units. In the age group of 15-24, 136 (9%) have owner occupied housing units. Figure 36 indicates that a total no of 13,34(52%) Asian American households are renter occupied. The comparative figure for owner occupied Asian American household is 12,66 (48%). In the 1-person household category, there is striking difference between households that are renter occupied 3,719 (79%) and owner occupied. 1,12 (21%). The opposite trend can be noticed in the 4-person household category. 3,132 (62%) households are owner occupied whereas 1,935 (38%) households are renter occupied. However, the difference between the owner and renter occupied households in the 3-person category is marginal. 29
35 25 2 FIGURE 37. NON-RELATIVES BY HOUSEHOLD TYPE-ASIAN AMERICANS NON-FAMILY HOUSEHOLDS FAMILY HOUSEHOLDS Non relatives as defined by the census refers to any household member, which includes foster children living in the housing unit but not related to the householder by birth, marriage, or adoption. 15 As, evident in figure 37, majority of the Asian American 1 nonrelatives are housemates or roommates - 44% (668), roomer 5 or boarder and housemate or roommate who live in family ROOMER OR BOARDER HOUSEMATE OR ROOMMATE UNMARRIED PARTNER FOSTER CHILD OTHER NON- RELATIVES households, whereas 77% (2,29) housemate or roommate Source: U.S. Census Bureau, 2 alone live in non-family households. Further, 19% (296) of unmarried partners live in family households and 16% (494) live in non family households. Out of the total 51 foster children, 46(3%) live in Asian American family households and 5 are in non-family households. Comparative figures for other races are given in Table 5. Table 5. Non relatives by Family Size (Source: U.S. Census Bureau, 2) White African American or Latino Family Non-family Family Non-family Family Non-family Roomer/Boarder 15% 11% 1% 15% 13% 17% Housemate or 14% 35% 11% 31% 18% 37% Roommate Unmarried Partner 44% 44% 5% 37% 43% 3% Foster Child 4% % 11% 3% 6% 2% Other non relatives 23% 1% 18% 14% 2% 14% 3
36 II. HOUSEHOLD AND FAMILY: Asian American Families in Connecticut FIGURE 38. ASIAN AMERICANS: FAMILY TYPE AND AGES OF CHILDREN No ow n children 18 under 18 years 16 With ow n 14 children under MARRIED COUPLE FAMILY- OTHER FAMILY WITH MALE HOUSEHOLDER OTHER FAMILY WITH FEMALE HOUSEHOLDER Source: U.S. Census Bureau, 2 Average Family Size - Connecticut 3.8 Average Family Size Connecticut (Asian Americans) 3.5 Average Family Size USA (Asian Americans) 3.61 Census 2 (SF 1) The Census Bureau classifies families into two types: married-couple family and other family. (Refer to Glossary) Figure 38 shows that the majority 16,22 (86%) of Asian American families are married - couple families. Of the remaining 14% of Asian American families, 5% ( 964) are families with male householders with no wife present, whereas 9% (1,68) are female householders with no husband present. 61% (9,841) of married couple families have own children under age 18, whereas 39% (6,181) have no own children under age 18. Out of the total number of other family with male householder, 33% (316) have own children and 67% (648) have no own children under age 18. The comparative figures for other families with female householder are 54% (866) and 46% (742) for own children under age 18 and no own children under age 18 respectively. For details of family of own children under age 18 see Table 6. 31
37 Table 6. Asian American Children Under Age 18 by Family Type in Connecticut Under 6 years Under 6 and years Total 17 years Married couple family 3,217 (33%) 1,87 (19%) 4,754 (48%) 9841 Other family with male 71 (22%) 49 (16%) 196 (62%) 316 householder Other family with female householder 192 (22%) 11 (13%) 564 (65%) 866 Source: U.S. Census Bureau, 2 There is a striking difference with regard to Asian American families with own children under age 18. A majority of the families (89%) with own children under age 18 are married couple families, whereas 3% are the families with male householders, and 8% are female-headed families. Comparative figures for other races are presented in Table 7. Table 7. Family Type and Ages of Children for Whites, African American and or Latino in Connecticut White African American or Latino Married Couple family 63,24 (81%) 32,17 (44%) 36,689 (52%) Other family with male 35,476 (5%) 5,835 (8%) 6,821 (1%) householder Other family with female 11,855 (41%) 34,518 (48%) 26,564 (38%) householder Total 74,355 72, 37 7,74 Source: U.S. Census Bureau, 2 Compared to families with own children under age 18 of all other races, the highest percent (9.1%) of Asian American children live in married couple families, whereas the lowest, 9.1% of Asian American children live in single-parent families. (Kids Census Data Online, Total No. of Families - Connecticut 881,17 Total No. of Families Connecticut (Asian Americans) 18,594 Total No. of Families U.S. (Asian Americans) 2,33,655 Census 2 (SF 1) Total Population in Families - Connecticut 2,716,631 Total Population in Families - Connecticut (Asian Americans) 65,113 Total Population in Families - U.S. (Asian Americans) 8,43,634 Census 2 (SF 1) 32
38 III. HOUSEHOLD AND FAMILY: Living Arrangements of Asian Americans by Group Quarters FIGURE 39. GROUP QUARTERS BY SEX BY AGE-ASIAN AMERICANS Under 18 years 18 to 64 years 65 years and over Male Female Male Female Institutionalized Population Non-Institutionalized Population Source: U.S. Census Bureau, 2 The Census Bureau defines group quarters as all persons not living in households. The group quarters can be categorized as Institutionalized persons and other persons in group quarters/ noninstitutionalized group quarters. (Refer to Glossary) The majority of the Asian American group quarter population is noninstitutionalized. (Male- 1,36, female-1,317). Among the total number of institutionalized population (24), 138 are males and 66 are females. With regard to children under age 18, 17 live in institutionalized group quarters and 61 live in noninstitutionalized group quarters. (Kids Census Online, www. aecf.org) 33
39 I. RACIAL COMPOSITION AND POVERTY PROFILES IN METROPOLITAN AREA SCHOOLS: Ethnic and Racial Composition in Schools 25, FIGURE 4. BRIDGEPORT, PMSA The data in Figure 4-46 represents the ethnic and racial composition of 2, schools in MSAs and PMSAs in Connecticut. 15, 1, 5, Non- White Non- Black Asian ,447 5,366 5, ,395 6,983 7, Source: Metropolitan Racial and Ethnic Change-Census 2, Lewis Mumford Center 18, 16, 14, 12, 1, 8, 6, 4, 2, FIGURE 41. DANBURY, PMSA Non- White Non- Black Asian , , , Source: Metropolitan Racial and Ethnic Change-Census 2, Lewis Mumford Hartford MSA has the largest number (2,773, and 3% of all races) of Asian American children in public schools in 2, whereas Waterbury PMSA has the least number (328, and 2% of all races). A similar trend was noticed in 199. Hartford had the largest (1768, and 2% of all races) Asian American children in public schools. With regard to the diversity experienced in school, an average White child in the U.S. attends a school that is over 78% White. Only 9% of other children in the schools are African Americans, 8%, and 3% Asian American. (Lewis Mumford Center, University at Albany) 35

40 FIGURE 42. HARTFORD, CT MSA 8, 7, 6, 5, 4, 3, The Waterbury PMSA reported the least number of Asian American children (159, and 1% of all the races). 2, 1, Non- White Non- Black Asian ,438 11,366 11,569 1, ,271 15,88 17,89 2,773 Source: Metropolitan Racial and Ethnic Change-Census 2, Lewis Mum ford Center FIGURE 43. NEW HAVEN-MERIDEN, CT PMSA Stamford-Norwalk (675 in 199 to 13 in 2) and New Haven Meriden (639 in 199 to 1415 in 2) have witnessed a two-fold increase in Asian American children in schools in the last decade. 3, 25, , 15, 1, 5, Non- White Non- Black Asian ,641 8,211 4, ,247 1,92 7,235 1,415 The average African American child s school is more than half African American (57%). Asian Americans despite being only 4% of the elementary population are in schools that average 19% Asians. (Lewis Mumford Center, University at Albany) Source: Metropolitan Racial and Ethnic Change-Census 2, Lewis Mumford Center 36
41 FIGURE 44. NEW LONDON-NORWICH, CT-RI MSA 25, , 15, 1, 5, Based on a Census 2 twelve monthly sample survey, the estimated figure for the Asian American population three years and over enrolled in schools is 32%, whereas 68% is the estimate for nonenrollment. Non- White Non- Black Asian 199 2,198 1, ,38 2,481 1, Source: Metropolitan Racial and Ethnic Change-Census 2, Lewis Mumford Center 25, 2, 15, 1, FIGURE 45. STAMFORD-NORWALK, CT PMSA 5, Non- White Non- Black Asian Among the Asian Americans enrolled in school in the U.S., 1% are enrolled in Nursery schools & Kindergarten, and 35% are enrolled in grade 1 to grade 8. With regard to enrollment in grade 9 to grade 12 and college or graduate schools, the estimate is 19% and 36%, respectively ,926 3,819 1, ,172 4,42 3,766 1,3 Source: Metropolitan Racial and Ethnic Change-Census 2, Lewis Mumford Center 37


42 14, 12, 1, 8, FIGURE 46. WATERBURY, CT PMSA San Francisco, CA, Minneapolis - St.Paul, MN-WI, and New York, NY are the top three Metropolitan regions with the largest number of Asian American elementary school children. 6, 4, 2, Non- White Non- Black Asian ,985 1,864 2, ,984 2,96 4, Between 199 and 2, the number of Asian elementary school children has grown marginally, rising less than the total Asian population of all ages. (Lewis Mumford Center, University at Albany) Source: Metropolitan Racial and Ethnic Change-Census 2, Lewis Mumford 38
43 II. RACIAL COMPOSITION AND POVERTY PROFILES IN METROPOLITAN AREA SCHOOLS: Poor (%) in the School of the Average Group Members for PMSA & MSA, CT FIGURE 47. BRIDGEPORT, CT PMSA In Bridgeport, the average non-poor child is in a school that is 84.3% nonpoor. The average poor child s school is 76.8% poor. (Lewis Mumford Center, University at Albany) Non- White Non- Black Asian Source: Metropolitan Racial and Ethnic Change-Census 2, Lewis Mumford Center This section focuses on the percentage of poor in the schools, attended by various racial groups in Connecticut. The percentage of poor in the schools attended by Asian Americans in all the 7 PMSA and MSA is lower than the percentage poor for s and non- African Americans. In Connecticut, both Bridgeport and Waterbury have the highest percentage of poor in the schools attended by Asian Americans, at 39.4% and 39.3% respectively. Stamford- Norwalk has the lowest percentage poor (18.3%) in the schools attended by the Asian American children, followed by Hartford at 22.5%. Figures show that the schools attended by children of various races have dissimilar percentages of poverty. 39
44 FIGURE 48. DANBURY, CT PMSA Non- White Non- Black Asian Source: Metropolitan Racial and Ethnic Change-Census 2, Lewis Mumford Center In Danbury, the average non-poor child is in a school that is 9.1% nonpoor. The average poor child s school is 3.4 % poor. (Lewis Mumford Center, University at Albany) FIGURE 49. HARTFORD, CT MSA In Hartford, the average non-poor child is in a school that is 83.4% nonpoor. The average poor child s school is 52.7% poor. Non- White Non- Black Asian Source: Metropolitan Racial and Ethnic Change-Census 2, Lewis Mum ford Center (Lewis Mumford Center, University at Albany) 4
45 FIGURE 5. NEW HAVEN-MERIDEN, CT PMSA In New Haven- Meriden, the average non-poor child is in a school that is 77.3% non-poor. The average poor child s school is 52.1% poor. 1 Non- White Non- Black Asian Source: Metropolitan Racial and Ethnic Change-Census 2, Lewis Mum ford (Lewis Mumford Center, University at Albany) FIGURE 51. NEW LONDON-NORWICH, CT-RI MSA In New London-Norwich, the average non-poor child is in a school that is 81.8% non-poor. The average poor child s school is 39.2% poor. (Lewis Mumford Center, University at Albany) Non- White Non- Black Asian Source: Metropolitan Racial and Ethnic Change- Census 2, Lewis Mum ford Center Of the 95, children in CT, 9% or 79, are living in poverty. CT ranks 8 th among 5 States and the District of Columbia at combating childhood poverty. (The Children s Partnership : 41
46 FIGURE 52. STAMFORD-NORWALK, CT PMSA In Stamford-Norwalk, the average non-poor child is in a school that is 86.1% nonpoor. The average poor child s school is 32.2% poor. (Lewis Mumford Center, University at Albany) Non- White Non- Black Asian Source: Metropolitan Racial and Ethnic Change-Census 2, Lewis Mumford Center FIGURE 53. WATERBURY, CT PMSA In Waterbury, the average non-poor child is in a school that is 75.6 % non-poor. The average poor child s school is 6.4% poor. (Lewis Mumford Center, University at Albany) Non- White Non- Black Asian Source: Metropolitan Racial and Ethnic Change-Census 2, Lewis Mumford Center As reported in this section, the different levels of poverty in schools affect the quality of education imparted in these schools. This has a specific impact on the performance of children belonging to minority groups. In the U.S., White students are in schools that are 3% poor, African American students are in schools that are 65% poor, s students are in schools that are 66% poor, and Asian American students are in schools that are 42% poor. (Lewis Mumford Center, University at Albany) 42
47 APPENDICES Appendix 1. Asian American Population (%) Regional Distribution: 2 Asian American Alone Asian American Alone or in combination North East Mid West South West Appendix 2. Asian American Population in the U.S.: 2 Alone & in combinations Number Asian American alone or in combination with one or more 11,88,828 other races Asian American alone 1,242,998 Asian American in combination with one or more other 1,655,83 races Asian American: White 868,395 Asian American: Some other race 249,18 Asian American: Native Hawaiian and other Pacific 138,82 Islanders Asian American: African American 16,72 Asian American: All other combinations 292,743 Appendix 3. Asian American Population (%) State-wide Distribution: 2 State Asian American Asian American Asian American alone or Alone in combination % of total population % of total population % of total population Alabama Alaska Arizona Arkansas California Colorado Connecticut Delaware Source: US Census Bureau, 2 43
48 District of Columbia Florida Georgia Hawaii Idaho Illinois Indiana Iowa Kansas Kentucky Louisiana Maine Maryland Massachusetts Michigan Minnesota Mississippi Missouri Montana Nebraska Nevada New Hampshire New Jersey New Mexico New York North Carolina North Dakota Ohio Oklahoma Oregon Pennsylvania Rhode Island South Carolina South Dakota Tennessee Texas Utah Vermont Virginia Washington West Virginia Wisconsin Wyoming Puerto Rico *.2.5 Source: US Census Bureau, 2 44
49 Appendix 4. Ten Largest Places in Total Population and in Asian American Population: 2 Place Total Population Asian American alone Asian American alone or in combination New York, NY Los Angeles, CA Chicago, IL Houston, TX Philadelphia, PA Phoenix, AZ San Diego, CA Dallas, TX San Antonio, TX Detroit, MI San Jose, CA San Francisco, CA Seattle, WA Honolulu, HI Fremont, CA Appendix 5. Ten Places with Highest Percentage of Asian American Population (1, or more population) Place Asian American alone or in combination Asian American alone Honolulu, HI Daly City, CA Fremont, CA Sunnyvale, CA San Francisco, CA Irvine, CA Garden Grove, CA Santa Clara, CA Torrance, CA San Jose, CA Source: US Census Bureau, 2 45
50 Appendix 6. Asian American Population by Detailed Group: 2 One Asian American group reported* Asian American Alone Two or more Asian American groups reported Asian American in combination with one or more other races One Asian American group reported Two or more Asian American groups reported Detailed Group Total 1,19,45 223,593 1,516, ,989 Asian Indian 1,678,765 4,13 165,437 15,384 Bangladeshi 41,28 5,625 9, Bhutanese Burmese 13, , Cambodian 171,37 11,832 2,83 1,453 Chinese except 87,79 Taiwanese 2,314,537 13,826 21,688 Filipino 1,85,314 57, ,236 71,454 Hmong 169,428 5,284 11, Indo-Chinese Indonesian 39,757 4,429 17,256 1,631 Iwo Jiman Japanese 796,7 55, ,2 55,486 Korean 1,76,872 22,55 114,211 14,794 Laotian 168,77 1,396 17,914 1,186 Malaysian 1,69 4,339 2,837 7 Maldivian Nepalese 7, , Okinawan 3,513 2,625 2,816 1,654 Pakistani 153,533 11,95 37,587 2,94 Singaporean 1, Sri Lankan 2,145 1,219 2, Taiwanese 118,48 14,96 11,394 1,257 Thai 112,989 7,929 27,17 2,195 Vietnamese 1,122,528 47,144 48,639 5,425 Other Asian, not specified 146,87 19, ,449 7,535 Source: US Census Bureau, 2 46
51 Appendix 7. English Language Proficiency of Asian Americans and Pacific Islanders United States Estimate Total: 5 to 17 years: Speak Asian and Pacific Island languages: 1,212,386 Speak English "very well" 839,833 Speak English "well" 246,477 Speak English "not well" 112,565 Speak English "not at all" 13, to 64 years: Speak Asian and Pacific Island languages: 5,45,658 Speak English "very well" 2,451,619 Speak English "well" 1,465,938 Speak English "not well" 913,995 Speak English "not at all" 214,16 65 years and over: Speak Asian and Pacific Island languages: 66,417 Speak English "very well" 177,356 Speak English "well" 131,849 Speak English "not well" 186,37 Speak English "not at all" 11,842 Appendix 8. Sex By Occupation for the Employed Civilian Population, 16 Years and Over-Asian American: 2 United States Estimate Total: 5,16,91 Male: 2,695,89 Management, professional, and related occupations: 1,255,79 Management, business and financial operations occupations: 399,978 Management occupations, except farmers and farm managers 277,268 Farmers and farm managers 4,36 Business and financial operations occupations 118,35 Professional and related 855,731 Source: US Census Bureau, 2 47
52 Occupations: Computer and mathematical occupations 283,829 Architecture and engineering occupations 198,55 Life, physical, and social science occupations 62,725 Community and social services occupations 25,662 Legal occupations 19,75 Education, training, and library occupations 82,171 Arts, design, entertainment, sports and media occupations 45,424 Healthcare practitioners and technical occupations 137,665 Service occupations: 321,372 Healthcare support occupations 14,865 Protective service occupations 3,62 Food preparation and serving related occupations 17,49 Building and grounds cleaning and maintenance occupations 6,634 Personal care and service occupations 44,763 Sales and office occupations: 521,99 Sales and related occupations 279,63 Office and administrative support occupations 241,469 Farming, fishing, and forestry occupations 12,669 Construction, extraction, and maintenance occupations: 182,91 Construction and extraction occupations 72,575 Installation, maintenance, and repair occupations 19,516 Production, transportation, and material moving occupations: 42,869 Production occupations 267,818 Transportation and material moving occupations 135,51 Female: 2,321,92 Management, professional, and related occupations: 96,364 Source: US Census Bureau, 2 48
53 Management, business and financial operations occupations: 32,418 Management occupations, except farmers and farm managers 171,154 Farmers and farm managers 1,837 Business and financial operations occupations 147,427 Professional and related occupations: 639,946 Computer and mathematical occupations 128,661 Architecture and engineering occupations 41,435 Life, physical, and social science occupations 42,1 Community and social services occupations 17,569 Legal occupations 15,912 Education, training, and library occupations 18,916 Arts, design, entertainment, sports and media occupations 48,134 Healthcare practitioners and technical occupations 237,219 Service occupations: 371,431 Healthcare support occupations 67,79 Protective service occupations 7,997 Food preparation and serving related occupations 138,662 Building and grounds cleaning and maintenance occupations 5,479 Personal care and service occupations 17,214 Sales and office occupations: 688,133 Sales and related occupations 25,855 Office and administrative support occupations 437,278 Farming, fishing, and forestry occupations 7,619 Construction, extraction, and maintenance occupations: 1,67 Construction and extraction occupations 2,483 Installation, maintenance, and repair occupations 8,124 Source: US Census Bureau, 2 49
54 Production, transportation, and material moving occupations: 282,938 Production occupations 258,37 Transportation and material moving occupations 24,568 Appendix 9. Poverty Status in the past 12 months by Age-Asian American United States Estimate Total: 1,45,488 Income in the past 12 months below poverty level: 1,322,493 Under 5 years 93,13 5 years 2,47 6 to 11 years 136, to 17 years 127, to 64 years 841, to 74 years 62, years and over 39,963 Income in the past 12 months at or above poverty level: 9,82,995 Under 5 years 68,948 5 years 121,52 6 to 11 years 713, to 17 years 719, to 64 years 6,249, to 74 years 419,93 75 years and over 25,72 Source: US Census Bureau, 2 5
55 GLOSSARY Age Age is generally derived from date of birth information, and is based on the age of the person in complete years. Alaska Native race/ethnic categories Self-identification among people of Alaska Native descent. These are the five detailed Alaska Native race and ethnic categories used in displaying data from Census 2: Alaska Athabaskan Aleut Eskimo Tlingit-Haida All other tribes Asian American Self-identification among people of Asian descent. In These are the 17 detailed Asian race and ethnic categories used in displaying data from Census 2: Asian Indian Bangladeshi Cambodian Chinese, except Taiwanese Filipino Hmong Indonesian Japanese Korean Laotian Malaysian Pakistani Sri Lankan Taiwanese Thai Vietnamese Other Asian Average family size Look under Family Average household size Look under Household Average household size of owner-occupied units Look under Household Average household size of renter-occupied units Look under Household Child A son or a daughter by birth, an adopted child, or a stepchild, regardless of the child's age or marital status. Source: U.S. Census Bureau, 2 51
56 Foster children Children receiving parental care and guidance although not related through blood or legal ties; placed in care by a government agency. When a foster child is also a relative, such as a nephew or niece, the child is counted as a related individual rather than a foster child. Own children A child under 18 years old who is a son or daughter by birth, marriage (a stepchild), or adoption. For 1- percent tabulations, own children consist of all sons/daughters of householders who are under 18 years of age. For sample data, own children consist of sons/daughters of householders who are under 18 years of age and who have never been married, therefore, numbers of own children of householders may be different in these two tabulations. County and equivalent entity The primary legal subdivision of most states. In Louisiana, these subdivisions are known as parishes. In Alaska, which has no counties, the county equivalents are boroughs, a legal subdivision, and census areas, a statistical subdivision. In four states (Maryland, Missouri, Nevada and Virginia), there are one or more cities that are independent of any county and thus constitute primary subdivisions of their states. The District of Columbia has no primary divisions, and the entire area is considered equivalent to a county for statistical purposes. In Puerto Rico, municipios are treated as county equivalents. Demographic profile A profile includes tables that provide various demographic, social, economic, and housing characteristics for the U.S., regions, divisions, states, counties, county subdivisions, places, metropolitan areas, American Indian and Alaska Native areas, Hawaiian home lands and congressional districts. It includes 1-percent and sample data from the decennial censuses.. Family A group of two or more people who reside together and who are related by birth, marriage, or adoption. Average Family Size A measure obtained by dividing the number of members of families by the total number of families Group quarters (GQ) The Census Bureau classifies all people not living in households as living in group quarters. There are two types of group quarters: institutional (for example, correctional facilities, nursing homes, and mental hospitals) and non-institutional (for example, college dormitories, military barracks, group homes, missions, and shelters Group quarters population Those people residing in group quarters as of the date on which a particular survey was conducted. The Census Bureau recognizes two general categories of people in group quarters: (1) institutionalized population and (2) non-institutionalized population. The institutionalized population includes people under formally authorized supervised care or custody in institutions at the time of enumeration. Such people are classified as "patients or inmates" of an institution regardless of the availability of nursing or medical care, the length of stay, or the number of people in the institution. Generally, the institutionalized population is restricted to the institutional buildings and grounds (or must have passes or escorts to leave) and thus have limited interaction with the surrounding community. Also, they are generally under the care of trained staff who have responsibility for their safekeeping and supervision. The noninstitutionalized population includes all people who live in group quarters other than institutions. Household A household includes all the people who occupy a housing unit as their usual place of residence. Source: U.S. Census Bureau, 2 52
57 Household Size The total number of people living in a housing unit. Average Household Size A measure obtained by dividing the number of people in households by the total number of households. Average household size of owner-occupied units A measure obtained by dividing the number of people living in owner-occupied housing units by the number of owner-occupied housing units Average household size of renter-occupied units A measure obtained by dividing the number of people living in renter-occupied housing units by the number of renter-occupied housing units. Household type and relationship Households are classified by type according to the sex of the householder and the presence of relatives. Examples include: married-couple family; male householder, no wife present; female householder, no husband present; spouse (husband/wife); child; and other relatives. Householder The person, or one of the people, in whose name the home is owned, being bought, or rented. If there is no such person present, any household member 15 years old and over can serve as the householder for the purposes of the census. Two types of householders are distinguished: a family householder and a nonfamily householder. A family householder is a householder living with one or more people related to him or her by birth, marriage, or adoption. The householder and all people in the household related to him are family members. A nonfamily householder is a householder living alone or with nonrelatives only. Other relative Any household member related to the householder by birth, marriage, or adoption, but not specifically included in any other relationship category. Can include grandchildren, parents, in-laws, cousins, etc. Nonrelatives Any household member, including foster children, living in the housing unit but not related to the householder by birth, marriage, or adoption. Housing unit A house, an apartment, a mobile home or trailer, a group of rooms, or a single room occupied as separate living quarters, or if vacant, intended for occupancy as separate living quarters. Separate living quarters are those in which the occupants live separately from any other individuals in the building and which have direct access from outside the building or through a common hall. For vacant units, the criteria of separateness and direct access are applied to the intended occupants whenever possible. Occupied housing unit A housing unit is classified as occupied if it is the usual place of residence of the person or group of people living in it at the time of enumeration. Owner-occupied housing unit A housing unit is owner occupied if the owner or co-owner lives in the unit even if it is mortgaged or not fully paid for. Source: U.S. Census Bureau, 2 53
58 Renter-occupied housing unit All occupied units which are not owner occupied, whether they are rented for cash rent or occupied without payment of cash rent, are classified as renter-occupied. Institutionalized population Look under Group Quarter Population Metropolitan Refers to those areas surrounding large and densely populated cities or towns. Metropolitan area (MA) A collective term, established by the federal Office of Management and Budget, to refer to metropolitan statistical areas, consolidated metropolitan statistical areas, and primary metropolitan statistical areas. Metropolitan statistical area (MSA) A geographic entity defined by the federal Office of Management and Budget for use by federal statistical agencies, based on the concept of a core area with a large population nucleus, plus adjacent communities having a high degree of economic and social integration with that core. Qualification of an MSA requires the presence of a city with 5, or more inhabitants, or the presence of an Urbanized Area (UA) and a total population of at least 1, (75, in New England). The county or counties containing the largest city and surrounding densely settled territory are central counties of the MSA. Additional outlying counties qualify to be included in the MSA by meeting certain other criteria of metropolitan character, such as a specified minimum population density or percentage of the population that is urban. MSAs in New England are defined in terms of minor civil divisions, following rules concerning commuting and population density. Primary metropolitan statistical area (PMSA) A geographic entity defined by the federal Office of Management and Budget for use by federal statistical agencies. If an area meets the requirements to qualify as a metropolitan statistical area and has a population of one million or more, two or more PMSAs may be defined within it if statistical criteria are met and local opinion is in favor. A PMSA consists of one or more counties (county subdivisions in New England) that have substantial commuting interchange. When two or more PMSAs have been recognized, the larger area of which they are components then is designated a consolidated metropolitan statistical area. Native Hawaiian and Pacific Islander race and ethnic categories Self-identification among people of Native Hawaiian and Pacific Islander descent. These are the 12 detailed Native Hawaiian and Pacific Islander race and ethnic categories used in displaying data from Census 2: Polynesian: Native Hawaiian Samoan Tongan Other Polynesian Micronesian: Guanamanian or Chamorro Other Micronesian Melanesian: Fijian Other Melanesian Other Pacific Islander Noninstitutionalized population Look under Group Quarter Population Nonrelatives Look under Householder Source: U.S. Census Bureau, 2 54
59 Occupied housing unit Look under Housing unit Other relative Look under household Own children Look under child Owner-occupied housing unit Look under Housing unit Primary metropolitan statistical area (PMSA) Look under Metropolitan Area Race Race is a self-identification data item in which respondents choose the race or races with which they most closely identify. Race Alone categories Includes the minimum 5 race categories White alone Black or African-American alone American Indian or Alaska Native alone Asian alone Native Hawaiian or other Pacific Islander alone Some other race alone Race Alone or in combination categories There will be other tabulations where race alone or in combination will be shown. These tabulations include not only persons who marked only one race (the race alone category) but also those who marked that race and at least one other race. For example, a person who indicated that she was of Filipino and African-American background would be included in the African-American alone or in combination count, as well as in the Asian alone or in combination count. The alone or in combination totals are tallies of responses, rather than respondents. So the sum of the race alone or in combination will add to more than the total population. Some tabulation will show the number of persons who checked two or more races. Renter-occupied housing unit Look under housing unit School District Geographic entities within which state, county, or local officials provide public educational services for the area s residents. The boundaries and names are provided by state officials. School enrollment Enrollment in regular school, either public or private, which includes nursery school, kindergarten, elementary school, and schooling, which leads to a high school diploma or college degree. Sex An individual's gender classification - male or female. Sex ratio A measure derived by dividing the total number of males by the total number of females, and then multiplying by 1. Source: U.S. Census Bureau, 2 55
60 Spanish//Latino A self-designated classification for people whose origins are from Spain, the Spanish-speaking countries of Central or South America, the Caribbean, or those identifying themselves generally as Spanish, Spanish- American, etc. Origin can be viewed as ancestry, nationality, or country of birth of the person or person s parents or ancestors prior to their arrival in the United States. Spanish//Latino people may be of any race. Listed below are the 28 or Latino categories displayed in Census 2 tabulations: Mexican Puerto Rican Cuban Dominican Republic Central American: Costa Rican Guatemalan Honduran Nicaraguan Panamanian Salvadoran Other Central American South American: Argentinian Bolivian Chilean Colombian Ecuadorian Paraguayan Peruvian Uruguayan Venezuelan Other South American Other or Latino: Spaniard Spanish Spanish American All other or Latino Summary file (SF) Statistics for a large number of geographic areas that are designed to show great subject matter detail presented in tabular form. There are four main summary files produced from the data collected during Census 2. Tenure Refers to the distinction between owner-occupied and renter-occupied housing units. Unmarried-partner household Household in which the householder and his or her partner are not legally married or participating in a common law marriage. Source: U.S. Census Bureau, 2 56
61 REFERENCES Barnes, Jessica S, Claudette E. Bennett The Asian Population: Census 2 Brief, US Census Bureau, 2. Fong, Timothy P., The Contemporary Asian American Experience, Beyond the Model Minority, Prentice Hall, New Jersey, Gall, Susan (Ed.), The Asian American Almanac, A Reference Work on Asians in The United States, Gale Research, Grieco, Elizabeth M., and Rachel C. Cassidy., Overview of Race and Origin, Census 2 Brief, US Census Bureau, 2. Hannon, Lance, Asians in Connecticut: A Demographic Fact Book-Research Paper Series, Volume I, Asians American Studies Institute, University of Connecticut, Fall, Humes, Karen and Jesse McKinnon, The Asian and Pacific Islander Population in the United States, Population Characteristics Current Population Reports, US Census Bureau, March Kids Census Data Online, Logan, John. R. From Many Shores: Asians in Census 2, Lewis Mumford Center for Contemporary Urban and Regional Research, University at Albany, 21. Radhakrishnan, Manju V., Ethnicity, Gender and Class: Personal Histories and Multifaceted Activism of SNEHA Members in Connecticut, Unpublished Masters Thesis at the University of Connecticut, 1999 Stowell, Jacob and Deirdre Oakley, Choosing segregation: Racial imbalance in American Public schools, Lewis Mumford Center for Contemporary Urban and Regional Research, University at Albany, 22. The Children s Partnership, U.S. Census Bureau, United States Department of Commerce, 57
62 59
63 61
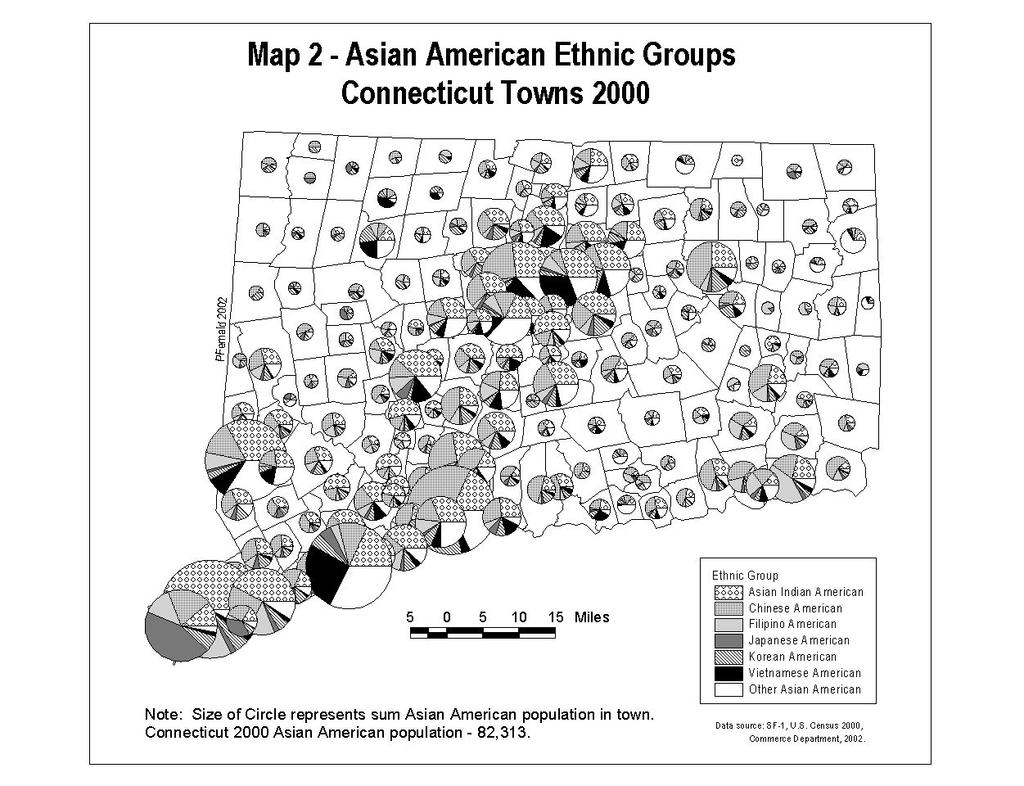
64 63
Institute for Public Policy and Economic Analysis
 Institute for Public Policy and Economic Analysis The Institute for Public Policy and Economic Analysis at Eastern Washington University will convey university expertise and sponsor research in social,
A Community of Contrasts
 A Community of Contrasts Asian Americans and Pacific Islanders in the United States DEMOGRAPHIC PROFILE Principal Researcher Contents Welcome 1 Introduction 2 Key Findings 3 United States 4 Largest Communities
Data Brief Vol. 1, No. 1
 Asian Americans and Pacific Islanders in the United States Aged 55 Years and Older: Population, Nativity, and Language Asian Americans and Pacific Islanders (AAPIs) are one of the fastest growing populations
February 1, William T Fujioka, Chief Executive Officer. Dean C. Logan, Registrar-Recorder/County Clerk
 January 31, 2012 Page 1 of 13 TO: Supervisor Zev Yaroslavsky, Chair Supervisor Gloria Molina Supervisor Mark Ridley-Thomas Supervisor Don Knabe Supervisor Michael D. Antonovich William T Fujioka, Chief
Racial Disparities in the Direct Care Workforce: Spotlight on Asian and Pacific Islander Workers
 FEBRUARY 2018 RESEARCH BRIEF Racial Disparities in the Direct Care Workforce: Spotlight on Asian and Pacific Islander Workers BY STEPHEN CAMPBELL The final publication in a three-part series focusing on
This report is published by the Council on Asian Pacific Minnesotans. For more information, contact the Council on Asian Pacific Minnesotans at
 This report is published by the Council on Asian Pacific Minnesotans. For more information, contact the Council on Asian Pacific Minnesotans at 658 Cedar Street, Suite 160 Saint Paul, Minnesota 55155 (651)
Asian Americans in New York City. A Decade of Dynamic Change Presented on April 20, 2012 Report from
 Asian Americans in New York City A Decade of Dynamic Change 2000-2010 Presented on April 20, 2012 Report from Asian Americans in New York City: A Decade of Dynamic Change Demographic Changes from 2000-2010
Labor Force Characteristics by Race and Ethnicity, 2015
 Cornell University ILR School DigitalCommons@ILR Federal Publications Key Workplace Documents 9-2016 Labor Force Characteristics by Race and Ethnicity, 2015 Bureau of Labor Statistics Follow this and additional
Setting the Context on South Asian Americans: Demographics, Civic Engagement, Race Relations. Alton Wang & Karthick Ramakrishnan AAPI Data
 Setting the Context on South Asian Americans: Demographics, Civic Engagement, Race Relations Alton Wang & Karthick Ramakrishnan AAPI Data Context #1: Growth and Diversity National Origins (2015) (in Thousands)
Far From the Commonwealth: A Report on Low- Income Asian Americans in Massachusetts
 University of Massachusetts Boston ScholarWorks at UMass Boston Institute for Asian American Studies Publications Institute for Asian American Studies 1-1-2007 Far From the Commonwealth: A Report on Low-
Diversity and Change Asian American and Pacific Islander Workers Center for Economic and Policy Research
 Diver rsity and Change Asian American and Pacific Islander Workers Hye Jin Rho, John Schmitt, Nicole Woo, Lucia Lin, and Kent Wong July 2011 Center for Economic and Policy Research 1611 Connecticut Avenue,
Traffic Density and Ethnic Composition in Massachusetts: An Exploratory Study. Rana Charafeddine Boston University School of Public Health
 Traffic Density and Ethnic Composition in Massachusetts: An Exploratory Study Rana Charafeddine Boston University School of Public Health Outline 1. Introduction 2. Research Question 3. Methods 4. Results
Using Data to Address Health Inequities. Iyanrick John Senior Policy Strategist February 12, 2019
 Using Data to Address Health Inequities Iyanrick John Senior Policy Strategist February 12, 2019 About APIAHF The Asian & Pacific Islander American Health Forum is one of the oldest and largest national
Aging among Older Asian and Pacific Islander (PI) Americans: What Improves Health-Related Quality of Life
 Americans: What Improves Health-Related Quality of Life") Gavin W. Hougham, PhD Director - Seattle Operations Battelle Advanced Analytics & Health Research Lisa A. Cubbins, PhD Senior Research Scientist Battelle Advanced Analytics & Health Research Hyoshin Kim,
Gavin W. Hougham, PhD Director - Seattle Operations Battelle Advanced Analytics & Health Research Lisa A. Cubbins, PhD Senior Research Scientist Battelle Advanced Analytics & Health Research Hyoshin Kim,
Gopal K. Singh 1 and Sue C. Lin Introduction
 BioMed Research International Volume 2013, Article ID 627412, 17 pages http://dx.doi.org/10.1155/2013/627412 Research Article Marked Ethnic, Nativity, and Socioeconomic Disparities in Disability and Health
Towards an Asian American, Native Hawaiian and Pacific Islander Health Agenda
 Towards an Asian American, Native Hawaiian and Pacific Islander Health Agenda Deeana Jang, JD Policy Director Asian & Pacific Islander American Health Forum Presentation for AAPCHO Conference March 10,
Environmental Justice Demographic Profile
 CENTRAL PUGET SOUND REGION Environmental Justice Demographic Profile January 2016 Contents INTRODUCTION... 3 OBJECTIVES... 4 DEFINITIONS... 4 Minority Populations... 4 Low-Income Population... 4 Other
Social and Demographic Trends in Burnaby and Neighbouring Communities 1981 to 2006
 Social and Demographic Trends in and Neighbouring Communities 1981 to 2006 October 2009 Table of Contents October 2009 1 Introduction... 2 2 Population... 3 Population Growth... 3 Age Structure... 4 3
HMDA Race and Ethnicity Reporting Appendix B - Revised as of August 24, 2017
 APPENDIX B TO PART 1003 FORM AND INSTRUCTIONS FOR DATA COLLECTION ON ETHNICITY, RACE, AND SEX * * * * * 8. You must report the ethnicity, race, and sex of an applicant as provided by the applicant. For
diverse communities diverse experiences
 diverse communities diverse experiences The Status of Asian Americans & Pacific Islanders in the U.S. A Review of Six Socioeconomic Indicators and Their Impact on Health APIAHF ASIAN & PACIFIC ISLANDER
BIG PICTURE: CHANGING POVERTY AND EMPLOYMENT OUTCOMES IN SEATTLE
 BIG PICTURE: CHANGING POVERTY AND EMPLOYMENT OUTCOMES IN SEATTLE January 218 Author: Bryce Jones Seattle Jobs Initiative TABLE OF CONTENTS Introduction 1 Executive Summary 2 Changes in Poverty and Deep
ASIAN AMERICANS IN METRO BOSTON: Growth, Diversity, and Complexity Prepared for the Metro Boston Equity Initiative of The Harvard Civil Rights Project
 ASIAN AMERICANS IN METRO BOSTON: Growth, Diversity, and Complexity Prepared for the Metro Boston Equity Initiative of The Harvard Civil Rights Project Paul Watanabe, Director, Institute for Asian American
OFFICE OF THE CONTROLLER. City Services Auditor 2005 Taxi Commission Survey Report
 OFFICE OF THE CONTROLLER City Services Auditor 2005 Taxi Commission Survey Report February 7, 2006 TABLE OF CONTENTS INTRODUCTION 3 SURVEY DATA ANALYSIS 5 I. The Survey Respondents 5 II. The Reasonableness
We know that the Latinx community still faces many challenges, in particular the unresolved immigration status of so many in our community.
 1 Ten years ago United Way issued a groundbreaking report on the state of the growing Latinx Community in Dane County. At that time Latinos were the fastest growing racial/ethnic group not only in Dane
DEMOGRAPHIC PROFILE Skagit County, Washington. Prepared by: Skagit Council of Governments 204 West Montgomery Street, Mount Vernon, WA 98273
 DEMOGRAPHIC PROFILE 2013 Skagit County, Washington Prepared by: Skagit Council of Governments 204 West Montgomery Street, Mount Vernon, WA 98273 CONTENTS TABLE OF CONTENTS Introduction... 1 Persons and
Indian Migration to the U.S.
 Indian Migration to the U.S. Neil G. Ruiz Associate Director of Global Migration & Demography Pew Research Center is a nonpartisan fact tank that informs the public about the issues, attitudes and trends
Under the Microscope: Asian and Pacific Islander Youth in Oakland Needs, Issues, Solutions
 Under the Microscope: Asian and Pacific Islander Youth in Oakland Needs, Issues, Solutions Published by the National Council on Crime and Delinquency, Oakland, Calif., August 2007 TABLE OF CONTENTS Index
Demographic, Social, and Economic Trends for Young Children in California
 Occasional Papers Demographic, Social, and Economic Trends for Young Children in California Deborah Reed Sonya M. Tafoya Prepared for presentation to the California Children and Families Commission October
Corporate. Report COUNCIL DATE: April 28, 2008 NO: R071 REGULAR COUNCIL. TO: Mayor & Council DATE: April 28, 2008
 Corporate NO: R071 Report COUNCIL DATE: April 28, 2008 REGULAR COUNCIL TO: Mayor & Council DATE: April 28, 2008 FROM: General Manager, Planning and Development FILE: 6600-01 SUBJECT: 2006 Census Information
Selected National Demographic Trends
 Selected National Demographic Trends Tawara D. Goode Director, Georgetown University National Center for Cultural Competence Assistant Professor, Center for Child and Human Development Spring 2016 University
Tell us what you think. Provide feedback to help make American Community Survey data more useful for you.
 DP02 SELECTED SOCIAL CHARACTERISTICS IN THE UNITED STATES 2016 American Community Survey 1-Year Estimates Supporting documentation on code lists, subject definitions, data accuracy, and statistical testing
Connecticut Marijuana Arrests
 Working to Reform Marijuana Laws The NORML Almanac of Marijuana Arrest Statistics Connecticut Marijuana Arrests Marijuana Arrests 1995-2002 (Summary) Marijuana Possession Arrests-2002 (Demographics) Marijuana
A Social Profile of the Halton Visible Minority Population
 Halton Social Planning Council and Volunteer Centre A Social Profile of the Halton Visible Minority Population December 2000 Prepared by Ted Hildebrandt Senior Planner Lyn Apgar - Research Associate December
FOR ACTION OUR COMMUNITIES. OUR PRIORITIES. OUR COUNTRY.
 FOR ACTION OUR COMMUNITIES. OUR PRIORITIES. OUR COUNTRY. Presented by the National Council of Asian Pacific Americans (NCAPA) The National Council of Asian Pacific Americans (NCAPA), founded in 1996, is
 Page 1 of 5 DP02 SELECTED SOCIAL CHARACTERISTICS IN THE UNITED STATES 2013 American Community Survey 1-Year Estimates Although the American Community Survey (ACS) produces population, demographic and housing
Needs and Challenges for. Race/Ethnicity Data
 Disaggregation of Data: Needs and Challenges for Collecting and Reporting Race/Ethnicity Data Suhaila Khan, MD PhD Marguerite Ro, DrPH August 20, 2009 Webinar Topics covered in webinar What is disaggregation
Patterns of Intermarriages and Cross-Generational In-Marriages among Native-Born Asian Americans
 Patterns of Intermarriages and Cross-Generational In-Marriages among Native-Born Asian Americans Pyong Gap Min Queens College of the City University of New York Chigon Kim Wright State University This
ASIAN AMERICANS IN HIGHER EDUCATION. Dr. Yoon Pak, Associate Professor Xavier Hernandez, PhD Student Education Policy Organization & Leadership
 ASIAN AMERICANS IN HIGHER EDUCATION Dr. Yoon Pak, Associate Professor Xavier Hernandez, PhD Student Education Policy Organization & Leadership What is a minority? State 18-24 HS Grads Qualified Who is
UNIVERSITY OF MASSACHUSETTS PERSONAL DATA QUESTIONNAIRE
 UNIVERSITY OF MASSACHUSETTS PERSONAL DATA QUESTIONNAIRE Last Name First Name Middle Name Other Name(s) Home Address Line 1 Home Address Line 2 City State Zip Home Telephone Birthdate Marital Status Married
Ethno-Racial Inequality in Montreal
 Presentation at the Quebec Inter- Centre for Social Statistics Michael Ornstein Institute for Social Research York 1 February 2008 Quantitative and Qualitative Rich description of ethno-racial groups on
Asian Pacific American Heritage Month: May 2004
 CB04-FF.06 April 19, 2004 Asian Pacific American Heritage Month: May 2004 In 1978, a joint congressional resolution established Asian Pacific American Heritage Week. The first 10 days of May were chosen
Migration Information Source - Chinese Immigrants in the United States
 Pagina 1 di 8 Chinese Immigrants in the United States By Aaron Terrazas, Jeanne Batalova Migration Policy Institute May 6, 2010 The United States is home to about 1.6 million Chinese immigrants (including
Social Profile of Oakville An Overview
 Social Profile of Oakville An Overview Prepared by Community Development Halton Funding support provided by the United Way of Oakville 2004 Community Development Halton, all rights reserved. Copies of
Executive Director. Gender Analysis of San Francisco Commissions and Boards
 Emily M. Murase, PhD Executive Director Edwin M. Lee Mayor Gender Analysis of San Francisco Commissions and Boards December 2015 Page 1 Acknowledgements The San Francisco Department on the Status of Women
An Equity Assessment of the. St. Louis Region
 An Equity Assessment of the A Snapshot of the Greater St. Louis 15 counties 2.8 million population 19th largest metropolitan region 1.1 million households 1.4 million workforce $132.07 billion economy
Reproductive Health Program Enrollment Form
 Student ID # Reproductive Health Program Enrollment Form The Reproductive Health (RH) Program pays for birth control and medical services related to reproductive health. We do not discriminate. You can
Roundtable Agenda Sign in/registration Introductions Presentation on immigration issues Roundtable discussion (concerns and issues from the community)
") Roundtable Agenda Sign in/registration Introductions Presentation on immigration issues Roundtable discussion (concerns and issues from the community) o Talk about what immigration means to your community.
Roundtable Agenda Sign in/registration Introductions Presentation on immigration issues Roundtable discussion (concerns and issues from the community) o Talk about what immigration means to your community.
APPENDIX G DEMOGRAPHICS
 APPENDIX G DEMOGRAPHICS Analyzing current and past demographic data is an important step in defining future transportation needs for individuals living and working in the PPUATS Metropolitan Planning Area.
COMMUNITY PROFILE: Fort St. John, British Columbia Census Subdivision (CSD) PHASE 1 Winter 2018
 PHASE 1 Winter 2018") COMMUNITY PROFILE: Fort St. John, British Columbia Census Subdivision (CSD) PHASE 1 Winter 2018 About the Community Development Institute Established in 2004, the Community Development Institute (CDI)
COMMUNITY PROFILE: Fort St. John, British Columbia Census Subdivision (CSD) PHASE 1 Winter 2018 About the Community Development Institute Established in 2004, the Community Development Institute (CDI)
California s Congressional District 37 Demographic Sketch
 4.02.12 California s Congressional District 37 Demographic Sketch MANUEL PASTOR JUSTIN SCOGGINS JARED SANCHEZ Purpose Demographic Sketch Understand the Congressional District s population and its unique
Asian American Defined. Leisure Patterns among Asian Americans. Objectives
 Leisure Patterns among Asian Americans Objectives Understand the historical context surrounding the immigration of Asians into the U.S. Understand core cultural values of Asians groups Understand some
Latinos in Massachusetts Selected Areas: Framingham
 University of Massachusetts Boston ScholarWorks at UMass Boston Gastón Institute Publications Gastón Institute for Latino Community Development and Public Policy Publications 9-17-2010 Latinos in Massachusetts
Asian Growth is Hot in Dallas/Ft. Worth
 Asian Growth is Hot in Dallas/Ft. Worth July 21, 2009 By Edward T. Rincón, Ph.D. As major corporations throughout the U.S. sharpen their pencils to strengthen their competitive edge, Asian consumers are
Characteristics of People. The Latino population has more people under the age of 18 and fewer elderly people than the non-hispanic White population.
 The Population in the United States Population Characteristics March 1998 Issued December 1999 P20-525 Introduction This report describes the characteristics of people of or Latino origin in the United
Hidden Challenges. A report in a series examining the status of API youth in West Contra Costa County, California
 Hidden Challenges A report in a series examining the status of API youth in West Contra Costa County, California Volume 1: Juvenile Justice and Education Issues Affecting Asian and Pacific Islander (API)
2013 UCLA Asian American Studies Center. All rights reserved. Asian American Studies Center Bridging Research with Community
 Ford Foundation The Ford Foundation supports visionary leaders and organizations on the frontlines of social change worldwide. Created with gifts and bequests by Edsel and Henry Ford, the foundation is
The Asian American Electorate in California. Why pay attention?
 The American Electorate in California Karthick Ramakrishnan Professor and Associate Dean, School of Public Policy Director, NAASURVEY and AAPIDATA Why pay attention? 0% 10% 20% 30% 40% 50% American Hispanic
The foreign born are more geographically concentrated than the native population.
 The Foreign-Born Population in the United States Population Characteristics March 1999 Issued August 2000 P20-519 This report describes the foreign-born population in the United States in 1999. It provides
CENSUS BULLETIN #5 Immigration and ethnocultural diversity Housing Aboriginal peoples
 CENSUS BULLETIN #5 Immigration and ethnocultural diversity Housing Aboriginal peoples October 25, 217 Bulletin Highlights: 86.1 per cent of the Brampton s 216 surveyed population held a Canadian citizenship
Peruvians in the United States
 Peruvians in the United States 1980 2008 Center for Latin American, Caribbean & Latino Studies Graduate Center City University of New York 365 Fifth Avenue Room 5419 New York, New York 10016 212-817-8438
Home Culture History Issues Links Viet Nam Contact Forum Jobs
 Home Culture History Issues Links Viet Nam Contact Forum Jobs Articles in This Section Behind the Headlines: APA News Blog Socioeconomic Statistics & Demographics The Model Minority Image Interracial Dating
Demographic Data. Comprehensive Plan
 Comprehensive Plan 2010-2030 4 Demographic Data Population and demographics have changed over the past several decades in the City of Elwood. It is important to incorporate these shifts into the planning
Ethno-Racial Groups in Montreal and Vancouver, : A Demographic and Socio-Economic Profile
 Ethno-Racial Groups in Montreal and Vancouver, 1971-2001: A Demographic and Socio-Economic Profile Michael Ornstein January 2007 Ethno-Racial Groups in Montreal and Vancouver, 1971-2001: A Demographic
THE IMPACT OF CHAIN MIGRATION ON ENGLISH CITIES
 Briefing Paper 9.13 www.migrationwatchuk.org THE IMPACT OF CHAIN MIGRATION ON ENGLISH CITIES Summary 1. Government proposals on chain migration have overlooked the most important factor - transcontinental
Racial Inequities in Fairfax County
 W A S H I N G T O N A R E A R E S E A R C H I N I T I A T I V E Racial Inequities in Fairfax County Leah Hendey and Lily Posey December 2017 Fairfax County, Virginia, is an affluent jurisdiction, with
Chapter 1: The Demographics of McLennan County
 Chapter 1: The Demographics of McLennan County General Population Since 2000, the Texas population has grown by more than 2.7 million residents (approximately 15%), bringing the total population of the
2011 National Household Survey Profile on the Town of Richmond Hill: 1st Release
 2011 National Household Survey Profile on the Town of Richmond Hill: 1st Release Every five years the Government of Canada through Statistics Canada undertakes a nationwide Census. The purpose of the Census
Language Needs and Abilities in the Nation s Capital, 2007
 Audrey Singer Senior Fellow Language Needs and Abilities in the Nation s Capital, 2007 Language Access in the District: Five Years in the Making Washington, DC July 15, 2009 Language Major questions Ability
Chinese. imagine all the people. Chinese in Boston Photos by Renato Castello & Jeremiah Robinson
 Chinese imagine all the people Chinese in Boston imagine all the people is a series of publications produced by the Boston Redevelopment Authority for the Mayor s Office of Immigrant Advancement. The series
CeGE-Discussion Paper
 CeGE-Discussion Paper 6 John Lunn / Todd P. Steen The Heterogeneity of Self-Employment: The Example of Asians in the United States GEORG-AUGUST-UNIVERSITÄT GÖTTINGEN JULI 2000 Die Autoren: John Lunn Professor
Georgia s Immigrants: Past, Present, and Future
 Georgia s Immigrants: Past, Present, and Future Douglas J. Krupka John V. Winters Fiscal Research Center Andrew Young School of Policy Studies Georgia State University Atlanta, GA FRC Report No. 175 April
People. Population size and growth. Components of population change
 The social report monitors outcomes for the New Zealand population. This section contains background information on the size and characteristics of the population to provide a context for the indicators
Dynamic Diversity: Projected Changes in U.S. Race and Ethnic Composition 1995 to December 1999
 Dynamic Diversity: Projected Changes in U.S. Race and Ethnic Composition 1995 to 2050 December 1999 DYNAMIC DIVERSITY: PROJECTED CHANGES IN U.S. RACE AND ETHNIC COMPOSITION 1995 TO 2050 The Minority Business
A A P I D ATA Asian American Voter Survey. Sponsored by Civic Leadership USA
 A A P I D ATA 2018 Asian American Voter Survey Sponsored by Civic Leadership USA In partnership with Asian Pacific American Labor Alliance AFL-CIO (APALA), and Asian Americans Advancing Justice AAJC CONTENTS
asian americans of the empire state: growing diversity and common needs
 asian americans of the empire state: growing diversity and common needs Table of Contents Foreword 4 Executive Summary 5 Introduction 11 Chapter 1: Statewide Demographic Change 12 Chapter 2: Regional and
The State of Asian American Children
 The State of Asian American Children 2014 Research Team Howard Shih Census Programs Director Peiyi Xu Research Analyst The statements made and views expressed are solely the responsibility of the authors.
A snapshot of our communities
 A snapshot of our communities 2014 Overview 1 Defining our region 2 Growing suburban poverty 6 Increasing globalization 7 Stubborn education gaps 8 What is the state of our region? How will we know progress
Patrick Adler and Chris Tilly Institute for Research on Labor and Employment, UCLA. Ben Zipperer University of Massachusetts, Amherst
 THE STATE OF THE UNIONS IN 2013 A PROFILE OF UNION MEMBERSHIP IN LOS ANGELES, CALIFORNIA AND THE NATION 1 Patrick Adler and Chris Tilly Institute for Research on Labor and Employment, UCLA Ben Zipperer
Racial Inequities in Montgomery County
 W A S H I N G T O N A R E A R E S E A R C H I N I T I A T I V E Racial Inequities in Montgomery County Leah Hendey and Lily Posey December 2017 Montgomery County, Maryland, faces a challenge in overcoming
Census 2016 Summary Results Part 1
 Census 2016 Summary Results Part 1 Press conference, Government Buildings 6 th April 2017 Reminder Census Day : Sunday April 24 th 2016 Just over 2 million dwellings visited by 5,000 staff Preliminary
Housing Portland s Families A Background Report for a Workshop in Portland, Oregon, July 26, 2001, Sponsored by the National Housing Conference
 Housing Portland s Families A Background Report for a Workshop in Portland, Oregon, July 26, 2001, Sponsored by the National Housing Conference by Barry Edmonston and Risa Proehl Housing Portland s Families
SECTION 1. Demographic and Economic Profiles of California s Population
 SECTION 1 Demographic and Economic Profiles of s Population s population has special characteristics compared to the United States as a whole. Section 1 presents data on the size of the populations of
Contact Information Current Address - Street Address 1 (type in) - Street Address 2 (optional) Personal Information Section
 - Street Address 2 (optional) Personal Information Section") Personal Information Section This section contains questions about biographic, contact, citizenship, race and ethnicity, and other information; including language proficiency, military status, legal infractions,
Personal Information Section This section contains questions about biographic, contact, citizenship, race and ethnicity, and other information; including language proficiency, military status, legal infractions,
Contents. Acknowledgements...xii Leading facts and indicators...xiv Acronyms and abbreviations...xvi Map: Pacific region, Marshall Islands...
 Contents Acknowledgements...xii Leading facts and indicators...xiv Acronyms and abbreviations...xvi Map: Pacific region, Marshall Islands... xii CHAPTER 1: CENSUS ORGANIZATION AND OPERATIONS...1 CHAPTER
An analysis and presentation of the APIAVote & Asian Americans Advancing Justice AAJC 2014 Voter Survey
 ASIAN AMERICANS TURN OUT FOR WHAT? SPOTLIGHT ON YOUTH VOTERS IN 2014 An analysis and presentation of the APIAVote & Asian Americans Advancing Justice AAJC 2014 Voter Survey Survey research and analysis
Verdun borough HIGHLIGHTS. In 1996, the Verdun borough had a population of 59,714. LOCATION
 Socio-economic profile borough February 2002 HIGHLIGHTS In 1996, the borough had a population of 59,714. LOCATION Between 1991 and 1996, the population of the borough declined by 2.6%. One-person households
Neighborhood Diversity Characteristics in Iowa and their Implications for Home Loans and Business Investment
 Economics Technical Reports and White Papers Economics 9-2008 Neighborhood Diversity Characteristics in Iowa and their Implications for Home Loans and Business Investment Liesl Eathington Iowa State University,
2000 Decennial Census (SF-1), Table: P001, PCT005 and PCT007 Race/Ethnicity
, Table: P001, PCT005 and PCT007 Race/Ethnicity") Technical Report for the State and Regional Profiles on the American Population and Asset-building Trends This Technical Report is a supplement to the state and regional narrative reports prepared for
Technical Report for the State and Regional Profiles on the American Population and Asset-building Trends This Technical Report is a supplement to the state and regional narrative reports prepared for
Brockton and Abington
 s in Massachusetts Selected Areas Brockton and Abington by Phillip Granberry, PhD and Sarah Rustan September 17, 2010 INTRODUCTION This report provides a descriptive snapshot of selected economic, social,
The Changing Racial and Ethnic Makeup of New York City Neighborhoods
 The Changing Racial and Ethnic Makeup of New York City Neighborhoods State of the New York City s Property Tax New York City has an extraordinarily diverse population. It is one of the few cities in the
Transitions to Work for Racial, Ethnic, and Immigrant Groups
 Transitions to Work for Racial, Ethnic, and Immigrant Groups Deborah Reed Christopher Jepsen Laura E. Hill Public Policy Institute of California Preliminary draft, comments welcome Draft date: March 1,
2016 Census: Housing, Immigration and Ethnocultural Diversity, Aboriginal peoples
 October 26, 2017 Backgrounder 2016 Census: Housing, Immigration and Ethnocultural Diversity, Aboriginal peoples The 2016 Census Day was May 10, 2016. On October 25, 2017, Statistics Canada released data
LATINO DATA PROJECT. Astrid S. Rodríguez Ph.D. Candidate, Educational Psychology. Center for Latin American, Caribbean, and Latino Studies
 LATINO DATA PROJECT Demographic, Economic, and Social Transformations in the South Bronx: Changes in the NYC Community Districts Comprising Mott Haven, Port Morris, Melrose, Longwood, and Hunts Point,
Demographic, Economic, and Social Transformations in Queens Community District 3: East Elmhurst, Jackson Heights, and North Corona,
 Demographic, Economic, and Social Transformations in Queens Community District 3: East Elmhurst, Jackson Heights, and North Corona, 1990-2006 Astrid S. Rodríguez Fellow, Center for Latin American, Caribbean
Seattle Public Schools Enrollment and Immigration. Natasha M. Rivers, PhD. Table of Contents
 Seattle Public Schools Enrollment and Immigration Natasha M. Rivers, PhD Table of Contents 1. Introduction: What s been happening with Enrollment in Seattle Public Schools? p.2-3 2. Public School Enrollment
Look Ahead. Monday (10/10) elearning quiz 5. Wednesday (10/12) 5:45-7:15 PM at Library Annex 410 out-of-class showing of film, Claiming Open Spaces
 elearning quiz 5. Wednesday (10/12) 5:45-7:15 PM at Library Annex 410 out-of-class showing of film, Claiming Open Spaces") Look Ahead Monday (10/10) elearning quiz 5. Wednesday (10/12) 5:45-7:15 PM at Library Annex 410 out-of-class showing of film, Claiming Open Spaces Friday (10/14) Your second essay. Leisure Patterns among
Look Ahead Monday (10/10) elearning quiz 5. Wednesday (10/12) 5:45-7:15 PM at Library Annex 410 out-of-class showing of film, Claiming Open Spaces Friday (10/14) Your second essay. Leisure Patterns among
AN AGENDA FOR JUSTICE CONTOURS OF PUBLIC OPINION AMONG ASIAN AMERICANS
 AN AGENDA FOR JUSTICE CONTOURS OF PUBLIC OPINION AMONG ASIAN AMERICANS An analysis and presentation of the APIAVote & Asian Americans Advancing Justice AAJC 2014 Voter Survey Survey research and analysis
Title VI & Environmental Justice Plan
 Corvallis Area Metropolitan Planning Organization Title VI & Environmental Justice Plan Compliance with Federal Requirements under 49 CFR Part 21 and 23 CFR Part 200 Corvallis Area Metropolitan Planning
STATE OF WORKING RHODE ISLAND WOR KE RS OF COLOR. economicprogressri.org
 STATE OF WORKING RHODE ISLAND 215 WOR KE RS OF COLOR economicprogressri.org economicprogressri.org 6 Mt. Pleasant Avenue, Building #9, Providence, RI 298 telephone (41) 456-8512 fax (41) 456-955 info@economicprogressri.org
Illegal Immigration: How Should We Deal With It?
 Illegal Immigration: How Should We Deal With It? Polling Question 1: Providing routine healthcare services to illegal Immigrants 1. Is a moral/ethical responsibility 2. Legitimizes illegal behavior 3.