Chinese. imagine all the people. Chinese in Boston Photos by Renato Castello & Jeremiah Robinson
|
|
|
- Stephanie Bond
- 5 years ago
- Views:
Transcription


1 Chinese imagine all the people Chinese in Boston imagine all the people is a series of publications produced by the Boston Redevelopment Authority for the Mayor s Office of Immigrant Advancement. The series provides a comprehensive profile of Boston s diverse immigrant communities and their numerous contributions to the city s social, cultural and economic landscape. It is part of an ongoing effort to celebrate immigrants and gain insight into how they shape our city. CITY OF BOSTON Martin J. Walsh Mayor 2016 Photos by Renato Castello & Jeremiah Robinson

2 The migration of Chinese individuals to Boston goes back over 100 years to the late 1800s when the first Chinese residents settled in what is now known as Boston s Chinatown, centered on Beach Street and bordered by the Boston Common, Downtown Crossing, the South End and the Massachusetts Turnpike. Chinese immigrants who first settled in the area came from California, which had long been a popular destination for Chinese immigrants. Most came to Boston to flee anti-chinese sentiment in California. Around the same time the first Chinese residents began settling in what would become Chinatown, several of Boston s large garment manufacturing plants relocated to the neighborhood, creating the garment district, which was active into the 1990s. Construction of the Southeast Expressway (I-93) through Chinatown in the 1950s and expansion of the New England Medical Center in the 1960s and 70s constrained growth of the community. However, negotiations with community leaders led to the public financing of community housing in the neighborhood. Chinatown remains a hub of Asian-American life, with Cambodian, Vietnamese and Japanese restaurants and stores accompanying Chinese establishments. It is the only historic Chinese neighborhood in New England. Today, Chinese migration is shaped by an influx of Chinese students who are living in Boston while they attend college or university. These students possess a temporary visa (F-1) that allows them to remain in the United States up to 60 days beyond the completion of their academic program. If they wish to remain longer they must obtain an H1B visa. A greater share of foreign-born Chinese have arrived in the United States after 2000 (49 percent) compared to all foreign born (43 percent.). Chinese New Year s Celebration - Jeremiah Robinson 2

3 Chinese in the United States The American Community Survey (ACS) 1 estimates that 2,519,964 foreignborn 2 individuals from China (including Taiwan and Hong Kong) resided in the United States in Immigrants from China help make Chinese the largest Asian population in the United States followed by populations from India, the Philippines, and Vietnam. The United States is the largest destination for Chinese emigration, followed by Canada, South Korea, Japan, and Australia. 3 About 2.5 million foreign-born Chinese live in the United States. With an estimated population of 107,627, Massachusetts ranks fourth among states with 4.3 percent of the Chinese foreign-born population in the United States. 4 The other popular states for immigrants from China are California, which accounts for 31 percent of the country s Chinese population; New York (18 percent); and Texas (5 percent) and New Jersey (4 percent). Together with Massachusetts, these five states comprise nearly 63 percent of the Chinese foreign-born population living in the United States. 5 Share of Foreign-Born Chinese Population by State Source: U.S. Census Bureau, 2014 American Community Survey, BRA Research Division Analysis 3

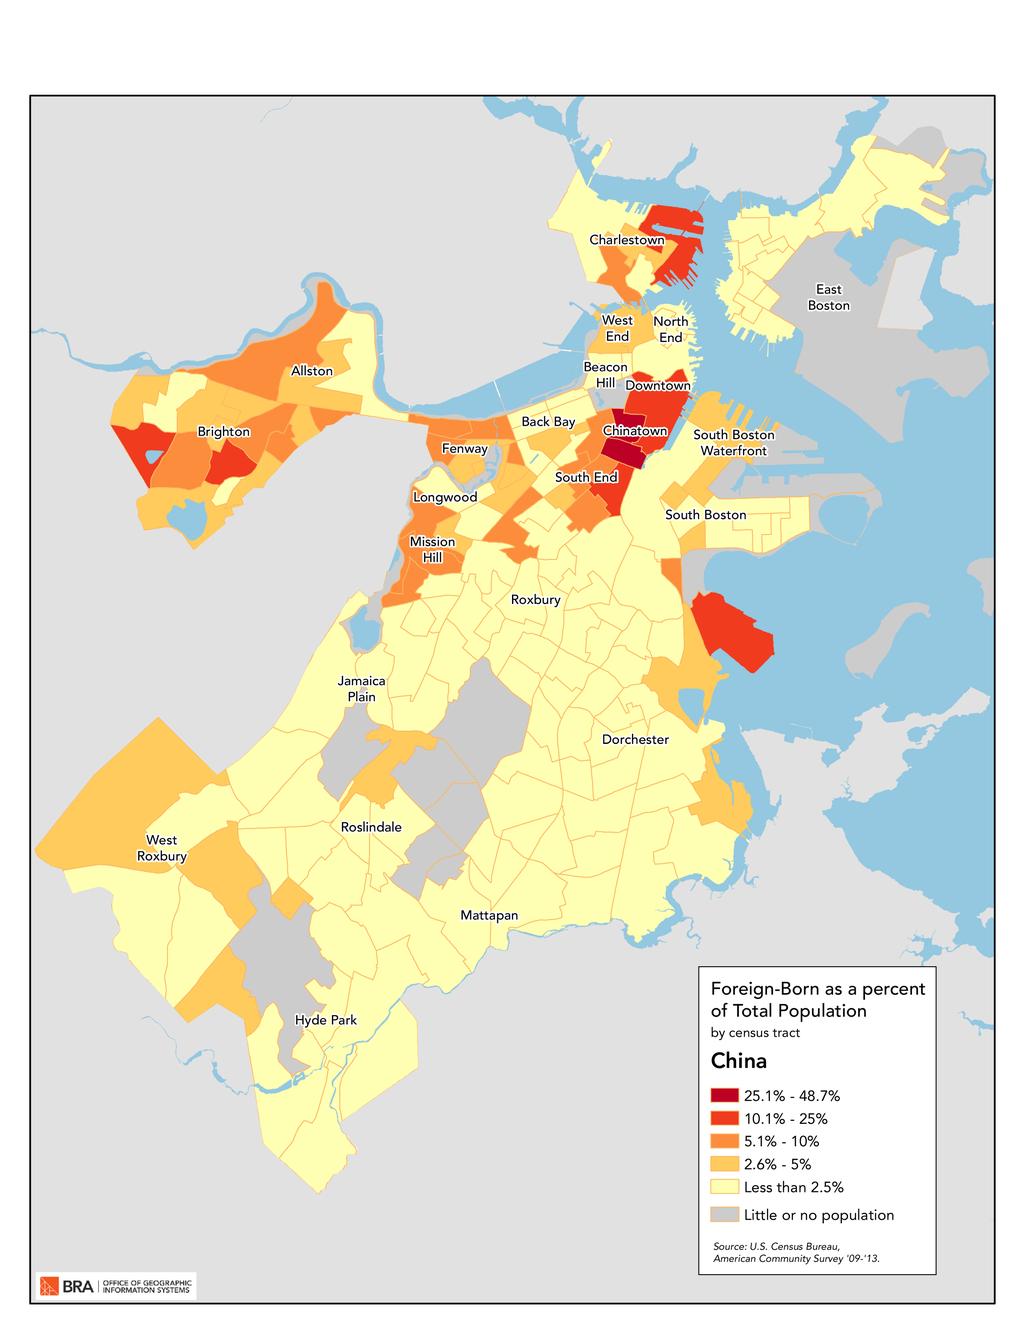
4 Chinese in Boston The 2014 ACS estimates that 22,356 6 foreign-born Chinese live in Boston. Overall, Chinese comprise the second largest foreign-born population in Boston behind Dominicans, and they make up approximately 11 percent of the city s total foreign-born population. 7 Haitians comprise the next largest share of the city s foreign-born population (8 percent); Salvadorans (6 percent) rank fourth and Vietnamese (6 percent) rank fifth. The U.S. Census Bureau s ACS Public Use Microdata Sample (PUMS) allows for the detailed socio-economic analysis of specific populations. For smaller populations like foreign-born Chinese in Boston, a 5-year sample is required to limit variation due to sampling error. The analysis that follows uses ACS PUMS data. According to the Year ACS, Boston s foreign-born Chinese, though found throughout the city, are mostly concentrated in the neighborhoods of Downtown (including Chinatown), Brighton, the South End, Fenway, Charlestown, Mission Hill, and Dorchester. 8 Unlike other foreign-born populations who have greater female populations, 55 percent of Chinese in Boston are male. Over half of foreign-born Chinese are married (56 percent), 7 percent are widowed, and 7 percent are divorced or separated. Approximately 27 percent of all foreign-born Chinese are between the ages of 20-34, and the majority 65 percent are over the age of 35. Approximately 45 percent of foreign-born Chinese residents are naturalized U.S. citizens. Nearly 20% of foreign-born Chinese in Boston are enrolled in a college or university. Chinese New Year s Parade in Chinatown Don Harney 4


5 Educational Attainment Foreign-born Chinese form two distinct groups based on educational attainment: those with at least a Bachelor s degree and those with less than a high school diploma. Many people come to Boston from China to get a higher education. Nearly 20 percent of all foreign-born Chinese are enrolled in a college or university, compared to 13 percent of all foreign born in Boston. Of the population 25 years or older, 36 percent of foreign-born Chinese have completed at least a Bachelor s degree, compared with 29 percent of the entire foreign-born population and 52 percent of the native-born population. With respect to advanced degrees, just over 21 percent of foreign-born Chinese living in Boston hold a graduate or professional degree, more than the 14 percent of all foreign -born but less than the 22 percent of all native-born residents. However, many foreign-born Chinese do not have high levels of educational attainment. Of the Chinese foreign-born population 25 years or older, 36.5 percent have not completed high school. This figure is higher than for foreign-born residents (28 percent) and more than four times the share for the native-born population (9 percent). Educational Attainment Boston Residents 25 Years and Older Foreign-born Chinese form two distinct groups based on education: of those over age 25, 36% have not completed high school and another 36% have a Bachelor s degree or higher. U.S. Census Bureau, American Community Survey, PUMS, BRA Research Division Analysis 5

6 In total, 55 percent of foreign-born Chinese participate in the labor force, compared to 68 percent for the total foreign-born and 69 percent for native-born populations of Boston. 9 As their educational attainment suggests, foreign-born Chinese form two distinct occupational groupings: managerial/professional and service. Nearly one-third of foreign-born Chinese in the labor force work in service occupations. 10 The next highest occupational category is managerial and professional (28 percent), followed by education, training and library occupations (9 percent). Foreign-born Chinese are over-represented in the service sector compared to the native born but have similar shares compared to other foreign born. This higher level of participation in the service sector is likely driven by corresponding lower levels of educational attainment. However, unlike other foreign-born populations that are also over-represented in the service sector, they are not under-represented in managerial and professional occupations. The nearly 29 percent of foreign-born Chinese who work in managerial and professional positions is greater than the overall foreign-born average of 17 percent for this category and slightly higher than the native born. Occupations by Nativity U.S. Census Bureau, American Community Survey, PUMS, BRA Research Division Analysis 6

7 Type of Employment An estimated 71 percent of foreign-born Chinese in Boston work for private, for-profit firms. This is similar to other foreign-born residents (excluding unpaid family members, but higher than for the native born who have greater shares working for the public sector (local, state and federal government). Approximately 22 percent of foreign-born Chinese are employed in private non-profit institutions higher than for both the foreign-born and native-born populations. Entrepreneurship among Boston s foreign-born Chinese population is lower than that of many foreign born groups, as an estimated 4 percent are self-employed. This is lower than the 7 percent of all foreign-born and the 6 percent of native-born residents who are selfemployed. 11 Foreign-born Chinese are more likely to be employed in private non-profit firms than other populations. Employment by Type of Employer U.S. Census Bureau, American Community Survey, PUMS, BRA Research Division 7


8 Imagine all the people: Chinese Age Gender Marital Status Source: U.S. Census Bureau, American Community Survey, BRA Research Division Analysis 8


9 Housing Tenure* Housing Costs* Medical Uninsurance *Housing data are based on the householder s country of origin. 9
 that calculated the value of goods and services consumed on each dollar spent.")

10 Economic Impact Foreign-born Chinese contribute to the local economy through their labor and consumer spending. The total value of their economic contributions were estimated using a Regional Economic Model (REMI) that calculated the value of goods and services consumed on each dollar spent. Foreign-born Chinese in Boston generated total expenditures of $430 million in These annual expenditures contributed over $258 million to the regional product and generated $14 million in state and local taxes. 13 In total, these expenditures supported 1,800 jobs in the Massachusetts economy. 14 The World Bank estimates that in 2014 Chinese remittances from the United States totaled $16.3 billion. Chinatown National Night Out Don Harney 10

11 Standard of Living Approximately 28 percent of foreign-born Chinese have achieved a middle class standard of living, compared with 45 percent of Boston s native-born population, and 29 percent of all foreign-born residents. A family income four times the poverty level is a proxy for a middle-class standard of living. The actual income needed to achieve this standard depends on the size and composition of the family. For a two-person family in 2014, a middle class income would be at least $62, A greater share of foreign-born Chinese live in poverty (29 percent) than do all foreign born in Boston (22 percent). 29% of foreignborn Chinese live in poverty. Lower educational attainment and lack of English proficiency may contribute to this lower standard of living. While 18 percent of Boston s adult foreignborn population lack a high school diploma and have limited English proficiency, the share among foreign-born Chinese adults is 32 percent. 16 Over half of foreign-born Chinese lack a high school diploma or English proficiency or both. Educational Attainment and English Proficiency Population 25 Years or Older U.S. Census Bureau, American Community Survey, PUMS, BRA Research Division Analysis 11

12 12
.")
13 Children of Chinese Origin The American Community Survey estimates 3,170 children in Boston are of Chinese origin. 17 Children of Chinese origin in Boston are predominately native born 86 percent. However, 69 percent of Chinese children live with only foreign-born parent(s). In comparison, 40 percent of all Boston s children live with only foreign-born parent(s). Of Chinese children ages 5 to 17 with only foreign-born parent(s), about 9 percent speak only English at home, compared to 22 percent for all children with only foreign-born parent(s). These Chinese children appear to be learning English but at a lower rate than other children of foreign-born parent(s): 70 percent of Chinese children with foreign-born parent(s) speak English very well, but 76 percent of all children with only foreign-born parent(s) speak English very well. Chinese children with foreign-born parent(s) are slightly less likely to live in poverty than other children in Boston. The federal poverty level in 2014 was $23,850 for a 4-person household, and 25 percent of Chinese children with foreign-born parent(s) were living below the poverty level, compared to 28 percent of all children in Boston. Chinese children are also having fewer problems acquiring medical insurance. Less than 1 percent of Chinese children with foreign born parent(s) are uninsured, compared to 2 percent of all children in Boston. Angel Performing Arts School of Dance 2014 We are Boston Gala Renato Castello Conclusion Massachusetts is a leading destination of Chinese who migrate to the United States. Foreign-born Chinese in Boston actively contribute to the economy, culture, and civic life of their new home. However, they have lower rates of labor force participation compared to other populations. Foreign-born Chinese are a diverse group. They are equally likely to have less than a high school education and to have a Bachelor s degree or higher. Foreign-born Chinese are equally likely to work in lower wage service occupations as in higher wage managerial and professional occupations. As this dichotomy would suggest, foreign-born Chinese are equally likely to be middle class (28 percent) as they are to be living below the poverty level (29 percent). 13
14 1 The ACS is a yearly survey conducted by the U.S. Census Bureau intended to allow communities to see how they are changing in the years between decennial censuses. The ACS is based on a sample of the population. While the data in this document are reported as specific numbers and percentages, all results from the ACS are subject to sampling error. For more information on the ACS, please see: The foreign-born population includes all people who are born outside the U.S., naturalized citizens, and non-u.s. citizens. The native-born population includes all people born in the United States, Puerto Rico, or the U.S. Island Areas and persons born abroad by American parents. Boston Redevelopment Authority (BRA) Research Division (2016). 3 Hooper, Kate, and Batalova, Jeanne. Chinese Immigrants in the United States, Migration Policy Institute (2015). 4 American Community Survey, 2014, American Fact Finder, BRA Research Analysis. 5 American Community Survey, 2014, American Fact Finder, BRA Research Analysis. 6 The ACS s American Fact Finder website reports that there are an estimated 22,236 foreign-born Chinese in Boston in However, the latest ACS, Public Use Microdata Sample (PUMS,) data for Boston estimate the foreignborn Chinese population to be 17,388 during this period. Lower survey response rates due to language or documentation issues may result in an under count of the population. 7 American Community Survey, 2014, American Fact Finder, BRA Research Analysis. 8 American Community Survey, , American Fact Finder, BRA Research Analysis (2016). 9 Labor force participation is defined as the share of the working-age population that is either currently employed or seeking work. U.S. Department of Labor, Bureau of Labor Statistics, This analysis organizes occupations of workers into 12 categories. Managerial and Professional contains categories of Management, Business, Science, and Arts Occupations, Business Operations Specialists, Financial Specialists, Computer and Mathematical Occupations, Architecture and Engineering Occupations, Life, Physical, and Social Science Occupations, and Legal Occupations. Healthcare Practitioners & Support contains the categories of Healthcare Practitioners and Technical Occupations and Healthcare Support Occupations. Service Occupations contains the categories of Protective Service Occupations, Food Preparation and Serving Occupations, Building and Grounds Cleaning and Maintenance Occupations, and Personal Care and Service Occupations. Construction, Extraction, Maintenance, and Transportation contains the categories of Construction and Extraction Occupations, Extraction Workers, Installation, Maintenance, and Repair Workers, and Transportation and Material Moving Occupations. Other categories consisting of Farming, Fishing, and Forestry, Military Specific, and long-term unemployed are excluded. 14

15 11 There is no agreement among researchers regarding the reasons for variations in the self employment rates among different immigrant groups. Reasons cited include human and financial capital of individual immigrants, high rates of solidarity and social capital in some immigrant communities, as well as the opportunity structure encountered by immigrant entrepreneurs Regional Economic Model, Inc., REMI calculations, BRA Research Division Regional Economic Model, Inc., REMI calculations, BRA Research Division Regional Economic Model, Inc., REMI calculations, BRA Research Division. 15 Following the Office of Management and Budget's (OMB) Statistical Policy Directive 14, the Census Bureau uses a set of money income thresholds that vary by family size and composition to determine who is in poverty. If a family's total income is less than the family's threshold, then that family and every individual in it is considered in poverty. The official poverty thresholds do not vary geographically. U.S. Census Bureau (2016). 16 Limited English Proficiency includes foreign-born adults who do not speak English well or at all. 17 Chinese origin is estimated from ancestry variables in the ACS. The ACS question on ancestry is "What is your ancestry or ethnic origin?" The response to the question allows the respondents to report one or two ancestries with which they identify. This analysis codes up to two ancestries to estimate Chinese origin. They can be Chinese, Cantonese, or Taiwanese. Boston City Council President Michelle Wu at 2016 Inauguration ceremony at Faneuil Hall. (Mayor's Office photo by Don Harney) 15


16 Brian P. Golden, Director Produced by the BRA Research Division Alvaro Lima Director of Research Jonathan Lee Deputy Director Christina Kim Research Manager Phillip Granberry Senior Researcher/Demographer Matthew Resseger Senior Researcher/Economist Kevin Kang Research Associate Kevin Wandrei Research Assistant Interns: Michael Bratsis Jingwan Wang Cyan O Garro Map by BRA Digital Cartography & GIS Alla Ziskin 16
Salvadorans. imagine all the people. Salvadorans in Boston
 Salvadorans imagine all the people Salvadorans in Boston imagine all the people is a series of publications produced by the Boston Redevelopment Authority for the Mayor s Office of Immigrant Advancement.
Cape Verdeans. all the people. Cape Verdeans in Boston
 imagine Cape Verdeans all the people Cape Verdeans in Boston imagine all the people is a series of publications produced by the Boston Redevelopment Authority for the Mayor s Office of Immigrant Advancement.
Brazilians. imagine all the people. Brazilians in Boston
 Brazilians imagine all the people Brazilians in Boston imagine all the people is a series of publications produced by the Boston Redevelopment Authority for the Mayor s Office of Immigrant Advancement.
Irish. imagine all the people. Irish in Boston
 Irish in Boston imagine all the people is a series of publica ons produced by the Boston Redevelopment Authority for the Mayor s Office of Immigrant Advancement. The series provides a comprehensive profile
Haitians. imagine all the people. Haitians in Boston
 Haitians in Boston imagine all the people is a series of publica ons produced by the Boston Redevelopment Authority for the Mayor s Office of Immigrant Advancement. The series provides a comprehensive profile
Salvadorans. in Boston
 Salvadorans in Boston Banda El Salvador at the 2013 Rose Parade in Pasadena, California. Photo by Prayitno Photography, retrieved from flickr.com/ photos/prayitnophotography (Creative Commons Attribution
Brazilians. in Boston
 Brazilians in Boston The Dewey Square mural (2012), by the Brazilian artist duo Os Gémeos (twins Otávio and Gustavo Pandolfo), spray painted on a 25-metre wide wall on the occasion of their exhibition
Migration Information Source - Chinese Immigrants in the United States
 Pagina 1 di 8 Chinese Immigrants in the United States By Aaron Terrazas, Jeanne Batalova Migration Policy Institute May 6, 2010 The United States is home to about 1.6 million Chinese immigrants (including
Our Shared Future: U N D E R S T A N D I N G B O S T O N. #SharedFuture. Charting a Path for Immigrant Advancement in a New Political Landscape
 U N D E R S T A N D I N G B O S T O N Our Shared Future: Charting a Path for Immigrant Advancement in a New Political Landscape Wednesday, April 19 th, 2017 8:30-10:30 a.m. #SharedFuture U N D E R S T
Foreign Migration to the Cleveland-Akron-Lorain Metropolitan Area From 1995 to 2000
 EngagedScholarship@CSU Urban Publications Maxine Goodman Levin College of Urban Affairs 12-22-2005 Foreign Migration to the Cleveland-Akron-Lorain Metropolitan Area From 1995 to 2000 Mark Salling, m.salling@csuohio.edu
Brockton and Abington
 s in Massachusetts Selected Areas Brockton and Abington by Phillip Granberry, PhD and Sarah Rustan September 17, 2010 INTRODUCTION This report provides a descriptive snapshot of selected economic, social,
Latinos in Massachusetts Selected Areas: Framingham
 University of Massachusetts Boston ScholarWorks at UMass Boston Gastón Institute Publications Gastón Institute for Latino Community Development and Public Policy Publications 9-17-2010 Latinos in Massachusetts
Far From the Commonwealth: A Report on Low- Income Asian Americans in Massachusetts
 University of Massachusetts Boston ScholarWorks at UMass Boston Institute for Asian American Studies Publications Institute for Asian American Studies 1-1-2007 Far From the Commonwealth: A Report on Low-
Overview of Boston s Population. Boston Redevelopment Authority Research Division Alvaro Lima, Director of Research September
 Overview of Boston s Population Boston Redevelopment Authority Research Division Alvaro Lima, Director of Research September - 2011 Historic Trends Boston s Population Boston reached its population peak
IMMIGRATION FACTS. How Changes to Family Immigration Could Affect Source Countries Sending Patterns. Migration Policy Institute
 The Migration Policy Institute is an independent, nonpartisan, and nonprofit think tank dedicated to the study of the movement of people worldwide. The institute provides analysis, development, and evaluation
Washington Area Economy: Performance and Outlook
 Washington Area Economy: Performance and Outlook Presentation to: Arlington Economic Development Commission Mark C. White, Ph.D. Deputy Director Center for Regional Analysis Schar School of Policy and
Institute for Public Policy and Economic Analysis
 Institute for Public Policy and Economic Analysis The Institute for Public Policy and Economic Analysis at Eastern Washington University will convey university expertise and sponsor research in social,
Geographic Mobility of New Jersey Residents. Migration affects the number and characteristics of our resident population
 Geographic Mobility of New Jersey Residents Migration affects the number and characteristics of our resident population Geographic Mobility of New Jersey Residents More than 4.1 million (or 47.4%) New
Briefing Book- Labor Market Trends in Metro Boston
 Briefing Book- Labor Market Two other briefing books focus on the importance of formal education and ESOL courses to Boston s foreign-born residents. While there are a number of reasons why improving immigrant
The foreign born are more geographically concentrated than the native population.
 The Foreign-Born Population in the United States Population Characteristics March 1999 Issued August 2000 P20-519 This report describes the foreign-born population in the United States in 1999. It provides
Chapter 1: The Demographics of McLennan County
 Chapter 1: The Demographics of McLennan County General Population Since 2000, the Texas population has grown by more than 2.7 million residents (approximately 15%), bringing the total population of the
Louisville: Immigration Rebirth Matt Ruther, Department of Urban and Public Affairs, University of Louisville
 Louisville: Immigration Rebirth Matt Ruther, Department of Urban and Public Affairs, University of Louisville Germantown. Schnitzelburg. Irish Hill. The names of neighborhoods within Louisville s urban
Demographic Data. Comprehensive Plan
 Comprehensive Plan 2010-2030 4 Demographic Data Population and demographics have changed over the past several decades in the City of Elwood. It is important to incorporate these shifts into the planning
Socio-Economic Mobility Among Foreign-Born Latin American and Caribbean Nationalities in New York City,
 Socio-Economic Mobility Among Foreign-Born Latin American and Caribbean Nationalities in New York City, 2000-2006 Center for Latin American, Caribbean & Latino Studies Graduate Center City University of
Cultural Frames: An Analytical Model
 Figure 1.1 Cultural Frames: An Analytical Model Hyper-Selectivity/ Hypo-Selectivity Ethnic Capital Tangible and Intangible Resources Host Society Public Institutional Resources The Stereotype Promise/Threat
Latest Immigration Data
 Latest Immigration Data And America s Changing Classrooms Denzil Mohammed Director, Public Education Institute The Immigrant Learning Center, Inc., Malden MA dmohammed@ilctr.org Immigrant Student Success,
Racial Inequities in Montgomery County
 W A S H I N G T O N A R E A R E S E A R C H I N I T I A T I V E Racial Inequities in Montgomery County Leah Hendey and Lily Posey December 2017 Montgomery County, Maryland, faces a challenge in overcoming
The Popula(on of New York City Recent PaFerns and Trends
 TM The Popula(on of New York City Recent PaFerns and Trends Presenta(on for the Macaulay Honors College of the City University of New York January 28, 2014 Joseph Salvo POPULATION DIVISION New York City
Immigrants are playing an increasingly
 Trends in the Low-Wage Immigrant Labor Force, 2000 2005 THE URBAN INSTITUTE March 2007 Randy Capps, Karina Fortuny The Urban Institute Immigrants are playing an increasingly important role in the U.S.
Planning Study Area 1 Burnaby Heights
 Neighbourhood Profiles 2006 Census Planning Study Area 1 Heights is bounded by Burrard Inlet to the north, Willingdon Avenue to the east, Hastings Street to the south and Boundary Road to the west. PLANNING
DATA PROFILES OF IMMIGRANTS IN THE DISTRICT OF COLUMBIA
 DATA PROFILES OF IMMIGRANTS IN THE DISTRICT OF COLUMBIA LATINO IMMIGRANTS Demographics Economic Opportunity Education Health Housing This is part of a data series on immigrants in the District of Columbia
Labor Force Characteristics by Race and Ethnicity, 2015
 Cornell University ILR School DigitalCommons@ILR Federal Publications Key Workplace Documents 9-2016 Labor Force Characteristics by Race and Ethnicity, 2015 Bureau of Labor Statistics Follow this and additional
Racial Inequities in Fairfax County
 W A S H I N G T O N A R E A R E S E A R C H I N I T I A T I V E Racial Inequities in Fairfax County Leah Hendey and Lily Posey December 2017 Fairfax County, Virginia, is an affluent jurisdiction, with
Profile of New York City s Chinese Americans: 2013 Edition
 Profile of New York City s Chinese Americans: 2013 Edition Asian American Federation Census Information Center Introduction Using data from the Census Bureau s 2006-2008 and 2009-2011 American Community
Indian Migration to the Global North in the Americas: The United States
 Chapter 1 Indian Migration to the Global North in the Americas: The United States The multicultural, multiracial and diverse character of North American society reflects the consequences of significant
Illegal Immigration: How Should We Deal With It?
 Illegal Immigration: How Should We Deal With It? Polling Question 1: Providing routine healthcare services to illegal Immigrants 1. Is a moral/ethical responsibility 2. Legitimizes illegal behavior 3.
Peruvians in the United States
 Peruvians in the United States 1980 2008 Center for Latin American, Caribbean & Latino Studies Graduate Center City University of New York 365 Fifth Avenue Room 5419 New York, New York 10016 212-817-8438
The Foreign-Born Population of Southeastern Pennsylvania. By Randy Capps
 The Foreign-Born Population of Southeastern Pennsylvania By Randy Capps Philadelphia June 15 th, 2016 Acknowledgments Ariel Ruiz at MPI analyzed the data and wrote the slides for this presentation. James
February 1, William T Fujioka, Chief Executive Officer. Dean C. Logan, Registrar-Recorder/County Clerk
 January 31, 2012 Page 1 of 13 TO: Supervisor Zev Yaroslavsky, Chair Supervisor Gloria Molina Supervisor Mark Ridley-Thomas Supervisor Don Knabe Supervisor Michael D. Antonovich William T Fujioka, Chief
Asian American Defined. Leisure Patterns among Asian Americans. Objectives
 Leisure Patterns among Asian Americans Objectives Understand the historical context surrounding the immigration of Asians into the U.S. Understand core cultural values of Asians groups Understand some
Report Finds that Worcester s Foreign-Born Are Major Economic Contributors
 September 28, 2015 FOR IMMEDIATE RELEASE Report Finds that Worcester s Foreign-Born Are Major Economic Contributors UMass report finds local immigrants play a large and critical role in the local economy
Dominicans in New York City
 Center for Latin American, Caribbean & Latino Studies Graduate Center City University of New York 365 Fifth Avenue Room 5419 New York, New York 10016 212-817-8438 clacls@gc.cuny.edu http://web.gc.cuny.edu/lastudies
Filipino. April in the United States in. are more. in Nearly half of. States. Immigrants in. more. Migration Policy Institute ?
 Filipino Immigrants in the United States By Aaron Terrazas and Jeanne Batalova Migration Policy Institute April 2010 The United States is home to about 1.7 million Filipino immigrants, making them the
Older Immigrants in the United States By Aaron Terrazas Migration Policy Institute
 Older Immigrants in the United States By Aaron Terrazas Migration Policy Institute May 2009 After declining steadily between 1960 and 1990, the number of older immigrants (those age 65 and over) in the
The EEO Tabulation: Measuring Diversity in the Workplace ACS Data Users Conference May 29, 2014
 The EEO Tabulation: Measuring Diversity in the Workplace ACS Data Users Conference May 29, 2014 Ana J. Montalvo Industry and Occupation Statistics Branch Social, Economic, and Housing Statistics Division
Indian Migration to the U.S.
 Indian Migration to the U.S. Neil G. Ruiz Associate Director of Global Migration & Demography Pew Research Center is a nonpartisan fact tank that informs the public about the issues, attitudes and trends
Nebraska s Foreign-Born and Hispanic/Latino Population
 January 2011 Nebraska s Foreign-Born and Hispanic/Latino Population Socio-Economic Trends, 2009 OLLAS Office of Latino/Latin American Studies (OLLAS) University of Nebraska - Omaha Off i c e o f La t i
International Education in the Comox Valley: Current and Potential Economic Impacts
 International Education in the Comox Valley: Current and Potential Economic Impacts FINAL REPORT March 2012 Prepared by: Vann Struth Consulting Group Inc. Vancouver, BC www.vannstruth.com Prepared for:
Nebraska s Foreign Born and Hispanic/Latino Population
 Nebraska s Foreign Born and Hispanic/ Demographic Trends, 1990 2008 January 15, 2010 Office of /Latin American Studies (OLLAS) University of Nebraska Omaha University of Nebraska Omaha Office of /Latin
Boston s Emerging Ethnic Quilt: A Geographic Perspective. James P. Allen and Eugene Turner. California State University, Northridge.
 Boston s Emerging Ethnic Quilt: A Geographic Perspective by James P. Allen and Eugene Turner Department of Geography California State University, Northridge Notes The 15 full-color maps that are integral
Asian Pacific American Heritage Month: May 2004
 CB04-FF.06 April 19, 2004 Asian Pacific American Heritage Month: May 2004 In 1978, a joint congressional resolution established Asian Pacific American Heritage Week. The first 10 days of May were chosen
Asian Pacific Islander Catholics in the United States: A Preliminary Report 1
 Asian Pacific Islander in the United States: A Preliminary Report 1 January 2015 Prepared by Jerry Z. Park W. Matthew Henderson Kenneth Vaughan Baylor University 2 Tricia Bruce Maryville College 3 Stephen
Migration Policy Institute
 By Aaron Terrazas and Cristina Batog Migration Policy Institute Vietnamese Immigrants in the United States September 2010 Unlike most of the foreign born from Asia, those from Vietnam came to the United
Annual Flow Report. of persons who became LPRs in the United States during 2007.
 Annual Flow Report MARCH 008 U.S. Legal Permanent Residents: 007 KELLy JEffERyS AND RANDALL MONGER A legal permanent resident (LPR) or green card recipient is defined by immigration law as a person who
Social and Demographic Trends in Burnaby and Neighbouring Communities 1981 to 2006
 Social and Demographic Trends in and Neighbouring Communities 1981 to 2006 October 2009 Table of Contents October 2009 1 Introduction... 2 2 Population... 3 Population Growth... 3 Age Structure... 4 3
Chinese Americans. Chinese Americans - Characteristics (2010 ACS)
") Asian Americans are a diverse group in the United States. According to the U.S. Census Bureau, Asian refers to a person having origins in any of the original peoples of the Far East, Southeast Asia or
Asian Americans are a diverse group in the United States. According to the U.S. Census Bureau, Asian refers to a person having origins in any of the original peoples of the Far East, Southeast Asia or
Geographic Mobility Central Pennsylvania
 Geographic Mobility Central Pennsylvania Centre, Clinton, Columbia, Lycoming, Mifflin, Montour, Northumberland, Snyder, and Union Counties Central Pennsylvania Workforce Development Corporation (CPWDC)
COMMUNITY PROFILE COQUITLAM. Coquitlam Immigrant Demographics I Page 1
 COMMUNITY PROFILE COQUITLAM Coquitlam Demographics I Page 1 COQUITLAM IMMIGRANT DEMOGRAPHICS Your quick and easy look at facts and figures around immigration. Newcomers are an important and growing part
Ecuadorians in the United States
 Center for Latin American, Caribbean & Latino Studies Graduate Center City University of New York 365 Fifth Avenue Room 5419 New York, New York 10016 Ecuadorians in the United States 1980 2008 212-817-8438
Chapter 3 - Community Demographics
 Comprehensive plans are prepared using a framework of population, household and economic trends. Demographic data available for the preparation of this plan is from the 2 census, data that is eight years
Facts & Figures in this issue: income employment growth trends baby boomers millennials immigration
 Facts & Figures in this issue: income employment growth trends baby boomers millennials immigration 2017 Baby Boomers The term baby boomer refers to individuals born in the United States between 1946 and
Tell us what you think. Provide feedback to help make American Community Survey data more useful for you.
 DP02 SELECTED SOCIAL CHARACTERISTICS IN THE UNITED STATES 2016 American Community Survey 1-Year Estimates Supporting documentation on code lists, subject definitions, data accuracy, and statistical testing
Characteristics of Poverty in Minnesota
 Characteristics of Poverty in Minnesota by Dennis A. Ahlburg P overty and rising inequality have often been seen as the necessary price of increased economic efficiency. In this view, a certain amount
California s Congressional District 37 Demographic Sketch
 4.02.12 California s Congressional District 37 Demographic Sketch MANUEL PASTOR JUSTIN SCOGGINS JARED SANCHEZ Purpose Demographic Sketch Understand the Congressional District s population and its unique
A Profile of Latina Women in New York City, 2007
 City University of New York (CUNY) CUNY Academic Works Publications and Research Center for Latin American, Caribbean & Latino Studies 11-2009 A Profile of Latina Women in New York City, 2007 Laura Limonic
Demographic, Economic, and Social Transformations in Brooklyn Community District 4: Bushwick,
 Demographic, Economic, and Social Transformations in Brooklyn Community District 4: Bushwick, 1990-2007 Astrid S. Rodríguez Ph.D. Candidate, Educational Psychology Center for Latin American, Caribbean
Latinos in Saratoga County. Trudi Renwick Senior Economist Fiscal Policy Institute April 26, 2008
 Latinos in Saratoga County Trudi Renwick Senior Economist Fiscal Policy Institute April 26, 2008 1 Fiscal Policy Institute set out to take a calm look at the real role of immigrants in New York Working
Emigrating Israeli Families Identification Using Official Israeli Databases
 Emigrating Israeli Families Identification Using Official Israeli Databases Mark Feldman Director of Labour Statistics Sector (ICBS) In the Presentation Overview of Israel Identifying emigrating families:
 Page 1 of 5 DP02 SELECTED SOCIAL CHARACTERISTICS IN THE UNITED STATES 2013 American Community Survey 1-Year Estimates Although the American Community Survey (ACS) produces population, demographic and housing
Look Ahead. Monday (10/10) elearning quiz 5. Wednesday (10/12) 5:45-7:15 PM at Library Annex 410 out-of-class showing of film, Claiming Open Spaces
 elearning quiz 5. Wednesday (10/12) 5:45-7:15 PM at Library Annex 410 out-of-class showing of film, Claiming Open Spaces") Look Ahead Monday (10/10) elearning quiz 5. Wednesday (10/12) 5:45-7:15 PM at Library Annex 410 out-of-class showing of film, Claiming Open Spaces Friday (10/14) Your second essay. Leisure Patterns among
Look Ahead Monday (10/10) elearning quiz 5. Wednesday (10/12) 5:45-7:15 PM at Library Annex 410 out-of-class showing of film, Claiming Open Spaces Friday (10/14) Your second essay. Leisure Patterns among
Immigrants and the Direct Care Workforce
 JUNE 2017 RESEARCH BRIEF Immigrants and the Direct Care Workforce BY ROBERT ESPINOZA Immigrants are a significant part of the U.S. economy and the direct care workforce, providing hands-on care to older
Extrapolated Versus Actual Rates of Violent Crime, California and the United States, from a 1992 Vantage Point
 Figure 2.1 Extrapolated Versus Actual Rates of Violent Crime, California and the United States, from a 1992 Vantage Point Incidence per 100,000 Population 1,800 1,600 1,400 1,200 1,000 800 600 400 200
CITY OF MISSISSAUGA. Overview 2-1. A. Demographic and Cultural Characteristics
 Portraits of Peel Overview 2-1 A. Demographic and Cultural Characteristics Population: Size, Age and Growth 2-2 Immigrants 2-3 Visible Minorities 2-4 Language 2-5 Religion 2-6 Mobility Status 2-7 B. Household
2011 CENSUS & NATIONAL HOUSEHOLD SURVEY CITY OF BRAMPTON - WARD 1 PROFILE
 CENSUS & NATIONAL HOUSEHOLD SURVEY CITY OF BRAMPTON WARD 1 PROFILE WARD HIGHLIGHTS Population 53,130 Population 51.0% Females Population by Age Group 9% 20% 014 10.14% of total population 36 Median Age
Q 23,992. New Americans in Champaign County 11.6% 11.8%
 New Americans in Champaign County A Snapshot of the Demographic and Economic Contributions of Immigrants in the County 1 POPULATION 23,992 Number of immigrants living in Champaign County in 2016, making
Foreign-born Share of Total Population and Labor Force, Civilian labor force age
 484009NLF Foreign-born Share of Total Population and Labor Force, 1970-2010. 18.00 16.4 13.50 9.00 4.50 4.9 4.8 Civilian labor force age 16-64 6.6 6.2 9.3 7.9 12.6 11.1 12.9 Total Popula on 0.00 1970 1980
BeNChMARks MASSACHUSETTS. The Quarterly Review of Economic News & Insight. Economic Currents. Massachusetts Current and Leading Indices
 MASSACHUSETTS BeNChMARks The Quarterly Review of Economic News & Insight spring 2001 Volume four Issue 2 Economic Currents Massachusetts Current and Leading Indices Immigration s Impact on the Commonwealth
info Poverty in the San Diego Region SANDAG December 2013
 info December 2013 SANDAG Poverty in the San Diego Region Table of Contents Overview... 3 Background... 3 Federal Poverty Measurements... 4 Poverty Status for Individuals in the San Diego Region... 6 Demographic
2011 CENSUS & NATIONAL HOUSEHOLD SURVEY CITY OF BRAMPTON - WARD 4 PROFILE
 2011 CENSUS & NATIONAL HOUSEHOLD SURVEY CITY OF BRAMPTON WARD 4 PROFILE WARD HIGHLIGHTS Population 9.51% of total population 49,850 2011 Population 34 Median Age 50.5% Females 49.5% Males 2011 Population
Immigrant Entrepreneurship: Trends and Contributions
 Immigrant Entrepreneurship: Trends and Contributions Magnus Lofstrom Edward Lazear, Stanford economics professor and former chairman of the President s Council of Economic Advisers, has said, The entrepreneur
CLACLS. Demographic, Economic, and Social Transformations in Bronx Community District 5:
 CLACLS Center for Latin American, Caribbean & Latino Stud- Demographic, Economic, and Social Transformations in Bronx Community District 5: Fordham, University Heights, Morris Heights and Mount Hope, 1990
2011 CENSUS & NATIONAL HOUSEHOLD SURVEY CITY OF BRAMPTON - WARD 3 PROFILE
 2011 CENSUS & NATIONAL HOUSEHOLD SURVEY CITY OF BRAMPTON WARD 3 PROFILE WARD HIGHLIGHTS Population 47,500 2011 Population 50.7% Females 2011 Population by Age Group 13% 18% 014 9.07% of total population
Gopal K. Singh 1 and Sue C. Lin Introduction
 BioMed Research International Volume 2013, Article ID 627412, 17 pages http://dx.doi.org/10.1155/2013/627412 Research Article Marked Ethnic, Nativity, and Socioeconomic Disparities in Disability and Health
CLACLS. A Profile of Latino Citizenship in the United States: Demographic, Educational and Economic Trends between 1990 and 2013
 CLACLS Center for Latin American, Caribbean & Latino Studies A Profile of Latino Citizenship in the United States: Demographic, Educational and Economic Trends between 1990 and 2013 Karen Okigbo Sociology
Macquarie University ResearchOnline
 Macquarie University ResearchOnline This is the author version of an article published as: Parr, N. & Guo, F. (2005). Occupational concentration and mobility of Asian immigrants in Australia. Asian and
Corporate. Report COUNCIL DATE: April 28, 2008 NO: R071 REGULAR COUNCIL. TO: Mayor & Council DATE: April 28, 2008
 Corporate NO: R071 Report COUNCIL DATE: April 28, 2008 REGULAR COUNCIL TO: Mayor & Council DATE: April 28, 2008 FROM: General Manager, Planning and Development FILE: 6600-01 SUBJECT: 2006 Census Information
IMMIGRANTS IN THE U.S. LABOR FORCE: CBO Report Underscores Diverse Contributions of Foreign-Born Workers
 IMMIGRANTS IN THE U.S. LABOR FORCE: CBO Report Underscores Diverse Contributions of Foreign-Born Workers August 4, 2010 A recent report from the Congressional Budget Office (CBO) underscores not only the
Summary of the Results
 Summary of the Results CHAPTER I: SIZE AND GEOGRAPHICAL DISTRIBUTION OF THE POPULATION 1. Trends in the Population of Japan The population of Japan is 127.77 million. It increased by 0.7% over the five-year
2011 CENSUS & NATIONAL HOUSEHOLD SURVEY CITY OF BRAMPTON - WARD 10 PROFILE
 2011 CENSUS & NATIONAL HOUSEHOLD SURVEY CITY OF BRAMPTON WARD 10 PROFILE WARD HIGHLIGHTS Population 10.72% of total population 56,185 2011 Population 33 Median Age 50.1% Females 49.9% Males 2011 Population
Remittances and the Dominican Republic Survey of Recipients in the Dominican Republic Survey of Senders in the United States
 Remittances and the Dominican Republic Survey of Recipients in the Dominican Republic Survey of Senders in the United States Columbia University New York City November 23, 2004 I. The U.S. Sample National
LATINO DATA PROJECT. Astrid S. Rodríguez Ph.D. Candidate, Educational Psychology. Center for Latin American, Caribbean, and Latino Studies
 LATINO DATA PROJECT Demographic, Economic, and Social Transformations in the South Bronx: Changes in the NYC Community Districts Comprising Mott Haven, Port Morris, Melrose, Longwood, and Hunts Point,
Immigrants and the Restructuring of the Boston Metropolitan Workforce,
 Institute for Immigration Research Immigrants and the Restructuring of the Boston Metropolitan Workforce, 1970-2010 Erin M. Stephens, Justin P. Lowry and James C. Witte JUNE 2015 1 Immigrants and the Restructuring
Backgrounder. Immigrants in the United States, 2007 A Profile of America s Foreign-Born Population. Center for Immigration Studies November 2007
 Backgrounder Center for Immigration Studies November 2007 s in the United States, 2007 A Profile of America s Foreign-Born Population By Steven A. Camarota This Backgrounder provides a detailed picture
COMMUNITY PROFILE BURNABY
 COMMUNITY PROFILE BURNABY Burnaby Demographics I Page 1 BURNABY IMMIGRANT DEMOGRAPHICS Your quick and easy look at facts and figures around immigration. Newcomers are an important and growing part of your
Transitions to Work for Racial, Ethnic, and Immigrant Groups
 Transitions to Work for Racial, Ethnic, and Immigrant Groups Deborah Reed Christopher Jepsen Laura E. Hill Public Policy Institute of California Preliminary draft, comments welcome Draft date: March 1,
Post-Secondary Education, Training and Labour January New Brunswick Analysis 2016 Census Topic: Immigration
 Post-Secondary Education, Training and Labour January 2018 New Brunswick Analysis 2016 Census Topic: Contents General Information... 2 Overview... 2 Population... 2 Demographics... 3 Sub-Provincial...
BIG PICTURE: CHANGING POVERTY AND EMPLOYMENT OUTCOMES IN SEATTLE
 BIG PICTURE: CHANGING POVERTY AND EMPLOYMENT OUTCOMES IN SEATTLE January 218 Author: Bryce Jones Seattle Jobs Initiative TABLE OF CONTENTS Introduction 1 Executive Summary 2 Changes in Poverty and Deep
Profiling the Eligible to Naturalize
 Profiling the Eligible to Naturalize By Manuel Pastor, Patrick Oakford, and Jared Sanchez Center for the Study of Immigrant Integration & Center for American Progress Research Commissioned by the National
South Americans Chinese
 9 9 9 96 96 95 7 6 5 Do Not Speak English Well Speak Other Langauge at Home 3 5 19 3 6 3 53 Puerto Ricans Native Blacks Dominicans West Indians South Americans Chinese 16 Russians Native Whites 6 Figure
NBER Volume on International Differences in Entrepreneurship
 The International Asian Business Success Story: A Comparison of Chinese, Indian and Other Asian Businesses in the United States, Canada and United Kingdom NBER Volume on International Differences in Entrepreneurship