The Many Faces of. Poverty. Volume 3
|
|
|
- Alaina Griffith
- 6 years ago
- Views:
Transcription


1
2 The Many Faces of Poverty Volume
3 The Many Faces of Poverty: Volume Copyright PEP-CBMS Network Office, ALL RIGHTS RESERVED. No part of this publication may be reproduced, stored in a retrieval system, or transmitted in any form or by any means whether virtual, electronic, mechanical, photocopying, recording, or otherwise without the written permission of the copyright owner. Published by De La Salle University 4 Taft Avenue, 4 Manila, Philippines First printing, ISBN Printed in the Philippines Acknowledgements The publication of this volume has been made possible through the PEP- CBMS Network Office based at the Angelo King Institute for Economic and Business Studies of De La Salle University-Manila with the aid of a grant from the International Development Research Centre (IDRC), Ottawa, Canada and the Canadian International Development Agency (CIDA).
4 CONTENTS i Foreword Introduction Explanatory Text The Many Faces of Poverty Batanes Batangas Northern Samar Occidental Mindoro 57 Surigao del Sur 9 Tarlac 7 Zamboanga del Sur
5 FOREWORD The official poverty monitoring system (PMS) in the Philippines relies mainly on family income and expenditure surveys. Information on other aspects of well-being is generally obtained from representative health surveys, national population and housing censuses, and others. However, these surveys and censuses are (i) too costly to be replicated frequently; (ii) conducted at different time periods, making it impossible to get a comprehensive profile of the different socio-demographic groups of interest at a specific point in time; and (iii) have sampling designs that do not usually correspond to the geographical disaggregation needed by local government units (LGUs). In addition, the implementation of the decentralization policy, which devolves to LGUs the function of delivering basic services, creates greater demand for data at the local level. The Community-Based Monitoring System (CBMS) seeks to address these gaps by providing data at the local level appropriate for diagnosing the cause and extent of local poverty, formulating appropriate policies and programs, identifying eligible beneficiaries, and assessing the impact of policies and programs. It also supports the decentralization process by capacitating the LGUs to collect, analyze, and use data in local planning, budgeting, and program implementation. This third volume of statistical tables and poverty maps of seven provinces generated through the CBMS methodology represents part of what we hope will be a series of publications that will emerge from the collaborations between the CBMS Network Coordinating Team and its partner-lgus. These partnerships have been in place for several years now, and these partner-lgus are finally enjoying the fruits of their hard labor. The CBMS poverty maps will identify who and where the poor are as they provide a comprehensive picture of the different faces of poverty in different parts of the country. They will also aid in identifying the most pressing needs of the community, assist in prioritizing interventions to address these needs, and facilitate the targeting of programs for those who need the assistance most. The provinces featured in this volume are Batanes, Batangas, Northern Samar, Occidental Mindoro, Surigao del Sur, Tarlac, and Zamboanga del Sur. The statistics presented in this report are based on the CBMS surveys conducted in these provinces during a 5-year period from 7-. The work leading to the publication of this book owes much to the unwavering support and commitment of our partners both at the local and national levels. For so many months now, we have worked hand-in-hand with them in consolidating databases and validating our survey findings. And now, with their consent, we are sharing their data to a wide range of CBMS stakeholders all over the country indeed a glowing testament of their dedication to make their development planning processes more efficient and effective! Tremendous thanks are therefore in order to all our partner LGUs, national government agencies, non-government organizations, donors and other development partners for making this possible. It is hoped that this publication will provide the necessary data to facilitate evidence-based decisionmaking toward improving local governance and reducing poverty in the country. CELIA M. REYES Co-Director, Poverty and Economic Policy (PEP) Research Network and CBMS Network Leader i
6 INTRODUCTION Considered a foremost legislation that ushered in a new era of local governance, the Local Government Code (LGC) of 99 has paved the way not only for greater autonomy but also for increased expenditure responsibility and revenue authority of local government units. Since then, the local government units (LGUs) have assumed a greater role in local government management and service delivery. The devolution is substantial not only in the magnitude of responsibilities that were shifted to LGUs but also in the amount of resources now at their disposal to effectively discharge the devolved functions. Today, LGUs have access to multiple revenue sources, chief of which is their share in the national internal revenues the Internal Revenue Allotment (IRA). For the period 6 8, the average IRA per year is P76.4 billion (see Table ). Table. Internal Revenue Allotment of Local Government Units, 6 9 Year Amount (in P billion) TOTAL Ave. per year Source: DBM While experts agree that local governments are not awash with cash, the P59. billion worth of IRA that the LGUs have received over the -year period is certainly a big amount. This underscores the importance of making sure that LGUs are equipped with the right tools, systems, and procedures to ensure the effective use of these public financial resources. One way to do this is by providing them access to comprehensive socioeconomic data, on the basis of which they can craft their development plans and budgets. Statistical Issues and Concerns at the Subnational Level With decentralization, the types of data demanded by a wide range of users policymakers, program implementers, civil society, and others are changing. Data disaggregated to correspond to the different levels of government are needed by LGUs to adequately assess their local situation. Moreover, longitudinal data are needed to track welfare changes over time. Household-level data are also needed to identify eligible beneficiaries of different programs. In 5, 4 years after the LGC enactment, the ADB-WB released a report highlighting statistical issues and concerns at the subnational level. It said: The most comprehensive and consistent comparative subnational data is at the regional level although this is simply an administrative level of government that has no responsibilities for delivery of social services. More data is gradually becoming available at the provincial level, but not at lower levels, which are at the frontline of efforts to reduce poverty. Decentralization in the Philippines: Strengthening Local Government Financing and Resource Management in the Short-Term, 5 (A joint document of the World Bank and the Asian Development Bank).
7 Local Poverty Monitoring Systems Rise up to the Challenge Owing to still unresolved statistical issues and concerns at the subnational level, an increasing number of LGUs all over the country have taken the initiative to establish their own Community-Based Monitoring System (CBMS). As of September,, CBMS is being implemented in 65 provinces ( of which are implementing the system province-wide), 764 municipalities, and 49 cities, covering a total of,8 barangays. Data generated by CBMS have so far been used in diagnosing the nature and extent of poverty in their localities, identifying appropriate interventions, identifying eligible beneficiaries of poverty reduction programs, and assessing the impact of some of these programs. National government agencies have likewise taken notice of the CBMS initiative. Today, CBMS is recognized as a tool for (i) building the capacity of LGUs on poverty diagnosis and planning, (ii) localizing the Millennium Development Goals (MDGs), and (iii) generating local poverty statistics for evidencebased development planning and budgeting. Parallel with efforts to establish databanks at each geopolitical level, an initiative on building the national repository of CBMS data has also been jumpstarted with the installation of the repository at the National Anti-Poverty Commission (NAPC) and at the Department of the Interior and Local Government (DILG). The national repository is envisioned to facilitate data sharing across government agencies, the private sector, donor agencies, and other relevant stakeholders. Specifically, the national repository will (i) facilitate the access and use of the integrated CBMS database by national entities in their advocacy work with key decisionmakers, (ii) support government and non-government funding sources in strengthening evidence-based planning and monitoring and in aligning their interventions to national priorities, and (ii) facilitate the implementation of targeted programs. Concluding Remarks Public statistics will increasingly shape public agenda at the local level as more and more LGUs establish their own monitoring systems to make their development planning processes more efficient and effective. In this scenario, local poverty monitoring systems such as the CBMS will have an extremely important role to play. The country s experience with local-level poverty monitoring systems clearly demonstrates that there can be a comprehensive picture of the poverty situation. Very few, if any, national surveys collect information on the different dimensions of poverty. There is a survey on income and expenditure, another on health, another on education, another on employment, another on nutrition, and others. As the samples and the reference periods are different, there is no comprehensive picture of the poverty status of the population at any point in time. This is where CBMS can make a difference as it addressess these gaps through its set of core indicators relating to the different dimensions of poverty.
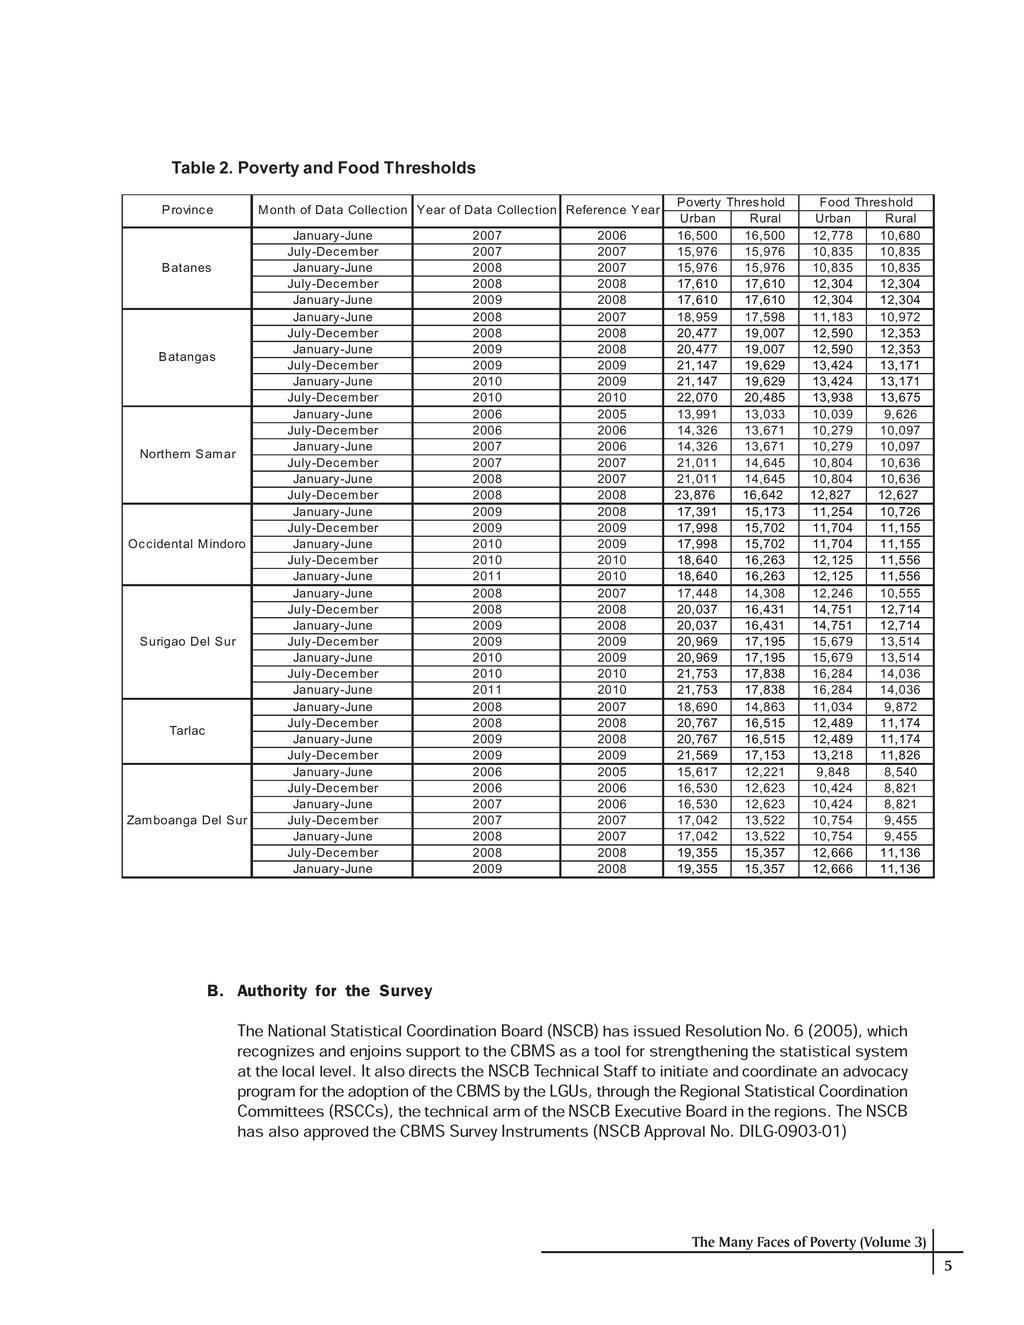
8 EXPLANATORY TEXT A. CBMS Core Indicators The statistical tables and poverty maps presented in this volume pertain to the CBMS Core Indicators (also known as Core Local Poverty Indicators ), which were generated using the CBMS methodology. Box. Community-Based Monitoring System (CBMS) The CBMS is an organized way of collecting ongoing or recurring information at the local level to be used by local governments, national government agencies, non-government organization (NGOs), and civil society for planning, budgeting, and implementing local development programs, as well as for monitoring and evaluating their performance. It is a tool for improved local governance and democratic decisionmaking that promotes greater transparency and accountability in resource allocation. It involves the following steps: Step Advocacy/organization Step Data collection and field editing Step Data encoding and map digitization Step 4 Data consolidation, database-building and poverty mapping Step 5 Data validation and community consultation Step 6 Knowledge (database) management Step 7 Plan formulation Step 8 Dissemination, implementation, and monitoring The CBMS Core Indicators are a set of carefully selected indicators that capture the multiple dimensions of poverty. They define the basic criteria for attaining a decent quality of life and correspond to the minimum basic needs covering (a) health, (b) nutrition, (c) housing, (d) water and sanitation, (e) basic education, (f) income, (g) employment, and (h) peace and order. Together, these indicators provide information not only on how poor a community is, but also on who in the community is poor, and where. The CBMS Core Indicators are presented in Table. Meanwhile, the poverty and food thresholds used are presented in Table. The Department of the Interior and Local Government (DILG) has issued Memorandum Circular -9 (April ) to set policy guidelines for the adoption of the core local poverty indicators, for planning and Memoradum Circular 4-5 (November 4) to encourage LGUs to intensify efforts toward the achievement of the millennium development goals (MDGs). The latter circular also enjoins LGUs to use monitoring systems such as MBN-CBIS, CBMS, IRAP, etc., to monitor and diagnose the nature and extent of poverty in their respective localities. CBMS was adopted by the DILG as the data collection and processing system for the CLPIMS which was the tool adopted to monitor the MDGs for LGUs.
9 Table. The CBMS Core Indicators BASIC NEEDS CORE INDICATORS Computation/Formula Simple Scoring A. Hea lth Pr of children under 5 years old who died Pr of women who died due to pregnancy related causes B. Nutrition Pr of children -5 years old who are malnourished C. Housing 4 Pr of households living in makeshift housing D. Water a nd Sa nitation 5 Pr of households who are informal settlers 6 Pr of households without access to safe water supply 7 Pr of households without access to sanitary toilet facilities E. Education 8 Pr of children 6- years old who are not attending elementary school 9 Pr of children - 6 years old who are not attending secondary school 8-9 Pr of children 6-6 years old who are not attending school Total number of children aged to less than 5 years old who died divided by (the sum of total number of children aged to less than 5 years old plus the total number of child deaths to less than 5 years old) Total number of women who died due to pregnancy related causes divided by (the total number of children less than one year old plus total number of women who died due to pregnancy related causes) One () if the household has a member under 5 years old who died; zero () otherwise. One () if the household has a female member who died due to pregnancy-related causes; zero () otherwise. Total number of children -5 years old who One () if the household has a are moderately or severely underweight over member -5 years old who is total number of children -5 years old malnourished; zero () otherwise. Total number of households living in housing with makeshift roof and/or walls over total number of households Total number of households occupying house and/or lots without permission of owner over total number of households Total number of households without access to community water system, artesian deep and shallow wells or bottled water over total number of households Total number of households without access to water-sealed toilet or closed pit over total number of households Total number of children 6- years old who are not attending elementary school over total number of children 6- years old Total number of children -6 years old who are not attending secondary school over total number of children -6 years old One () if the household lives in makeshift housing; zero () otherwise. One () if the household is an informal settler; zero () otherwise. One () if the household does not have access to safe water supply; zero () otherwise. One () if the household does not have access to sanitary toilet facilities; zero () otherwise. Total number of children 6-6 years old who One () if the household has a are not attending school over total number of member 6-6 years old not children 6-6 years old attending school; zero () otherwise. F. Income Pr of households with income below the poverty threshold Pr of households with income below the food threshold Pr of households who experienced food shortage G. Employme nt Pr of persons in the labor force who are unemployed Total number of households with income below the poverty threshold over total number of households One () if the household has a per capita income below poverty threshold; zero () otherwise. Total number of households with income One () if the household has a per below the food (subsistence) threshold over capita income below food threshold; total number of households zero () otherwise. Total number of households who One () if the household has experienced food shortage over total number experienced food shortage; zero () of households otherwise. Total number of persons aged 5 and above who are not working but actively seeking work over total number of labor force* One () if the household has unemployed member/s; zero () otherwise. H. Pea ce and Orde r 4 Pr of persons who are victims of crimes Total number of persons who are victims of crimes over total population One () if the household has victim/s of crime; zero () otherwise. CBMS Composite Indicator Average number of unmet needs Sum of unmet needs of households over total number of households Sum of the scores (number of unmet needs) of the indicators. * Northern Samar used this definition of unemployment. Meanwhile, Batanes, Batangas, Occidental Mindoro, Surigao del Sur, Tarlac and Zamboanga del Sur used the new official definition of unemployment as per NSCB Resolution No. 5, Series of 4. More information about this new definition is available on the website of the National Statistical Coordination Board (NSCB): 4/5.asp 4
10
11 C. Survey Operations All survey operations were undertaken under the supervision of the CBMS Technical Working Groups (TWGs) at the provincial and municipal Levels. They identified the local personnel who were trained as enumerators and field supervisors. Technical assistance was provided by the PEP-CBMS Network Office, the Bureau of Local Government Development (BLGD) and Regional Office 8 of the Department of the Interior and Local Government (DILG), and the National Anti- Poverty Commission (NAPC). Training is mainly conducted at two levels. The first level training (Training of Trainors) is conducted for members of the TWGs. This is usually conducted by members of the research staff of the PEP-CBMS Network Office and CBMS-accredited trainors from the DILG, NAPC and NEDA. Meanwhile, a second level training (Training of Enumerators) is conducted for enumerators-- usually composed of barangay health workers and students. Members of the TWG act as trainors in this training. D. Data Processing System The CBMS Data Processing System includes the CBMS Data Encoding System, Statistics Simulator (StatSim) and the CBMS-Natural Resources Database (NRDB). The CBMS Encoding System uses CSPro (Census and Survey Processing), a software developed by the United States Bureau of Census for entering, editing, tabulating, and disseminating data from censuses and surveys. The CSPro-based Encoding System converts survey data into electronic data. It produces text files (ASCII) described by data dictionaries, which adds flexibility to the output data. This feature facilitates the interface between the CBMS data and other database systems and statistical softwares. The CBMS-NRDB is capable of creating and storing spatial (shapefiles) and non-spatial (texts and numbers) data as well as generating maps, reports and graphs ideal for presentation and analysis of poverty attributes in the community. This has significantly addressed the need for a simple yet powerful and free geographically-oriented database. The CBMS Mapping system employs the Natural Resources Database (NRDB) for CBMS-based poverty mapping and for storing and displaying household- and individual-level information. The data presented through poverty maps using the CBMS-NRDB are processed using the CBMS StatSim which has been developed by the PEP-CBMS Network Office to address the particular need of LGUs to harness outputs from the CBMS Database such as custom tables, reports, case lists and queries. The StatSim simulates simple computations and tabulations usually done through statistical software or other tabulation applications, and also exports indicators and statistics for use in dissemination, such as tables and maps. These software are provided for free to CBMS-implementing LGUs. The NRDB was developed by Mr. Richard Alexander, a British volunteer who spent three years working for the Bohol Environment Management Office through the assistance of the Voluntary Service Overseas (vso.org.uk). 6
12 E. CBMS Poverty Maps The poverty map for each indicator is prepared at two levels. The first level is the provincial map disaggregated by municipality while the second level is the provincial map by barangay. A simple color scheme is used for the poverty maps. Green, light green, pink and red represents the four ranges of data for each indicator. Each indicator, however, used a different range relative to the provincial data. F. Limitations of the Data While observations are taken from the entire population, the user of the data presented in this report should bear in mind that due to some difficulties, the CBMS was not carried out in Batangas City and Lipa City in the province of Batangas; in the municipalities of Dimatiling and Dinas in the province of Zamboanga del Sur; and in the municipality of Bamban in the province of Tarlac. The CBMS census was also not carried out in barangay in the municipality of San Nicolas, Batangas; in barangays in the Municipality of Camiling, Tarlac; and in 9 barangays in the Municipality of Catubig, 5 barangays in the Municipality of Mondragon and barangay in the Municipality of Pambujan, all in the province of Northern Samar. Estimates on poverty and subsistence incidence may also be affected by under- and/or over-reporting of income or reluctance on the part of the respondents to reveal their true levels of income. As in other surveys, the CBMS enumerators may also have encountered interview non-response and item non-response. 7
13 Blank Page


14 Republic of the Philippines Province of Batanes Office of the Governor Message My special greetings and congratulations to all members of the PEP- CBMS Network Coordinating Team and to the editorial staff and publications board of The Many Faces of Poverty for coming out with this third volume of this very factual and informative book. Indeed, I find the contents of this publication very essential especially to a rising and developing province like Batanes. The various data on population, health and nutrition, housing, water and sanitation, basic education, income and livelihood, and peace and order, which were presented by municipality and barangay, are very instructive in our shared efforts to effectively reduce the poverty rate not only in this province but for the country as a whole. I truly understand the difficulty of tediously collecting every datum, interviewing community members and local officials, and patiently consolidating and interpreting the same to come up with a useful product. It is a source of pride among our people that the province of Batanes was one of the five provinces in the country that won two human development awards in 5: the Highest Achievement in Human Development and Greatest Improvement in Human Development. Both distinguished citations from the United Nations Development Programme (UNDP) were measured in terms of the Human Development Index (HDI). Batanes was also recognized by the National Statistical Coordination Board (NSCB) as Best in Good Governance, Best in Economic Governance, and Second Best in Administrative Governance, all in. The award on good governance was based on economic and administrative governance indicators; the award on good economic governance was measured in terms of per capita expenditures on social services, unemployment and underemployment rates, poverty incidence, and poverty gap; and the award on administrative governance was determined based on total health personnel per thousand population, percentage of live birth, pr of households with access to safe water, teacher-to-pupil ratio for elementary schools, number of elementary schools per thousand population, cohort survival rate in elementary education, percentage of housing made of strong roofs and strong walls, and length of national and local roads per thousand population. It is a fact that there are no beggars, street children, nor homeless families in this province. Today, as in the past years, Batanes continues to pursue and improve on its development goals. With the publication of this book, we hope that the Provincial Government of Batanes and our local government units (LGUs) will learn more from the collective experiences of other provinces as we continue to work toward improving the lives of our constituents and further uplift their standards of living. VICENTE S. GATO Governor 9
15 The Many Faces of Poverty in Batanes POPULA OPULATION Batanes registered a total population of 6,6 in 4,79 households, based on the CBMS survey of 7 9 The CBMS survey covered the six municipalities of Batanes, consisting of 9 barangays. The municipality of Basco, the provincial capital, had the largest population with 7,49 or 45.8 percent of the total population. The municipality of Uyugan had the smallest population with only,7. Of the total population in the province, the 6 years old and below comprised 7. percent. HEALTH AND NUTRITION The mortality rate of children 4 years old was one in every Based on the CBMS survey results,. percent of children 4 years old died during the reference period. This corresponds to a total of 6 child deaths in the province within that age range. The highest pr of deaths among children was recorded in the municipality of Uyugan where.7 percent of children 4 years old died. Meanwhile, it was noted that two of the municipalities had no recorded deaths among children in this age range. At the barangay level, data from the CBMS survey showed that a few barangays had a relatively higher pr of child deaths. Barangay Chavayan in Sabtang town had the highest pr (7.%) of deaths among children under 5 years old. However, the biggest number of child deaths was recorded in Barangay Kayhuvokan in Basco where three death cases were reported. No cases of child deaths were reported in 9 (out of 9) barangays in the province. Only one case of maternal death was reported in the province Data from the CBMS survey also showed that only one pregnant woman died due to a pregnancy-related cause, corresponding to.8 percent of all pregnant women in the province during the reference period. This was recorded in Barangay Kaumbakan in the municipality of Mahatao. This means that no woman died due to pregnancy-related causes in all other barangays in the province during the period. Among children 5 years old,. percent were malnourished In terms of nutrition,. percent of children 5 years old or at least in every children -5 years old in the province were considered malnourished. The municipality of Ivana recorded the highest pr of malnourished children at 4.5 percent while Basco had the highest number of cases, at children, within the age range of 5 years. No malnourished child was recorded in the municipality of Mahatao. The problem of malnutrition seems to be worse at the barangay level. High malnourishment rates were reported in some barangays, including Barangay San Joaquin in Basco, which had the highest pr of malnourished children at 4. percent followed by Barangay Radiwan in Ivana with. percent, and Barangay Santa Lucia in Itbayat with 9. percent. Meanwhile, 6 barangays had no problem with malnourishment as no child was recorded to be malnourished during the reference period. HOUSING About.9 percent of the households were living in makeshift housing while.5 percent percent were informal settlers Data on housing revealed that some households ( in every ) in the province were living in makeshift housing. Makeshift housing was, however, more prevalent in Basco where. percent of households were considered housing poor. This corresponds to 57 households, which is also the highest among all the municipalities in the province. This is followed by Sabtang with. percent, and Itbayat with.9 percent while the rest of the municipalities had no households in makeshift housing. Meanwhile, at the barangay level, the highest pr was recorded in Barangay Chavayan in Sabtang at.4 percent. Barangay Ihubok I in Basco came next with 5. percent, corresponding to households. This barangay also recorded the highest number of households living in makeshift housing.
16 Of the households, only.5 percent were considered informal settlers. This means that for every, households in the province, only five were considered as informal settlers. Basco recorded the highest magnitude and pr of informal settlers. In particular, households (.6%) were informal settlers in this municipality. Although Barangay Savidug in Sabtang had the highest pr of informal settlers, only one household was reported. Barangay San Antonio in Basco had the highest number of informal settlers at 4 households. These results indicate that informal settling is not a huge concern for the province. WATER AND SANITATION TION Among all households,.7 percent had no access to safe water supply, while only. percent had no sanitary toilet facilities Results of the CBMS survey further revealed that.7 percent of the households had no access to safe drinking water, corresponding to 7 households. Basco recorded the highest magnitude and pr of households without access to safe water with 4.4 percent, representing 8 households. Itbayat also recorded a relatively high pr at. percent (or households). Meanwhile, all households in Ivana and Uyugan had access to safe drinking water. Looking at the more disaggregated data, results of the CBMS survey showed that there are no waterless barangays in the province. The highest pr of households without access to safe water is reported in Barangay Chanarian in Basco at 4. percent, followed by Barangays Santa Lucia (.8%) and Raele (8.%) in Itbayat. Meanwhile, the CBMS survey results showed that only 4 households (or.%) had no access to sanitary toilet facilities. The highest pr of households without access to sanitary toilet is in Sabtang (.4%), although this corresponds to only five households. Among all the barangays in the province, Barangay Chavayan in Sabtang recorded the highest pr of households without sanitary toilet facilities although only two households were reported. The magnitude of households without sanitary toilet facilities ranges from households in each barangay. Only three barangays reported two households that are toilet poor. BASIC EDUCATION Among children 6 6 years old,.4 percent were not attending school Based on the CBMS survey results, 9.8 percent of children 6 years old were not enrolled in elementary school while.6 percent of children 6 years old were not attending high school. However, taking all children 6 6 years old, only.4 percent, or in every were not attending school during the reference period. Municipal level data showed that the highest magnitude and pr of children 6 6 years old who were not attending school was reported in Itbayat with 7. percent, which corresponds to 68 children. The lowest pr was in Basco (.7%) although the magnitude was high ( children) relative to the rest of the municipalities. At the barangay level, some recorded even higher prs, compared to the provincial estimates. Barangay Sumnanga in Sabtang had the highest pr with.6 percent, representing children. It is followed by Barangays San Rafael with 6 children (.6%), and Raele in Itbayat with 5 children (9.6%). San Rafael also recorded the highest magnitude of children aged 6 6 years old who are not studying, among all the barangays in the province. INCOME AND LIVELIHOOD About 4.9 percent of households were living below the poverty threshold Despite its better conditions in terms of other dimensions, the province of Batanes still recorded a relatively high poverty rate of 4.9 percent corresponding to,4 income poor households. This means that four in every households were living below the poverty threshold. Sabtang, with a poverty rate of 5.5 percent, had the highest pr of income poor households, followed by Ivana (4.%), and Basco (4.%). Some barangays had poverty rates that are higher than the provincial estimate. Three barangays in Sabtang topped the list of poorest barangays in the province. The poorest barangays in terms of household income is Barangay Nakanmuan where 9. percent (8 households) were considered income poor, followed by Barangay Chavayan with 77. percent, and Barangay Malakdang (Poblacion) with 6.6 percent. Waterless barangays refer to villages with less than 5 percent safe water supply coverage.
17 About 6.5 percent of the households had no sufficient income to satisfy their basic food requirements CBMS survey results further revealed that 6.5 percent of the households in the province had per capita income below the food threshold. This corresponds to a total of 97 households. Among all the municipalities in the province, Sabtang recorded the highest pr of food poor households. In fact, 4.9 percent of its households were living below the food poverty line. Ivana came next with 9.7 percent, followed by Basco with.6 percent. Meanwhile, CBMS data for all barangays in the province, showed that Barangay Nakanmuan had the highest food poverty rate at 86.7 percent, followed by Barangay Chavayan with 57. percent, and Barangay Malakdang (Poblacion) with 5 percent. These three poorest barangays are located in the municipality of Sabtang. Food shortage was experienced by. percent of the households Based on survey responses of the households, only very few of them experienced food shortage during the last three months prior to the interview. In particular, only three households (.%) suffered from food shortage during the reference period. These three households were all in Barangay Salagao in Ivana. There was no reported case of food shortage among households in all the other barangays throughout the province. Unemployment rate was relatively low at.5 percent During the reference period, the province recorded a relatively low unemployment rate at.5 percent, or a total of 6 members of the labor force. This means that only five in every, members of the labor force in the province were not employed. Municipal-level data showed that Basco had the highest magnitude and pr of unemployed. In particular, members of Basco s labor force were not employed, translating to an unemployment rate of.7 percent. The rates of unemployment were relatively high in a few barangays. Barangay Savidug in Sabtang recorded the highest unemployment rate at. percent, although this represents only two members of the labor force. Barangay San Antonio in Basco ranked second with an unemployment rate of.5 percent, corresponding to unemployed members of the labor force. This barangay also had the highest number of unemployed members of the labor force among all the barangays in the province. PEACE AND ORDER About. percent of the population were victims of crime Survey data showed that 5 individuals or. percent of the total population in the province had been reported as victims of crime. This means that three in every, individuals in the province are victims of crime. Mahatao had the highest pr (.%) of crime victims, followed by Uyugan (.4%) and Basco (.%). The latter, however, had the most number of reported crime victims, based on the CBMS survey, with a total of cases. It is worth noting that no cases of crime were reported in Sabtang during the reference period. Barangay Panatayan in Mahatao had the highest incidence of crime among all the barangays in the province with 7 individuals who were crime victims, corresponding to.8 percent of the total population in the barangay. Ten barangays in the province had at least one reported crime victim during the reference period while the rest of the barangays had none. CBMS COMPOSITE INDICATOR AND MULTIDIMENSIONAL POVERTY Households were able to meet almost all of the basic needs, on the average The province recorded a CBMS composite index (CCI) equivalent to.7. This means that most of the households in the province were able to meet the basic needs. Among all the municipalities, Sabtang recorded the highest composite index of., indicating the worst condition among all the municipalities in terms of meeting the basic needs. Households in Sabtang were not able to satisfy at least one of the basic needs, on average. Ivana came second with a CCI of.8, followed by Basco and Itbayat, both with a CCI of.7. At the barangay level, the highest CCI was recorded by Barangay Nakanmuan with.8, followed by Barangay Chavayan with.6, and Sumnanga with.. These three barangays are all located in the municipality of Sabtang. This refers to household basic needs as reflected in the CBMS core indicators covering the following: () children 4 years old who died, () women who died due to pregnancy-related causes, () malnourished children 5 years old, (4) households living in makeshift housing, (5) households who are informal settlers, (6) households without access to safe water supply, (7) households without access to sanitary toilet facilities, (8) children 6 6 years old not in school, (9) households with income below poverty threshold, () households with income below food threshold, () households that experienced food shortage, () unemployment, and () victims of crime. A higher index would mean more unmet needs and, hence, worse condition for the households.
18 About 4. percent of households in the province experienced multiple deprivations Result of the CBMS survey showed that only 4. percent of households in the province experienced multiple deprivations. In particular,.7 percent of households were deprived in two dimensions,. percent were poor in three dimensions, and. percent were deprived in four dimensions. Data further revealed that 57 households in the province were income poor and education poor at the same time. Meanwhile,.7 percent of households in the province suffered from simultaneous deprivations in terms of income and housing. The same pr also experienced deprivation in both income and safe water supply. A household is considered to experience multiple deprivations if it is poor in at least two in the following dimensions: health, nutrition, tenure, housing, water, toilet, education, income, job, and security.
19 The Many Faces of Poverty in Batanes CBMS Core Indicators, Province of Batanes, 7-9 INDICATOR Households Population DEMOGRAPHY Population Average household size Children under year old Children under 5 years old Children -5 years old Children 6- years old Members -6 years old Members 6-6 years old Members years old and above Members of the labor force HEALTH AND NUTRITION Children under 5 years old who died Women who died due to pregnancy related-causes Malnourished children -5 year old HOUSING Households living in makeshift housing Households who are informal settlers WATER AND SANITATION Households without access to safe water supply Households without access to sanitary toilet facilities BASIC EDUCATION Children 6- years old not attending elementary school Children -6 years old not attending high school Children 6-6 years old not attending school INCOME AND LIVELIHOOD Households with income below poverty threshold Households with income below food threshold Households who experienced food shortage Unemployment rate (5 years old and above) PEACE AND ORDER Victims of crime 5. CBMS Composite Indicator,, Province of Batanes, 7-9 CBMS Composite Indicator Average.7 4
20 CBMS Core e Indicators, by Municipality,, Province of Batanes, 7-9 Municipality Total Total Number of Children under Number of Women deaths Number of Malnourished households population children under 5 5 years old who died children under due to pregnancy-related children (-5 children (-5 years old) years old year old causes years old) IVANA MAHATAO UYUGAN Municipality Households living in makeshift housing Households who are informal settlers Households without access to safe water supply Households without access to sanitary y toilet facilities IVANA MAHATAO UYUGAN Municipality Number of children (6- years old) Children not attending Number of elementary y school (6- years old) children (-6 years old) Children not attending high school (-6 years old) Number of children (6-6 years old) Children not attending school (6-6 years old) IVANA MAHATAO UYUGAN Municipality Households with income below the poverty threshold Households with income below the food threshold Households who experienced food shortage IVANA MAHATAO UYUGAN Municipality Number of persons in the labor force (5 years old and above) Unemployment rate (5 years old and above) Persons who are victims of crimes CBMS Composite Indicator IVANA MAHATAO UYUGAN
21 CBMS Poverty Maps: Batanes Map. Pr of Children under 5 Years Old who Died, by Municipality, 7-9 C hild ren und er 5 years old who d ied.8 M uni ci p a li t y M a g ni t ud e Pr o p o r t i o n Uyug an.7 Sabt ang.7 B asco 8. Itb ayat.8 Ivana. M ahatao. MAHATAO. IVANA UYUGAN.7.7 Map. Pr of Children under 5 Years Old who Died, by Barangay, 7-9 B o t t o m B ar a ng ay s M uni ci p al i t y B ar a ng a y M ag ni t ud e Pr o p o r t i o n.8 Sabt ang Chavayan 7. Uyugan It bud 4. Uyugan Kayvaluganan (Pob.).4 Sabtang Sinakan (Pob.).6 B asco Kayhuvo kan.9 Itb ayat Santa Ro sa.7 Basco Ihubok I. Basco Ihubok II. Itb ayat San Rafael. B asco San Anto nio.6 MAHATAO. IVANA UYUGAN.7.7 6
22 CBMS Poverty Maps: Batanes Map. Pr of Women who Died Due to Pregnancy-Related Causes, by Municipality, 7-9 W o men d ea t hs d ue t o p r e g nancy - relat ed causes M uni c ip a l it y M a g ni t ud e Pr o p o r t i o n M ahatao 4. B asco. It b ayat. Ivana. Sabt ang. Uyug an. MAHATAO 4. IVANA UYUGAN Map 4. Pr of Women who Died Due to Pregnancy-Related Causes, by Barangay, 7-9 B o t t o m B ar a ng a y M uni c i p a l i t y B ar a ng ay M a g ni t ud e P r o p o r t i o n M ahatao Kaumbakan. MAHATAO 4. IVANA UYUGAN 7
23 CBMS Poverty Maps: Batanes Map 5. Pr of Children -5 Years Old who are Malnourished, by Municipality, M a l no ur i s he d c hi l d r e n ( - 5 ye ar s o l d ) M uni ci p al i t y M ag ni t ud e P r o p o r t i o n Ivana Uyug an 4.9 It b ayat.8 B asco. Sabt ang. M ahatao. MAHATAO IVANA UYUGAN.9 Map 6. Pr of Children -5 Years Old who are Malnourished, by Barangay, B o t t o m B a r ang a ys M uni c i p a l i t y B ar a ng ay M a g ni t ud e Pr o p o r t i o n Basco San Joaquin 6 4. Ivana Radiwan 4. Itbayat Santa Lucia 7 9. Uyugan It b ud 5.9 Sabtang Sinakan (Pob.) 5.8 Uyugan Imnajb u 5.6 B asco Ihubo k II 8.5 Ivana Tuhel (Pob.). Itbayat Santa M aria.9 Itbayat San Rafael.4 Basco San Antonio 5.4 MAHATAO. IVANA UYUGAN
24 Table. Health and Nutrition Indicators, by Barangay, Province of Batanes, 7-9 Municipality Barangay Number of Children under 5 Number of Women deaths Number of Malnourished children years old children due to children children under 5 who died under pregnancy-related (-5 (-5 years old) years old year old causes years old) Chanarian Ihubok I Ihubok II Kayhuvokan San Antonio San Joaquin Raele San Rafael Santa Lucia Santa Maria Santa Rosa IVANA Radiwan Salagao San Vicente Tuhel (Pob.) MAHATAO Hanib Kaumbakan Panatayan Uvoy (Pob.) Chavayan Malakdang (Pob.) Nakanmuan Savidug Sinakan (Pob.) Sumnanga UYUGAN Imnajbu Itbud Kayuganan (Pob.) Kayvaluganan (Pob.)
25 CBMS Poverty Maps: Batanes Map 7. Pr of Households Living in Makeshift Housing, by Municipality, Ho us eho l d s l i vi ng i n mak es hi f t ho using M uni ci p a li t y M a g ni t ud e Pr o p o r t i o n B asco 57. Sabt ang 8. Itb ayat 4.9 Ivana. M ahatao. Uyug an. MAHATAO. IVANA UYUGAN. Map 8. Pr of Households Living in Makeshift Housing, by Barangay, B o t t o m B ar ang ay s M uni ci p al i t y B a r ang a y M a g nit ud e P r o p o r t i o n Sab t ang Chavayan 4.4 Basco Ihubok I 5. Itb ayat Santa Rosa 4.7 Sab t ang Sumnang a 4. B asco Kayhuvokan.8 Basco Ihubok II.8 B asco San A ntonio.6 It b ayat Sant a M aria.4 Itb ayat San Rafael. B asco San Joaquin. MAHATAO. IVANA UYUGAN.
26 CBMS Poverty Maps: Batanes Map 9. Pr of Households who are Informal Settlers, by Municipality, 7-9 Ho us eho l d s w ho ar e i nf o r mal se t t l e r s.4 M unic i p al i t y M a g ni t ud e Pr o p o r t i o n B asco.6 Sabt ang.5 Itb ayat.4 Ivana. Uyug an. M ahatao. MAHATAO.6 IVANA UYUGAN...5 Map. Pr of Households who are Informal Settlers, by Barangay, B o t t o m B a r ang ay s M unic i p al i t y B ar a ng ay M a g ni t ud e P r o p o r t i o n Sabt ang Savid ug. B asco Chanarian.5 Ivana Tuhel (Pob.). It b ayat Raele. Itbayat San Rafael. Basco San Antonio 4. Basco San Joaquin. Uyugan Itb ud.9 Sabtang Sinakan (Pob.).8 B asco Kayhuvo kan.7 MAHATAO.6 IVANA UYUGAN...5
27 CBMS Poverty Maps: Batanes Map. Pr of Households without Access to Safe Water Supply, by Municipality, 7-9. Ho use ho l d s w i t ho ut ac ce ss t o s af e wat er supp ly M uni ci p al i t y M ag ni t ud e P r o p o r t i o n B asco It b ayat. M ahatao.5 Sabt ang. Ivana Uyugan MAHATAO.5 IVANA. 4.4 UYUGAN Map. Pr of Households without Access to Safe Water Supply, by Barangay, 7-9. B o t t o m B a r ang ays M uni c ip a li t y B a r ang a y M a g ni t ud e P r o p o r t i o n B asco Chanarian 6 4. Itb ayat Santa Lucia.8 It b ayat Raele 7 8. Basco Ihubok I 6 6. B asco San Anto nio Basco Ihubok II 9 4. Sab t ang Savidug. B asco San Joaq uin. M ahatao Uvo y (Pob.). Itb ayat San Rafael. MAHATAO IVANA UYUGAN.
28 CBMS Poverty Maps: Batanes Map. Pr of Households without Access to Sanitary Toilet Facilities, by Municipality, 7-9. Ho use ho l d s w i t ho ut a cc es s t o sa ni t a r y t o il e t f a ci l i t i es M uni ci p a li t y M a g ni t ud e Pr o p o r t i o n Sabt ang 5.4 B asco 6. Ivana. Uyug an. Itb ayat. M ahatao. MAHATAO. IVANA UYUGAN...4 Map 4. Pr of Households without Access to Sanitary Toilet Facilities, by Barangay, 7-9. B o t t o m B ar a ng a ys M uni ci p al i t y B ar a ng a y M a g ni t ud e P r o p o r t i o n Sabt ang Chavayan 5.7 Sabt ang Savid ug. Ivana San Vicente. Basco San Joaquin.9 B asco Chanarian.5 Sabt ang Sumnanga.4 It b ayat Raele. Uyugan Itb ud.9 Sabtang Sinakan (Pob.).8 Basco Ihubok I.5 MAHATAO. IVANA UYUGAN...4
29 Table. Housing, Water and Sanitation Indicators, by Barangay, Province of Batanes, 7-9 Municipality Barangay Households living in makeshift housing Households who are informal settlers Households without access to safe water supply Households without access to sanitary toilet facilities Chanarian Ihubok I Ihubok II Kayhuvokan San Antonio San Joaquin Raele San Rafael Santa Lucia Santa Maria Santa Rosa IVANA Radiwan Salagao San Vicente Tuhel (Pob.).. MAHATAO Hanib Kaumbakan Panatayan Uvoy (Pob.).8. Chavayan Malakdang (Pob.) Nakanmuan Savidug Sinakan (Pob.) Sumnanga UYUGAN Imnajbu Itbud Kayuganan (Pob.) Kayvaluganan (Pob.).9.9 4
30 CBMS Poverty Maps: Batanes Map 5. Pr of Children 6- years old Not Attending Elementary School, by Municipality, C hi l d r en no t at t e nd i ng el e ment ar y s cho o l ( 6 - ye ar s o l d ) M unic i p a l i t y M ag nit ud e P r o p o r t io n Sab t ang 6 5. B asco 4. It b ayat 7.8 Ivana 7.5 Uyugan 7.4 M ahatao MAHATAO 6.4 IVANA UYUGAN 7.4 Map 6. Pr of Children 6- years old Not Attending Elementary School, by Barangay, Bott om Barangays M unicip ality B arang ay M ag nit ud e Pro po rtio n Sabtang Sumnanga 7.7 Sabtang Savidug 8. Ivana Tuhel (Pob.) 7.9 Mahatao Hanib 7.7 Sabtang Chavayan Basco Ihubok II Uyugan Kayvaluganan (Pob.) 5.5 Basco San Joaquin Basco Ihubok I 5.6 Sabtang Sinakan (Pob.) 8. MAHATAO. 6.4 IVANA UYUGAN
31 CBMS Poverty Maps: Batanes Map 7. Pr of Children -6 years old Not Attending High School, by Municipality, C hi l d r en no t a t t end i ng hi g h s cho o l ( - 6 ye ar s o l d ) M uni c ip a l it y M a g ni t ud e Pr o p o r t i o n Sabt ang 9. B asco 4 9. Ivana 8.8 It b ayat 8.6 Uyug an M ahatao MAHATAO 9.6 IVANA.8. UYUGAN 6.7 Map 8. Pr of Children -6 years old Not Attending High School, by Barangay, B o t t o m B a r ang ays M uni ci p al i t y B ar a ng ay M ag nit ud e Pr o p o r t i o n Sabt ang Sumnanga Sabt ang M alakd ang (Pob.) It b ayat Raele 4.6 Ivana Tuhel (Pob.) Itbayat San Rafael Basco San Antonio Ivana San Vicente Uyugan Kayvaluganan (Pob.) 6 7. Basco Ihubok II Basco San Joaquin MAHATAO. 9.6 IVANA UYUGAN
32 CBMS Poverty Maps: Batanes Map 9. Pr of Children 6-6 years old Not Attending School, by Municipality, C hi l d r en no t a t t e nd i ng sc ho o l ( 6-6 ye ar s o l d ) M uni ci p al i t y M a g ni t ud e Pr o p o r t i o n Itb ayat Sabt ang 5.4 Uyug an 8.6 Ivana 6.9 M ahatao 7.8 B asco.7 MAHATAO.8 IVANA UYUGAN.6 Map. Pr of Children 6-6 years old Not Attending School, by Barangay, B o t t o m B ar ang a ys M uni ci p al i t y B ar a ng ay M a g ni t ud e P r o p o r t i o n Sab t ang Sumnanga.6 Itbayat San Rafael 6.6 It b ayat Raele Sab t ang M alakd ang (Po b.) Itbayat Santa Lucia 9 6. Itbayat Santa Rosa Sab t ang Chavayan 4.9 Uyugan Kayvaluganan (Pob.) 4. Ivana San Vicente.6 Ivana Tuhel (Pob.).6 MAHATAO.8.7 IVANA UYUGAN
The Many Faces of. Poverty. Volume 8
 The Many Faces of Poverty Volume 8 The Many Faces of Poverty: Volume 8 Copyright PEP-CBMS Network Office, 217 Prepared by Celia M. Reyes Anne Bernadette E. Mandap Jasminda A. Quilitis Steffie Joi I. Calubayan
The Many Faces of. Poverty. Volume 5
 The Many Faces of Poverty Volume 5 The Many Faces of Poverty: Volume 5 Copyright PEP-CBMS Network Office, 24 ALL RIGHTS RESERVED. No part of this publication may be reproduced, stored in a retrieval system,
Faces of Poverty in Naga City
 Faces of Poverty in Naga City POPULATION The 3 Community-Based Monitoring System (CBMS) census in Naga City covered 7,88 households with a total population of 3,9 Naga City is an independent component
The Many Faces of. Poverty. Volume 8
 The Many Faces of Poverty Volume 8 The Many Faces of Poverty: Volume 8 Copyright PEP-CBMS Network Office, 27 Prepared by Celia M. Reyes Anne Bernadette E. Mandap Jasminda A. Quilitis Steffie Joi I. Calubayan
The Many Faces of. Poverty. Volume 5
 The Many Faces of Poverty Volume The Many Faces of Poverty: Volume Copyright PEP-CBMS Network Office, ALL RIGHTS RESERVED. No part of this publication may be reproduced, stored in a retrieval system, or
Testing the Missing Dimensions of Poverty. CBMS-OPHI Initiative
 Testing the Missing Dimensions of Poverty CBMS-OPHI Initiative Outline of Presentation CBMS Methodology OPHI Major Findings Implications for the CBMS Conclusions and Recommendations Background CBMS is
Poverty Reduction Strategy and Poverty Monitoring: Philippine Case Study
 Poverty Reduction Strategy and Poverty Monitoring: Philippine Case Study Presented at the Regional Conference on Poverty Monitoring in Asia March 24-26, 2004 ADB Headquarters, Manila Outline of Presentation!
Measures of Poverty. Foster-Greer-Thorbecke(FGT) index Example: Consider an 8-person economy with the following income distribution
 index Example: Consider an 8-person economy with the following income distribution") Foster-Greer-Thorbecke(FGT) index Example: Consider an 8-person economy with the following income distribution Individuals Income 1 0.6 2 0.6 3 0.8 4 0.8 5 2 6 2 7 6 8 6 Poverty line= 1 Recall that Headcount
Foster-Greer-Thorbecke(FGT) index Example: Consider an 8-person economy with the following income distribution Individuals Income 1 0.6 2 0.6 3 0.8 4 0.8 5 2 6 2 7 6 8 6 Poverty line= 1 Recall that Headcount
 MIMAP Micro Impacts of Macroeconomic Adjustment Policies PHILIPPINES http://www.pins.ph.net/mimap Project Updates Vol. VI No. 4 December 1999 POVERTY INCIDENCE OR THE INcidence of poor families is determined
Measuring Democratic Governance: An Emerging Challenge to Official Statisticians By Virola, Romulo A., De Costo, Severa B. & Villaruel, Mai Lin C.
 Measuring Democratic Governance: An Emerging Challenge to Official Statisticians By Virola, Romulo A., De Costo, Severa B. & Villaruel, Mai Lin C. Presented by Dr. ROMULO A. VIROLA Secretary General National
Human Development Indices and Indicators: 2018 Statistical Update. Indonesia
 Human Development Indices and Indicators: 2018 Statistical Update Briefing note for countries on the 2018 Statistical Update Introduction Indonesia This briefing note is organized into ten sections. The
Human Development Indices and Indicators: 2018 Statistical Update. Pakistan
 Human Development Indices and Indicators: 2018 Statistical Update Briefing note for countries on the 2018 Statistical Update Introduction Pakistan This briefing note is organized into ten sections. The
Human Development Indices and Indicators: 2018 Statistical Update. Cambodia
 Human Development Indices and Indicators: 2018 Statistical Update Briefing note for countries on the 2018 Statistical Update Introduction Cambodia This briefing note is organized into ten sections. The
Human Development Indices and Indicators: 2018 Statistical Update. Eritrea
 Human Development Indices and Indicators: 2018 Statistical Update Briefing note for countries on the 2018 Statistical Update Introduction Eritrea This briefing note is organized into ten sections. The
Sri Lanka. Country coverage and the methodology of the Statistical Annex of the 2015 HDR
 Human Development Report 2015 Work for human development Briefing note for countries on the 2015 Human Development Report Sri Lanka Introduction The 2015 Human Development Report (HDR) Work for Human Development
Hungary. HDI values and rank changes in the 2013 Human Development Report
 Human Development Report 2013 The Rise of the South: Human Progress in a Diverse World Explanatory note on 2013 HDR composite indices Hungary HDI values and rank changes in the 2013 Human Development Report
The Cambodia COUNTRY BRIEF
 The Cambodia COUNTRY BRIEF The Country Briefs were prepared by governments ahead of the SWA 2019 Sector Ministers Meeting. They are a snap-shot of the country s current state in terms of water, sanitation
Albania. HDI values and rank changes in the 2013 Human Development Report
 Human Development Report 2013 The Rise of the South: Human Progress in a Diverse World Explanatory note on 2013 HDR composite indices Albania HDI values and rank changes in the 2013 Human Development Report
Mr. Ali Ahmadov Deputy Prime Minister of the Republic of Azerbaijan, Chairman of the National Coordination Council for Sustainable Development
 Mr. Ali Ahmadov Deputy Prime Minister of the Republic of Azerbaijan, Chairman of the National Coordination Council for Sustainable Development 2 Azerbaijan joined the Millennium Declaration in 2000. To
Policy, Advocacy and Communication
 Policy, Advocacy and Communication situation Over the last decade, significant progress has been made in realising children s rights to health, education, social protection and gender equality in Cambodia.
Venezuela (Bolivarian Republic of)
") Human Development Report 2013 The Rise of the South: Human Progress in a Diverse World Explanatory note on 2013 HDR composite indices Venezuela (Bolivarian HDI values and rank changes in the 2013 Human
Human Development Report 2013 The Rise of the South: Human Progress in a Diverse World Explanatory note on 2013 HDR composite indices Venezuela (Bolivarian HDI values and rank changes in the 2013 Human
Towards a Well-Coordinated National Statistical System in Support of Sustainable Development Goals (SDGs) National Institute of Statistics of Cambodia
 National Institute of Statistics of Cambodia") Towards a Well-Coordinated National Statistical System in Support of Sustainable Development Goals (SDGs) National Institute of Statistics of Cambodia Mission of NIS The mission of the National Institute
Towards a Well-Coordinated National Statistical System in Support of Sustainable Development Goals (SDGs) National Institute of Statistics of Cambodia Mission of NIS The mission of the National Institute
The Influence of Research on Policy: MIMAP Philippines. January, By María Pía Riggirozzi & Tracy Tuplin
 The Influence of Research on Policy: MIMAP Philippines January, 2004 By María Pía Riggirozzi & Tracy Tuplin This report is based on an original document prepared by Kirit Parikh as part of a larger study
Explanatory note on the 2014 Human Development Report composite indices. Dominican Republic
 Human Development Report 2014 Sustaining Human Progress: Reducing Vulnerabilities and Building Resilience Explanatory note on the 2014 Human Development Report composite indices Dominican Republic HDI
Immigration and all-cause mortality in Canada: An illustration using linked census and administrative data
 Immigration and all-cause mortality in Canada: An illustration using linked census and administrative data Seminar presentation, Quebec Interuniversity Centre for Social Statistics (QICSS), November 26,
Development Report The Rise of the South 13 Analysis on Cambodia
 Development Report 20 Human The Rise of the South 13 Analysis on Cambodia Introduction The concept of human development entails freeing and enlarging people s choices within a society. In principle, these
Implementation of a Community-Based Poverty Monitoring System in Ghana. (January 2004 December 2005) A Project Proposal
 A Project Proposal") Implementation of a Community-Based Poverty Monitoring System in Ghana (January 2004 December 2005) A Project Proposal 1 I. PROJECT OVERVIEW Abstract Implementation of a Community-Based Poverty Monitoring
Implementation of a Community-Based Poverty Monitoring System in Ghana (January 2004 December 2005) A Project Proposal 1 I. PROJECT OVERVIEW Abstract Implementation of a Community-Based Poverty Monitoring
Gender institutional framework: Implications for household surveys
 GLOBAL FORUM ON GENDER STATISTICS ESA/STAT/AC.140/5.1 10-12 December 2007 English only Rome, Italy Gender institutional framework: Implications for household surveys Prepared by Cyril Parirenyatwa Central
Youth labour market overview
 1 Youth labour market overview With 1.35 billion people, China has the largest population in the world and a total working age population of 937 million. For historical and political reasons, full employment
Working Paper
 Working Paper 2003-13 Dimensions of Poverty of Indigenous People Celia M. Reyes Anne Bernadette E. Mandap Kenneth C. Ilarde Celia M. Reyes Ph.D.: PEP Network Co-Director and CBMS Network Team Leader Anne
Statistical Yearbook. for Asia and the Pacific
 Statistical Yearbook for Asia and the Pacific 2015 Statistical Yearbook for Asia and the Pacific 2015 Sustainable Development Goal 1 End poverty in all its forms everywhere 1.1 Poverty trends...1 1.2 Data
MIMAP. The recent Asian. Project Updates. Poverty in the Philippines * PHILIPPINES WHAT'S INSIDE. Micro Impacts of Macroeconomic Adjustment Policies
 MIMAP Micro Impacts of Macroeconomic Adjustment Policies PHILIPPINES http://www.panasia.org.sg/mimapph Project Updates Vol. VII No. 3 September 2000 The recent Asian financial crisis, aggravated by the
WBG Senior Vice President Mahmoud Mohieldin Geneva, 7 December 2016
 WBG Senior Vice President Mahmoud Mohieldin Geneva, 7 December 2016 MDG progress by country as recorded in 2015 2 CEB MDG Reviews: It s Initiation and Objectives Initiation: In November 2012, the United
SUMMARY ANALYSIS OF KEY INDICATORS
 SUMMARY ANALYSIS OF KEY INDICATORS from the FSM 2010 Census of Population and Housing DIVISION OF STATISTICS FSM Office of Statistics, Budget, Overseas Development Assistance and Compact Management (S.B.O.C)
The former Yugoslav Republic of Macedonia
 Human Development Report 2014 Sustaining Human Progress: Reducing Vulnerabilities and Building Resilience Explanatory note on the 2014 Human Development Report composite indices The former Yugoslav HDI
Explanatory note on the 2014 Human Development Report composite indices. Armenia. HDI values and rank changes in the 2014 Human Development Report
 Human Development Report 2014 Sustaining Human Progress: Reducing Vulnerabilities and Building Resilience Explanatory note on the 2014 Human Development Report composite indices Armenia HDI values and
Explanatory note on the 2014 Human Development Report composite indices. Belarus. HDI values and rank changes in the 2014 Human Development Report
 Human Development Report 2014 Sustaining Human Progress: Reducing Vulnerabilities and Building Resilience Explanatory note on the 2014 Human Development Report composite indices Belarus HDI values and
THE ATTACHED DOCUMENT I. COOPERATION BETWEEN JICA AND THE ROYAL GOVERNMENT OF CAMBODIA
 RECORD OF DISCUSSIONS BETWEEN JAPAN INTERNATIONAL COOPERATION AGENCY AND AUTHORITIES CONCERNED OF THE ROYAL GOVERNMENT OF CAMBODIA ON JAPANESE TECHNICAL COOPERATION FOR THE PROJECT ON IMPROVING OFFICIAL
Lao People's Democratic Republic
 Human Development Report 2014 Sustaining Human Progress: Reducing Vulnerabilities and Building Resilience Explanatory note on the 2014 Human Development Report composite indices Democratic Republic HDI
Explanatory note on the 2014 Human Development Report composite indices. Cambodia. HDI values and rank changes in the 2014 Human Development Report
 Human Development Report 2014 Sustaining Human Progress: Reducing Vulnerabilities and Building Resilience Explanatory note on the 2014 Human Development Report composite indices Cambodia HDI values and
Venezuela (Bolivarian Republic of)
") Human Development Report 2014 Sustaining Human Progress: Reducing Vulnerabilities and Building Resilience Explanatory note on the 2014 Human Development Report composite indices Venezuela (Bolivarian HDI
Human Development Report 2014 Sustaining Human Progress: Reducing Vulnerabilities and Building Resilience Explanatory note on the 2014 Human Development Report composite indices Venezuela (Bolivarian HDI
Working Paper
 Working Paper 2005-07 Local Development Planning: A Sta. Elena Experience Bimbo Doria June 2005 Bimbo Doria, Sta. Elena Municipal Planning and Development Office IDRC photo: N. McKee Local Development
Chapter 2 Overview of Sudanese Economy and the Status of ICT in Sudan
 Chapter 2 Overview of Sudanese Economy and the Status of ICT in Sudan 2.1 Introduction This chapter provides a general overview of the socio-economic characteristics of the Sudanese economy and explains
SPECIAL RELEASE. EMPLOYMENT SITUATION IN NATIONAL CAPITAL REGION January 2014 Final Results
 Number: 2014-10 Date Released: July 30, 2014 SPECIAL RELEASE EMPLOYMENT SITUATION IN NATIONAL CAPITAL REGION January 2014 Final Results The Labor Force Survey (LFS) is a nationwide survey conducted quarterly
RESTRUCTURING THE PHILIPPINE STATISTICAL SYSTEM IN RESPONSE TO NEW CHALLENGES: REDEFINING THE ROLE OF THE NATIONAL STATISTICS OFFICE IN THE SYSTEM 1
 RESTRUCTURING THE PHILIPPINE STATISTICAL SYSTEM IN RESPONSE TO NEW CHALLENGES: REDEFINING THE ROLE OF THE NATIONAL STATISTICS OFFICE IN THE SYSTEM 1 BACKGROUND AND RATIONALE The Philippine Statistical
Note by Task Force on measurement of the socio-economic conditions of migrants
 Distr.: General 3 August 2012 Original: English Economic Commission for Europe Conference of European Statisticians Group of Experts on Migration Statistics Work Session on Migration Statistics Geneva,
Role of Cooperatives in Poverty Reduction. Shankar Sharma National Cooperatives Workshop January 5, 2017
 Role of Cooperatives in Poverty Reduction Shankar Sharma National Cooperatives Workshop January 5, 2017 Definition Nepal uses an absolute poverty line, based on the food expenditure needed to fulfil a
SPECIAL RELEASE. EMPLOYMENT SITUATION IN NATIONAL CAPITAL REGION April 2013 Final Results
 Republic of the Philippines NATIONAL STATISTICS OFFICE National Capital Region Number: 2013-12 SPECIAL RELEASE EMPLOYMENT SITUATION IN NATIONAL CAPITAL REGION April 2013 Final Results The Labor Force Survey
Poverty in the Third World
 11. World Poverty Poverty in the Third World Human Poverty Index Poverty and Economic Growth Free Market and the Growth Foreign Aid Millennium Development Goals Poverty in the Third World Subsistence definitions
Diagnosing poverty at the local level * Celia M. Reyes **
 MIMAP Micro Impacts of Macroeconomic Adjustment Policies PHILIPPINES http://www.panasia.org.sg/mimapph Project Updates Vol. X No. 3 September 2003 Diagnosing poverty at the local level * Celia M. Reyes
SPECIAL RELEASE. EMPLOYMENT SITUATION IN NATIONAL CAPITAL REGION July 2013 Final Results
 Republic of the Philippines NATIONAL STATISTICS OFFICE National Capital Region Number: 2014-01 Date Released: February 5, 2014 SPECIAL RELEASE EMPLOYMENT SITUATION IN NATIONAL CAPITAL REGION July 2013
info Poverty in the San Diego Region SANDAG December 2013
 info December 2013 SANDAG Poverty in the San Diego Region Table of Contents Overview... 3 Background... 3 Federal Poverty Measurements... 4 Poverty Status for Individuals in the San Diego Region... 6 Demographic
Poverty Profile of the Philippines
 MIMAP Project Philippines Micro Impacts of Macroeconomic Adjustment Policies Project MIMAP Research Paper No. 50 Poverty Profile of the Philippines Celia M. Reyes January 2001 (Revised) Paper Presented
Economic and Social Council
 United Nations E/CN.3/2014/20 Economic and Social Council Distr.: General 11 December 2013 Original: English Statistical Commission Forty-fifth session 4-7 March 2014 Item 4 (e) of the provisional agenda*
Explanatory note on the 2014 Human Development Report composite indices. Serbia. HDI values and rank changes in the 2014 Human Development Report
 Human Development Report 2014 Sustaining Human Progress: Reducing Vulnerabilities and Building Resilience Explanatory note on the 2014 Human Development Report composite indices Serbia HDI values and rank
Lecture 1. Introduction
 Lecture 1 Introduction In this course, we will study the most important and complex economic issue: the economic transformation of developing countries into developed countries. Most of the countries in
Unit 4: Corruption through Data
 Unit 4: Corruption through Data Learning Objectives How do we Measure Corruption? After studying this unit, you should be able to: Understand why and how data on corruption help in good governance efforts;
Progress in health in Eritrea: Cost-effective inter-sectoral interventions and a long-term perspective
 UNDER EMBARGO UNTIL 01 DECEMBER 2010 Progress in health in Eritrea: Cost-effective inter-sectoral interventions and a long-term perspective Romina Rodríguez Pose and Fiona Samuels Key messages 1. Despite
SPECIAL RELEASE EMPLOYMENT SITUATION IN NATIONAL CAPITAL REGION. October 2015 Final Results
 REPUBLIC OF THE PHILIPPINES PHILIPPINE STATISTICS AUTHORITY NATIONAL CAPITAL REGION Number: 2016-08 Date Released: July 31, 2016 SPECIAL RELEASE EMPLOYMENT SITUATION IN NATIONAL CAPITAL REGION October
Issues, Threats and responses Vanessa Tobin UNICEF Representative Philippines
 Impact of the Economic Crisis on Children in Asia and the Philippines Issues, Threats and responses Vanessa Tobin UNICEF Representative Philippines Lessons learn from 1997 crisis Globalization has both
Session 5: Monitoring the Achievement of the MDGs Through CBMS
 378 Proceedings of the 2008 CBMS Network Meeting Session 5: Monitoring the Achievement of the MDGs Through CBMS development plans of both the municipality and the barangays to ensure sustainability even
Economic and Social Council
 United Nations Economic and Social Council Distr.: Limited 12 July 2006 Original: English For action United Nations Children s Fund Executive Board Second regular session 2006 6-8 September 2006 Item 4
Research on urban poverty in Vietnam
 Int. Statistical Inst.: Proc. 58th World Statistical Congress, 2011, Dublin (Session CPS055) p.5260 Research on urban poverty in Vietnam Loan Thi Thanh Le Statistical Office in Ho Chi Minh City 29 Han
Economic and Social Council
 United Nations Economic and Social Council Distr.: General 27 December 2001 E/CN.3/2002/27 Original: English Statistical Commission Thirty-third session 5-8 March 2002 Item 7 (f) of the provisional agenda*
Regional Disparities in Employment and Human Development in Kenya
 Regional Disparities in Employment and Human Development in Kenya Jacob Omolo 1 jackodhong@yahoo.com; omolo.jacob@ku.ac.ke ABSTRACT What are the regional disparities in employment and human development
The Global Crunch and Health: Issue, Threats and Responses
 The Global Crunch and Health: Issue, Threats and Responses Health Systems Team WHO Office of the Representative in the Philippines Source: www.who.int/social_determinants/en Health and Social Justice Health
Explanatory note on the 2014 Human Development Report composite indices. Palestine, State of
 Human Development Report 2014 Sustaining Human Progress: Reducing Vulnerabilities and Building Resilience Explanatory note on the 2014 Human Development Report composite indices Palestine, State of HDI
Inclusive Growth in Bangladesh: A Critical Assessment
 2 ND SANEM ANNUAL ECONOMISTS CONFERENCE MANAGING GROWTH FOR SOCIAL INCLUSION Inclusive Growth in Bangladesh: A Critical Assessment Towfiqul Islam Khan Research Fellow, CPD Dhaka:
Hong Kong, China (SAR)
") Human Development Report 2014 Sustaining Human Progress: Reducing Vulnerabilities and Building Resilience Explanatory note on the 2014 Human Development Report composite indices Hong Kong, China (SAR)
Human Development Report 2014 Sustaining Human Progress: Reducing Vulnerabilities and Building Resilience Explanatory note on the 2014 Human Development Report composite indices Hong Kong, China (SAR)
Working Paper
 Working Paper 2005-06 Multidimensional Poverty Monitoring: A Methodology and Implementation in Vietnam Louis-Marie Asselin Vu Tuan anh June 2005 Louis-Marie Asselin, Insitut de Mathematique Gauss, Canada
Abbreviations 2. List of Graphs, Maps, and Tables Demographic trends Marital and fertility trends 11
 CONTENTS Abbreviations 2 List of Graphs, Maps, and Tables 3 Introduction 5 1. Demographic trends 7 2. Marital and fertility trends 11 3. Literacy, education and training 20 4. Migration 25 5. Labour force
Explanatory note on the 2014 Human Development Report composite indices. Solomon Islands
 Human Development Report 2014 Sustaining Human Progress: Reducing Vulnerabilities and Building Resilience Explanatory note on the 2014 Human Development Report composite indices Solomon Islands HDI values
Data access for development: The IPUMS perspective
 Data access for development: The IPUMS perspective United Nations Commission on Population and Development Strengthening the demographic evidence base for the post-2015 development agenda New York 11 April
SPECIAL RELEASE. EMPLOYMENT SITUATION IN NATIONAL CAPITAL REGION January 2012 Final Results
 Republic of the Philippines NATIONAL STATISTICS OFFICE National Capital Region Number: 2013-07 SPECIAL RELEASE EMPLOYMENT SITUATION IN NATIONAL CAPITAL REGION January 2012 Final Results The Labor Force
The Trends of Income Inequality and Poverty and a Profile of
 http://www.info.tdri.or.th/library/quarterly/text/d90_3.htm Page 1 of 6 Published in TDRI Quarterly Review Vol. 5 No. 4 December 1990, pp. 14-19 Editor: Nancy Conklin The Trends of Income Inequality and
Poverty Profile. Executive Summary. Kingdom of Thailand
 Poverty Profile Executive Summary Kingdom of Thailand February 2001 Japan Bank for International Cooperation Chapter 1 Poverty in Thailand 1-1 Poverty Line The definition of poverty and methods for calculating
Reality and Solutions for the Relationships between Social and Economic Growth in Vietnam
 Reality and Solutions for the Relationships between Social and Economic Growth in Vietnam Le Dinh Phu Thu Dau Mot University E-mail: dinhngochuong2003@yahoo.com Received: September 22, 2017 Accepted: October
How s Life in Slovenia?
 How s Life in Slovenia? November 2017 Slovenia s average performance across the different well-being dimensions is mixed when assessed relative to other OECD countries. The average household net adjusted
Or7. The Millennium Development Goals Report
 Or7 The Millennium Development Goals Report 2009 1 Goal 1 Eradicate extreme poverty and hunger Target 1.A Halve, between 1990 and 2015, the proportion of people whose income is less than one dollar a day
Social Dimension S o ci al D im en si o n 141
 Social Dimension Social Dimension 141 142 5 th Pillar: Social Justice Fifth Pillar: Social Justice Overview of Current Situation In the framework of the Sustainable Development Strategy: Egypt 2030, social
THE PHILIPPINES. Overview. Operational highlights
 THE PHILIPPINES Overview Operational highlights In support of the Government, UNHCR s operation in the Philippines was expanded to respond to the Typhoon Haiyan emergency in November. The organization
Telephone Survey. Contents *
 Telephone Survey Contents * Tables... 2 Figures... 2 Introduction... 4 Survey Questionnaire... 4 Sampling Methods... 5 Study Population... 5 Sample Size... 6 Survey Procedures... 6 Data Analysis Method...
Briefing Paper Series No Overview of Poverty in Sri Lanka
 Briefing Paper Series No 13 2013 Overview of Poverty in Sri Lanka - 2013 Overview of Poverty in Sri Lanka - 2013 Shakeela Jabbar and Dinushka Senanayake revised by Ishara Rathnayake A Centre for Poverty
STRENGTHENING RURAL CANADA: Fewer & Older: Population and Demographic Crossroads in Rural Saskatchewan. An Executive Summary
 STRENGTHENING RURAL CANADA: Fewer & Older: Population and Demographic Crossroads in Rural Saskatchewan An Executive Summary This paper has been prepared for the Strengthening Rural Canada initiative by:
HOUSEHOLD SURVEY FOR THE AFRICAN MIGRANT PROJECT: UGANDA
 HOUSEHOLD SURVEY FOR THE AFRICAN MIGRANT PROJECT: UGANDA 1. Introduction Final Survey Methodological Report In October 2009, the World Bank contracted Makerere Statistical Consult Limited to undertake
Gender Perspective in Participatory Community Development Planning
 2008 Young Professionals Workshop: Building Sustainable Communities in the Resettlement Sites of Albay, Bicol 21-25 January 2008 Legaspi City Gender Perspective in Participatory Community Development Planning
Pakistan s Economy: Potential and Challenges
 The Pakistan Development Review 39 : 4 Part I (Winter 2000) pp. 287 292 Patron s Address Pakistan s Economy: Potential and Challenges SHAHID AMJAD CHAUDHRY Mr President, Distinguished Delegates, Excellencies,
ANNEX: FINDINGS FROM ARMM ISLANDS
 ANNEX: FINDINGS FROM ARMM ISLANDS In addition to the survey in Central Mindanao, the project collected data in Tawi-Tawi, Basilan, and Sulu islands. In total, 168 interviews were conducted in each island,
Place of Birth, Generation Status, Citizenship and Immigration. Reference Guide. Reference Guide. National Household Survey, 2011
 Catalogue no. 99-010-X2011008 ISBN: 978-1-100-22200-4 Reference Guide Place of Birth, Generation Status, Citizenship and Immigration Reference Guide National Household Survey, 2011 How to obtain more information
COUNTRY PLAN THE UK GOVERNMENT S PROGRAMME OF WORK TO FIGHT POVERTY IN RWANDA DEVELOPMENT IN RWANDA
 THE UK GOVERNMENT S PROGRAMME OF WORK TO FIGHT POVERTY IN THE UK GOVERNMENT S PROGRAMME OF WORK TO FIGHT POVERTY IN 1 2 3 4 5 6 7 8 CONTENTS WHAT IS DEVELOPMENT? WHY IS THE UK GOVERNMENT INVOLVED? WHAT
Thoko Sipungu 7/1/2016 A BRIEF REVIEW OF THE PERFORMANCE OF THE EASTERN CAPE IN TERMS OF THE STATISTICS SOUTH AFRICA COMMUNITY SURVEY 2016
 1 7/1/2016 A BRIEF REVIEW OF THE PERFORMANCE OF THE EASTERN CAPE IN TERMS OF THE STATISTICS SOUTH AFRICA COMMUNITY SURVEY 2016 Thoko Sipungu MONITORING AND ADVOCACY PROGRAMME PUBLIC SERVICE ACCOUNTABILITY
An Initial Verdict on Our Fight Against Poverty
 Philippine Institute for Development Studies Surian sa mga Pag-aaral Pangkaunlaran ng Pilipinas An Initial Verdict on Our Fight Against Poverty Celia M. Reyes DISCUSSION PAPER SERIES NO. 2004-48 The PIDS
Lesson Learned from Building Back Aceh & Nias Better. THE ROLE OF INFRASTRUCTURE IN WOMEN s ECONOMIC EMPOWERMENT
 Lesson Learned from Building Back Aceh & Nias Better THE ROLE OF INFRASTRUCTURE IN WOMEN s ECONOMIC EMPOWERMENT 0 HALF A MILLION PEOPLE LIVED HERE BEFORE THE 30-FEET HIGH TSUNAMI STRUCK ALMOST EVERYTHING
The CDB-based Poverty and Select CMDGs Maps and Charts
 An unofficial research report of the Ministry of Planning with support from the United Nations Development Programme, Cambodia. The publication contains findings of the Commune Database analysis and is
CHAPTER 3 SOCIO-ECONOMIC CONDITIONS OF MINORITIES OF INDIA
 CHAPTER 3 SOCIO-ECONOMIC CONDITIONS OF MINORITIES OF INDIA 73 List of Contents S.No. Chapter-3 Socio economic condition of Minorities of India on the Page number basis HDI indicators 3.1 Defination of
Panel 1: Multidimensional Poverty Measurement: Uses for a New Understanding of the Meaning of Poverty and Deprivation
 Panel 1: Multidimensional Poverty Measurement: Uses for a New Understanding of the Meaning of Poverty and Deprivation Jeni Klugman, Director of Human Development Report Office (UNDP) Some insights from
my ranking is better than yours : examining the use of Human Development Reports beyond country ranking
 my ranking is better than yours : examining the use of Human Development Reports beyond country ranking Nasser Yassin, PhD So many reports and indices What I will talk about? Introduce the HDR and its
How s Life in Denmark?
 How s Life in Denmark? November 2017 Relative to other OECD countries, Denmark generally performs very well across the different well-being dimensions. Although average household net adjusted disposable
WORKFORCE ATTRACTION AS A DIMENSION OF REGIONAL COMPETITIVENESS
 RUR AL DE VELOPMENT INSTITUTE WORKFORCE ATTRACTION AS A DIMENSION OF REGIONAL COMPETITIVENESS An Analysis of Migration Across Labour Market Areas June 2017 WORKFORCE ATTRACTION AS A DIMENSION OF REGIONAL
An analysis of Policy Issues on Poverty Towards Achieving the Millennium Development Goals (MDGs): A South African Perspective Edwin Ijeoma..
: A South African Perspective Edwin Ijeoma..") An analysis of Policy Issues on Poverty Towards Achieving the Millennium Development Goals (MDGs): A South African Perspective Edwin Ijeoma.. PhD (Pret.) University of Pretoria. Preamble and Expected Research
An analysis of Policy Issues on Poverty Towards Achieving the Millennium Development Goals (MDGs): A South African Perspective Edwin Ijeoma.. PhD (Pret.) University of Pretoria. Preamble and Expected Research