Latinos in Indiana: On the Throes of Growth
|
|
|
- Andrew Wiggins
- 6 years ago
- Views:
Transcription
1 Statistical Brief No. 11 Cifras Breves No. 11 Latinos in Indiana: On the Throes of Growth by Robert Aponte Associate Professor of Sociology, IUPUI Research Affiliate, JSRI with the assistance of Brenda Graves IUPUI July 1999 A Publication of Julian Samora Research Institute Michigan State University 112 Paolucci Building East Lansing, MI Phone: (517) Fax: (517) jsamorai@pilot.msu.edu Web Page: http// Statistical Briefs of the Julian Samora Research Institute are designed to provide facts and figures on Latinos of the Midwest. The data presented are those of the author(s) and are intended for use in further public policy research. The Julian Samora Research Institute is a unit of the Colleges of Social Sciences and Agriculture & Natural Resources at Michigan State University.

2 Michigan State University East Lansing, Michigan Julian Samora Research Institute Jorge Chapa, Interim Director Danny Layne, CIFRAS Editor SUGGESTED CITATION Aponte, Robert. Latinos in Indiana: On the Throes of Growth. Statistical Brief No. 11, the Julian Samora Research Institute. Michigan State University, East Lansing, Michigan. July The Julian Samora Research Institute is the Midwest s premier policy research and outreach center to the Hispanic community. The Institute s mission includes: Generation of a program of research and evaluation to examine the social, economic, educational, and political condition of Latino com - munities. Transmission of research findings to academic institutions, govern - ment officials, community leaders, and private sector executives through publications, public policy seminars, workshops, and private consultations. Provision of technical expertise and support to Latino communities in an effort to develop policy responses to local problems. Development of Hispanic human capital, including education, lead - ership development, and empowerment. About the Author: Robert Aponte Robert Aponte received his Ph.D. in sociology at the University of Chicago and has taught at Indiana University and at Michigan State University. He earlier directed a major research project on poverty and employment among the urban disadvantaged at the University of Chicago. Aponte s research interests include poverty, immigration, race and ethnicity, Latinos in the United States, and Contemporary Cuba. Among his recent works are Informal Work in the U.S. (1997), Towards the 21st Century: Latinos in the U.S. at Century s End and Beyond (1999), and Ethnic Variation in the Family (1999). He also co-authored Latinos in the Heartland: The Browning of the Midwest (1994), a widely publicized JSRI Research Report on the Midwestern Hispanics.
3 Latinos in Indiana: On the Throes of Growth Table of Contents Introduction...1 Major Demographic Trends...3 Social and Economic Indicators...17 Types and Places of Residence...21 Postscript: On the Throes of Growth?...22 References...25 Endnotes...26
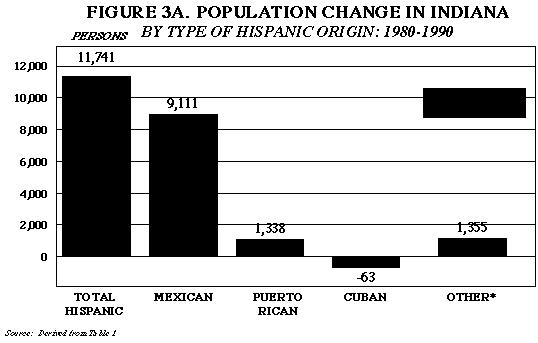
4 Latinos in Indiana: On the Throes of Growth Introduction Like most states in the nation s heartland, Indiana has hosted relatively few residents of Hispanic or Latino origin in the last few decades (Aponte and Siles, 1994). However, there are indications that this situation is changing rapidly, as we relate below. Nevertheless, the number of Latino residents in the state fell just short of 100,000 persons at the time of the last census. Thus, only three states (Illinois, Michigan, and Ohio) of the 12 in the Midwest region held more Latinos in This report provides a preliminary assessment of the group in Indiana, particularly as they compare with other groups in the state and with other Latinos in the region and nation. It is based primarily on census publications, but includes findings from other recent work along with information gleaned from numerous interviews and observations currently underway for these purposes. Among the key findings are several very interesting items. First, Latinos in Indiana are clearly living under better economic conditions, on average, than Latinos elsewhere. This is evident from comparisons on numerous indicators of well being, such as poverty rates or median family income. Ironically, this stands in sharp contrast to the relative positioning of the state s Whites. Here, Whites appear to live poorly compared to other states. Alternatively, Blacks in Indiana live as poorly as in other parts of the country. This is likely to stem from patterns of migration upwardly mobile and educated Whites probably leave the state in greater numbers than they arrive, while the relatively slow inmigration of Latinos has been selective of the slightly better off. Blacks, on the other hand, probably do not move in or out in a systematic way to raise or lower their indicators. Still, as is true almost everywhere else in the nation, Whites in Indiana are the most economically stable group in the state, Blacks fare the worst, and Latinos fare in between the two. While Latino population growth in Indiana has been sluggish, at least up to the present decade, the state s overall growth has been slower still. Indeed, Hispanics added more people to the state s population over the period than did Whites, despite the fact that the latter group began the decade well over 50 times larger than the former. However, Indiana remains a predominately White state by a substantial margin, with nearly nine out of ten residents identified by the census in 1990 as non-hispanic White. In this regard, Indiana is Whiter than the Midwest as a whole (86%), while the region is Whiter than the nation as a whole (76%). Thus, while the Browning of America phenomenon identified in the early 1990 s has been slow to reach the Midwest, it has been slower still to reach Indiana, although indications are it is coming here, too. Latino settlement patterns in Indiana, like elsewhere, tend toward concentrations in specific areas which do not always correspond to patterns among the population at large. Thus, while Lake County holds the largest number of Latinos in the state by far, that county is only the second largest in overall population. Marion County, which includes the city of Indianapolis, is the most populous in the state and hosts some 68% more people than does Lake County. By contrast, Lake hosts over five times as many Latinos as does Marion. Indeed, the top 10 counties in Latino population in Indiana account for nearly three-quarters of the group, but less than half of the state s total population. Further reflecting Latino patterns elsewhere, Latinos in Indiana are predominately Mexican in origin, with Puerto Ricans constituting a distant second place among the remaining nationality groups. Cubans are the third most numerous such group, but their numbers actually declined over the 1980 s. Their decline in numbers is very likely to stem, in part, from the significant attraction South Florida (especially Miami) poses to Cubans throughout the nation. Many, if not most, Cuban immigrants initially settled in areas designated by government relief agencies, rather than of their own choosing, and many have come to exercise their preference for settlement in or near the great Cuban enclave in Miami, widely known as Little Havana.
5 The major Hispanic origin groups in Indiana, as well as the state s Latinos as a whole, are a relatively youthful group. Both Blacks and Whites show higher median ages than Hispanics in the state, as is the case at the national level. No one factor explains this, but migration patterns are almost certainly one important reason for it. Migration tends to be selective of young adults and families, and Latinos in the U.S. are disproportionately immigrants, while those in Indiana are disproportionately inmigrants from outside the state, some even from abroad. However, the proportion of the state s Latinos that are foreign born is significantly smaller than that for the nation at large. Another factor that contributes to the group s relative youthfulness is their higher than average fertility, as subsequently shown. An additional item of great significance concerns intermarriage. Research cited here (Gannon et al., 1996) indicates that the state s Latinos intermarry with non-latinos at a remarkably high rate, especially outside of the Gary (Lake County) area. However, the suggested scenario is actually consistent with research efforts on Hispanic intermarriage elsewhere: it is more likely to occur among higher status Latinos and Latinos outside of major Latino concentrations (Aponte, 1999b). Not only are Indiana Latinos generally better off than those elsewhere but, outside of the Gary area, Latino concentrations are modest and the general pattern of settlement is a diffuse one. The final substantive topic of note concerns current trends in Latino growth in the state. Unfortunately, there is little hard information on this issue. Yet, there are clear indications that growth has accelerated as a result of inmigration. Two poles of recent growth are Indianapolis and the nearby town of Frankfort. In the latter case, there is a meatpacking plant which appears to be drawing large numbers of Latino workers, as has occurred in numerous similar rural towns throughout other midwestern states in the very recent past, especially Iowa, Minnesota, Nebraska, and Kansas (Aponte and Siles, 1997; Gouveia and Stull, 1997). Frankfort, which held few Latinos when the 1990 census was taken, is now reputed to be 20-40% Hispanic. In the case of Indianapolis, recent Latino growth is less clearly the result of a particular industry or other specific source of attraction. Yet, anecdotal information and even the most casual observations make clear the obvious substantial growth. Caseloads for ESL staff (English as a Second Language), for example, have mushroomed just in the last few years. Further, at least one recently launched storefront clinic in the inner city, to the organizers steep surprise, now serves a clientele that is perhaps half Hispanic! The subsequent version of this report will hopefully shed more light on these developments as ongoing efforts uncover them. In closing this section, a number of acknowledgments are in order. First, the reader is alerted to some of the very worthy work on Latinos in Indiana that preceded and facilitated the present work. These include the excellent edited collection in Lane and Escobar (1987), in which several articles give an in-depth history of Indiana Latinos in the northwest (Gary) area. Also, a recent brief, but excellent, work on the history of Latinos in the Indianapolis area has been produced by Guthrie and his colleagues (1995). Finally, and most recently, the likewise excellent and important report by Gannon et al. (1996), upon which we draw here, is acknowledged. The latter provides an additional portrait of the state s Latinos, much like that attempted here, though far more extensive. However, the dearth of information on the group is so extensive that the two reports provide useful and important information with only minimal overlap between them. Finally, we note that time constraints precluded any descriptive analyses of the labor force and occupational status of the state s Hispanics. These will be reported on in subsequent work on this topic by the author.

6 Major Demographic Trends The first item to be noted in any demographic review of Indiana is the fact that the state s population has barely grown at all in recent decades. What s more, the modest increase of the last intercensual interim represents a significant reduction in growth from that of the most immediately previous interim. Table 1 provides an overview of the changes in population, by race and Hispanic origin, from 1970 to While the 1970 s witnessed an increase in the state s population of some 300,000 persons, the increase over the 1980 s just barely exceeded 50,000 odd persons. Although no figures are present for Hispanics as a whole for 1970, it is clear that their major constituent groups increased in size by only modest proportions over the 20-year period, along with sharing in a reduced rate of growth over the second half of the period. Table 1. Indiana Population by Race and Hispanic Origin: Total 5,193,665 5,490,224 5,544,159 White* na** 4,953,603 4,965,242 Black* na** 411, ,612 Hispanic na** 87,047 98,788 Mexican 30,034 57,625 66,736 Puerto Rican 9,269 12,683 14,021 Cuban 1,158 1,916 1,853 Other Hispanic na** 14,823 16,178 Other* na** 37,746 51,517 Source: U.S.Bureau of the Census (hereafter, USBC) 1972, 1973, 1982, 1992a *Non-Hispanic **Not Available For example, while the Mexican origin population increased by over 25,000 people during the 1970 s (57,625-30,034), the corresponding growth over the 1980 s amounted to less than 10,000 (66,736-57,625). A similar pattern obtained for Puerto Ricans, while Cubans actually declined in population size. Despite the similar patterning, it is unlikely that the source of the slowdown is shared. Whites are almost certainly losing people to migration, along with Cubans, while the other groups likely to have merely been experiencing reductions in inbound migrants.
7 Figure 1A shows the relative portioning of the Indiana population by race and Hispanic origin at the time of the 1990 census. Nine out of 10 residents are non-hispanic White, 7.7% are non-hispanic Black (African American), and 1.8% are of Hispanic origin. The remaining category (Asians and others) accounts for less than 1% of the population. Within the Hispanic grouping, however, Mexicans claim the lion s share of the population, about two-thirds of it, with Puerto Ricans and Cubans next in line. Other Latinos, a group too heterogenous to categorize, comprise a larger share than either Cubans or Puerto Ricans.
8 As figures 1B and 1C show, the corresponding breakdowns for the Midwest and the U.S., respectively, show higher proportions of Blacks, Hispanics, and Others, and correspondingly lower proportions of Whites, but the relative rankings among the minority groups stay roughly the same. The sharpest change in ordering as the focus is shifted to the national level concerns other Hispanics. At the national level they comprise some 22% of all Latinos. The likeliest explanation for that patterning is that at the national level, there have been major waves of Latinos entering from Latin America that are settling in very specific places outside the Midwest, while those in the Midwest represent longer term U.S. residents not embedded in major migration streams (see Aponte, 1999a). Figure 2A shows the growth of the Indiana population between 1980 and As earlier noted, the total growth amounted to a mere 54,000 persons. Moreover, all three categories of minorities outgrew Whites, despite the latter s vast numeric advantage. For example, in 1980, Whites were virtually 57 times as numerous as Latinos. Thus, if neither group experienced any migration and both exhibited roughly the same rates of fertility and mortality, then Whites should have added over 50 times as many people to their ranks as did Hispanics. Instead, Latinos gained some 11,700 people, while Whites only added some 11,600. While fertility and mortality differences may account for some of the discrepancy, it is almost certainly due more to differential migration, as suggested above, than anything else. Figure 2B provides figures on population growth for the whole Midwest that correspond to those shown in Figure 1. The most striking difference between the two figures is that for the region as a whole, the White population is actually in decline, rather than just growing sluggishly. They ended the decade with one-third of a million fewer people than they began with, while Latinos and the others all experienced similar sized increases. Even more significantly, at the regional level, the Hispanic population grew even more than Blacks did. Here again, we can be sure, the major ingredient underlying the changes is migration.
.")
.")
9 Figure 2C provides the corresponding growth figures for the nation. Here Whites are shown to experience the most growth, with Latinos in second place, but only by a hair (7.9 to 7.8 million). Indeed, Whites began the decade some 12 times the size of the Latino group, but ended it only eight times as large. The significance of migration to the Latino growth cannot be over-emphasized (Aponte and Siles, 1997; Aponte, 1998). Latinos not only outgrew Blacks, but they added twice as many people as did the African Americans.
10
, the largest addition accrued to Mexicans, with Puerto Ricans and other Hispanics growing")


11 Figure 3A provides the breakdown on Hispanic growth in Indiana. As earlier noted (see Table 1), the largest addition accrued to Mexicans, with Puerto Ricans and other Hispanics growing modestly and Cubans taking a small loss. Figure 3B shows the corresponding changes at the regional level, and the pattern is very similar, except that Cubans show modest growth rather than modest decline. Figure 3C shows the national figures. Here a few items stand out. First, Mexicans show tremendous growth, adding nearly 5 million to their numbers over the decade! In addition, Other Hispanics are revealed to have increased their numbers significantly. Indeed, they grew over twice as much as did Puerto Ricans and Cubans combined (just over 2 million vs. just under 1 million).
12 Figure 4A shows the growth of the Hispanic population in the Midwest between 1980 and 1990 by individual states. Without a doubt, the key growth state is Illinois, and within Illinois, Chicago (cf Aponte and Siles, 1994). Whereas the Illinois Latino population increased by nearly 300,000 over the period, no other state in the region even held that many Latinos. It is clear that immigration is the key to this showing.

13 Moreover, as Figure 4B shows, the state s Hispanics are dominated by those of Mexican extraction, while Figure 4C shows further that the spectacular Latino growth in that state is likewise of Mexican-origin, a fact also supporting the immigration thesis. Shortly, still more evidence for this will be presented. Figures 5A and 5B show median age by race and Hispanic origin for Indiana and the U.S., respectively. In Indiana, all the minority groups are shown to be younger than Whites, who are slightly older than the state s average. Blacks are shown to be older than most Latinos, as well, except for Cubans. However, at the national level (Figure 5B), while there is little change in the numbers or the relative rankings, Cubans are the oldest (38.9 years), with Whites (34.9) and African Americans (28.2) following. Importantly, the Mexican origin group is the youngest (23.8) by a significant amount, trailing Puerto Ricans (25.7) in age by nearly two years. As earlier suggested, immigrant groups tend to be younger than the host populations with whom they come to reside.
14


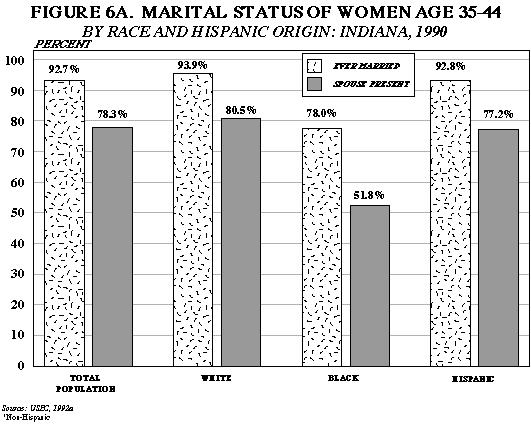
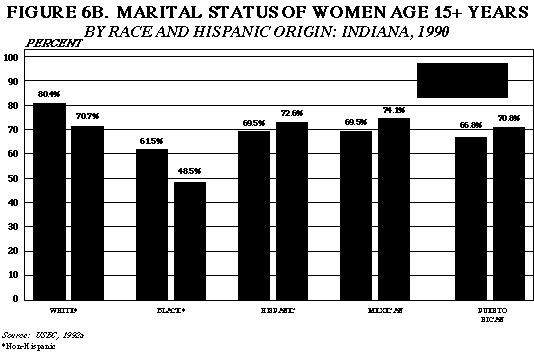
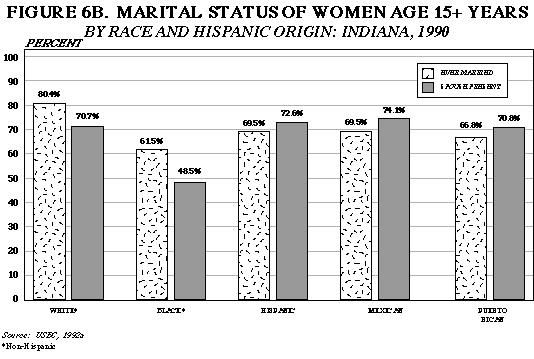
15 An interesting question here is why Cubans are so much younger in Indiana than they are in the nation at large. The likeliest answer is that the Cuban migration to Miami from other parts of the U.S. is selective of older Cubans, just as Florida and Arizona are selective of the homegrown elderly, albeit for different reasons. Cubans at older ages, but not necessarily the retirement years, may be more able to afford the move. They may also feel a greater need to be close to an enclave than younger adult Cubans. We can only speculate about this. Figure 6A provides figures on female marital status for Indiana by race and Hispanic origin. The figures for Whites, Hispanics, and the total population are very similar. Just over nine out of 10 women aged have been married at some time, and from 77% to 80% of those are still with a spouse present. Only Blacks stand out from the others in this regard. Less than eight out of 10 of African American women have ever married at that age, and of those that have, only about half are still with a spouse present. The reasons for the racial discrepancy have been the subject of much controversy. An important hypothesis about this is that the employment difficulties experienced by Black men undermine their marriageability (Aponte, 1999b). As always, the figures for Latinos as a whole may mask some variation among the constituent groups taken individually. Unfortunately, figures on marital status by age for the individual groups are not available for Indiana. However, the somewhat less meaningful figures on the marital status of all women aged 15 and older, by individual groups, are available. Figure 6b provides such figures and the pattern hardly changes. A larger proportion of White females have ever married than that of any of the Latino groups, and a lower proportion remain spouse present, but this is likely due to the age gap separating Whites from Hispanics. Since White women are older, on average, they have had a greater opportunity to get married; but, they have also had more time to grow weary of the bad marriages among them. There is little variation between Mexicans and Puerto Ricans, however, while African Americans continue to show significantly lower figures than the others. Age differences cannot account for this since Blacks are older than Latinos.


16 Figure 7A shows marital status for women aged for the nation by race and Hispanic origin. There appears little difference between the pattern there and that shown earlier for Indiana alone. However, things change when the focus is shifted to Figure 7B, where the marital statuses of women aged 15 and older are depicted for the nation. While Blacks are still shown to exhibit the lowest proportions ever married (or with spouse present), and Whites still show the highest rate of marriage, Puerto Ricans are now shown to experience a pattern closer to that of African Americans than to that of Mexicans. In particular, Puerto Rican women in the ever married category are over 20 percentage points less likely (74.2%-53.9%) to still be with a spouse than their Mexican counterparts, but only about four percentage points (53.9%-50.0%) more likely to be so than are African Americans. While a definitive explanation for the apparent marital instability of the Puerto Ricans is not available, the reasons are likely to be similar to those underlying Blacks even higher marital disruption rates (Aponte, 1999b). This item constitutes only the first of many indications that Indiana s Latinos are better off, on average, than those elsewhere. An important dimension of Hispanic marriage concerns intermarriage outside of the ethnic group. Data on that issue are not published, yet we report here on figures provided by Gannon et al. (1996), which tell an interesting tale. First off, Latinos in Indiana experience remarkable rates of intermarriage with non-hispanics. Gannon et al. calculate that over half (58.7%) of Latino married couples include a non-latino partner (they are classified as Latino married couples if either one or both are Latino). However, in the Gary area, the figure falls to 42.7%, and it is higher among Mexicans, generally, than among Puerto Ricans, although imbalances in Mexican sex-ratios (not present among Puerto Ricans) may account for some of the discrepancy. It is worth noting that this pattern is consistent with findings elsewhere (see Aponte, 1999b). Literature reviewed in Aponte (1999b) notes that both Mexicans and Puerto Ricans are more likely to marry outside their group if they are higher status (particularly in terms of education) and if they reside away from enclaves of fellow ethnics. As noted above (and subsequently reinforced), Indiana s Latinos are higher status than those elsewhere, on average, while outside of the Gary area, Latinos are either diffusely settled or settled in modest clusters.
. For Whites, the proportion is under 15% while, for Mexicans, it is under 20%.")
17 Figure 8Ashows the proportion of families consisting of women with children, but no spouse present, for Indiana. Here again, African Americans stand out as the group with the percentage of single mothers (53.1%). For Whites, the proportion is under 15% while, for Mexicans, it is under 20%. However, for Puerto Ricans, it is slightly more than 25%, significantly higher than the figure for Mexicans or Whites, but still less than half the figure for Blacks (53.1%). However, as before, the figures change markedly for Puerto Ricans, though only slightly for the others, when the focus is shifted to the nation. As Figure 8B shows the proportion of such families for Puerto Ricans (41.3%) rivals that of African Americans (48.7%) at the national level, while the figures for the other Hispanics rise only slightly and those for Whites go essentially unchanged.

 population growth among these two groups stems from lower fertility.")
18 Figure 9A provides fertility data for women aged for Indiana and the nation, by race and Hispanic origin. The figures denote children ever born to the women at an age when most will have reached, or nearly reached, the end of childbearing. The Whites and Cubans show the lowest fertility at both the state and national levels; this is consistent with their older median ages. It also suggests that at least some of the slower (or negative) population growth among these two groups stems from lower fertility. Blacks and Puerto Ricans show middle range fertility at similar rates, though with an interesting twist noted below. Mexicans, on the other hand, show the highest fertility rate at both the state and national levels. Thus, as suggested earlier, the Mexican advantage in population growth is at least partly attributable to higher than average fertility. What is more interesting here is the patterning of the contrasts between the groups fertility at the state versus the national levels. Whites, Blacks, and Cubans, for example, show higher fertility at state level than they do at the national level, although not by much. Only Whites show a gap of at least two-tenths (of a birth). Both Mexicans and Puerto Ricans show the opposite relationship their fertility at the national level exceeds their state level childbearing by at least two-tenths (of a birth). Since higher status (and upwardly mobile) people tend to experience lower fertility, the patterns shown here are consistent with the general idea advanced previously, that the state s Latinos are generally a better off group than their counterparts elsewhere in the U.S., while Whites show the opposite relationship. Figure 9B shows median family size for both Indiana and the U.S. by the same categories as in Figure 9A. The pattern matches the previous one almost flawlessly: generally speaking, the high fertility groups show the largest family size and vice versa. However, most groups show very little difference between their average family size in the state and that for the nation; the figures are too close to call. Mexicans stand out in this regard: their national median is a full four-tenths of a person larger than their state median (4.1 vs. 3.7). This is consistent with their having a large proportion of immigrants outside the state. Further, as shown in the footnotes to Figure 9B, the same thing is true for other Hispanics, that is, they also show a four-tenths of a person spread between their national (3.6) and state (3.2) medians. As earlier noted, they are also experiencing rapid immigration in places outside of Indiana. We should also note that not all of the increase in family size is likely to stem from higher fertility. Rather, minorities and, especially, immigrants are also likelier than others to experience family extension, that is, families doubling up temporarily or co-residing with one of more persons from their extended kin group (Aponte, 1999b).


19 Figure 10 provides the data on immigration which support the numerous suggestions made earlier regarding the significance of immigration to many of our findings, particularly the phenomenal growth of the Latinos in Illinois. There, figures on immigrants are presented for Latinos of Mexican origin, the group showing the most growth. The figures conveyed begin with a comparison of the respective immigrant proportions of the Mexican origin populations for the Midwest and for the nation. Interestingly, the proportions are practically identical, registering at just under one-third each. However, when the proportions are disaggregated by Illinois and the balance of the region, it becomes obvious that most of the region s Mexican immigrants are Illinois residents and, thus, immigration necessarily accounts for the skewing of the region s Latino population and its growth to Illinois.


20 As shown in Figure 10, immigrants account for almost half of all Illinois Mexican origin Latinos, in contrast to the rest of the region where the immigrant contribution is under 14%. However, Indiana s Mexican origin population is slightly higher than the average among the remaining midwestern states, registering at 15% of the group. Even Michigan, which holds the second largest component of Mexicans, holds a Mexican origin population that is only 10% immigrant (Aponte and Siles, 1997). Perhaps the most prevalent and immediate difficulties confronting immigrants is the language barrier. Figure 11 provides information on English facility among Hispanic persons, by type of Hispanic origin, for both Indiana and the nation. Here, without a doubt, at least one advantage enjoyed by Latinos in Indiana stands out in sharp tones. For Mexicans, Cubans, and other Hispanics, the proportions experiencing difficulty speaking English practically doubles outside Indiana, relative to inside the state. Even for Puerto Ricans, the proportion increases by fully 50%. The only possible anomaly here concerns the Cubans. While we did not examine the data on immigrant status for them, we believe that they have not received as huge a proportion of newcomers in recent years as have some of the other Latino groups, yet they show the largest proportion who have difficulty with English. If our assumption is right, the explanation for this lies in the enclave community. The Cuban enclave is so developed and selfcontained (like the major Chinatowns of New York and San Francisco), that it is perhaps possible for many adults to live there and get by without learning much English. It is an interesting hypothesis worth exploring. Social and Economic Indicators 1 Figure 12A shows the proportion of the adult population (25 years+) with at least 12 years of schooling (high school completion), for Indiana and the U.S., by race and Hispanic origin and by type of Hispanic origin. Every single category of Latino origin (total, Mexican, Puerto Rican, Cuban, and other [Hispanic]) shows higher com-
. Even Blacks show a higher proportion with at least a high school education in Indiana than outside it, but the difference is miniscule.")
, it is noteworthy and, given their overwhelming numeric dominance in the state, it is clear that the relationship is significant (not random")

21 pletion rates among their Indiana residents than among those residing throughout the whole nation, and the gaps are quite sizable (from 12 to 16 percentage points). Even Blacks show a higher proportion with at least a high school education in Indiana than outside it, but the difference is miniscule. Whites, however, show the opposite relationship. and while the difference among Whites is not that great (2.5 percentage points), it is noteworthy and, given their overwhelming numeric dominance in the state, it is clear that the relationship is significant (not random sampling variation). This is consistent with earlier noted indications. Figure 12B shows the proportion of adults with four or more years of college by group. It is completely consistent with Figure 12A with the exception of those for Blacks. In this instance, African Americans show a lower proportion in Indiana than outside it. Cubans show the most pronounced difference, with nearly three out of 10
 10%, but still with more attainment in the state than outside it.")
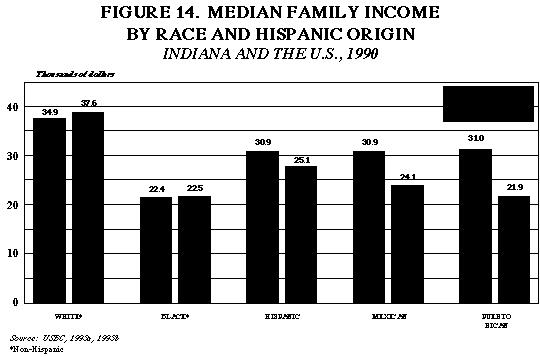
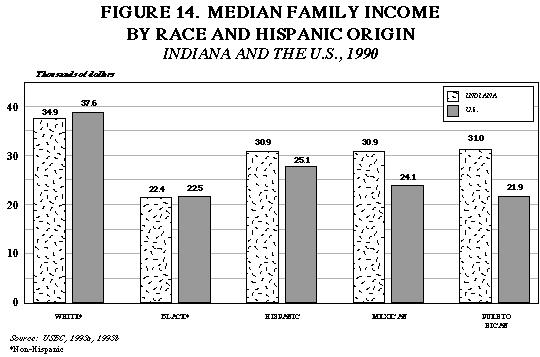
22 showing college attainment in Indiana, but only 16.5% doing so at the national level. Mexicans and Puerto Ricans show much lower proportions with college attainment, generally lower than (or at) 10%, but still with more attainment in the state than outside it. Whites, on the other hand, show substantially higher rates of college completion outside Indiana than inside it, with a spread of over six percentage points (22.0 vs. 15.9) between their state and national level figures. However, it should be emphasized, they still are the most educated of all groups, since the figures for the nation are the overriding ones. In this regard, we note again, their situation is likely to reflect more outmigration than inmigration by the upwardly mobile and more educated adults. Figure 13 provides data on poverty by all major groupings with one proviso Cubans have been combined with other Hispanics in this one instance because of sample size problems. Whites and Blacks show poverty rates that are about the same across the two categories of residence shown, but Blacks show nearly 30% rates at both junctures, Whites show under 10% in each case. The data on Latinos is unambiguous, those residing in Indiana fare better than those elsewhere among all groups noted. The most striking case concerns Puerto Ricans. In Indiana, their rate of poverty, at just under 19%, is very close to those of the other Hispanic groups, and within 10 percentage points of the low rate among Whites. However, at the national level, Puerto Ricans show the highest poverty rate of all! Indeed, their poverty rate (31.7%) exceeds that of African Americans (29.5%) by some 2.2 percentage points, while their Indiana rate trails that for Blacks by over 10 percentage points. The final chart in this section, Figure 14, shows median family income for all the groups save Cubans and others (see note 1). The figure shows that Whites enjoy more income outside Indiana than inside it. Their national level median income, at $37,600 per year, is the highest of all shown, and exceeds their corresponding state figure ($34,900) by nearly $3,000. It should be emphasized, however, that their state level income still exceeds all of the others incomes, irrespective of level of residence (whether state or national). Blacks show nearly identical median family incomes at both locales (about $22,500), while Mexicans and Puerto Ricans (along with Hispanics as a whole) show substantially more income in Indiana than outside it. Inside the state, these groups show nearly identical median incomes ($31,000), while at the national level, the income figure for Mexicans drops by nearly $7,000 and the drop for Puerto Ricans exceeds $9,000.
23

, to say nothing of the state s Latino farmworkers.")
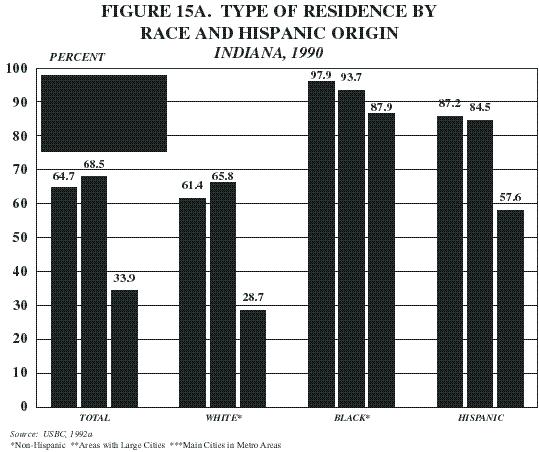
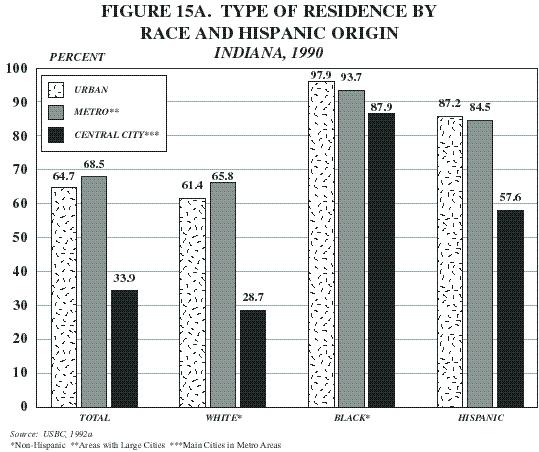
24 In closing this section, we re-emphasize that while it is certainly true that Indiana Hispanics are better off than their counterparts elsewhere, they are far from the point of attaining parity with Whites. Moreover, keep in mind the fact that their relative success is in a sense a statistical artifact, insofar as it results from migration patterns that stack the deck in their favor! Finally, we must not overlook the fact that the state s Blacks are in such abysmal shape, even when compared with Latinos, despite longer residence and comparable levels of educational attainment (see Figures 12A and 12B), to say nothing of the state s Latino farmworkers. Indeed, just before this essay was submitted for publication, the Indianapolis Star (Associated Press, 1998b) reported that a lawsuit had been filed on behalf of migrant families (almost certainly all Hispanic) who allegedly were cheated by their employers in a downstate county. These facts, along with the historical repression of Latinos in the state (see collection in Lane and Escobar, 1987) should serve as a chilling reminder that the struggle for justice and equality is far from over in Indiana, as is true throughout the nation at large. Types and Places of Residence Figure 15A provides a breakdown of the residential patterns of the state s population by race and Hispanic origin with respect to various categories of density and incorporation. The categories are urban residence, metropolitan area residence, and central city residence. Metropolitan areas are areas that meet certain criteria specified by the census bureau which amount to large cities and their suburbs (for a technical definition, see USBC, 1992a appendices), and central city residence refers to living within the large cities of the metropolitan areas. Not surprisingly, Blacks and Hispanics are more likely to be urban or metropolitan/central city area residents than Whites or the total population, the latter being mainly a reflection of the White group. Just under two-thirds of Whites are urban or metropolitan area residents, while less than 30% reside in central cities. Blacks are overwhelmingly in
25 cities, with over nine out of 10 being both urban and metropolitan area dwellers, and nearly as many living in central cities. Clearly, this later figure reflects the deep seated patterns of exclusion and discrimination visited upon them in suburbs and less urbanized areas. Finally, among Hispanics, nearly nine out of 10 are urban dwellers or metro area residents, but only about half or slightly more live in the central cities. Figure 15B shows the residential patterning by urban/metro/central city areas for Latinos by type of origin. The variation shown amounts to little and is not easily interpreted. Puerto Ricans are the most urbanized, with over 90% in urban or metropolitan areas and nearly two-thirds in central cities. However, the other groups figures trail the Puerto Ricans by relatively few percentage points except for other Hispanics, who show the lowest rate of central city residence. However, it is difficult to generalize about them because they are so heterogeneous in national background and are unlikely to have entered the state in similar trajectories. Figure 16 shows the top 10 counties in Latino population in the state, while Table 2 provides the explanatory information for the figure. We note first that fully five of these counties are at the upper northwest corner of the state, running east from Lake County along the state s northern perimeter, from metropolitan Gary to the South Bend area (Lake, Porter, La Porte, St. Joseph, Elkhart). A sixth one, also northern but not northernmost (Allen), holds Ft. Wayne, the state s second most populous city. The remaining four counties include two with major universities (Tippecanoe/Purdue and Monroe/Indiana Universities), one (Marion) with the state s capital and largest city (Indianapolis), and a final one (Grant) with only an obscure town (Marion City) as a distinguishing feature and which ranks ninth (holding only about 1,500 Latinos). By far, the most populous of these counties with regard to Hispanics is Lake County. Not only does this area hold Gary and a few other small cities, but it is in the shadow of the great Midwestern metropolis, Chicago, earlier noted to be the major Latino immigrant receiving city in the region. In addition, the area has a legacy of heavy Latino labor recruitment, first for the railroads, but mostly for the steel mills during the World War I era (see collection in Lane and E s c o b a r, 1987). Marion County, which is the most populous in the state overall (out numbering Lake by about 300,000), is only second in the number of Hispanic residents, and a distant second at that! A short history of Latinos there is found in Guthrie et al., (1995). Allen and St. Joseph counties, are next in Latino numeric strength. These hold the cities of Ft. Wayne and South Bend, respectively. Each of these has had an active (and activist) Hispanic community since at least the 1970 s, if not sooner (see HASS Task Force, 1979; MHRC, 1976). The remaining counties are either adjacent to one of the above or hold a major university with one exception Grant County In the former case, other Hispanics are likely to predominate, perhaps as university affiliates (see Gannon et al., 1996). The latter county holds the city of Marion, a town not famed for population size or any other obvious factor that might account for its Hispanic population. Subsequent work should be directed at examining the source of that area s status in this regard. We note, finally, that taken together, these counties account for nearly three-quarters of the state s Latinos (73.0%), but less than half (45.6%) of the state s total population. Nevertheless, fully seven of these top 10 counties in Latino population are among the top 10 counties in overall population in the state and the top four in each case are the very same ones. Postscript: On the Throes of Growth? We end on a note sounded earlier and reflected in our title the throes of growth. While much of what we believe is somewhat speculative, it is worth airing. Specifically, there are indications that the Latino population in Indiana is poised for moderately rapid growth. We find two independent poles of potential growth. First, as noted earlier, there is a meatpacking plant in Frankfort, a town near Indianapolis, which has clearly drawn large numbers of Latinos in recent years. The town is reputed to be from 20-40% Hispanic, a status of very recent vintage.
26
27 Table 2. Top 10 Counties in Indiana by Hispanic Population: 1990 HISPANICS HISPANIC TOTAL % OFSTATE % OF TOTAL COUNTY CITIES/FEATURES IN COUNTY POP. RANK POP. RANK HISPANIC POP. COUNTYPOP. Lake Gary, Hammond, E. Chicago 44, Marion Indianapolis 8, Allen Ft. Wayne 5, St. Joseph South Bend 5, Porter Adjacent to Lake County 3, Elkhart Elkhart, Adjacent to St. Joseph 2, Tippecanoe Lafayette, W. Lafayette, Purdue Univ. 2, LaPorte Next to Porter & St. Joseph Counties 1, Grant Marion (city) 1, Monroe Bloomington, Indiana University 1, Totals 72, * Source: USBC 1992a These 10 counties that account for 73.0% of the state s Latinos only account for 45.6% of the state s total population. Recently, a Latino man allegedly stabbed a White man in a bar fight there, according to press releases. In the immediate aftermath, a number of forms of racist intimidation directed at Latinos occurred and the town was in an uproar. Much revolved around Whites anxiety over the influx of Hispanics. More recently, however, the town s authorities and the area s Hispanic leadership have united to smooth relations (Associated Press, 1998a). The incident underscores the point that the influx must have been formidable. We note, in this regard, that meatpacking plants in other midwestern towns have taken to importing large numbers of Latino workers in the very recent past and their areas have been markedly transformed practically overnight (Aponte and Siles 1997, Gouveia and Stull 1997). Whether the numbers are as formidable as the press releases suggest, and whether the influx will continue, remains to be seen. A second pole of growth is Indianapolis itself. Anecdotal evidence and cursory observations suggest the capital city is attracting unprecedented numbers of Latinos, including even undocumented workers. About two years ago, the Immigration and Naturalization Service actually conducted a number of raids to round up undocumented workers, although that situation seems to have died down. However, schools are suddenly besieged with demands for bilingual staffers, hospital wards find themselves in need of translators, and neighborhoods are changing from both White and Black to Hispanic in very noticeable ways. While the numbers are not yet available and the observations may well be biased, traveling through the the city gives one the unmistakable impression that change is in the air. Only time and Census 2000 will tell for sure.
28 References Aponte, Robert. 1999a. Toward the 21st Century: Latinos in the U.S. at Century s End and Beyond. Latino Stud - ies Journal 10(2): b. Ethnic Diversity in the Family: The Elusive Trend Toward Convergence in M.B. Sussman, S.K. Steinmetz, and G.W. Peterson (eds) Handbook of Marriage and the Family (2nd edit). Plenum. Aponte, Robert and Marcelo Siles Latinos in the Heartland: The Browning of the Midwest. Research Report No 5. Julian Samora Research Institute, Michigan State University Winds of Change: Latinos in the Heartland and the Nation. Cifras No 6. Julian Samora Research Institute, Michigan State University. Associated Press. 1998a. Hispanic Community, Frankfort Leaders Vow to Promote Better Understanding Indi - anapolis Star (July 6):B b. Suit Says Migrants Received Illegally Low Wages Indianapolis Star (August 8):B5. Gannon, Fr Thomas S.J., Clifford Grammich, and Fr Steven Hurd S.J On Many Edges: The Hispanic Population of Indiana Heartland Center Report. Hammond, Ind.: The Heartland Center. Gouveia, Lourdes and Donald D Stull Latino Immigrants, Meatpacking, and Rural Communities: A Case Study of Lexington Nebraska. Research Report No 26. Julian Samora Research Institute, Michigan State University. Guthrie, Charles, Dan Briere, and Mary Moore The Indianapolis Hispanic Community. University of Indianapolis Press HASS Task Force (Hispanic and Spanish Speaking Task Force) Hispanic and Spanish Speaking Needs Report. United Way Planning, South Bend, Ind. Lane, James B and Edward J Escobar (eds) Forging A Community: The Latino Experience in Northwest Indiana Chicago: Cattails Press MHRC (Metropolitan Human Relations Commission) Survey of the Spanish Speaking People of Fort Wayne. Metropolitan Human Relations Commission, Ft Wayne, Ind. U.S. Bureau of the Census Census of Population Chapter C. General Social and Economic Characteristics Part 16, Indiana. PC(1)-C Census of Population Volume 2. Subject Reports, Persons of Spanish Origin. PC(2)-1C.
29 Census of Population Chapter B. General Population Characteristics. Part 16, Indiana. PC80-1- B a Census of Population General Population Characteristics: Indiana. CP b Census of Population General Population Characteristics: United States. CP a Census of Population Social and Economic Characteristics: Indiana. CP b Census of Population Social and Economic Characteristics: United States. CP-2-1. Endnotes 1 Data in this section as well as those in the immigration status and language use charts (Figures 10 and 11) derive from a census sample, rather than the full census. Hence, small groups may be combined with other groupings to increase sample strength or they may be altogether omitted from particular tabulations.
Nebraska s Foreign Born and Hispanic/Latino Population
 Nebraska s Foreign Born and Hispanic/ Demographic Trends, 1990 2008 January 15, 2010 Office of /Latin American Studies (OLLAS) University of Nebraska Omaha University of Nebraska Omaha Office of /Latin
ESTIMATES OF INTERGENERATIONAL LANGUAGE SHIFT: SURVEYS, MEASURES, AND DOMAINS
 ESTIMATES OF INTERGENERATIONAL LANGUAGE SHIFT: SURVEYS, MEASURES, AND DOMAINS Jennifer M. Ortman Department of Sociology University of Illinois at Urbana-Champaign Presented at the Annual Meeting of the
Characteristics of Poverty in Minnesota
 Characteristics of Poverty in Minnesota by Dennis A. Ahlburg P overty and rising inequality have often been seen as the necessary price of increased economic efficiency. In this view, a certain amount
PRESENT TRENDS IN POPULATION DISTRIBUTION
 PRESENT TRENDS IN POPULATION DISTRIBUTION Conrad Taeuber Associate Director, Bureau of the Census U.S. Department of Commerce Our population has recently crossed the 200 million mark, and we are currently
People. Population size and growth
 The social report monitors outcomes for the New Zealand population. This section provides background information on who those people are, and provides a context for the indicators that follow. People Population
Backgrounder. This report finds that immigrants have been hit somewhat harder by the current recession than have nativeborn
 Backgrounder Center for Immigration Studies May 2009 Trends in Immigrant and Native Employment By Steven A. Camarota and Karen Jensenius This report finds that immigrants have been hit somewhat harder
Illinois: State-by-State Immigration Trends Introduction Foreign-Born Population Educational Attainment
 Illinois: State-by-State Immigration Trends Courtesy of the Humphrey School of Public Affairs at the University of Minnesota Prepared in 2012 for the Task Force on US Economic Competitiveness at Risk:
People. Population size and growth. Components of population change
 The social report monitors outcomes for the New Zealand population. This section contains background information on the size and characteristics of the population to provide a context for the indicators
Institute for Public Policy and Economic Analysis
 Institute for Public Policy and Economic Analysis The Institute for Public Policy and Economic Analysis at Eastern Washington University will convey university expertise and sponsor research in social,
Changing Times, Changing Enrollments: How Recent Demographic Trends are Affecting Enrollments in Portland Public Schools
 Portland State University PDXScholar School District Enrollment Forecast Reports Population Research Center 7-1-2000 Changing Times, Changing Enrollments: How Recent Demographic Trends are Affecting Enrollments
Institute for Public Policy and Economic Analysis
 Institute for Public Policy and Economic Analysis The Institute for Public Policy and Economic Analysis at Eastern Washington University will convey university expertise and sponsor research in social,
Characteristics of People. The Latino population has more people under the age of 18 and fewer elderly people than the non-hispanic White population.
 The Population in the United States Population Characteristics March 1998 Issued December 1999 P20-525 Introduction This report describes the characteristics of people of or Latino origin in the United
Far From the Commonwealth: A Report on Low- Income Asian Americans in Massachusetts
 University of Massachusetts Boston ScholarWorks at UMass Boston Institute for Asian American Studies Publications Institute for Asian American Studies 1-1-2007 Far From the Commonwealth: A Report on Low-
Peruvians in the United States
 Peruvians in the United States 1980 2008 Center for Latin American, Caribbean & Latino Studies Graduate Center City University of New York 365 Fifth Avenue Room 5419 New York, New York 10016 212-817-8438
GENERATIONAL DIFFERENCES
 S U R V E Y B R I E F GENERATIONAL DIFFERENCES March 2004 ABOUT THE 2002 NATIONAL SURVEY OF LATINOS In the 2000 Census, some 35,306,000 people living in the United States identifi ed themselves as Hispanic/Latino.
1. A Regional Snapshot
 SMARTGROWTH WORKSHOP, 29 MAY 2002 Recent developments in population movement and growth in the Western Bay of Plenty Professor Richard Bedford Deputy Vice-Chancellor (Research) and Convenor, Migration
This analysis confirms other recent research showing a dramatic increase in the education level of newly
 CENTER FOR IMMIGRATION STUDIES April 2018 Better Educated, but Not Better Off A look at the education level and socioeconomic success of recent immigrants, to By Steven A. Camarota and Karen Zeigler This
Immigration Policy Brief August 2006
 Immigration Policy Brief August 2006 Last updated August 16, 2006 The Growth and Reach of Immigration New Census Bureau Data Underscore Importance of Immigrants in the U.S. Labor Force Introduction: by
Dominicans in New York City
 Center for Latin American, Caribbean & Latino Studies Graduate Center City University of New York 365 Fifth Avenue Room 5419 New York, New York 10016 212-817-8438 clacls@gc.cuny.edu http://web.gc.cuny.edu/lastudies
Integrating Latino Immigrants in New Rural Destinations. Movement to Rural Areas
 ISSUE BRIEF T I M E L Y I N F O R M A T I O N F R O M M A T H E M A T I C A Mathematica strives to improve public well-being by bringing the highest standards of quality, objectivity, and excellence to
Meanwhile, the foreign-born population accounted for the remaining 39 percent of the decline in household growth in
 3 Demographic Drivers Since the Great Recession, fewer young adults are forming new households and fewer immigrants are coming to the United States. As a result, the pace of household growth is unusually
Analysis of birth records shows that in 2002 almost one in four births in the United States was to an
 Backgrounder July 2005 Births to Immigrants in America, 1970 to 2002 By Steven A. Camarota Analysis of birth records shows that in 2002 almost one in four births in the United States was to an immigrant
Population Outlook for the Portland-Vancouver Metropolitan Region
 Portland State University PDXScholar Institute of Portland Metropolitan Studies Publications Institute of Portland Metropolitan Studies 2007 Population Outlook for the Portland-Vancouver Metropolitan Region
ENRICHING PUBLIC DISCOURSE ON LATINO IMMIGRATION:
 Team Members ENRICHING PUBLIC DISCOURSE ON LATINO IMMIGRATION: Report on a Collaborative Extension Services Initiative at Purdue University Carmen E. DeRusha Purdue University Extension Service, Marion
CLACLS. A Profile of Latino Citizenship in the United States: Demographic, Educational and Economic Trends between 1990 and 2013
 CLACLS Center for Latin American, Caribbean & Latino Studies A Profile of Latino Citizenship in the United States: Demographic, Educational and Economic Trends between 1990 and 2013 Karen Okigbo Sociology
IV. Residential Segregation 1
 IV. Residential Segregation 1 Any thorough study of impediments to fair housing choice must include an analysis of where different types of people live. While the description of past and present patterns
Joint Center for Housing Studies. Harvard University
 Joint Center for Housing Studies Harvard University The Living Arrangements of Foreign-Born Households Nancy McArdle N01-3 March 2001 by Nancy McArdle. All rights reserved. Short sections of text, not
The Brookings Institution Metropolitan Policy Program Robert Puentes, Fellow
 The Brookings Institution Metropolitan Policy Program Robert Puentes, Fellow A Review of New Urban Demographics and Impacts on Housing National Multi Housing Council Research Forum March 26, 2007 St. Louis,
Growth in the Foreign-Born Workforce and Employment of the Native Born
 Report August 10, 2006 Growth in the Foreign-Born Workforce and Employment of the Native Born Rakesh Kochhar Associate Director for Research, Pew Hispanic Center Rapid increases in the foreign-born population
Demographic, Social, and Economic Trends for Young Children in California
 Occasional Papers Demographic, Social, and Economic Trends for Young Children in California Deborah Reed Sonya M. Tafoya Prepared for presentation to the California Children and Families Commission October
Rural America At A Glance
 Rural America At A Glance 7 Edition Between July 5 and July 6, the population of nonmetro America grew.6 percent. Net domestic migration from metro areas accounted for nearly half of this growth. Gains
Working women have won enormous progress in breaking through long-standing educational and
 THE CURRENT JOB OUTLOOK REGIONAL LABOR REVIEW, Fall 2008 The Gender Pay Gap in New York City and Long Island: 1986 2006 by Bhaswati Sengupta Working women have won enormous progress in breaking through
Extended Abstract. The Demographic Components of Growth and Diversity in New Hispanic Destinations
 Extended Abstract The Demographic Components of Growth and Diversity in New Hispanic Destinations Daniel T. Lichter Departments of Policy Analysis & Management and Sociology Cornell University Kenneth
CLACLS. Demographic, Economic, and Social Transformations in Bronx Community District 5:
 CLACLS Center for Latin American, Caribbean & Latino Stud- Demographic, Economic, and Social Transformations in Bronx Community District 5: Fordham, University Heights, Morris Heights and Mount Hope, 1990
LATINO DATA PROJECT. Astrid S. Rodríguez Ph.D. Candidate, Educational Psychology. Center for Latin American, Caribbean, and Latino Studies
 LATINO DATA PROJECT Demographic, Economic, and Social Transformations in the South Bronx: Changes in the NYC Community Districts Comprising Mott Haven, Port Morris, Melrose, Longwood, and Hunts Point,
LATINOS IN CALIFORNIA, TEXAS, NEW YORK, FLORIDA AND NEW JERSEY
 S U R V E Y B R I E F LATINOS IN CALIFORNIA, TEXAS, NEW YORK, FLORIDA AND NEW JERSEY March 2004 ABOUT THE 2002 NATIONAL SURVEY OF LATINOS CHART 1 Chart 1: The U.S. Hispanic Population by State In the 2000
How Have Hispanics Fared in the Jobless Recovery?
 How Have Hispanics Fared in the Jobless Recovery? William M. Rodgers III Heldrich Center for Workforce Development Rutgers University and National Poverty Center and Richard B. Freeman Harvard University
IX. Differences Across Racial/Ethnic Groups: Whites, African Americans, Hispanics
 94 IX. Differences Across Racial/Ethnic Groups: Whites, African Americans, Hispanics The U.S. Hispanic and African American populations are growing faster than the white population. From mid-2005 to mid-2006,
THE 2004 NATIONAL SURVEY OF LATINOS: POLITICS AND CIVIC PARTICIPATION
 Summary and Chartpack Pew Hispanic Center/Kaiser Family Foundation THE 2004 NATIONAL SURVEY OF LATINOS: POLITICS AND CIVIC PARTICIPATION July 2004 Methodology The Pew Hispanic Center/Kaiser Family Foundation
18 Pathways Spring 2015
 18 Pathways Spring 215 Pathways Spring 215 19 Revisiting the Americano Dream BY Van C. Tran A decade ago, the late political scientist Samuel Huntington concluded his provocative thought piece on Latinos
Telephone Survey. Contents *
 Telephone Survey Contents * Tables... 2 Figures... 2 Introduction... 4 Survey Questionnaire... 4 Sampling Methods... 5 Study Population... 5 Sample Size... 6 Survey Procedures... 6 Data Analysis Method...
8AMBER WAVES VOLUME 2 ISSUE 3
 8AMBER WAVES VOLUME 2 ISSUE 3 F E A T U R E William Kandel, USDA/ERS ECONOMIC RESEARCH SERVICE/USDA Rural s Employment and Residential Trends William Kandel wkandel@ers.usda.gov Constance Newman cnewman@ers.usda.gov
Housing Portland s Families A Background Report for a Workshop in Portland, Oregon, July 26, 2001, Sponsored by the National Housing Conference
 Housing Portland s Families A Background Report for a Workshop in Portland, Oregon, July 26, 2001, Sponsored by the National Housing Conference by Barry Edmonston and Risa Proehl Housing Portland s Families
Socio-Economic Mobility Among Foreign-Born Latin American and Caribbean Nationalities in New York City,
 Socio-Economic Mobility Among Foreign-Born Latin American and Caribbean Nationalities in New York City, 2000-2006 Center for Latin American, Caribbean & Latino Studies Graduate Center City University of
3Demographic Drivers. The State of the Nation s Housing 2007
 3Demographic Drivers The demographic underpinnings of long-run housing demand remain solid. Net household growth should climb from an average 1.26 million annual pace in 1995 25 to 1.46 million in 25 215.
Statistical Brief No. 2 Cifras Breves No. 2
 Statistical Brief No. 2 Cifras Breves No. 2 MICHIGAN S FARMWORKERS: A Status Report on Employment and Housing By Refugio I. Rochín, Ph.D. Director and Professor, JSRI Marcelo E. Siles, Ph.D. Research Associate,
Chapter 1: The Demographics of McLennan County
 Chapter 1: The Demographics of McLennan County General Population Since 2000, the Texas population has grown by more than 2.7 million residents (approximately 15%), bringing the total population of the
HISPANIC WORKERS IN THE MIDWEST: A DECADE OF ECONOMIC CONTRAST by Santos,Richard, Ph.D. University of New Mexico
 HISPANIC WORKERS IN THE MIDWEST: A DECADE OF ECONOMIC CONTRAST 1970-1980 by Santos,Richard, Ph.D. University of New Mexico Working Paper No. 02 October 1989 HISPANIC WORKERS IN THE MIDWEST: A DECADE OF
The State of. Working Wisconsin. Update September Center on Wisconsin Strategy
 The State of Working Wisconsin Update 2005 September 2005 Center on Wisconsin Strategy About COWS The Center on Wisconsin Strategy (COWS), based at the University of Wisconsin-Madison, is a research center
Ecuadorians in the United States
 Center for Latin American, Caribbean & Latino Studies Graduate Center City University of New York 365 Fifth Avenue Room 5419 New York, New York 10016 Ecuadorians in the United States 1980 2008 212-817-8438
Racial Disparities in the Direct Care Workforce: Spotlight on Hispanic/Latino Workers
 FEBRUARY 2018 RESEARCH BRIEF Racial Disparities in the Direct Care Workforce: Spotlight on Hispanic/Latino Workers BY STEPHEN CAMPBELL The second in a three-part series focusing on racial and ethnic disparities
Dynamic Diversity: Projected Changes in U.S. Race and Ethnic Composition 1995 to December 1999
 Dynamic Diversity: Projected Changes in U.S. Race and Ethnic Composition 1995 to 2050 December 1999 DYNAMIC DIVERSITY: PROJECTED CHANGES IN U.S. RACE AND ETHNIC COMPOSITION 1995 TO 2050 The Minority Business
New data from the Census Bureau show that the nation s immigrant population (legal and illegal), also
, also") Backgrounder Center for Immigration Studies October 2011 A Record-Setting Decade of Immigration: 2000 to 2010 By Steven A. Camarota New data from the Census Bureau show that the nation s immigrant population
Backgrounder Center for Immigration Studies October 2011 A Record-Setting Decade of Immigration: 2000 to 2010 By Steven A. Camarota New data from the Census Bureau show that the nation s immigrant population
SECTION 1. Demographic and Economic Profiles of California s Population
 SECTION 1 Demographic and Economic Profiles of s Population s population has special characteristics compared to the United States as a whole. Section 1 presents data on the size of the populations of
Evaluating the Role of Immigration in U.S. Population Projections
 Evaluating the Role of Immigration in U.S. Population Projections Stephen Tordella, Decision Demographics Steven Camarota, Center for Immigration Studies Tom Godfrey, Decision Demographics Nancy Wemmerus
Chapter One: people & demographics
 Chapter One: people & demographics The composition of Alberta s population is the foundation for its post-secondary enrolment growth. The population s demographic profile determines the pressure points
Evaluating Methods for Estimating Foreign-Born Immigration Using the American Community Survey
 Evaluating Methods for Estimating Foreign-Born Immigration Using the American Community Survey By C. Peter Borsella Eric B. Jensen Population Division U.S. Census Bureau Paper to be presented at the annual
Snapshots of the past
 OVERVIEW State of Ohio, City of Dayton and Dayton area counties immigration patterns: not a site of immigrant destination until recently 9 Focus Groups comprised of 1st gen 6 of Latinos Interviews with
Patrick Adler and Chris Tilly Institute for Research on Labor and Employment, UCLA. Ben Zipperer University of Massachusetts, Amherst
 THE STATE OF THE UNIONS IN 2013 A PROFILE OF UNION MEMBERSHIP IN LOS ANGELES, CALIFORNIA AND THE NATION 1 Patrick Adler and Chris Tilly Institute for Research on Labor and Employment, UCLA Ben Zipperer
destination Philadelphia Tracking the City's Migration Trends executive summary
 destination Philadelphia October 6, 2010 executive summary An analysis of migration data from the Internal Revenue Service shows that the number of people moving into the city of Philadelphia has increased
Recent Demographic Trends in Nonmetropolitan America: First Evidence from the 2010 Census Executive Summary
 Recent Demographic Trends in Nonmetropolitan America: First Evidence from the 2010 Census Executive Summary Kenneth M. Johnson Department of Sociology and Carsey Institute University of New Hampshire This
The Impact of Ebbing Immigration in Los Angeles: New Insights from an Established Gateway
 The Impact of Ebbing Immigration in Los Angeles: New Insights from an Established Gateway Julie Park and Dowell Myers University of Southern California Paper proposed for presentation at the annual meetings
Demographics. Chapter 2 - Table of contents. Environmental Scan 2008
 Environmental Scan 2008 2 Ontario s population, and consequently its labour force, is aging rapidly. The province faces many challenges related to a falling birth rate, an aging population and a large
Race, Ethnicity, and Economic Outcomes in New Mexico
 Race, Ethnicity, and Economic Outcomes in New Mexico Race, Ethnicity, and Economic Outcomes in New Mexico New Mexico Fiscal Policy Project A program of New Mexico Voices for Children May 2011 The New Mexico
Iowa Voting Series, Paper 4: An Examination of Iowa Turnout Statistics Since 2000 by Party and Age Group
 Department of Political Science Publications 3-1-2014 Iowa Voting Series, Paper 4: An Examination of Iowa Turnout Statistics Since 2000 by Party and Age Group Timothy M. Hagle University of Iowa 2014 Timothy
The Demography of the Labor Force in Emerging Markets
 The Demography of the Labor Force in Emerging Markets David Lam I. Introduction This paper discusses how demographic changes are affecting the labor force in emerging markets. As will be shown below, the
WILLIAMSON STATE OF THE COUNTY Capital Area Council of Governments
 WILLIAMSON STATE OF THE COUNTY 2011 Capital Area Council of Governments POPULATION Capital Area Council of Governments POPULATION THE RISE OF TEXAS During the past decade, the State of Texas has proved
Demographic, Economic and Social Transformations in Bronx Community District 4: High Bridge, Concourse and Mount Eden,
 Center for Latin American, Caribbean & Latino Studies Graduate Center City University of New York 365 Fifth Avenue Room 5419 New York, New York 10016 Demographic, Economic and Social Transformations in
The foreign born are more geographically concentrated than the native population.
 The Foreign-Born Population in the United States Population Characteristics March 1999 Issued August 2000 P20-519 This report describes the foreign-born population in the United States in 1999. It provides
ASSIMILATION AND LANGUAGE
 S U R V E Y B R I E F ASSIMILATION AND LANGUAGE March 004 ABOUT THE 00 NATIONAL SURVEY OF LATINOS In the 000 Census, some 5,06,000 people living in the United States identifi ed themselves as Hispanic/Latino.
Planning for the Silver Tsunami:
 Planning for the Silver Tsunami: The Shifting Age Profile of the Commonwealth and Its Implications for Workforce Development H e n r y Renski A NEW DEMOGRAPHIC MODEL PROJECTS A CONTINUING, LONG-TERM SLOWING
Headship Rates and Housing Demand
 Headship Rates and Housing Demand Michael Carliner The strength of housing demand in recent years is related to an increase in the rate of net household formations. From March 1990 to March 1996, the average
Attitudes toward Immigration: Findings from the Chicago- Area Survey
 Vol. 3, Vol. No. 4, 4, No. December 5, June 2006 2007 A series of policy and research briefs from the Institute for Latino Studies at the University of Notre Dame About the Researchers Roger Knight holds
The State of Working Wisconsin 2017
 The State of Working Wisconsin 2017 Facts & Figures Facts & Figures Laura Dresser and Joel Rogers INTRODUCTION For more than two decades now, annually, on Labor Day, COWS reports on how working people
CIRCLE The Center for Information & Research on Civic Learning & Engagement
 FACT SHEET CIRCLE The Center for Information & Research on Civic Learning & Engagement The Youth Vote 2004 By Mark Hugo Lopez, Emily Kirby, and Jared Sagoff 1 July 2005 Estimates from all sources suggest
THE DECLINE IN WELFARE RECEIPT IN NEW YORK CITY: PUSH VS. PULL
 THE DECLINE IN WELFARE RECEIPT IN NEW YORK CITY: PUSH VS. PULL Howard Chernick Hunter College and The Graduate Center, City University of New York and Cordelia Reimers Hunter College and The Graduate Center,
Dominican and Colombian, Women in New York City: Household Structure and Employment Patterns
 Dominican and Colombian, Women in New York City: Household Structure and Employment Patterns Douglas T. Gurak1 and Mary M. Kritz 2 In recent years, there has been a growing interest in"~ i. " as awareness
University of California Institute for Labor and Employment
 University of California Institute for Labor and Employment The State of California Labor, 2002 (University of California, Multi-Campus Research Unit) Year 2002 Paper Weir Income Polarization and California
AP PHOTO/MATT VOLZ. Voter Trends in A Final Examination. By Rob Griffin, Ruy Teixeira, and John Halpin November 2017
 AP PHOTO/MATT VOLZ Voter Trends in 2016 A Final Examination By Rob Griffin, Ruy Teixeira, and John Halpin November 2017 WWW.AMERICANPROGRESS.ORG Voter Trends in 2016 A Final Examination By Rob Griffin,
MIGRATION CHALLENGES
 MIGRATION CHALLENGES Trends in People s Movement to and from the Milwaukee Area and Wisconsin Illuminate Important Issues By John D. Johnson and Charles Franklin Marquette Law School launched the Lubar
The Brookings Institution Metropolitan Policy Program Robert Puentes, Fellow
 The Brookings Institution Metropolitan Policy Program Robert Puentes, Fellow Caution: Challenges Ahead A Review of New Urban Demographics and Impacts on Transportation Eno Foundation Forum on the Future
Latinos in Massachusetts Selected Areas: Framingham
 University of Massachusetts Boston ScholarWorks at UMass Boston Gastón Institute Publications Gastón Institute for Latino Community Development and Public Policy Publications 9-17-2010 Latinos in Massachusetts
2010 CENSUS POPULATION REAPPORTIONMENT DATA
 Southern Tier East Census Monograph Series Report 11-1 January 2011 2010 CENSUS POPULATION REAPPORTIONMENT DATA The United States Constitution, Article 1, Section 2, requires a decennial census for the
The State of Rural Minnesota, 2019
 P.O. Box 3185 Mankato, MN 56002-3185 (507)934-7700 www.ruralmn.org The State of Rural Minnesota, 2019 January 2019 By Kelly Asche, Research Associate Each year, the Center for Rural Policy and Development
Latino Workers in the Ongoing Recession: 2007 to 2008
 Report December 15, 2008 Latino Workers in the Ongoing Recession: 2007 to 2008 Rakesh Kochhar Associate Director for Research, Pew Hispanic Center The Pew Hispanic Center is a nonpartisan research organization
The Latino Electorate in 2010: More Voters, More Non-Voters
 April 26, 2011 The Latino Electorate in 2010: More Voters, More Non-Voters Mark Hugo Lopez, Associate Director FOR FURTHER INFORMATION CONTACT: Pew Hispanic Center 1615 L St, N.W., Suite 700 Washington,
Post-Secondary Education, Training and Labour September Profile of the New Brunswick Labour Force
 Post-Secondary Education, Training and Labour September 2018 Profile of the New Brunswick Labour Force Contents Population Trends... 2 Key Labour Force Statistics... 5 New Brunswick Overview... 5 Sub-Regional
COMPARATIVE ANALYSIS OF METROPOLITAN CONTEXTS: ANNIE E. CASEY FOUNDATION CITIES
 ANNIE E. CASEY FOUNDATION MAKING CONNECTIONS INITIATIVE COMPARATIVE ANALYSIS OF METROPOLITAN CONTEXTS: ANNIE E. CASEY FOUNDATION CITIES G. Thomas Kingsley and Kathryn L.S. Pettit December 3 THE URBAN INSTITUTE
MIGRATION STATISTICS AND BRAIN DRAIN/GAIN
 MIGRATION STATISTICS AND BRAIN DRAIN/GAIN Nebraska State Data Center 25th Annual Data Users Conference 2:15 to 3:15 p.m., August 19, 2014 David Drozd Randy Cantrell UNO Center for Public Affairs Research
11. Demographic Transition in Rural China:
 11. Demographic Transition in Rural China: A field survey of five provinces Funing Zhong and Jing Xiang Introduction Rural urban migration and labour mobility are major drivers of China s recent economic
STRENGTHENING RURAL CANADA: Fewer & Older: Population and Demographic Crossroads in Rural Saskatchewan. An Executive Summary
 STRENGTHENING RURAL CANADA: Fewer & Older: Population and Demographic Crossroads in Rural Saskatchewan An Executive Summary This paper has been prepared for the Strengthening Rural Canada initiative by:
Labor markets in the Tenth District are
 Will Tightness in Tenth District Labor Markets Result in Economic Slowdown? By Ricardo C. Gazel and Chad R. Wilkerson Labor markets in the Tenth District are tighter now than at any time in recent memory.
Union Byte By Cherrie Bucknor and John Schmitt* January 2015
 January 21 Union Byte 21 By Cherrie Bucknor and John Schmitt* Center for Economic and Policy Research 1611 Connecticut Ave. NW Suite 4 Washington, DC 29 tel: 22-293-38 fax: 22-88-136 www.cepr.net Cherrie
Demographic, Economic, and Social Transformations in Brooklyn Community District 4: Bushwick,
 Demographic, Economic, and Social Transformations in Brooklyn Community District 4: Bushwick, 1990-2007 Astrid S. Rodríguez Ph.D. Candidate, Educational Psychology Center for Latin American, Caribbean
Regional Income Trends and Convergence
 Regional Income Trends and Convergence J. Fred Giertz and Shekhar Mehta Institute of Government and Public Affairs University of Illinois February 13, 1996.... This paper is one of a series associated
Demographic, Economic, and Social Transformations in Queens Community District 3: East Elmhurst, Jackson Heights, and North Corona,
 Demographic, Economic, and Social Transformations in Queens Community District 3: East Elmhurst, Jackson Heights, and North Corona, 1990-2006 Astrid S. Rodríguez Fellow, Center for Latin American, Caribbean
Nebraska s Foreign-Born and Hispanic/Latino Population
 January 2011 Nebraska s Foreign-Born and Hispanic/Latino Population Socio-Economic Trends, 2009 OLLAS Office of Latino/Latin American Studies (OLLAS) University of Nebraska - Omaha Off i c e o f La t i
THE EARNINGS AND SOCIAL SECURITY CONTRIBUTIONS OF DOCUMENTED AND UNDOCUMENTED MEXICAN IMMIGRANTS. Gary Burtless and Audrey Singer CRR-WP
 THE EARNINGS AND SOCIAL SECURITY CONTRIBUTIONS OF DOCUMENTED AND UNDOCUMENTED MEXICAN IMMIGRANTS Gary Burtless and Audrey Singer CRR-WP 2011-2 Date Released: January 2011 Date Submitted: December 2010
BY Rakesh Kochhar FOR RELEASE MARCH 07, 2019 FOR MEDIA OR OTHER INQUIRIES:
 FOR RELEASE MARCH 07, 2019 BY Rakesh Kochhar FOR MEDIA OR OTHER INQUIRIES: Rakesh Kochhar, Senior Researcher Jessica Pumphrey, Communications Associate 202.419.4372 RECOMMENDED CITATION Pew Research Center,
University of Missouri. Cambio de Colores Conference Latinos and Immigrants in Midwestern Communities May, 2010 Columbia, Missouri
 University of Missouri Cambio de Colores Conference Latinos and Immigrants in Midwestern Communities 24-26 May, 2010 Columbia, Missouri Data from the U.S. Census Bureau dmartinez@missouri.edu Large increases