Working in a recession: Are immigrants an unwanted guest?
|
|
|
- Shanna Lee
- 5 years ago
- Views:
Transcription
1 Working in a recession: Are immigrants an unwanted guest? MSc International Banking & Finance Luz Maria Rodriguez Esteban ( ) Dublin Business School 20 th April 2012
2 TABLE OF CONTENTS 1. INTRODUCTION Background Why I am interested in this topic Research Objective Research Hypothesis Approach to this Dissertation Organisation of this Dissertation Scope and Limitations of the Research Major contribution of the study LITERATURE REVIEW Introduction Causes of migration Push factors Pull factors Mixed factors Review of Applicable Models to the Study of the Economic Theory of Migration Simple Model of International Labour Mobility Model of Immigration Surplus Review of empirical results for the Economic Theory of Migration Graphical analyses Cross-Sectional Spatial Studies 42 2
3 2.4.3 Natural experiments Macroeconomics effects Evidence for the Irish case RESEARCH METHODOLOGY AND METHODS Introduction Research Philosophy Research Approach Research Design Research Strategies Research Choice Time Horizons Population and Sample Data Collection Primary Data Source Pilot Test Strength of Survey Weakness of Survey Secondary Data Sources Strength of Secondary Data Weakness of Secondary Data Conclusions 67 3
4 4. DATA ANALYSIS AND FINDINGS Introduction Demographic and professional characteristics Objective Immigrant Nationality Immigrant Educational Attainment Ireland as an attractive destination Objective Immigrant role in Enterprise Sectors Objective Immigrant Impact on native employment and wage levels Objective Employment Wages CONCLUSIONS AND RECOMMENDATIONS SELF REFLECTION ON OWN LEARNING AND PERFORMANCE Introduction Personality Types Learning Style Master Experience Development of Skills Conclusion BIBLIOGRAPHY 113 4
5 APPENDICES 118 Appendix 1: Survey 119 Appendix: 2: Survey main results 122 Appendix 3: Description of secondary data sources from the CSO 126 Appendix 4: Enterprise Sector with no significant variable (NONIRISH) 128 Equation Windows and Scatter diagrams Appendix 5: Effect on the welfare of the residents in the country of destination 137 Appendix 6: Tables 138 TABLES: Table 1: Explanatory factors of contemporary migrations 21 Table 2: Elasticity of native wages with respect to the number of immigrants in locality 43 Table 3: Distribution of Educational Attainment for the Native & Immigrant Population 50 Table 4: Distribution of Educational Attainment for the Native & Immigrant Population 71 Table 5: Estimated number of persons aged 15 years and over classified by nationality and economic labour force status 83 FIGURES: Figure 1: An Economy s Production Function 29 Figure 2: The Marginal Product of Labour 30 Figure 3: Market equilibrium model in perfect competition - before 31 immigration flow 5
6 Figure 4: Market equilibrium model in perfect competition -- after 32 Immigration flow Figure 5: Market equilibrium model in imperfect competition 34 Figure 6: Initial equilibrium in the labour market 38 Figure 7: Equilibrium in the labour market after the admission of immigrants 39 Figure 8: Immigration and unemployment rates in OECD countries, Figure 9: The Research Onion 54 Figure 10: The research onion used in this dissertation 54 Figure 11: Immigrants classified by nationality Secondary data CSO 70 Figure 12: Immigrants classified by nationality Primary data Survey 70 Figure 13: Level of Education achieved by Foreign Nationals 71 Figure 14: Push Factors 72 Figure 15: Pull factors 73 Figure 16: Total number of Immigrants in the Enterprise Sectors 75 Figure 17: Percentage of Immigrants vs Percentage of Native Workers Figure 18: Percentage of Immigrants vs Percentage of Native Workers Figure 19: Seasonally adjusted standardised unemployment rate (%) by state 81 and month ( ) Figure 20: Kolb s learning styles 108 6
7 Acknowledgement I would like to express my sincere gratitude and thanks to: My supervisor Aidan Finnegan for guiding me on this journey and for his valuable suggestions and attention. All the people who participated in my survey My partner David for his infinite love and patience during the completion of the programme, because without his support I would never have made it. My parents and sister for continually encouraging and supporting me in everything I do. Kathleen, for her help with proof reading and weekend dinners My friends, who I have rarely seen over the last few months and when I have, I have been very grumpy 7
8 Abstract The purpose of this dissertation is to estimate the impact of foreign nationals on the wages and employment levels of native Irish workers. Further aims are to analyse the demographic and educational characteristics of the immigrants, identify the reasons why they chose Ireland as a destination and investigate their role in the Irish labour market. For the research both primary and secondary sources were used to collect information. My research has confirmed that the majority of immigrants have come from the EU 12 accession countries; they are highly educated and have travelled to Ireland for primarily mainly economic reasons. The data suggest provides evidence that in some sectors immigrants have taken roles that the native workers found undesirable, while in other sectors there is evidence that immigrants are filling roles where there is insufficient qualified workers among the native population. To analyse the impact on wages and employment, I have used econometric techniques which aim to discover the relationship between immigration related variables and to measure the strength of the relationship between these variables. My results show a negative immigration impact on the employment rates of natives over the period However, conflicting effects have been found when I performed the analysis of the impact of immigration on wages. Each enterprise sector was investigated individually over the period Negative impacts were found in nine enterprise sectors (Industry, Construction, Wholesale and Retail, Transport and storage, Information and communication, Financial Insurance and real estate activities, Administrative and support services activities, Health, Other Services). Positive immigration impacts on wages were found in four enterprise sectors (Accommodation and food service, Public administration and Defence, Education and Health). In these four sectors the evidence suggests that the presence of foreign nationals may cause wages to increase. 8
9 1. INTRODUCTION 9
10 1.1 Background Immigration and its economic impact has been one of most discussed topics, in an academic context, of recent decades both in the United States and the European Union. The strong growth of immigration flows and the impact on the economies of host countries has meant a growing interest in analysing the process and its consequences, from different schools of thought, methodologies and approach policies, leading to numerous articles and documents. Ireland s long history as a country of significant emigration caused primarily by Ireland s lagging economic development 1. The 1990 s saw the emergence of a very different Ireland and the term Celtic Tiger has come to refer to the phenomenon of Ireland s incredible growth economy. The main factors in this growth were: the sustaining of a very large successful policy of peaceful industrial relations and a series of planned social partnership developments involving the government and employers trade unions. Also major investment in education, and fiscal and investment incentives in taxation made Ireland a very attractive location for foreign direct investment. Ireland is one of the European countries where immigration flows have increased most noticeably during the last decade. In 1996, Ireland reached its migration turning point, making it the last EU Member State to become a country of net immigration. The great majority of people migrating into the country were doing so in search of work answering Ireland s call for additional labour from abroad to ensure continuous economic growth rates. The period between 1996 and 2000s was marked by returning Irish nationals. Additionally the island s robust economy was making world headlines and began attracting refugees 2 looking for a better life. 1 Net emigration was particularly high in the age of mass migration (1871 to 1926) and the post-world War II era (1951 to 1961); the traditional destinations included the UK, USA and Australia 2 Also for several years, asylum seekers who had a child born in Ireland could then apply for residency; in other words, make it to Ireland for the birth of a child, and the mother, brother, sister and father were all likely be granted permission to reside here due to their kinship with an Irish citizen. 10
11 Another important dimension was the decision by the Irish Government to allow unrestricted access to its labour market immediately upon EU enlargement 3. Ireland along with the UK and Sweden were the only three member states who allowed full access to markets yet much of the outflow from the new member states were channelled to Ireland. Consequently, Ireland had to develop new policies 4 to deal with these changes in a very short period of time. Employment growth was engendered by and concentrated in the services and construction sectors. Between 2001 and 2006 alone, the Irish labour force grew by 17%, increasing from 1.8 million to 2.1 million workers and GDP growth averaged 6%. The property boom was the major factor accounting for labour market expansion, which created an enormous bubble in property prices. These prices rose more rapidly in Ireland in the decade up to 2007 than in any other developed economy 5. This produced positive results in Ireland such as a higher standard of living, an increase in consumerism, significant increases in wages 6 and a drop in unemployment. As with many of the world s economies, Ireland has been hit hard by the global economic crisis. Ireland entered into a recession in 2008 for the first time in more than a decade; 3 EU expanded to include 25 members on the 1 May 2004; the 10 accession states who joined the EU were Cyprus, Czech Republic, Estonia, Hungary, Latvia, Lithuania, Malta, Poland, Slovakia and Slovenia 4 Three policy areas stand out: To slow a rising number of asylum applications the government created a list of safe countries of origin and began prioritising applications accordingly. On the other hand, the EU expanded to include most of Eastern Europe so those who formerly might have been classified as refugees are now automatically entitled to reside in Ireland. In 2005 Ireland s citizenship laws were fundamentally changed to eliminate an Irish-born child s automatic right to citizenship when the parents are not Irish nationals. With regard to labour immigration, Ireland moved away from its more liberal work permit system as it sought to meet most of its low skilled labour needs. 5 See Central Intelligence Agency (CIA), The Wold Factbook, Ireland 6 According to National Employment Survey 2006 (CSO), the average hourly earnings increased by 18.6% from 2003 to
12 however, in the case of Ireland the recession has been more severe and prolonged, relative to elsewhere. The collapse of its domestic property and construction markets, coupled with the distressed financial sector, which represents a significant share of the Irish economy, caused a heavy contraction in output. Also since their 2007 peak, average house prices have fallen by almost 50%. In the context of a strong economic recession, Ireland faces still high immigration rates and a substantial population of legal foreign residents. In addition to these issues, unemployment rates are rising among immigrant and Irish nationals, which places further stress on the social welfare system. As a starting point, most papers I have had access to support the economic logic by which there is some degree of substitution between the native and immigrant labour force. They further this point by stating that consequently, immigration generates an increased supply of labour and so leads to drops in wages. In fact the economic logic is vital for the host country because through this mechanism, factors of production such as labour are cheaper, which makes goods cheaper leading to higher demand and consequently an increase in production and income in the host county - clearly very positive aspects. On the other hand it will negatively affect to a greater or lesser extent the income of natives in per capita terms and so generate opposition to immigration if wages of the native population fall significantly. 1.2 Why I am interested in this topic I myself am originally from Spain. I have been working now in Ireland in the Irish Stock Exchange for 1.5 years and living in Ireland for 3 years. I arrived in Ireland when the Celtic Tiger was over and the recession had just started both in Spain and Ireland. I had the dream of learning another language and to continue my studies abroad. Immigration is a very hot topic in my country. Since 2002 Spain has had one of the highest immigration rates in the world; three times higher than the USA and up to eight 12
13 times that of France. Immigrants are attracted by the strong economic growth of Spain over the last few years and are mainly Latin American; due to the close cultural ties and the ease of sharing the same language and African; due to close geographical proximity and because Spain is the main gateway to the European Union. In Spain illegal immigration, the black economy and the belief that immigrants have a negative impact on employment and wages have created huge social problems such as resistance to integration, racist attitudes and generalised rejection of immigrants. Due to my experiences in Spain and now that I am a foreign immigrant in Ireland, I wanted to investigate the impact of foreign nationals and identify if increasing levels of immigrants do actually have a negative impact on native workers in regards to wage and employment levels. 1.3 Research Objective The main objective of my research is to perform an empirical analysis of the impact of immigration on outcomes of native workers in Irish labour markets. My analysis will concentrate on wages and on the employment effects of immigration. The specific objectives of my research are as follows: Identify the demographic and professional characteristics of the immigrants in Ireland. Establish the reasons why immigrants think that Ireland is an attractive destination including a brief analysis of the social and work life of immigrants already present in Ireland. To investigate the occupational structures of the Irish labour market and analyse the distribution and impact of foreign national workers by enterprise sector. Determine if the hiring of Non-Irish workers produces negative impacts on Irish workers in regards to unemployment and wages levels. 13
14 1.4 Research Hypothesis Robson (2002) defined hypothesis as a testable proposition about the relationship between two or more specific concepts or variables. Therefore the research hypotheses for my research are: H1: The majority of the immigrants in Ireland come from the enlargement EU 15 to 27 member countries. H2: The immigrants in Ireland are highly educated. H3: The immigrants in Ireland perform the jobs that natives do not find desirable. H4: Increased employment among foreign nationals results in increased unemployment among native workers. H5: Higher levels of foreign national workers within a sector depress the overall wage level within that sector. 1.5 Approach to this Dissertation For this research both primary and secondary sources are used to collect information. The combination of both types of data gives a profound understanding of the quantitative data (a small amount of qualitative aspects were also included). Information collected through a primary data source used a questionnaire as a survey instrument, and secondary data information collected was from publications available from the CSO and other sources. More emphasis was given to the secondary data; however primary data was used to get access to more specific information not available from the secondary data sources. The population data has been taken from the Quarterly National House Survey (QNHS) for the analysis of the secondary data. A total of 56 immigrants were surveyed for the analysis of the primary data. 14
15 Although there are many approaches to consider for the research methodology, I followed the research process proposed by Saunders et al (2009) that compares the research process to an onion by emphasizing the layered approach to research. The research process for this dissertation is as follows: Research Philosophy: Positivism Research Approach: Deductive Research Strategy: Survey and Archival Research Research Choice: Mixed Methods Time Horizon: Cross-sectional Data collection: Questionnaire and Government surveys available in published form through Central Statistics Office (CSO) archives. My empirical analysis will allow a straightforward interpretation of deemed parameters through graphs, regression and correlation techniques. 1.6 Organisation of the Dissertation This dissertation is divided into the following chapters: Chapter 1: Chapter 2: Chapter 3: Introduction to the dissertation. This chapter contains the background and purpose of the study along with an overview of the outlay of the dissertation. Literature Review. This chapter outlines the causes of migrations and a review of the applicable models to the study of the Economic Theory of Migration. Examination of the empirical results of other researches and also emphasis on the studies made for the Irish case. Research Methodology. This chapter includes the research methodology that will show the philosophy, approach, strategy, choice, time horizons, techniques and procedures used in this dissertation. 15
16 Chapter 4: Chapter 5: Chapter 6: Data analysis and findings. This chapter is a presentation of both the findings and results from both the CSO publication analysis and the completed questionnaire. Conclusions and Recommendations. This chapter highlights and gives a summary of the main findings in relation to the aim of study, and also provides applicable recommendations based on the results obtained. Self-reflection on Learning and Performance. This chapter presents my learning style and its application towards completion of this study. 1.7 Scope and Limitations of the Research The aim of the study was to examine and identify if immigrants coming into the Irish labour market caused a reduction in the wage level of a particular sector, and/or lead to an increase in unemployment among the native population due to increased job scarcity. Due to the size and scope of the subject nature I had to focus on government publications and create statistical analysis to verify my aims. As the objective is a highly sensitive issue, I felt concrete overview analysis was the best method to use as individuals could have deeply embedded outlooks with regards to questioning or provision of information on this issue. Some limitations of the study are: Due to the size and scope of the subject matter, there is a greater reliance on secondary data sources. Questionnaires as a source are open to bias or where respondents give answers that are not true but which they think are more socially acceptable. The statistical analysis was performed and so the quality of the findings is influenced by the skill, knowledge and interpretation of the researcher. 16
17 1.8 Major contribution of the study The paper would be useful to inform the Government and the public about the effect of immigration on wages and employment opportunities of the existing population in Ireland. My analysis may help to form a picture of the effects of immigration based on data rather than opinion and furthermore the use of simple analysis with clear hypothesis may be easier for the public to understand. This paper may provide a starting point or aid someone who wishes to undertake a similar study in this area. 17
18 2. LITERATURE REVIEW 18
19 2.1 Introduction In this chapter I will examine recent significant research studies, articles and theories that would act as a basis for the proposed study. The literature review provides a solid background for the research and an overview of the secondary data referred for the development of this investigation. The reason to take the decision to emigrate, the kind of person more prone to take this decision, the reason why the wages in the host countries may decrease, or who profits most from the migration process: these are some of the main issues that economic theories of migration attempt to explain. Theoretical analysis is used to detect and define the needs of the economy and the characteristics of migration flows, and primarily analyse the economic impact of migration on the economies of host countries. These theories can partially explain the phenomenon of migration but as they depend in part on empirical contrasting, the results should not be considered as absolutely binding or fully valid. Simple real-world observations are not sufficient to explain why and how certain phenomena occur so theories, although based on abstract assumptions, simplistic and often unrealistic, serve the purpose of analysing phenomena such as immigration from an economic viewpoint. To understand the phenomenon of immigration it is important to know, first, why international migration occurs. International Economics has devoted little attention to the role of migration or labour mobility between countries while focusing mainly on international capital mobility. This theoretical development has been based on the neoclassical theory of international trade, and therefore the Heckscher-Ohlin s model 7. 7 In the early 1990s an international trade theory called factor proportion theory was proposed by two Swedish economists. Commonly know as the Heckscher-Ohlin model, it was developed on the Ricardian theory of international trade, considering the fact that pattern of trade is guided by the endowments of factors of production. Countries are characterised by different factor endowments (capital and labour), constant returns to scale, specialisation is incomplete (so no country will specialise completely in the production of a single good) as well as the existence of perfect competition and absence of trade barriers and transportation costs. 19
20 According to this theorem, each country should produce and export goods that require factors that are abundant and import goods that require resources in short supply. 2.2 Causes of Migration The first step in the study of migration flows should primarily analyse the factors that drive someone to leave their country of origin and the host country characteristics that make them attractive for potential migrants, or in other words, the study of supply and demand factors of international labour market. Theories that explore these factors are known by the name of push and pull theories, first coined by Professor Ravenstein. 8. Following his deliberations of the determinants of migration flows, we can distinguish between push factors or supply, and the pull characteristics or demand. The push factors are those life situations that give one reason to be dissatisfied with one s present locale for example high unemployment rate and the pull factors are those attributes of distant places that make them appear appealing such as job opportunities or better living conditions. The table below outlines the push and pull factors as well as the mixed factors which may impact both of these. The basic teaching of this model is that in a world where it is assumed that countries have identical technologies (meaning they have the same production function available), trade is determined by resource endowments. So a country that has a comparative advantage should produce the goods which it can produce relatively better than the other country using those same resources (eg. Labour). Thus, equalisation of the factors prices will occur if factor endowments of countries do not differ between them. 8 See Ravenstein (1885) and Ravenstein (1889). It is approximately one hundred years since the geographer Ernst Ravenstein reported his Laws of Migration to the statisticians of London (Ravenstein 1876, 1885, 1889) that attempted to explain and predict migration patterns both within and between nations 20
21 Table 1: Explanatory factors of contemporary migrations 21
22 2.2.1 Push factors There are some significant determinants from the supply perspective or push factors which should be considered as they affect the migration flows: 1. Push factors related to the country of origin: - Unemployment in the country of origin is the more common push factor. An economic crisis affects the labour market generating unemployment. The lack of employment can trigger the decision to leave and look for a job in a different country which has better market opportunities. - Poor economic outlooks in the short or medium term, lack of economic policies to promote economic development or countries with a high degree of instability. - Sometimes a country may have a tradition of migration deep rooted within its population where the decision to move is the social norm. A case in point as an example is Poland which traditionally has maintained large steady inflows to Ireland. - Wars, persecution for politics or religion reasons, dissatisfaction with the sociopolitical environment in the country of origin could be factors that generate emigration. This particular group are known as refugees or asylum seekers. - The availability of an individual s own financial resources or alternatively the access to credit to cover the expenses incurred during the migration project can often be paramount in the decision to leave or stay in the country of origin. 22
23 2. Push factors related to the host country -Expectations of higher future earnings in the country of destination is one of the points most analysed by the economic theory of migration. When workers take the decision to migrate, they calculate the value of employment opportunities and costs, choosing the portion that maximises the net present value. Thus, net migration gain is 9 : NG = PV (Revenue H ) PV (Revenue O ) Costs Where NG = net gain PV = present value H = host-country O = origin-country The worker will leave the country of origin when NG is positive. -The existence of social networks in the country of destination and specifically a member of the family or any friend that has already undertaken the migration process can increase the propensity to emigrate. - Other factors such as language, the future prospects for the family, housing costs and even the price of the flight from one country to other are important in choosing a destination. 9 See Dolado and Fernandez-Yusta, (2001). In their analysis they open up a number of implications empirically testable: - An increase in real wages or decrease in the unemployment rate in O will increase the probability of migration - An improvement in expected profits in H reduce the probability of migration - A reduction in costs (economic and social) to move from O to H will increase NG and therefore the propensity to migrate. 23
24 2.2.2 Pull factors From the demand s perspective there are a number of pull factors that must be considered to determine the volume of migration flows. According to Piore 10 (1979), migrations are not generated by push factors in the country of origin; they are generated by the pull factors in the host countries. 1. Pull factors related to the destination country: - The dual labour market theory 11 holds that international migrations are caused by the strong demand for available labour force, specialised and inexpensive in modern industrial societies. In this context, the main factor for attracting immigrants would be the shortage of native labour in some sectors of the destination country. -The black economy could also be considered as a factor of attraction for illegal immigrants. The combination of weak border controls along with the existence of a large black economy sector that is difficult to eradicate, and the proliferation of mafias who traffic in immigrants, make some countries especially ripe for illegal immigration. 10 Piore developed his theory for the case of the U.S. in the seventies during the last century. He focused on pull factors in destination areas; he concluded that the main causes of emigration are the structural labor needs of modern economies in destination areas. A detailed example of this is the shortage of labour in low income job positions in conjunction with the propensity of the host population to try achieve upward mobility and move away from low income jobs (then filled by immigrants) 11 "Dual labour market": concept developed by Doeringer and Piore (1971) to describe the phenomenon noticed by them in which the labour market appeared to be separated into a primary and a secondary sector. 24
25 2.2.3 Mixed factors These mixed factors are related to both pull and push factors because they have a simultaneous effect on both the country of origin and the country of destination of migration. Some mixed factors are listed below: -Differences in welfare state between the country of origin and destination can act as a push factor or pull factor. For example, lack of access to health care, scarcity of economic resources in the country of origin, along with a generous system of social protection in the host country. -The geographic distance between the chosen destination country and the country of origin influences to some extent the decision to emigrate. Borjas 12 presents an equation that shows a statistic relationship applied to the case of the States where the emigration rate of a country is equal to 0.7 times 13 minus the distance from the United States in thousands of miles. The empirical analysis shows that the emigration rate fell almost one percentage point per increase of 1,000 miles in the distance between the country of origin and the country of destination. A European example of such a relationship would be North Africa and the South of Europe and in particular Morocco with regard to Spain. The close geographical proximity of both continents means that many potential African migrants would deem reaching European achievable and they can follow their European dreams. 12 See Borjas (1999), page 8 25
26 -Demographic trends in North-South of Germany in terms of age 13 and fertility is considered as an explanatory factor for Professor Zimmerman 14. While the population in the north generally tends to stagnate and age progressively, the population of the south continues growing at a rapid pace. -The growing gap in income per capita between the countries of destination and origin. Empirical evidence suggests that differences in per capita income are determinants of the size and direction of migration flows. Borjas 15 found that migration to the United States originated primarily in countries with substantially lower income per capita. He empirically contrasted that over 10% of the population of Guyana and Jamaica migrated to United States between 1970 and 1990, as compared to less than 1% of the Germans, Greeks or Italians, so the author concludes that there is a strong connection between the rate of emigration and income per capita in the country of origin. Ireland is the home of immigrants from countries with low incomes like Poland. In 2009 the income per capita in Ireland was $38,000 while in Poland it was just $18,000.This disparity or variance is wide spread in the European Community and so is a possible explanation for intra- communitarian migration According to OECD data for 2009, countries with a higher percentage of population aged over 65 years are Czech Republic, Japan, Korea, Denmark, Finland, Germany, Spain and Switzerland. In countries like Japan, Greece, Italy and Spain, the percentage has doubled between 1960 and These data prove the so-called aging of the developed countries. The case of Ireland shows a percentage of population over 65 with respect to the total population in 1960 of 11.1%, while this figure rose to 11.7% in See OECD (2009) See Zimmerman (1995), page See Borjas (1999), page 8 16 See 26
27 2.3 Review of Applicable Models to the Study of the Economic Theory of Migration The previous section dealt with the causes of international migration, while in this part I now focus on the effects of immigration on the economy of the host country. It is important to study the consequences of migration from a purely theoretical view to understand the most important effects of migration on the economy of the host county. I would like to clarify in advance that this dissertation examines only theories that cling to the economy, without considering those variables that do not belong to the realm of the strictly economic. They then collect the main contributions provided by the economic literature regarding the effects on the country of destination, which are used to interpret subsequent migratory phenomena that are occurring today, and to answer questions such as: Migratory flows, do they lower the wages of the native workers?, and more specifically workers who are perfect substitutes? Immigration: Does it generate unemployment in the host country? Does it affect some workers in a special way? For the development of theoretical models I will make a distinction between closed and open economies. A closed economy model is based on the premise that there is no international trade flows, or in other words an autarkic economy. Given that this theoretical framework is removed from the actual conditions of today s world I will explain just a few general ideas following Friedberg and Hunt 17. We consider an economy where production takes place using capital and a skilled labour force, which are the complementary factors of production. An unskilled labour force is now a substitute for the previous skilled workers. The flow of immigrant workers with 17 See Friedberg and Hunt (1995) 27
28 skilled or unskilled qualifications will produce different impacts on the autarkic economy. Thus, if the flow in consists mainly of unskilled immigrants, the theory predicts that the wages of unskilled workers fall while the impact of returns on capital and wages of skilled workers is ambiguous. In the former case, there could be two effects: -Substitution effect: it will induce employers to substitute qualified capital and labour for unskilled labour. -Scale effect: the increased supply of unskilled labour means more optimal output, which will lead to all inputs being employed more strongly. If however, the additional labour supply consists mainly of skilled immigrants, this will probably reduce the wages of skilled workers due to the substitution effects (the fall in the wages of skilled workers) and scale (the increase in employment of skilled labour could create an increase in the return of capital). This flow will have an ambiguous effect on wages of unskilled workers The existence of an open economy is the starting premise for the following models. The reality indicates that there are universal restrictions on labour mobility. Although there is a fundamental economic similarity between goods trade, services, capital and labour, there are important differences regarding the human condition as well as international political and social context in different countries. 28
29 2.3.1 Simple Model of International Labour Mobility The model of international labour mobility developed by Krugman and Obstfeld (2003) was introduced to me during my graduate studies of International Economics. I studied it further as part of the Macroeconomic Module of my current Master degree. It implies the existence of a perfectly competitive market in which there are two countries A and B (A is the country of origin and B is the country of destination) and two types of productive factors (land and labour). Each country produces a single product, and there is possibility of labour mobility. We suppose that work skill levels are identical and there are no cultural, political, religious or social differences; the only difference is wages. Diminishing marginal product of labour (marginal product of labour declines as more workers are employed) is also assumed. Figure 1: An Economy s Production Function Output, Q Q (T,L) Labor, L This production function Q (T, L) shows how the output varies with changes in the amount of labour employed, holding the amount of land T fixed. The larger the supply of labour, the larger is output; however the marginal product of labour declines as more workers are employed. The slope (MPL) measures the increase in output using a little more labour. The marginal product of labour declines as the number of workers increase. Given the level of employment, the marginal product determines the real wage. The total output of the economy can be measured by the area under the MPL curve, of the total output, wages earned by workers are equal the real wage rate times the employment of labour and the remainder are the rents earned by landowners. 29
30 Figure 2: The Marginal Product of Labour Marginal product of labor, MPL Rents Real wage Wages MPL Labor, L On the graphs the level of wages is represented on the vertical axis in each country and on the horizontal axis is represented the labour level. Where: W A = wage level in country A (country of origin) W B = wage level in country B (country of destination) Wage levels are determined by the law of supply and demand so that the greater labour supply in A implies lower wages while in B the shortage of labour means higher wages. 30
31 Figure 3: Market equilibrium model in perfect competition before immigration flow Country A Country B C Wb E Wa B MPL MPL O L O* Workers in the country of origin Workers in the destination country Total labour force In order to balance the salaries in both countries workers from country A migrate to B, a realignment will occur in production, number of employees and wages. Graphically it proves that wages in country A will increase and wages in country B would be reduced as a result of the migration process. 31
32 Figure 4: Market equilibrium model in perfect competition after immigration flow Country A Country B C Wb W* E W* Wa A B MPL MPL O Leq L1 O* Migration of labour from the country of origin to the destination country As a result of labour mobility and given the existence of diminishing marginal product of labour, ceteris paribus, the production of country A will decrease less rapidly than the decline in the workforce, which will produce an increase in output per capita in A. To sum up, the relative benefit to countries that absorb labour (country B) is less than for those from where the people emigrated. Finally, the world as a whole clearly benefits from these migration flows as the increase of production in country B offsets the decline in production in country A. The area ECD represents the increased production worldwide. 32
33 The basic teachings of this model are: -As a result of the flows of migration, in the country of origin the workforce decreases and the domestic wages increase, while in the destination country the workforce increases and reduces the wages until there is convergence of real wages and marginal product is equal in both countries -There is an increase of overall world production. Gains by the country of destination due to the migration flows are higher than the losses incurred by the country of origin, so the whole world wins. Despite this gain, some people are hurt by the change: those who initially worked in the country of origin receive higher real wages but those who worked in the country of destination receive lower real wages 18. This analysis changes when the two countries produce two goods to be considered and not just one. According to Rybczynski 19 s theorem, given full employment and constant international prices 20, the increase of workforce in country B (country of destination which welcomes immigrants) will generate an increase in the production of workintensive goods (e.g. textiles) and a decrease in production of goods that use land intensively as a production factor(e.g. agricultural products). In an open economy, it is logical to think that the adjustment occurs through the workforce employed in the traded goods. Thus, immigration will cause the country of destination to try compensate against the increase in labour supply by exporting more labour-intensive goods (or importing less capital-intensive goods). 18 For graphical analysis see appendix 5 19 Tadeusz Rybczynski was a Polish-born English economist who is known for the development of the Rybczynski theorem in the middle of 1950 s. This theorem is useful in analysing the effects of immigration and emigration within the context of a Heckscher-Ohlin model. This model means that in general, an increase in a country s endowment of a factor will cause an increase in output of goods which use that factor intensively, and therefore a decrease in the output of other goods. 20 It is important to point out that the assumptions of no distortions of prices between any two countries, full employment and fixed international prices are very unlikely and almost impossible to occur in reality. 33
34 Now, I work on the assumption that the market is imperfect and there are wage differences between country A and B. Also market imperfections generate a surplus of labour such that a portion of the work force in country A is unemployed with a wage of Wa 21. The model shows the case where there are market imperfections in the country of origin of migration. 22 Figure 3 shows that country A has a workforce of O-L 1 with a salary Wa (B), and country B has workforce L 2 -O* with a salary Wb (D). Thus, L 1 -L 2 represents the level of unemployment in Country A s economy in terms of salary fixed internally Wa 23 Figure 5: Market equilibrium model in imperfect competition Country A Country B C D Wb Wb' W* E W* Wa A B MPL F MPL O Leq L1 L2 O* Migration of labour from the country of origin to the destination country 21 The wage level Wa is assumed fixed, due to minimum wage laws and wage rigidity that often generate policies that endorse wage fixing mechanisms and collective bargaining, as well as pressure from trade unions not to reduce wage levels in a given sector. 22 In addition, market imperfections may occur in the country of destination of migrants and not only in the country of origin. For example, the general persistence of unemployment in the case of the European Union, this will require a more complex analysis that uses a different model of market equilibrium under conditions of perfect competition. See Zimmermann (1994), page At point F the market would reach an equilibrium point for the country A, where the equilibrium wages should be lower to avoid unemployment. 34
35 In this case there will be a migratory flow from country A, where there is unemployment, to country B, where the wages are higher because of the fewer jobs available. The result of this shift is the increase in production in country B and a drop in salary (salary would drop from Wb to Wb') without any reduction in output in A (C), because just the unemployed workers have emigrated from A as in their country of origin they did not contribute to increases in production As such there would no change in wages levels in country A. To match all wages between the two countries it is necessary to transfer the number of workers Leq-L 1 from A to B so the employment in country B is Leq-O*. In this situation, the production in A will be reduced - area (LeqEB L 1 ) and will lead to an increase in output per capita due to diminishing marginal productivity of labour. However in country B, it would generate a decrease in output per capita as a result of a greater increase in the number of workers than the total production (LeqEDL 2 ). Thus we can conclude that in the case of market imperfections in the country of origin A, the global net benefit is equal to the area in triangle EDF plus the area L 1 BFL 2. This example illustrates that the greater the amount of market imperfections - in this case a distortion in the internal market (unemployment in country A), but also international distortion (different wage levels between countries) - the greater the potential benefits of eliminating these distortions through emigration flows. A practical analysis of this theory suggests that emigration flows to Ireland are a benefit in terms of global production, if countries of origin of emigration flows are characterised by high unemployment rates. Regardless of that greater global benefit, it is necessary to note that in Ireland a reduction in output per capita may occur as a result of diminishing marginal productivity of labour and that long term productivity determines largely the wage levels of an economy. 35
36 2.3.2 Model of Immigration Surplus Borjas (1995) developed this model with the objective of analysing, under certain assumptions (competitive market, full employment, free trade and absence of externality), gains and losses accruing to different groups in the population due to an international system of free mobility of workers. He proved using a simple framework how after an immigration flow, natives benefit from immigrants due to the immigration surplus 24. The implications of this model are analogous to the result from international trade theory when a country is suffering from cheap foreign imports. Since the second half of the twentieth century we can speak of the growing globalisation of the world economy. I refer to both the increase of international trade and foreign inversions. In the course of international trade the different agents can take advantage of their differences. Each country should specialise in making the products that they are more qualified for - produce more efficiently, sell these products and import the rest. Classical and neoclassical theories of international trade predict the exchange between countries based on the presence of comparative advantage. These theories are based on the ideas of Adam Smith and David Ricardo 25, probably the two most nominated names during my first year in college. However in the last three decades of this century the reality challenges these predictions as there has been a strong growth in trade of similar products between countries with 24 To clarify, an immigration surplus arises only when the native wage falls as a result of immigration. 25 Adam Smith is among the founding father of our economic philosophy. Smith argued that all nations could gain from the resulting international trade and the total amount of goods in the world is greater after the exchange. He objected any kind of regulation because the invisible hand of the market would guide each market participant to trade in the most mutually beneficial manner. Ricardo became interested in economics apparently by chance, reading the work of Adam Smith. One of his most important contributions were the concept of comparative advantage, Ricardo believed, ensured that international trade would bring benefits for all countries. His theory remains the foundation of the economic case for free trade today. 36
37 similar resource endowments. Even when agents have the same capabilities, they can benefit from specialisation when it is possible to take advantage of economies of scale. Below I examine the similitude between the free mobility of workers into a country and the international trade of a country with cheap imports, an example is the current situation between China and the USA 26. In these situations, governments can protect the domestic countries by placing tariffs on imported goods to make the domestic product more attractive to consumers. Can countries use similar methods to protect themselves against the free mobility of labour? Picking up the thread of the Borjas model: The general equilibrium model of specific factors starts from the premise of the existence of a good and two inputs: one mobile (we assume unskilled labour) and a specific set of factors complementary to unskilled labor (namely: skilled labor and capital, for example - industry). In terms of an aggregate production function with two inputs, capital (K) and labour (L), so that output is Q = f(k,l), this function shows constant returns to scale, and all the output is distributed between workers and owners of capital. The last hypothesis refers to the work force; it is composed of native workers (N) and immigrants workers (M): L = N + M Assume, in principle, that all capital is owned by natives and also ignore skill differentials between immigrants and native workers. Finally assume that all workers are perfect substitutes in production and that the supplies of capital and of both native and foreign labour are perfectly inelastic. The equilibrium in the economy prior to the admission of immigrants is where each factor price equals the respective value of the marginal product. 26 China as a major exporter of cheap goods is making the USA work very hard to increase the demand for their products or even to make their goods more competitive and reduce their trade deficit. 37
38 Therefore the national income accruing to native (Q N ) is the price of capital times the quantity used, plus the price of labour times the number of workers hired or: Q N = r 0 K + w 0 N (Where r 0 is the price of capital and w 0 is the price of labour) Prior to the entry of immigrants the initial equilibrium is at point B, because the supply of capital is inelastic, the area under the marginal product of labour curve shows the economy s total output, so the national income accruing to natives is given by the figure ABON Figure 6: Initial equilibrium in the labour market Wage A Wo B MPL O N Employment (L) When immigrants enter into the country the supply curve shifts to the right (from N to L) and the market wage falls to W 1. The national income is now given by the area ACLO and the increase is attributed to immigrants. In the graph we can see that the increase in national income accreting to natives or the immigration surplus is given by the triangle BCD. As the market wages equals the marginal productivity, immigrants increase national income by more than what it cost to employ them. 38
39 Figure 7: Equilibrium in the labour market after the admission of immigrants Wage A Wo B W1 D C MPL O N L=N+M Employment (L) s = labour share of national income e = elasticity of factor price per labour m= fraction of the workforce It is important to point out that if demand curves of labour were perfectly elastic, so that immigrants had no impact on wages level, immigrants will receive the entire additional product and natives would not gain anything from immigration. Thus, an immigration surplus only arises when the native wage falls as a result of immigration. Although native workers get a lower wage level (W 1 instead of W 0 ), these losses are more than offset by the increase in income accruing to capitalists. So even though the immigration surplus is 39
40 small, immigration has a substantial economic impact, in particular, immigration causes a large redistribution of wealth from labour to capital. In short, a consequence of migration in the country of destination could be the reduction on wages caused by the substitutive native labour, ie, those who require a similar skill or training to the immigrants. This result may occur when we analyse a market with flexible labour, which allows the reduction of wages. In a case where it was not possible to apply downward pressure on wages (wage rigidity), immigration could lead to more unemployment. Some restrictive assumptions are built into the calculation of the immigration surplus. For example the immigration surplus could be even smaller if immigrants bring capital to the country of destination 27. It also assumes that immigrants have an impact on the earnings of native workforce, but many studies have found negative or weak correlation 28 that immigrants do not reduce the wages of native workers. The most restrictive aspect of the model is that it ignores the skill differentials that exist both within and across the native and immigrant population because immigration policy can encourage or prevent the admission of certain classes of workers As the production function has constant returns to scale, in this case the immigrations would have no impact on the national income accruing to natives because immigration would not change the factor prices r and w. 28 The weak correlations bear no relationships to the structural parameter required to estimate the immigration surplus. 29 Net fiscal costs of immigration are larger for unskilled immigrants because they are more likely to use many government services and pay lower taxes. So there are economic reasons to suggest that the immigration surplus might be larger when the immigration flow is composed exclusively of skilled workers. Immigration policy should increase the national income of natives so the government s objective function should be to maximize the immigration surplus. 40
41 2.4 Review of Empirical Results for the Economic Theory of Migration In this section I will review the various empirical analysis completed on this topic. The fear that migrant workers may lower the wages of natives and even take job positions are the main focal points on which the analysis of economics of migration is built Graphical analyses The simplest analysis of the economic impact of immigration, as well as the most intuitive and easy to interpret is, without doubt, the graph. However, simplicity could be offset by the weakness and vagueness of its findings. Coppel, Dumont and Visco (2001) carried out a study for the OECD that provided graphic analysis with figures relating to immigration and unemployment rates for 1998 in OECD countries. A simple observation of the graph is sufficient to note that empirically there barely exists a relationship between the rate of unemployment in a country and the intensity of migration flows to that country. In addition, we find that there are countries with strong immigration flows, and at the same time, a relatively low unemployment rate (this is the case for Australia, Canada or USA), while some countries with less migratory pressures experience higher unemployment (this is the case for Finland, Italy or Spain) 41
42 Figure 8: Immigration and unemployment rates in OECD countries, Unemployment rate Foreign population as a percentage of the total population Source: Coppel, Dumont and Visco (2001), page 15 Zimmermann (1995) also carried out a similar study that mapped the relationship between unemployment rates and the percentage of foreign population proving the lack of statistical relationship between immigration and unemployment Cross-Sectional Spatial Studies The spatial analysis or across-city correlation is to treat each city as a discrete or closed labour market, so they can make comparisons between different areas with different volumes of immigration. The analysis of the local labour market is the basis of the most optimistic studies about the economic impact of immigration. Some representative studies of this type of empirical analysis include 31 Altonji and Card (1991), LaLonde and Topel (1991) and Pischke and Vellinga (1997). 30 France s population data refers to Population data for Canada and Australia refer to The sources used by authors to obtain data that allow graphical analysis are: OECD Analytical Data Base and OECD International Migration 31 See Borjas (2003), page
43 These analyses basically conclude that immigration does not imply significant negative effects on the situation of the native s workers in the labour market. To achieve this result they compare labour markets in different cities with different characteristics of the stock of immigrants. Borjas 32 performed a complete theoretical and empirical analysis to understand the impact of immigration on native employment opportunities. Practically all empirical studies in the literature attempt to replicate this experiment by treating a city or metropolitan area as the empirical counterpart of the closed labor market in the theoretical analysis. Borjas summarises in a table the results of some representatives studies in this area of literature. It shows that the across city correlations applied in the United States indicate that on average the wage of native workers is slightly lower in those labour markets in which immigrants tend to reside. Table 2: Elasticity of native wages with respect to the number of immigrants in locality Source: Borjas (1994), page The description of spatial correlation analysis contained in these pages corresponds to Borjas (1994), pages 1695 and next 43
44 The figure in the last column to the right is the elasticity estimated of indigenous wages with respect to the number of immigrants. If this figure varies between and -0.02, it indicates that if a city has 10% more immigrants than another, the wages of native workers would be 0.2% lower than the other city used in the analysis. The evidence also indicates a numerically weak relationship between native wages and immigration observed across all types of native workers. Another comparative analysis of cities is carried out by Angrist and Kugler (2003). Their model used data for 18 countries within the European Economic Area between 1983 and The flow from former Yugoslavia became an important part of the European migration picture after the conflict in the Balkans in 1990s (Bosnia and Kosovo). Their data suggest that in the period, roughly one-third of male immigrants aged from Non-EU countries were from former Yugoslavia. It could be considered as a source of exogenous variation in labour supply, or in other words, a supply shock. The results of their investigation show that an increase in the immigrant s share of 10% would reduce the native employment rate between 0.2 and 0.7 of a percentage point. The authors argue that this negative impact of immigrants on native employment is stronger for countries characterised by greater rigidity in the labour market such as higher entry barriers and reduced wage flexibility Natural Experiments Different types of empirical tests have led to other studies such as natural experiments 33 and macroeconomic effects of immigration. These analyses use statistical series and data that are more complete and sophisticated. Three of the most famous and influential studies in the literature of immigration where this analysis has been applied are the case of the mariel immigrants, the case of the pied noir of Argelia and the immigration of 33 natural experiments" consists primarily of assessments of the economic impact of immigration when the labour market in a given region receives a sudden large immigration flow. 44
45 retornados from Mozambique and Angola to Portugal. In these cases, the circumstances are caused more by political than economic reasons, but the economic impact on the labour market is similar. Card 34 observed the impact of the massive exodus of Cubans towards Miami in the 1980s. In April of that year, Castro declared Cubans could move freely to the US and in September 1980, approximately 125,000 Cubans arrived in Florida and particularly in the city of Miami. Card compared labour market conditions in Miami with the other American cities, before and after the landing of the marielitos. Miami s labour market increased its workforce by 7% as a result of the arrival of significant numbers of Cubans. However, the empirical analysis shows that there are slightly negative effects of immigration on wages of natives (there was a fall of 1.3 points percent) and unemployment (an increase of 0.3 percentage points). The arrival of repatriates from Argeria to France in 1992 represents a good natural experiment for examining the effects of immigration on the labour market. Hunt (1992) carried out with the analysis of the return to France of the "pieds-noirs 35 " after Algeria became independent. Around 900,000 people of European origin returned to France within the space of a year which led to an increase of 1.6% of the total French labour force. Hunt showed that even with the increase in the labour force, there was only weak evidence that the repatriates exerted downward pressure on wages - the reduction in wages was only 1.3% 34 Card (1990) carried out an analysis by the method of spatial correlations, although there are some factors that provide a different entity from such studies, called natural experiments. He point to the exogenous nature of immigration as enabling a natural experiment in the sense that immigrants were not responding to economic incentives, rather to political circumstances. 35 Pieds-Noirs is a term referring to French citizens of various origins who lived in French Algeria before the independence. 45
46 The third natural experiment, namely, the immigration of retornados refugees from Mozambique and Angola to Portugal in the mid 1970 s was analysed by Carrington and De Lima (1996). About 600,000 refugees arrived in Portugal after it lost its African colonies of Mozambique and Angola in the mid 1970 s. This shift was an increase in the labour force of roughly 10% in just three years. 36 They realised two approaches to note contrasting conclusions 37 : very modest effect of immigration in their international comparison but some large effects in the within-portugal comparison. In general I could deduce that results are not always conclusive in these types of study on immigration impacts Macroeconomics Effects of Immigration These models try to avoid problems like the consideration of a closed labour market. Borjas (2003) introduces a new approach that gives prominence to the importance of providing attention to the characteristics that define a particular group by their education, training and level of work experience. Under this method the labour market is divided into a number of skill cells, as per the terminology used by the author known as a skill group 38, where the cells are defined by groups with similar levels of experience and education. The (i, j, t) cell defines a skill group at a point in time where the group of 36 Portugal s population grew by roughly 5% in both 1974 and 1975, and by another 2% in See Carrington and De Lima (1996), pages 334 & They realised two approaches to contrast conclusions. First, comparison of Portugal with Spain and France; the Spanish comparison was particularly important because Spain experienced political change over this period similar to Portugal, and also because Spain and Portugal started the 1970s in similar economic positions. The comparisons suggest that the retornados caused some short-run unemployment in Portugal, but that this was quantitative swamped by the Europe-wide increase in unemployment that began in the mid 1970s. Second, comparison between districts within Portugal indicates that the retornados may have had a strong adverse effect on Portuguese wages so it could suggest that immigration may be considerably harmful. 38 A skill group must be defined in terms of education and work experience. It is assumed that workers with the same education but different levels of work experience in the labour market will be imperfect substitutes in production. It is most likely that workers with similar education but different work experience are more complementary workers than substitutes. 46
47 workers have educational attainment i, experience level j and are observed in calendar year t. For this analysis Borjas used data drawn from the US Censuses and the Current Population Surveys. The work experience is defined as the number of years that have elapsed since the person completed school. This model of analysis assumes that the labour market implications on the supply shock will depend on how the distribution of work experience in the immigrant population contrasts with natives. The results achieved by the year 2002, show that an increase of 10% supply shock reduces the weekly earnings by about 4%. The effect of immigration has an even stronger effect on annual earnings, so a 10% increase in the supply shock reduces annual earnings by 6.4%. Foreigner workers also reduce the employment opportunities of natives because a 10% supply shock reduces the fraction of time worked by 3.7 percentage points 39. This approach has been applied by Clark and Drinkwater (2008), by Carrasco et al (2008) and Barrett et al (2009). Clark and Drinkwater analysed the recent immigration found in the UK after the EU enlargement. They found a negative relationship between immigrants share and the wages of natives. Pollard et al. (2008), as cited in Clark and Drinkwater (2008) estimate that the number of migrants from accession countries working in the UK had increased from 56,000 in the first quarter of 2004 to 474,000 by the end of The approach of Carrasco et al is based on Spain, one of the European countries together with Ireland, where immigration flows during the last decades have increase noticeably. The period of this analysis is when the number of foreign workers with work permits increased by about 70% 41. They found no significant impact on the employment rates of native workers 39 See Borjas (2003), page See Clark and Drinkwater (2009), page 7 41 See Carrasco et al (2008), page
48 2.4.5 Empirical Evidence for the Irish Case The immigration phenomenon is fairly new to Ireland which means that the data and empirical studies available on the Irish case are very poor both in terms of quantity and quality. Recent publications by Rush M.(2005), Doley N. et al (2006) are concerned with different aspects of labor migration (not wage impacts). The main investigator in this area with a recent work published is Professor Alan Barrett. His studies focus on the characteristics of immigrants, their earnings and the extent to which they have assimilated in the labour market. The immigration experience of Ireland and Sweden has been quite different as a recent study by Doley N. et al (2006), showed that while Sweden only received around 10,000 workers up to the end of 2005, 60,000 workers immigrated to Ireland. These differences can be explained by the more dynamic and flexible Irish labour market. As regards the economic impact of immigration, they suggested that neither Ireland nor Sweden has experienced a rise in unemployment since the enlargement of the EU. In terms of wages, they point out that in fact earning growth decreased in eight out of ten sectors in the postaccession period. In his earliest papers, Barrett (2002) and Barrett (2006) based his approaches on Borjas, Freemand and Katz (1997) and used an econometric model of the Irish labour market to simulate the impacts of immigration, modelling the inflow as an exogenous increase in labour supply. In Barret (2002), he looked at the labour market impacts of all immigration into Ireland in the mid-1990s. In this paper he used the educational levels of immigrants in estimating impacts and so did not attempt to capture the possibility of immigrants being employed in occupations below their educational levels. He shows how immigration between 1996 and 1999 was mainly of high-skilled individuals and according to his simulation the 48
49 wages of high-skilled people fell by 4.5 percent points as a result of immigration over that period. These results contrast with Bojas (1997) when he showed that low-skilled immigration into the EU lowered low-skilled wages and acted to increase earning inequality. Barret (2006) takes a fuller account of the fact that immigrants are often employed in occupations below their given skill levels. He estimates that average wages were over 3 percent lower in Ireland in 2003 as a result of immigration in the previous decade. We can find one of the most original and interesting approaches in Barret and McCarthy (2007), where they analysed the take-up of social welfare benefits 42 and the difference between immigrants and natives. In this paper they also examine the earnings of these immigrants relative to natives. As noted by Borjas (1995), the impact of immigrants on the public finances is a crucial element of their overall economic impact. 43 According to Barret and McCarthy (2007) immigrants with third-level degrees used to earn 17% less than comparable natives; as regards welfare benefits Ireland does not appear to be experiencing any sort of immigrant related drain on public resources. Below I include a table with the distribution of educational attainments of the immigrant population in Ireland. In just a quick look at the table it can be seen that the immigrant population in Ireland have higher educational levels than the native population. 42 For citizens of the EU, there are no restrictions on movement to Ireland and on working here but immigrant groups in Ireland have different welfare entitlements, depending on their length of time here and the duration of work time. Up to May 2004 all EU immigrants had the same entitlement as Irish citizens; however, in May 2001 a two year residency requirement was introduced. For non-eu immigrants on work permits, in case they lose their job, they are not entitled to remain in the country and so would not be eligible for welfare benefits. 43 It is reasonable to think that the net fiscal costs of immigration are larger for unskilled immigrant flows. Less-skilled workers tend to qualify for and participate in more public assistance programs and pay lower taxes. Borjas (1995), page 4 showed that by 1990 the typical immigrant in the US had 11.9 years of schooling as compared to 13.2 years for natives and the welfare participation rate of immigrants was 9.1% (1.7% higher than the participation rate of natives). 49
50 Table 3: Distribution of Educational Attainment for the Native & Immigrant Population 44 Source: Barret (2006), page 7 Over a half of immigrants (54.2%) have achieved third level qualifications compared with just over a quarter (27.3%) of the native population. And while 32.9% of the native population has only lower secondary qualifications or less, only 15.1% of the immigrant population has this low level of education. This can explain that on average immigrants are less likely to be in receipt of welfare payments which differs from the analysis of Borjas in the US where immigrants have been primarily low skilled and their welfare participation was higher than the native population. Barrett et al (2009) measure the impact of immigrants on wages in Ireland. It is probably the most interesting article I have accessed as it focuses on the period after Ireland experienced the economic recession. However this study uses data for the period , clearly before the crisis hit. The approach 46 the authors used was proposed and applied by Borjas (2003). 44 The data shown the distribution of educational attainment for the immigrants who arrived in Ireland in the ten years to During this period, Ireland recorded exceptionally high rates of economic growth. GDP growth averaged 6%, and employment grew from 1.6 million in 1999 to 2.1 million in Immigration was very strong during this period; by 2007 immigrants accounted 10% of Ireland s employees. 46 See Barrett et al (2009), page 2 we break the labour market up into a set of skill cells, where cells are defined by a combination of experience and education or occupation. We then explore whether the wages of natives within those cells are related to the share of immigrants in the cells 50
51 Their immigrant share variable (P ijt ) was derived using immigration data from QNHS for the years 1999 to 2001 and 2004 to 2007 (Quarter 2), also OLS regression analysis was employed. When the cells are based on education their results suggest a negative relationship between native wages and immigrants. But when the cells are based on occupation they found a positive impact of immigration on wages. For their final conclusion Barrett et al suggest that it may be possible to develop a theory that explains these contradictory findings or the results could simply be due to illegitimate correlations at work. The last article I accessed is Barrett and Kelly (2010). It is an attractive approach to review for my dissertation as its conclusions are based on the economic downturn that Ireland is currently suffering. The purpose of this paper is to assess how the economic recession has impacted upon Ireland s immigrants; data from Quarter 1 of the 2008 and 2009 QNHSs was used. The analysis shows that the recession has impacted heavily on Ireland s immigrants. In 2009 the population of non-nationals fell by 8.9 percent yet immigrants still suffered huge losses with an annual rate of job loss close to 20%, compared to 7% for natives. The results point out the economic vulnerability of immigrants and a potential macroeconomic benefit to Ireland in terms of a flexible labour supply adjustment. 51
52 3. RESEARCH METHODOLOGY AND METHODS 52
53 3.1 Introduction This chapter is a presentation of the chosen research methodology and research approach that I have used for my study. I will also emphasize the basic activities that were undertaken, and to indicate their relevance to the analysis. Research is the journey of discovery, a doctrine from the known to unknown. Redman and Mory define research as a systematized effort to gain new knowledge 47.In the Encyclopedia of Social Sciences Slesinger and Stephenson explain the meaning of research in social science as thus Research is the manipulation of things, concepts or symbols for the purpose of generalising to extend, correct or verify knowledge, whether that knowledge aids in construction of theory or in the practice of an art. The mechanisms or physician therefore, is the research worker, only if he attempts to generalise about all automobiles or all patients of a given class. 48 Although there are many approaches to consider when selecting a research methodology, this analysis will follow the approach proposed by Saunders et al. (2009). They describe research as something that people engage in with the objective to discover more information in a systematic way, whose results increase their knowledge. The authors classified research into six stages and branded the model which presented them as the research onion. Saunders et al.(2009) divided the research to include: philosophies; approaches; strategies; choices; time horizons; techniques and procedures - where each different stage of the research process are represented as a layer of research onion. 47 Redman, L.V. and A.V.H. Mory, The Romance of Research, (1923), page Slesinger D. and Stephenson M., Encyclopedia of the Social Science, MacMillan Co (1934), page

54 Figure 9: The Research Onion Source: Mark Saunders, Philip Lewis and Adrian Thornhill 2006 The empirical research used has been guided by a mixed design. Aiming to answer the objectives and research hypotheses of this study involves use of both primary and secondary research. Figure 10: The research onion used in this dissertation Positivism Mixed methods Survey Deductive Data Analysis Cross-sectional Archival research 54
55 3.2 Research Philosophy: As stated by Saunders et al., (2009) this term relates to the development of knowledge and the nature of that knowledge. The research philosophy depends on the way in which data about an investigation should be gathered, analysed and used. The research philosophy that a researcher adopts is going to depend on the way in which they view the world and include considerable assumptions that will underpin their research strategies and the methods chosen as part of that strategy. Depending upon the type of research objective, the research philosophy is selected. The framework of my research philosophy is positivist. Positivism searches truths available for everybody because the events exist out there. The source of data for this research has existed before and will continue to exist; indubitably it can be found by anyone who follows the same procedure. According to the positivist approach it is assumed that a scientific method is the best way of arriving at the evidences of a research. Personal beliefs, feeling, intuitions and emotions do not count as evidence. Saunders et al. (2009) explain that researchers who reflect the principles of positivist prefer working with an observable social reality and that the end product of the research can be generalisations similar to those produced by physical and natural scientists. To generate a research strategy to collect the data, I have used existing academic theory to develop my hypotheses that will be tested and then confirmed or rejected leading to further development of the theory. Secondary data was used to assess the current situation in the labour market and a survey was conducted as primary research to find out more characteristic specifics of the sample group. Both data collections can be easily turned into numbers to perform analysis. 55
56 3.3 Research Approach The election between deductive or inductive research has been discussed by different authors (Cavaye, 1996; Hussey and Hussey, 1997; Perry, 2001). Hussey and Hussey (1997) defined deductive research as a study in which a conceptual and theoretical structure is developed which is then tested by empirical observation; thus particular instances are deducted from general influences. According to Saunders et al. (2009) a deductive approach involves the testing of theory and hypotheses, and then we will need to design a research strategy to test those hypotheses. It is my intention to develop a theory and design a research strategy to test the hypotheses of the analysis. I propose the deductive approach or more exactly the hypotheticodeductive 49 methods. This is made up of the following components: The theory which has the potential to explain things The hypothesis is a statement that if the theory is true, there will be a relationship between at least two variables. Operational definition in order to know what exactly we need to measure Measurement of the observations Testing the conclusions about the hypothesis Verification on implications back to the theory. Gill and Johnson (2002) state that research should use a highly structured methodology to facilitate answering and ensure reliability. As I mentioned above for the design of my analysis the deductive type of approach is adopted, first the research question was formulated and then the appropriate methodology was selected to collect and analyse data. To test the research hypotheses, quantitative and qualitative data have been collected. Another reason for choosing this approach was the large amount of literature available on the topic and because this approach does not require in-depth data and is easier to draw conclusions. 49 Jankowicz, A. D. (2005), Business research projects, page
57 3.4 Research Design The purpose of this section is to indicate the type of study that was undertaken to provide satisfactory answers to the research question. On the process of research design I will peel away the next three layers of the research onion: strategies, choices and time horizons. Robson (2002) explained that these three layers can be considered as the centre of the process of research design, turning the research question into a research project. My choices of collection techniques for the research design of my study are: Research Strategies: Archival research and Survey Research Choices: Mixed methods Time horizons: Cross-sectional Research Strategies I turn now the attention to the research strategies. As stated by Saunders et al (2009) a research strategy is defined as a choice that will guide the researcher to find out answers to the research question(s) and meet the objectives. These strategies are not mutually exclusive and it is possible to use a combination of them. The strategies that I consider for my research are: archival research and a survey. Saunders et al. (2009) indicated that the survey strategy is associated with the deductive approach and frequently used to answer questions like who, what, where, how much and how many. This strategy also facilitates the collecting of quantitative data which can be analysed quantitatively using descriptive and inferential statistics. I use the survey strategy in this dissertation by adopting the questionnaire as the data collection technique to investigate both the work and social life of the immigrants in Ireland. The reason I utilize the survey method is that, it enables the collection of large 57
58 amounts of inexpensive data. These data are standardised which allows easy comparisons and can be used to suggest possible relationships between variables. The term archival has historical connotations in that it can refer as well to historical documents (Bryman 1989). According to Saunders at el.(2009) archival research allows the use of administrative records and documents as the principal source of data. Inevitably the use of data contained in administrative records is secondary data analysis. I use archival research strategy in the dissertation because it allowed me to examine large-scale data over long time periods and identify trends and observations that relate to my objectives. Also this strategy entails the use of secondary data sources where I will be able to use econometric applications 50 to measure the correlation between variables Research Choice Curran and Blackburn (2001) explicate that a single research study may use quantitative and qualitative techniques and procedures in combination with the use of primary and secondary data. Saunders et al., (2007) class mixed method as when the research strategy uses quantitative and qualitative data collection techniques and analysis procedures either at the same time (parallel) or one after the other (sequential). My empirical research has been guided by a mixed design. Following the characteristics of the object of this dissertation, the research comprises of both qualitative and quantitative techniques. I could say that it is a descriptive study but additionally has a correlational component, as it also analyses relationships from the viewpoint of dependency. Also mixed method research permits me to quantify my qualitative data, convert it into numerical codes so that it can be analysed statistically. 50 Archival research use econometrics or mathematics applications to the empirical measurement of relationship postulated by economic theory (Greene 2003, p.1) 58
59 3.4.3 Time Horizons There are two different approaches in terms of time horizon stipulated by Saunders et al. (2009). The longitudinal referred to as a diary perspective time horizon, which requires accumulating data over a long period of time and the cross-sectional also known as snap shot time horizon. A cross-sectional study is appropriate for studies focused on finding out the occurrence of a phenomenon, situation, problem or issue at a certain moment in time by taking a crosssection of the population. The time horizon for the purpose of this dissertation is a cross-sectional study. I aimed at surveying a cross-section of the population to analyse both the work and social life of the immigrants in Ireland and also through the secondary data sources to study the impact of immigration on wages and unemployment at a particular point in time. This technique allows one to focus on certain population groups and understand the wider picture. 3.5 Population and Sample Bryman and Bell (2003) stated that population basically refers to the universe of units from which the sample is to be selected. On the other hand, Saunders et al. (2009), describe population as the full set of cases from which a sample is taken. According to Saunders et al. (2009), it may be possible to collect and analyse data from every possible case or group member; this is termed as Census. The researcher needs to consider whether sampling or census should be used because both methods offer facilitation of data collection. They explain that sampling techniques provide a range of methods that enables a researcher to reduce the amount of data he needs to collect by considering from a sub-group rather than all possible cases or elements. 59
60 For the purpose of my research, for the primary data sample, it was not possible to survey all the immigrants I would have liked, given the deadline and cost associated with it. As a result, it suggested the need for sampling. Many researchers, for example Henry (1990), argue that using sampling makes possible a higher overall accuracy than census research. Probability sampling is the technique adopted for the purpose of this research. As described by Saunders et al. (2009), probability sampling is most commonly associated with survey-based strategies where you need to make inferences from your sample about a population to answer your research question or to meet your objectives. For the research, the population data has been taken from the Quarterly National House Survey (QNHS) for the analysis of the secondary data and a total of 56 immigrants were surveyed for the analysis of the primary data: Secondary data: QNHS provides a quarterly labour force estimate. Information is collected throughout the year with 3,000 households surveyed each week giving a total of 39,000 households each quarter. Primary data: I carried out a survey with 56 immigrants in Ireland. The identifications and interaction with the sample occurred in two ways. Firstly I personally distributed surveys among my friends and acquaintances. This also involved random respondents in the street and in commercial premises. The other route used for contacting with more people from different cultures and countries was through my own friends who maintain relationships with other foreign nationals. The network of friendships enabled a positive climate of trust, prior to the completion of questionnaire. 60
61 3.6 Data Collection The quantitative and qualitative are two used data collection methods in business and management research. Quantitative data can involve all kind of numerical data that can be quantified and verified and is easily manipulated for statistical analysis. As stated by Saunders et at (2009), quantitative analysis techniques such as graphs, charts and statistics allow us to explore and examine relationships and trends within our data. Qualitative data is information that is characterised but does not measure the attributes or properties of the data. Qualitative data describes whereas quantitative data defines. For this research both primary and secondary sources are used to collect information. The combination of both types of data gives a profound understanding of the quantitative data. Information collected through a primary source is collected by using a questionnaire and information collected from secondary data are the publications available from the CSO and other sources Primary Data Source The survey was conducted in February 2012 using a questionnaire as the instrument for data gathering purposes. Many authors (for example, Bell 2005; Oppenheim 2000) argue that it is far harder to produce a good questionnaire. I self- designed a questionnaire with the objective to understand immigrants own personal experiences in Ireland in order to analyse both their work and social life here. The questionnaire was composed of 31 questions and the main objectives are: Identify demographics and socio-cultural aspects of immigrants including level of education 61
62 Investigate reasons for leaving their country of origin and choosing Ireland as a destination Examine work search process in Ireland Questionnaire is a general term to include all techniques of data collection in which each person is asked to respond to the same set of questions in a predetermined order (devaus 2002). The questionnaire is one of the most widely used data collection techniques within the survey strategy because it provides an efficient way of collecting responses from a large sample prior to quantitative analysis. For this study I constructed a questionnaire with both quantitative and qualitative characteristics. The majority of the questions had only set answers 51 this related to mainly demographics, socio-cultural and professional personal questions. For other questions though, various set answers where laid out as a guide to the respondents but an other open ended option was available where a non-scripted response could be provided if desired. These questions provided qualitative data insights as they are non-standardised and have a more complex nature. These specific questions on the questionnaire relate to Immigrant Push and Pull factor that I will analyse later In order to analyse and understand the meaning of this data I quantified this data. I have grouped the answers into categories to create tables where the data is displayed and organised so it can be interpreted in a quantitative way. Finally to draw conclusions quantitative analysis techniques have been applied such as graphs to examine the trends of the data. 51 These are questions where the respondents had to choose an answer from the list or choose on a scale for example very satisfied to very dissatisfied. 62
63 Pilot Test A pilot test was carried out to evaluate the questionnaire with regards to the quality of the questions asked and to determine if the information collected will be sufficient for its intended purpose. It is necessary as an effective feasibility study in that changes can be made or errors identified before resources are expended on the commencement of the main information gathering stage. I compiled the questionnaire based on the specific areas related to my hypothesis and objectives so that I could gather information specifically related that could assist further study of these areas. For the pilot test I initially circulated the questionnaire to a select group of foreign national acquaintances. I updated the questions based on their responses. Changes made were those such as; certain questions were deemed too personal, I updated the set responses based on common responses received from pilot group, and if questions were not easily understood I updated them using more simple language Strengths of Survey: The information provided by the questionnaire is very relevant as the questions and responses have been constructed to provide data directly related to hypothesis 1, 2 and 3. The information provided by the questionnaire is very strong as it was obtained from direct interaction with foreign nationals. The people surveyed were from all enterprise sectors. This provides further validity to the findings of the survey as not all respondents were from one particular industry. A majority favouring one particular area would skew the results and not provide clear ideas on foreign national behaviours certain types of persons work in certain types of industry. 63
64 Weaknesses of Survey: The questionnaire due to its nature was time consuming to collect. Certain respondents have stated that certain questions were too personal. This may reduce the validity of some information provided by the questionnaire as respondents may not give completely correct answers but may temper them to what is socially and peer accepted. Low levels of English among immigrants may lead to poor understanding of the questions Secondary Data The secondary data for this research study was obtained from the Government surveys available in published form through Central Statistics Office (CSO) archives. As defined by Saunders et al (2009) this data is named Survey-based secondary data, it has been collected using a survey strategy usually by questionnaires that have already been analysed for their original purpose. Also the secondary data come from various sources available such as textbooks, articles related to the immigration, newspapers articles and online journals. Saunders et al (2009) exposed that secondary data include both quantitative and qualitative data and this data can be raw or compiled data 52. Secondary data is used most frequently within business and management research and others such as archival and experimental research. 52 The data can be considered raw, where there has been little if any processing, or compiled data that has received some form of selection or summarising. 64
65 For the quantitative analysis of immigration in Ireland through secondary data I have used different sources available from the CSO: The Quarterly National House Survey (QNHS) The Earning and Labour Cost Survey Population and Migration Estimates Census of Population A short description of those sources can be found in the appendix 3 The research is based on both the analysis of unemployment rates for Irish nationalities as affected by Non-Irish Nationalities in employment and the study of the occupational structure and the distribution of immigrants between the different enterprises in the economy. First, I would like to highlight the apparent lack of data on migration in Ireland. Since this is a recently new phenomenon, the statistical information is scarce and the time series offers poor and incomplete data. The most complete and homogeneous data on international migration in the past 10 years is obtained from population census as it is the most important register of population. For the analysis of the data I will use econometric techniques I previously learned during the completion of my degree. The analysis of numeric data is concerned with statistical measures of regression and correlation using E-views The basic aim of the overall analysis is to discover the relationship between variable objects to study and also to measure the strength of the relationship. I developed the models using the econometric technique of Least Squares Regression. 53 E-views is a statistical package of Windows I learnt to use during the subject of Econometrics during the development of my degree. 65
66 Strengths of Secondary Data: The documents required - The Quarterly National House Survey and The Earning and Labour Costs Survey were easily available from the CSO website. Due to the size and scope of the dissertation subject area, collection of primary data would have been improbable. As they are official government publications, the data provided is the most reliable and valid source available. The data and format of the report provided easy analysis and facilitated the creation of tables and graphs Weaknesses of Secondary Data: As mentioned the documents are a statistical account of the total number in employment in Ireland broken down by nationality and job sector. The sector break down changed in 2007 which made analysis across the entire period difficult due to the different sector classifications used in the 2 periods. The CSO reports included information related to immigrants for the first time in the 2005 reports. There are no records related to immigration numbers prior to this time. This may be because the immigrant population in Ireland was only sufficient in size to warrant analysis after the European Union Enlargement in
67 3.7 Conclusions This chapter explains the research process that was chosen as there are different methods of carrying out research. I believe that the chosen method, approach, strategy and philosophy are appropriate and useful to analyse my objectives and draw general conclusions. 67
68 4. DATA ANALYSIS AND FINDINGS 68
69 4.1 Introduction The aim of this chapter is to explain the analysis done on the data obtained from both primary and second research, and present the research findings in relation to each objective and hypotheses. In order to develop the research I applied two different analyses, on the one hand a survey to study demographic and educational characteristics of the immigrants, identify the reasons why they chose Ireland as a destination. On other, an analysis using secondary data from CSO to investigate the impact of immigration on outcomes of currently resident workers in Irish labour markets. Also the role of immigrants in the Irish labour market 4.2 Identify the demographic and educational characteristics of the immigrants in Ireland - Objective 1 I will investigate the demographics characteristics of immigrants focusing mainly on their nationality and educational attainment as set out in the below hypotheses H1: The majority of the immigrants in Ireland come from the enlargement EU 15 to 27 member countries 54. H2: The immigrants in Ireland are highly educated Immigrant Nationality: The below graph details the number of immigrants coming into Ireland over the period broken down by their country of origin. As can be seen from the graph, over the last decade the majority of immigrants have been from the European Union 12 accession countries. This large increase can be attributed 54 EU expanded to 25 members on the 1 May 2004; the 10 accession states who joined the EU were Cyprus, Czech Republic, Estonia, Hungary, Latvia, Lithuania, Malta, Poland, Slovakia and Slovenia. Bulgaria and Romania joined on 1st January In total they form the EU27. 69


70 mainly to the enlargement which occurred in 2004, the year prior to the graph s time period. Figure 11: Immigrants classified by nationality Secondary data CSO The number of immigrants from other non EU 12 countries is constant over the decade period and would be similar to movement experienced by most other developed countries. A similar result was found in my survey where the largest percentage of respondents where from the EU 12 countries. Using this information I can accept H1. Figure 12: Immigrants classified by nationality Primary data Survey 70
71 4.2.2 Immigrant Educational Attainment: As was found in the studies contained within the literature review, many of the foreign nationals coming into Ireland have obtained a high level of education. The first table below is from Barrett (2006) which shows the education attainment level of immigrants who arrived in Ireland for the period Table 4: Distribution of Educational Attainment for the Native & Immigrant Population Source: Barret (2006), page 7 In the survey, I also found that many of the foreign nationals living in Ireland had achieved high education levels. 37.5% of the respondents have a degree and 28.57% have obtained a master degree. Figure 13: Level of Education achieved by Foreign Nationals 1.79% 1.79% 1.79% 10.71% pri mary l evel seconday l evel 28.57% 17.86% di pl oma degree master 37.50% phd other 71

72 For the period over a half of immigrants (54.2%) have achieved third level qualification compared with just over a quarter (27.3%) of the native population. The result of the survey shows that the 85.72% of the respondents have attained third level qualification. Additionally I discovered that a high level of the respondents surveyed had in fact come to Ireland with the primary goal to further their education here and not seek employment as their primary goal. The significant increase in education levels identified could be explained by: 1. With the current economic crisis and job shortage all workers must up skill to find employment even more so if they are immigrants in a foreign country. 2. While prior immigration flows ( ) consisted mainly of workers seeking employment, now a large number of foreign nationals come here to receive further education. Based on the above analysis we can accept H Ireland as an attractive destination - Objective 2 I am now going to investigate the reasons why immigrants leave their country of origin (Push Factors) and decide to come to Ireland (Pull Factors). Figure 14: Push Factors 72

73 Figure 15: Pull factor From the above figures 55, the main push and pull factors that respondents have selected are quite similar and it appears that there are two main groups that come to Ireland: Group 1: The first group are immigrants who are leaving their country due to lack of opportunities / low salaries and coming to a country that is experiencing an economic boom where they hope jobs will be more plentiful and the standard of living will be higher. Group 2: The second group are younger immigrants who want to learn English or take further studies in a foreign country. On the push side it is obvious, concerning group 1, that the main reason immigrants leave their native countries is due to their poor economic state. In the graph, 46.77% of respondents picked economic reasons such as poor opportunities, job prospects and wages. 55 These figures provide qualitative and non-standardised data. So in order to analyse and interpret the meaning of this data in a quantitative way, I have grouped the answers into categories to create tables and figures Explained previously in
74 On the pull side, the same high percentage is evident again as nearly 45.56% selected economic reasons improve lifestyle, greater opportunities, higher salaries and contract of employment as the main pull factors in selecting Ireland as their destination. Regarding the second group, from a foreign perspective Ireland must be viewed to have a high standard of education and learning due to the high number of respondents who come to study English or pursue further studies here. Point of Interest from the Survey that could impact or influence the Pull and Push factors: 55% of the immigrants surveyed found employment in under a month of arriving in Ireland. 85% found employment in less than 6 months. 41% of immigrants found their first job through a friend or acquaintance. This would suggest that personal networks play an important role in the immigration process. Nearly all immigrants surveyed: Were very satisfied with their life here. Had not experienced any racism or abuse. Believe that their wage was the same as their native colleagues. 92% had not received any social welfare. 74

75 Figure 16: Total number of Immigrants in the Enterprise Sectors 75

76 4.4 Immigrant role in Enterprise Sectors - Objective 3 A wide held belief is that the foreign nationals who come into Ireland take the more menial, lower paid jobs that the native workers do not want. This would be believed as the skill requirements in these sectors would be lower, and barriers to entry and securing employment would be less stringent than in high skilled labour sectors. These less skilled sectors may also be more open to the black economy. This objective will be tested using the below hypothesis: H3: The immigrants in Ireland perform the jobs that natives do not find desirable. From the figures below it can be seen that the largest congregation of foreign nationals are in 5 main sectors: - Industry, Construction, Wholesale and retail trade. - Accommodation and Food Services - Financial and other Business Services Figure 17: Percentage of Immigrant vs Percentage of Native Workers

77 Figure 19: Percentage of Immigrant vs Percentage of Native Workers To facilitate ease of analysis I will group sectors 1, 2 and 3 together due to the similarity of their characteristics. Industry / Construction / Wholesale and retail trade: These three sectors would be considered the most labour intensive industries due to the high level of manual labour involved in their production. As the economic boom in Ireland was fuelled mainly by property speculation, there was a huge increase in the numbers of workers needed due to the vast level of construction that was undertaken. The large congregation of foreign nationals within these industries would support the proposed hypothesis, in that the flow of foreign nationals would be towards the more manual, menial roles where employment could be achieved more easily. These would also be areas that the now more affluence native workers would not find desirable as a result of the new wealth and status brought about by the Celtic Tiger. 77
78 While the native percentage within these sectors (13% to 14%) is lower in comparison to the foreign national percentage (15% to 17%), it is still quite high relative to the native worker levels within the other different sectors. This could be due to the economic boom in this area which would have driven up wage levels within the construction and industry sectors 56. So while in general these sectors may be less desirable in comparison to others, the increase in wages would have made these more desirable to native workers. The large drop in the number of foreign nationals in the construction sector in the period was indicative of the decline in the industry as a whole a similar drop can be seen in the level of native workers. Accommodation and Food Services: The hypothesis is most validated by this industry. In the figures 15 and 16, there are a large percentage of foreign workers (15%) operating within this industry while the respective native percentage (5%) is quite small. Included in this group would be jobs in restaurants, cleaning, retail etc and similarly to the construction / industry sector above, the barriers to entry would be minimal (in regards to job experience, education, permits etc). The large gap in the percentages working in this sector demonstrates that foreign nationals may indeed have been working jobs and roles that the native population no longer wanted. 56 From 2003 to 2006, average wage levels in construction increased by 10.1% - National Employment Survey From 1996 to 2003, the average annual increase was just over 10% - National Employment Survey
79 Financial and other Business Services: There are a high percentage of foreign nationals working within the Financial Services sector. The percentage level of 14% for the period is maintained for the following period when we add the three newly classified financial sectors (Financial Insurance and real estate activities, Professional, scientific and technical activities and Administrative and support services activities). As was previously stated many of the foreign nationals that come to Ireland are highly qualified. As such many would have the necessary skill attributes to find employment in the financial services sector which would be a highly desirable sector in which to work. Also as Ireland is trying to invest and develop more highly skilled, knowledge based industries such as the Irish Financial Services Centre in Dublin, job creation within this sector would be high. Since the percentage of both natives and foreign nationals is relatively high, it could be concluded that foreign nationals are not working roles in this area that natives would not take. Health: The Health sector also holds a large percentage of foreign national workers. I excluded this sector from my analysis as the roles within this area are highly skilled positions and would be fulfilled by foreign nationals where there is a short fall in supply of skilled individuals among the native population. 79
80 4.5 Immigrant Impact on Native Employment and Wage Levels I will analyse the secondary data using econometric techniques. The analysis of numeric data is concerned with statistical measures of regression and correlation using E-views The basic aim of the overall analysis is to discover the relationship between variables (regression) and also to measure the strength of the relationship (correlation). I estimate the models using the econometric technique of Least Squares Regression. The secondary data was obtained from the Government surveys available in published form through CSO archives. I have developed models and trends analysis based on the data. The below hypotheses will be analysed in this part: H4: Increased employment among foreign nationals results in increased unemployment among native workers. In this case the effect of immigration on economic outcomes is being identified from quarter-by-quarter cross sectional correlation between the rates of unemployed Irish persons in the Irish labour force and the amount of Non-Irish nationalities in employment. I use regression to obtain the equation which describes the relationship between these two variables with the objective to analyse if the unemployment for the Irish workers increase as more immigrants enter employment. I also calculate the correlation coefficient to analyse the strength between those variables, and scatter diagrams to illustrate this performance. 57 E-views is a statistical package of Windows I learnt to use as part of the Econometrics element of my degree. 80
. The table details the wage level for each cross referenced component.")
81 H5: Higher levels of foreign national workers within a sector depress the overall wage level within that sector In this case the database is broken down by quarter time periods in the year and then by enterprise and nationality (Irish and Non-Irish). The table details the wage level for each cross referenced component. I then use regression to obtain the equation which best describes the relationship between three variables (wages, Irish worker and Non-Irish workers); my objective is to analyse if wages in each particular sector could be influenced by the number of Non-Irish workers in that sector. Also I will calculate the correlation coefficient to measure the strength of the relationship between each independent variable and wage level in that sector and use scatter diagrams to illustrate the performance Employment Unemployment in Ireland is affecting a significant portion of the labour force. From the below graph it can be seen that the unemployment level experienced a huge rise starting February 2008 after remaining fairly constant from 2002 until this time. The spike increase in unemployment leveled off in February 2010 and the rate is now remaining at around 14%. Figure 19: Seasonally adjusted standardised unemployment rate (%) by state and month ( ) 81
82 I am going to analyse the contribution and role that foreign nationals have played in this large unemployment increase and determine if their presence here is leading to increased unemployment among native workers. To determine if there is a positive correlation between the number of Non-Irish nationalities in employment and the number of Irish nationalities in unemployment I will use simple linear regression model 58. In my approach I will use just two variables 59 so the model can be expressed as follow: Y i = β 0 + β 1 X 1 + ε i The following table provides the numerical data of my analysis: labour force classified by nationality. As the basic aim of the overall analysis is to discover the extent to which employed Non-Irish workers are connected to the unemployed Irish workers I do not consider for the analysis the other two variables (Employed Irish and Unemployed Non Irish) I am going to estimate the trend model for UNI over the period Q Q The dependent variable is the Unemployed Irish nationals (UIN) and the independent variable is Non-Irish Nationals in employment (ENI). The regression line of the model is: UNI = ENI + ε i 58 For a simple linear regression model we make the following assumption: Independence, Normality, Homoscedasticity & Linearity 59 where: -Y is the dependent variable and X is the explanatory or independent variable -β0 & β1 are unknown parameters that measure the influence of explanatory variables on the dependent variable -and the error term which is included to capture sources of error that are not captured by other variables. 82
83 Table 5: Estimated number of person aged 15 years and over classified by nationality and economic labour force status 83
84 Below we can see the estimation results in an equation window: To test the significance of this parameter ENI in the model we have to observe the level of significance associated with the rejection of the null hypothesis 60 (Ho: β 1 = 0). At level of significance α = 0.05, we do not reject the null hypothesis based on the t-statistic of with a p-value > 0.05 = α. and I can affirm that the ENI is a non-significant variable. The p-value for ENI (0.4724) indicates that only assuming a significance level of 48% (and hence a 52% confidence level) we could confirm this parameter as significant different to zero. To represent the percentage of UNI s movement that can be explained by movements of ENI we observe the value of R 2 = %. This value is really low, just 0.24% of the variance of UNI is explained by ENI, the rest must be included in the residual 60 In the equation window, E-Views offers this information in the last column (Prob) or also commonly known as p-value. Additionally this program uses the t-distribution to assess the significance of individual regression coefficients. For this analysis the two-tailed critical t-value is to estimate the parameter ENI we have n-k-1 degrees of freedom available (E-Views works with asymptotics samples that converge to a normal distribution). We could also have used n-1 degrees of freedom as this is a small sample - the result would be the same in this case. 84
85 variance 61.The main reason for this low value is because the model is misspecified. This means that other important variables have been omitted as it is not correct to say that the percentage of unemployment for the Irish nationalities is caused only by the existence of foreign nationals in the labour market. Also the unemployment rate depends on other variables such as jobs creation, labour force participation rate, demand of labour, qualification and skills of workers. In the scatter diagram below the number of Non-Irish workers (the explanatory variable) are represented on the x-axis and the number of unemployed Irish workers (the dependent variable) on the y-axis. It is observable that the data points are clustered in two different groups; quickly we notice in the table that there was a data change in the second and third quarter in 2008: -Until 2008 both variables: the unemployment rates for Irish nationalities and the percentage of Non-Irish nationalities in employment increase progressively. It could lead us to believe that there is a positive relationship in the fact that the increase of the foreign 61 The standard error of the regression (marked "S.E. of regression") is an estimate of the square root of the residual variance. 85
86 workers in employment increases the unemployment rate for national workers. The statistical analysis differs of this thought though, because if instead of analysing all the data globally (as I showed above beside the scatter the correlation coefficient is ), we only analyse the data from 2005Q4-2008Q1 we obtain a positive correlation coefficient of , as this value is almost zero, I can confirm that there is not a relationship at all between the two variable ENI & UIN. -From the second and third quarter in 2008 the data s movement changed completely. We could assume this coincides with the period that the crisis hit Ireland hardest. The unemployment for the Irish nationals starts to increase quickly and the group of the non- Irish nationals in employment start to decrease as well. If we analyse the data separately, in this case it will be just for the period 2008Q2-2011Q3, the correlation coefficient is This value means ENI & UIN have a very strong negative relationship almost perfect (this happens when the value is exactly -1). The data shows that as the value of the Non-Irish nationalities in employment decreases the value of the Irish nationalities unemployed increases so I can affirm that the high unemployment rates that national workers suffer is not due to the presence of foreign nationals in the Irish labour market. As expected, the relationship UNI = ENI will not be met exactly and there is an error. After of analyzing the residuals 62 I have detected a problem of autocorrelation which could be correct with the inclusion of more relevant variables in the model. 62 Residuals are by definition the difference between the true values of the variable Y t and the estimated values for Y t for all t. ϵ t = Y t Ŷ t (where ϵ t is the estimated value of ε t for all t) A residual analysis allows checking of the assumptions of the model to see if they are met. It can detect: 1. If effectively there is a lineal relationship between X & Y 2. If errors are normally distributed 3. If the variance is constant (homoscedasticity) 4. If the errors are independents 86
87 UIN Residuals UIN Residuals Plotting the errors of Ŷ t against the value of ϵ t we detect a growing trend of the residuals, and through the histogram we can detect that errors are not normally distributed. As the Durbin Watson statistic is close to zero ( ) we can confirm that there is an almost perfect positive autocorrelation. It is easy to spot the existence of a systematic behavior of the residuals with respect to the quarters - it is seen as the residuals have a growing trend that has not been captured in the estimation. 87
88 4.5.2 Wages Finally I will analyse if there is any evidence to confirm that immigrants depress wages in the different enterprise sectors. H6: Higher levels of foreign national workers within a sector depress the overall wages level within that sector. The studied period is between 2009Q1-2011Q2 and the analysis includes the below sectors: -Industry -Construction -Wholesale and Retail -Accommodation and food service -Transport and storage -Information and communication -Financial Insurance and real estate activities -Professional, scientific and technical activities -Administrative and support services activities -Public and administration and defence -Education -Health -Other Services In my approach I will use three variables so the model can be expressed as follow: Y i = β 0 + β 1 X 1 + β 2 X 2 + ε i I am going to estimate the trend model for AWE over the period 2009Q1 2011Q2 by Least Square regression 63. The dependent variable is the Average Weekly Earnings for 63 As I did previously when analysing unemployment, to estimate the results on wages I will use Least Square regression by E-Views. In this case the two-tailed critical t-value is (n-k-1 degrees of freedom 88
89 each enterprise sector (AWE) the independent variables are the number of workers both Irish & Non-Irish in each particular sector (IRISH & NONIRISH). In order to analyse the economic impact that the number of workers in each enterprise sector exerts on wages levels the equation of the model has been defined as follow: AWE = β 0 + β 1 IRISH + β 2 NONIRISH + ε i To test the significance of the parameter NONIRISH in the model we observe the level of significance associated with the rejection of the null hypothesis (Ho: β 2 = 0) AWE is measured in Euros per week and IRISH & NONIRISH in number of workers of these different nationalities. The parameters β 1 and β 2 denote the variations in the earnings per week per each additional worker (both types of workers) in that particular enterprise sector when all other factors remain fixed. Among these factors are labour experience, level of education, innate skills, seniority and labour ethic among others. To measure the relationship between the variables I will use scatter diagrams. I built two scatter diagrams for each enterprise to represent the strength of the relationship between the number of Non-Irish and Irish workers (on the y-axis) and the level of average weekly earnings in each sector (on the x-axis). These diagrams have had regression lines superimposed. The sectors where the variable NONIRISH has been identified as significant on the level of wages are: Accommodation and food service Public administration and defence Education Health available). We could also use n-1 degrees of freedom as this is a small sample (the critical t-value would be which in any case would not change the results and conclusions taken). 89
90 A. Accommodation and food service The estimation results from the regression model for this enterprise are in the equation window below: Dependent Variable: AWE Method: Least Squares Date: 03/07/12 Time: 00:15 Sample: 2009Q1 2011Q2 Included observations: 10 Variable Coefficient Std. Error t-statistic Prob. C IRISH NONIRISH R-squared Mean dependent var Adjusted R-squared S.D. dependent var S.E. of regression Akaike info criterion Sum squared resid Schwarz criterion Log likelihood Hannan-Quinn criter F-statistic Durbin-Watson stat Prob(F-statistic) For this enterprise sector the equation to be estimated is: AWE = *IRISH *NONIRISH At a significance level of α = 0.05 we reject the null hypothesis based on the t-statistic of 3.30 with a p-value < 0.05 = α. The variable NONIRISH is significant in the model and has a positive effect on AWE. The coefficient for NONIRISH is 1.61, so for every new Non-Irish worker in the accommodation and food service enterprise, we expect an approximate increase of EUR1.60 in the average earnings per week, ceteris paribus. Also in this case, there is an acceptable R 2 = 0.61, and it may be concluded that the model is an admissible fit (explain more than 50%) for estimating the growth of the observed scores of earnings per week. This number indicates that 61% of the total variation of average earnings per week can be explained by the number of workers (both Irish and Non-Irish) in this particular enterprise. 90
91 Now we examine the strength of the relationship between the number of Non-Irish and Irish workers and the level of average weekly earnings in the accommodation and food service enterprise. After the analysis I can conclude that there is no evidence to affirm that the number of Non-Irish workers in the accommodation and food service enterprise have a negative impact on the level of average weekly earnings. Both regression and correlation techniques actually show that increases in the number of foreign nationals have a positive effect on the level of wages in this enterprise. 91
92 B. Public administration and defence The estimation results from the regression model for this enterprise are in the equation window below: Dependent Variable: AWE Method: Least Squares Date: 03/10/12 Time: 13:54 Sample: 2009Q1 2011Q2 Included observations: 10 Variable Coefficient Std. Error t-statistic Prob. C IRISH NONIRISH R-squared Mean dependent var Adjusted R-squared S.D. dependent var S.E. of regression Akaike info criterion Sum squared resid Schwarz criterion Log likelihood Hannan-Quinn criter F-statistic Durbin-Watson stat Prob(F-statistic) For this enterprise sector the equation to be estimated is: AWE = *IRISH *NONIRISH At a level of significance of α = 0.05 we reject the null hypothesis based on the t-statistic of with a p-value < 0.05 = α. The variable NONIRISH is significant in the model and has a positive effect on AWE. The coefficient for NONIRISH is 53.08, so for every new Non-Irish worker in the public administration and defence sector, we expect an approximate increase of EUR53.08 in the average earnings per week, ceteris paribus. There is an adequate R 2 = 0.64, and it may be concluded that the model is a satisfactory fit (explains more than 50%) for estimating the growth of the observed scores of the average weekly earnings. This number denotes that approximately 64% of the total variation of the average earnings per week can be explained by the number of workers (both Irish and Non-Irish) in this particular enterprise. 92
93 Below we find the scatter diagrams to find out the strength of the relationship between the variables. Both regression and correlation techniques show that an increase in the number of foreign nationals has a positive effect on the level of wages in this sector. Also in the scatter diagram, the data is very consistent, giving a very good fit to the regression line and thus a high degree of correlation between Non-Irish workers and the average of weekly earnings. 93
94 C. Education The estimation results from the regression model for this enterprise are in the equation window below: Dependent Variable: AWE Method: Least Squares Date: 03/10/12 Time: 14:02 Sample: 2009Q1 2011Q2 Included observations: 10 Variable Coefficient Std. Error t-statistic Prob. C IRISH NONIRISH R-squared Mean dependent var Adjusted R-squared S.D. dependent var S.E. of regression Akaike info criterion Sum squared resid Schwarz criterion Log likelihood Hannan-Quinn criter F-statistic Durbin-Watson stat Prob(F-statistic) For this enterprise sector the equation to be estimated is: AWE = *IRISH *NONIRISH At a level of significance of α = 0.05 we reject the null hypothesis based on the t-statistic of 2.97 with a p-value < 0.05 = α. The variable NONIRISH is significant in the model and has a positive effect on AWE. The coefficient for NONIRISH is 20.45, so for every new Non-Irish worker in the education sector, we expect an increase of EUR20.45 in the average earnings per week, ceteris paribus. The analysis of this enterprise is very attractive even though the number of foreign nationals in this sector is not especially high. The variable IRISH is also significant in the model (Ho: β 1 = 0 - level of significance of α = t-statistic of with p-value 0.013<0.05 = α) but it has a negative effect on AWE. For every new Irish worker in the 94
95 education sector, there is a decrease of EUR8.3 in the average weekly earnings, ceteris paribus. There is an acceptable R 2 = 0.68, and it may be concluded that the model is a satisfactory fit (explain more than 50%) for estimating the growth of the observed scores of the average weekly earnings. This number expresses that 68% of the total variation of the average earning per week can be explained by the number of workers (both Irish and Non-Irish) in this particular enterprise. The relationship between workers and the level of average weekly earnings in this sector is illustrated in scatter diagrams below: 95
96 Regression and correlation indicate that an increase in the number of foreign nationals has a positive effect on the level of wages in this sector while the complete opposite effect occurs with national workers. The data show that as the number of Irish workers decreases in this sector the level of the average weekly earnings increase. D. Health The estimation results of the regression model for this enterprise are in the equation window below: Dependent Variable: AWE Method: Least Squares Date: 03/10/12 Time: 14:10 Sample: 2009Q1 2011Q2 Included observations: 10 Variable Coefficient Std. Error t-statistic Prob. C IRISH NONIRISH R-squared Mean dependent var Adjusted R-squared S.D. dependent var S.E. of regression Akaike info criterion Sum squared resid Schwarz criterion Log likelihood Hannan-Quinn criter F-statistic Durbin-Watson stat Prob(F-statistic) For this enterprise sector the equation to be estimated is: AWE = *IRISH *NONIRISH At significance level of α = 0.05 we reject the null hypothesis based on the t-statistic of 3.44 with a p-value < 0.05 = α. The variable NONIRISH is significant in the model and has a positive effect on AWE. The coefficient for NONIRISH is 14.60, so for every new Non-Irish worker in the public administration and defence sector, we expect an approximate increase of EUR14.60 in the average earnings per week, ceteris paribus.
97 There is an adequate R 2 = 0.66, and it may be concluded that the model is a satisfactory fit (explains more than 50%) for estimating the growth of the observed scores of the average weekly earnings. This number denotes that approximately 66% of the total variation in the average earnings per week can be explained by the number of workers (both Irish and Non-Irish) in this particular sector. Below we find the scatter diagrams that illustrate the strength of the relationship between the variables. The data demonstrates that there is no evidence to affirm that the number of Non-Irish workers in the health enterprise sector have a negative impact on the level of average weekly earnings. Both statistical measures of regression and correlation indicate that an increase in the number of foreign nationals has a positive effect on the level of wages in this sector. 97
98 E. Other Sectors Quickly I will analyse the rest of the enterprise sectors: -Industry -Construction -Wholesale and Retail -Transport and storage -Information and communication -Financial Insurance and real estate activities -Professional, scientific and technical activities -Administrative and support services activities -Other Services There is no evidence to affirm that the variable NONIRISH is significant in any of these sectors. Full details of the equation windows and scatter diagrams can be found in the appendix 4. The p-value for these sectors are higher (it is not necessary in this case to mention the values of t-statistic) than the level of significance α = 0.05 (particularly high in Construction 0.73 and Other Services 0.88) so we do not reject the null hypothesis and I can affirm that NONIRISH is not a significant variable in any of the sectors. To double prove the affirmation above we observe the value of R 2. In all these sectors the value of R 2 is lower than 0.5 (really low for Wholesale and Retail R 2 = %). In any enterprise sector the variance of AWE can be explained by NONIRISH in any admissible form. These models are misspecified and more important variables have been omitted to determine the level of wages in these sectors. 98
99 5. CONCLUSIONS & RECOMMENDATIONS 99
100 The analysis presented in this paper sets out to: Examine the demographic and educational characteristics of immigrants in Ireland. Identify the reasons why they chose Ireland as a destination and investigate their role in the Irish labour market. Determine their impact on the employment and wages of the native Irish workers As confirmed by both the secondary data collected from the CSO and the findings from the survey, the majority of immigrants have come from the EU 12 accession countries. Further evidence of the EU 12 majority is the recent news that Polish has overtaken Irish as the country s second most spoken language. For the EU 12 immigrants, it was quite fortunate that the EU enlargement in 2004 and the Irish Celtic Tiger coincided in their timing. The research also found that the majority of immigrants are highly educated with almost 40% and 30% having reached degree and master level respectively. These results reproduce Barrett (2006) findings for the period The findings above and the push / pull factors below demonstrate that Ireland has been considered a very attractive destination for immigrants over the last 15 years and mainly since the enlargement of the EU in May From the survey it appears that immigrants travelled to Ireland for mainly economic reasons such as push factors: poor opportunities, low job prospects and wages, and pull factors: to improve their lifestyle, greater opportunities or higher salaries. An example of the differences in standard of living is that in Ireland in 2009 the income per capita was $38,800 while in Poland it was just $18,000. Based on this figures it is easier to understand why polish nationals have become the largest non-irish group living in Ireland; the percentage of Polish nationals has increased by 93.7% between 2006 and
101 Additionally I found that there is a large group of younger immigrants who come to Ireland whose main objective is to learn English or take further studies in a foreign country and not find employment. I would recommend that more is done to attract and support this group as they support the educational industry and local economies in Ireland but do not place more pressure on the country through the taking of jobs or social welfare. I also wanted to substantiate the wide held belief that foreign nationals in Ireland take the jobs that native workers do not desire. The data found large congregations of foreign nationals in: Industry, Construction, Wholesale and retail trade, Accommodation and Food Services, Financial and other Business Services, and Health. Based on the ratios of foreign nationals to native workers, and the characteristics of the sectors in questions I concluded that: Construction and Financial Services sector should be excluded from this possibility. The high wages in these areas fueled by the economic boom would have made positions very desirable to the native population. In Financial Services and Health the ratio of both sets is again equally high as these would be very desirable for both groups. Due to the high job creation and highly skilled roles in both these sectors, foreign nationals would be needed to fill roles where there was a shortfall in skilled labour among the natives. In these sectors foreign nationals may not be taking jobs from natives; it could be that natives are just not sufficiently qualified for the positions. 64 The Irish Time, Ireland more diverse, Friday 30 March Independent, British overtaken as Polish population doubles, Friday 30 March
102 The largest divergence between the percentages of foreign nationals and natives working was found in the Accommodation and Food Services sector. This divergence of over 10% would suggest that foreign nationals may have taken roles that the native workers found undesirable. This sector also had the lowest wage levels so the new affluence created by the Celtic Tiger may have created a view that the jobs in these sectors were beneath the native workers. The econometric analysis of employment evidences no clear link between the current large unemployment levels among native workers and the level of employed foreign nationals in the labour market over the period Q Q Employment and unemployment rates for foreign nationals and natives move in line, both experience increases and decreases at the same points. Even though immigration has decreased considerably since the crisis began, Barret and Kelly (2010) detail how the recession has impacted harder on Ireland s immigrants than natives in regards to annual job loss rates. I also found a very bad fit in the relationship between the unemployed native workers and the number of foreign nationals in employment. While this relationship may be credible, I suggest additional analysis is needed in this area that takes account of further variables (job creation, labour force participation rates, demand of labour, and qualification of skills of workers) to validate these findings. Variables that I believe may have a stronger influence on the level of unemployment. On the other hand, the econometric investigation to measure the impact of immigration on wages over the period Q Q found conflicting effects by sector. Negative impacts were found in nine enterprise sectors (Industry, Construction, Wholesale and Retail, Transport and storage, Information and communication, Financial Insurance and real estate activities, Administrative and support services activities, Health, Other Services). Positive immigration impacts on wages were found in four enterprise sectors (Accommodation and food service, Public administration and defense, Education and Health) which give the impression that the presence of foreign nationals in these sectors may cause wages to increase. 102
103 This has re-produced the findings of Barrett et al (2009) who found positive impacts when he used occupation as a basis for the skill cell. I would like to clarify that for my analysis I used a simple regression model with one variable, time (t), while Barrett followed the approach of Borjas (2003) which was more complicated and broke down the labour market into a set of skill cells dependent of three variables (education, occupation and time). This approach is based on data for the period prior to the crisis. A point to note is that positive effects were found in public and administration and defense, and in accommodation and food services, which had the lowest and highest percentages of foreign nationals respectively for the same period. However, it should be remembered that the method used analyses each sector independently so different results are probable. While these results are possible, I think a more comprehensive study that incorporates all the various work factors omitted in this approach (labour experience, level of education, innate skills and seniority) and not just immigrant numbers in each enterprise sector, is needed to confirm the validity of these findings. Although I have found no significant evidence that foreign nationals have negative impacts on native workers, I think that stronger controls must be introduced with regard to immigrants as Ireland is now in a recession. Countries that once welcomed foreign workers have already taken a much firmer stance with immigrants who do not add or contribute beneficially to the country and Ireland should adopt such a policy. Ireland announced stricter rules for work permit applications in response to growing unemployment in June 2010 for Non-EU immigrants 65 such as: - Higher charges on permit renewals and stricter conditions on applications by spouses of permit holders - No work permits will be issued for jobs that pay under 30,000 a year 65 The Irish Time, Tougher criteria for work permits, Wednesday 04 Apr Independent, Non-EU workers face tough rules in permit clampdown, Thursday 16 April html 103
104 - Employers will have to prove they have made all possible efforts to fill any vacancies with workers already in Ireland before they can offer the role to workers from outside the country. New policies have not been introduced for EU immigrants but given the stress on the social welfare system in Ireland and high unemployment levels, Ireland could follow the example of France, Spain and UK with their pay-to- go programmes and other initiatives. 104
105 6. SELF REFLECTION ON OWN LEARNING AND PERFORMANCE 105
106 6.1 Introduction: The purpose of this chapter is to explain my reflections on how the completion of the MSc programme has contributed to my own personal development. This section also provides an assessment of the knowledge and experiences acquired and how such learning has helped me to develop and improve certain skills that will benefit my performance in future employments. 6.2 Personality Types Carl G. Jung (1921) created eight distinct personality types. These orientations are the pairing of two attitudes: introversion and extroversion, and four functions - feeling, thinking, sensation and intuition - when combined with one of his two attitudes, formed the eight different personality types. Jung believed that we all use these four functions in our lives, but that each individual uses the different functions with a varying amount of success and frequency. Applying Jung s ideas Katharine Cook Briggs and her daughter, Isabel Briggs Myers developed in the 1940s the Myers-Briggs Type Indicator (MBTI) self-report questionnaire to make Jung s theory of psychological types understandable and useful in everyday life. I completed the questionnaire by listing my preferences and according to the Indicator, my MBTI results shows that my personality is ESTJ. However I believe that my best fit is ESFJ: Extraverted Feeling with Introverted Sensing. The main characteristics of such a personality are: -Warm and helpful -Decisive, thorough and consistent -Personable and cooperative -Practical and realistic 106
107 6.3 Learning Style Learning and theories that deal with the acquisition of knowledge have developed greatly during the last century due mainly to the advances in psychology and instructional theories. The following are among the most widespread: Behaviorism (this is one of the most famous, formulated by Skinner), Information Processing Theory, Constructivist Theory (J. Bruner), Cognitive (the cognitivist revolution replaced behaviorism in 1960s, one of the mayor contributors was Gagne), Experiential Learning Theory (Kolb1984). Understanding learning styles provide a link to improving educational achievement. Sadler- Smith (1996) defines learning styles as an information-processing activity and learning preferences as the individual choice of one particular mode of learning over the other. Although there are a number of different construct labeled as learning styles, learningcentered approaches such as those described by Kolb (1984), are more relevant to the student population. According to Kold (1984) Learning is the process whereby knowledge is created through the transformation of experience. Knowledge results from the combination of grasping and transforming experience. The Kolb learning style describes an experiential circle of learning with four dimensions consisting of concrete experience, reflective observation, abstract conceptualization and active experimentation. For these stages, four learning types have been identified: accommodator, diverger, assimilator and converger. Kolb and Fry (1975) argue that the learning cycle can begin at any one of the four points - and that it should really be approached as a continuous spiral. However, the cycle suggests that concrete experiences create an environment for reflecting and observing where the experiences are considered. This may then be followed by the development of ideas, theories or questions about the process of abstracting. The final stage is that of active experimentation, or application through actions. 107
108 Figure 20: Kolb s learning styles Honey and Mumford developed their learning styles system as a variation of Kolb s (1984) model. Their descriptions of the stages in the learning cycle are activist, reflector, theorist, and pragmatist. There is a strong similarity between the Honey and Mumford stages and the corresponding Kolb s learning styles. Activist (Accommodator): such people act first and consider the consequences later. They are focused on the present and are very attracted to new challenges. Reflector (Diverger): such people watch and listen before offering an opinion. Seeks data and considers thoroughly before taking a decision. Postpones conclusions until the end. Theorist (Assimilator): such people seek perfection and in their approach to problems use the vertical step by step approach. They dislike fickleness. 108
109 Pragmatist (Converger): such people act quickly and confidently to implement ideas. They see problems as opportunities and display good practical problem-solving and decision-making skills. Through the use of the Honey and Mumford learning style assessment, I discovered that I have a Reflector learning style. Reflectors are able to look at things from different perspectives, but do not deliver their conclusions until the data has been collected and reviewed. Using these learning styles I noticed that I learn by observing, thinking about what is happening, while viewing situations from different perspectives. I find it more difficult to learn when I am worried by time pressures or need to move quickly from one activity to another. I found my best research process was to investigate carefully, have a plan in mind, think about what I was learning and then make detailed analysis. When I wanted to rush on any task or make quick conclusions due to other commitments, I could not force the process as the results were below my expected standard. I had to always stand back and analyse all the details cautiously and in depth. 6.4 Master Experience: Without any question, enrolling on the MSc in International Banking and Finance programme is the biggest challenge I have ever faced. When I finished my degree I was unsure of what to do next. The economic crisis had begun to take hold in Spain and jobs were becoming scarce, I did not have much professional experience and I really wanted a change. After considering various options I decided to continue studying and make my way into the labour market once I was in a more competitive position. I decided to come to Ireland to learn English and undertake a Masters. Definitely it has been the best decision I have ever made in my life. Now that I am finishing my MSc programme I can say that it has been a wonderful experience, in terms of both knowledge and personal development, even the experiences shared with my colleagues in the school. 109
110 The course demands a lot from oneself, and it has been very difficult to combine with work, especially in the most consuming final stage - the completion of the dissertation. It has been a work of great personal commitment, but ultimately I see all the effort rewarded. The MSc programme has empowered me with new skills and knowledge that otherwise would have been very difficult to obtain, and which I will utilize and apply in my future career, both academic and occupationally. It has provided me with an even stronger base and grounding in Business and Finance, wherein lies my future career path. 6.5 Development of Skills: - Research skills: This was a complete new skill for me as my graduate course did not require extensive research work. I noticed significant improvement in my research skills since starting the MSc programme. The different modules assessments required some level of review of academic literature. While initially I found analysis techniques difficult and intimidating, now I feel confident using information, applying solutions to the research objectives and effectively interpreting results. I learned patience and how to identify quickly the key information within a document and also how to conduct information searches and locate published papers within information databases and the internet. - Written & Communication Skills: I have achieved significant improvements in this area since commencing the MSc programme. I was less than a year in Ireland when I decided to enroll in the MSc programme and had been studying English for the same length of time. It was a huge undertaking but I am most proud of the advances made in this skill. Completion of the various written assignments has taught me effective writing skills in both my module assignments but also for s to colleagues and lecturers. This has also provided immense benefits to my work as I have to deal with clients and other dependents by both phone and . I have greatly improved my interpersonal skills and communication within the group setting but also in the various presentations we had to complete as part of the different modules. 110
111 -Time management Skill: I have demonstrated improvements in my time management skills as I had to learn how to combine the programme with a full time job and work to meet the deadlines of all the compulsory set times for the submission of modules assessments. In the initial stages of the dissertation I devoted too much time to reading and reviewing documents due to the vast amount of literature on the subject. Also initial investigative approaches adopted had to be modified after I discovered that certain key secondary data required was not available from the CSO archives. In these instances I had to reassess the strategy taken and development a new approach which incorporated the collection of primary data through the developed questionnaire. Due to the size and level of time involved, I created a project plan which was useful to track my objective completion and move the dissertation forward. -Team working skills: From my assessments during the programme, I have learned how to operate within a team and also how to develop and maintain good relationships with colleagues. I am now able to better identify individual characteristics, understand others views, to recognize the strengths of other team members and work effectively to achieve mutual goals. 6.6 Conclusion In conclusion I believe the MSc programme has helped me to extensively develop and acquire new skills, and gain learning and knowledge that I will be able to use in the future. I feel I can handle difficulties in research, and operate in an independent and self-directed manner to accomplish my goals. Also I think I have evolved as a more mature and integral person both academically and personally. I really think that this journey has been very positive and it will make a change in my professional career, either in Ireland or if I return to Spain. I cannot say that completion of this MSc is the finale of my education, but it is the most significant step. It has improved me as an individual and my job prospects which in today s current job market are essential. 111
112 7. BIBLIOGRAPHY 112
113 Agung, G. N. (2011): Time Series Data Analysis Using Eviews, Statistic in Practice, Wiley Altonji, J.G. and Card, D. (1991): The Effects of Immigration on the Labor Market Outcomes of Less-skilled Natives, in Immigration, Trade and Labor, edited by J.M. Abowd and R. B. Freeman, University of Chicago Press. Angrist, J. D. and Kugler, A. D.(2003): Protective or Counter-Productive? Labor Market Institutions and the Effect of Immigration on EU Natives, The Economic Journal, vol. 114, pp Barrett, A., J. Fitz Gerald and B. Nolan, (2002): Earning Inequality, Returns to Education and Immigration into Ireland, Labour Economics, Vol. 9, No. 5. Barrett, A., A. Bergin and D. Duffy, (2006): The Labour Market Characteristics and Labour Market Impacts of Immigrants in Ireland, The Economic and Social Review, Vol. 37, No. 1. Barrett, A. and Y. McCarthy (2007), Immigrants in a Booming Economy: Analysing their Earnings and Welfare Dependence, Labour: Review of Labour Economics and Industrial Relations Vol. 21 No. 4-5, Barrett, A., (2009): Enlargement and Ireland s Labour Market EU, IZA Discussion Papers 4260, Institute for the Study of Labor (IZA) Barrett, A. and Kelly, E. (2010): The Impact of Ireland s Recession on the Labour Market Outcomes of its Immigrants, IZA Discussion Papers 5218, Institute for the Study of Labor (IZA) Bodvarsson B. O. and Van Den Berg H. (2009): The Economics of Immigration: Theory and Policy, Springer Borjas, G.J: (1994): The Economics of Immigration, Journal of Economic Literature, vol. XXXII, pp Borjas, G.J. (1995): The Economic Benefits from Immigration, Journal of Economic Perspectives, vol. 9, nº 2, pp Borjas, G.J. (1999): The economic analysis of immigration, in O. Ashenfelter and D. Card (eds.), Handbook of Labour Economics, vol. 3A. North Holland. Borjas, G.J (2001): Does Immigration Grease the Wheels of the Labor Market?. Brookings Papers on Economic Activity, 32, , pp Borjas, G.J. (2003): The Labor Demand Curve is Downward Sloping: Reexamining the Impact of Immigration on the Labor Market, The Quarterly Journal of Economics, vol 118, no. 4, pp Borjas, G. (2006): The Impact of Immigration on the Labour Market, Harvard University, Prepared for the Conference on Labor and Capital Flows in Europe Following Enlargement 113
114 Borjas, G. (2009): The Analytics of the Wage Effect of Immigration. Working Papers No Bryman, A. (1989) Reseach Methods and Organisation Studies. London: Unwing Hyman Buyer s Remorse on Immigration Continues (2009), Migration Information Source, Available from: Central Statistics Office: Census 2006 Non-Irish Nationals Living in Ireland, Dublin: Central Statistics Office, Available from: Central Statistics Office: Preliminaries Results Census 2011, Dublin: Central Statistics Office, Available from: Central Statistics Office: Quarterly National Household Survey Quarters , Dublin: Central Statistics Office, Available from: Central Statistics Office: Earnings and Labour Cost, Quarters Dublin: Central Statistics Office, Available from: Central Statistics Office: Population and Migration Estimates, Quarters Dublin: Central Statistics Office, Available from: Card, D. (1990): The Impact of the Mariel Boatlift on the Miami Labor Market, Industrial and Labor Relations Review, vol. XLIII, pp Card, D. (2001): Immigrant Inflows, Native Outflows, and the Local Market Impacts of Higher Immigration, Journal of Labor Economics, Vol. 19, No. 1. (Jan., 2001), pp Card, D. (2005): Is new Immigration Really so Bad? Economic journal 115 (4): F300-F323 Carrasco, R., Jimeno, F. and Ortega, A.C. (2008): The Effects of Immigration on the Labor Market Performance of Native-born workers: Some Evidence for Spain Journal of Population Economics Vol 21 pp Carrasco, Raquel; Jimeno, Juan F.; Ortega, A. Carolina. Journal of Population Economics, Jul2008, Vol. 21 Issue 3, p Cavaye, A. (1996). "Case study research: a multi-faceted approach for IS", Information Systems Journal, Vol. 6 No.2, pp Carrington, W. and DeLima, P. (1996): The Impact of 1970s Repatriates from Africa on the Portuguese Labor Market, Industrial and Labor Relations Review, no 49, pp Clark, K. and S. Drinkwater (2008), The Labour Market Impact of Recent Immigration on Ethnic groups in the UK, paper presented at a workshop on Labor Market Impacts of Immigration Who Are the Winners and Who Stand to Lose? at the Institute for Social Research, Oslo 114
115 Coppel, J., J. Dumont and I. Visco (2001), Trends inimmigration and Economic Consequences, OECD Economics Department Working Papers, No. 284 Curran, J. and Blackburn, R.A. (2001), Researching the Small Enterprise. London: Sage Dolado, Juan J. & Duce, Rosa & Jimeno, Juan Francisco, (1996): The Effects of Migration on the Relative Demand of Skilled versus Unskilled Labour: Evidence from Spain, CEPR Discussion Papers 1476, C.E.P.R. Discussion Papers Doyle, N., Hughes G. and Wadensjö E. (2006): Freedom of Movement for Workers from Central and Eastern Europe: Experiences in Ireland and Sweden, Stockholm : Swedish Institute for European Policy Studies Dr. Kothari C. R. (2004): Research Methodology: Methods and Techniques (2 nd Edition), New Age International (P) Ltd, Publishers Dr. Rajendra K. Sharma.(1997): Sociological Methods and Techniques, Atlantic Publishers & Distributors Drew, C. (2007): EU Enlargement in 2007: No Warm Welcome for Labour Migrants, Migration Information Source, Available from: EU Disunion: Immigration in an Enlarged Europe (2005), Migration Information Source, Available from: Francis, M. (2004): Business and Mathematics and Statistics, (6 th Edition), Thomson, Chapters 12, 13 and 14 Friedberg, R.M. and Hunt, J. (1995): The Impact of Immigration on Host Country wages, Employment and Growth, Journal of Economic Perspectives 9, pp Greene, W. H. (2003): Econometric analysis, Hillsdale, NJ:Pearson Education Gill J., and Johnson P., (2002): Research Methods For Managers, 3rd ed., Sage Publications Ltd. Honey, P., and Mumford, A. (1992), The Manual of Learning Styles, 1st Edition, Peter Honey. Hunt, J. (1992): The impact of the 1962 repatriates from Algeria on the French Labor Market, Industrial and Labor Relations Review, vol. 45, nº 3, pp Hussey, J. & Hussey, R. (1997): Business Research, Palgrave, Basingstoke. Iglicka, K. (2010): EU Membership Highlights Poland s Migration Challenges, Migration Information Source, Available from: Jankowicz, A. D. (2005): Business research projects, Ed 4 th, Thomson Learning 115
116 Johnson, G. (1980): "The labor market effects of immigration," Industrial and Labor Relations Review, ILR Review, ILR School, Cornell University, vol. 33(3), pages , April. Jung C. G.(1921): Psychological Types Katseli T. L. (2004): Immigrants and EU Labour Market, Migration Information Source, Available from: Kolb, D. (1984), Experiential Learning: experience as the source of learning and development, USA, Hemel Hempstead: Prentice Hall International Kolb. D. A. and Fry, R. (1975) 'Toward an applied theory of experiential learning;, in C. Cooper (ed.) Theories of Group Process, London: John Wiley. Krugman, P.R.;Obstfeld, M. (2003):International Economics: Theory and Policy (6 th Edition), Chapter 7. Pearson Education Lalonde, R. J. and Topel, R. H. (1991): Labor Market Adjustments to Increased Immigration, in Immigration, Trade,and Labor, ed. J. Abowd and R. Freeman, Chicago: University of Chicago Press Myers-Briggs I. (2000), Introduction to PYPE (6 th Edition), European English Edition National Employment Survey 2006, Dublin: Central Statistics Office, Available from: Perry, C. & Cavaye, A. (2001). How to Identify an Appropriate Method for My Thesis, Southern Cross DBA Workshop, October 2001, Coolangatta, Queensland. Pischeke, J.-S and Vellinng, J (1997): Employment Effects of Immigration to Germany: An Analysis Based on Local Labor Markets, Review of Economics and Statistics, vol. LXXIX, pp Piore, M. (1979): Birds of Passage: Migrant Labor and Industrial Societies.New Cambridge University Press, New York Quarterly National Household Survey Unemployment Monitor (2010), Ireland after Nama, Available from: Ravenstein E. G. (1985): The Laws of Migration, Journal of the Statistical Society of London, Vol. 48, nº 2, pp Ravenstein, E. G. (1889): The Laws of Migration, Journal of the Royal Statistical Society, vol. 52, nº 2, pp Redman, L. V.and Mory, A. V. H. (1923), The Romance of Research Refugees and Asylum, Move to Ireland!, Available from: 116
117 Robson, C. (2002): Real Word Research (2 nd edn), Oxford:Blackwell Ruhs, M. (2009) Ireland: From Rapid Immigration to Recession, Migration Information Source, Available from: Ruhs, Martin (2005) Managing the Immigration and Employment of Non-EU Nationals in Ireland, Dublin: The Policy Institute, Trinity College Sadler-Smith, E. and Evans C. (2006), Learning Styles in Education and Training, Guest Editorial, pp 114 Saunders, M., Lewis, P. and Thornhill, A. (2009), Research Methods for business students, Pearson Education Limited Severance, K. (2010): France s Expulsion of Roma Migrants: A Test Case for Europe, Migration Information Source, Available from: Slesinger D. and Stephenson M. (1934): Encyclopedia of the Social Science, MacMillan Co The Economist (2002): The longest journey. A survey of migration, (The Economist, November 2, 2002, UK) The Recession s Impact on Immigration (2009), Migration Information Source, Available from: Solimano A. (2010): International Migration in the Age of Crisis and Globalization, Cambridge University Press Zimmermann, K.(1995): Tackling the European migration problem, Journal of Economic Perspectives, vol. 9, nº 2, pp Zimmermann, K.(1994) Some General Lessons for Europe's Migration Problem. In Economic Aspects of International Migration. 1st ed., ed. H. Giersch, Berlin: Springer-Verlag
118 APPENDICES 118
119 APPENDIX 1: Survey Analysis of Immigration in Ireland: DUBLIN BUSINES SCHOOL - MASTER DISSERTATION - Luz Maria Rodriguez Esteban The below is a survey for a dissertation, the objective of which is to study both the work and the social life of immigrants here in Ireland. Please read each question and tick the box (boxes) that is most relevant to you. Thank you for your time. PERSONAL INFORMATION: 1. Gender: Male Female 2. Nationality: 3. What area are you from? Capital of the country Main city Town/Village Country 4. Age: Civil Status: Single Married Divorced Widower Other: 6. Level of education achieved: I cannot read or write Primary level Secondary level Diploma certificate Degree Master level PhD Other: 7. Is your education recognised in Ireland? Yes No N/A 8. Do you need a VISA to work in Ireland? Yes No N/A MIGRATORY INFORMATION: 9. How long have you lived in Ireland? Less than 1 year 1-3 years 3-5 years 5-9 years More than 10 years 10. Before coming to Ireland, had you travelled to other countries with the intention of working? Yes No 11. Why did you leave your country? Low salaries Political or religious reasons Other: Lack of opportunities No employment 119
120 12. Why did you come to Ireland? To improve my lifestyle Social networks (family, friends already here) Study Higher salaries Greater employment opportunities Contract of employment Adventure Proximity to country of origin Other: LABOUR INFORMATION: 13. Were you in employment when you decided to come to Ireland? Yes No 14. Are you currently working in Ireland? Yes No (If you have never worked in Ireland, please go to question 26) 15. When you arrived in Ireland, how long were you looking before you found a job? I got the contract in my country of origin Less than 1 month Less than 6 months Less than 1 year More than 1 year 16. What was your first job in Ireland? 17. How did you find your first job? Agency Through a friend or relative Newspaper Internet Other: 18. How many times have you changed your job in Ireland? None More than What is your current job in Ireland? (job/title/employer) 20. How long are you working in your current job? Less than 6 months Between 7-12 months From 1-2 years More than 2 years 21. How did you find your current job? Agency Through a friend or relative Newspaper Internet Other: 22. Are the nationalities of your co-workers mainly foreign nationals or Irish? Majority foreign nationalities Majority Irish Mixed 23. When you first started your current job, were your co-workers mainly foreign nationals or Irish? Majority foreign nationalities Majority Irish Mixed 24. In your experience, do you think your wage is the same as your Irish co-workers? Lower Higher The same 120
121 25. Are you satisfied with your wage? Very satisfied Satisfied Neither satisfied nor dissatisfied Dissatisfied Very dissatisfied No comment 26. What level was your English when you first arrive in Ireland? None Beginner Intermediate Advance English is my language 27. Do you think your level of English was a barrier to your social integration? Yes No 28. In your experience, have you ever felt discriminated against in either your work or personal life in Ireland? Yes, a lot Yes, a little No No comment QUALITY OF LIVING INFORMATION 29. If at any time you have been unemployed in Ireland, have you ever received any type of social welfare benefits? Yes-all the time Part of the time Not at all 30. In general how would you describe your life here in Ireland? Very happy Happy Unhappy Very unhappy 31. How long do you think you will stay in Ireland? 1year 1-2 years 2-3 years 3-4 years More than 5 years 121
122 APPENDIX 2: Survey main results PERSONAL INFORMATION: 1. Gender: Male 62.50% Female 37.50% 2. Nationality: EU % Rest of the world 30.36% Rest of EU15 25% UK 8.93% USA 1.79% 3. What area are you from? Capital of the country 12.50% Main city 39.29% Town/Village 44.64% Country 3.57% 4. Age: % % % % Level of education achieved: I cannot read or write Primary level 1.79% Secondary level 10.71% Diploma certificate 17.86% Degree 37.50% Master level 28.57% PhD 1.79% Other: 1.79% MIGRATORY INFORMATION: 6. How long have you lived in Ireland? Less than 1 year 10.71% 1-3 years 10.71% 3-5 years 25.00% 5-9 years 46.43% More than 10 years 7.14% 7. Before coming to Ireland, had you travelled to other countries with the intention of working? Yes 30.36% No 69.64% 8. Why did you leave your country? Low salaries 16.13% Lack of opportunities 22.58% Political or religious reasons 1.61% No employment 8.06% Other: Other - Travel 11.29% 122
123 Other - Not Specified 9.68% Other - Higher Studies 12.90% Other - Social / Family Networks 3.23% Other - Study English 14.52% 9. Why did you come to Ireland? To improve my lifestyle 15.56% Social networks (family, friends already here) 11.11% Study 25.56% Higher salaries 10.00% Greater employment opportunities 15.56% Contract of employment 4.44% Adventure 15.56% Proximity to country of origin 2.22% Other: LABOUR INFORMATION: 10. Were you in employment when you decided to come to Ireland? Yes 48.15% No 51.85% 11. Are you currently working in Ireland? Yes 87.5% No 12.5% 12. When you arrived in Ireland, how long were you looking before you found a job? I got the contract in my country of origin 11.76% Less than 1 month 54.90% Less than 6 months 29.41% Less than 1 year More than 1 year 3.92% 13. How did you find your first job? Agency 31.37% Through a friend or relative 41.18% Newspaper 3.92% Internet 9.80% Other: Other - Drop CV into Shop 9.80% Other - Not Specified 1.96% Other - Contract while on holidays 1.96% 14. How many times have you changed your job in Ireland? None 19.61% % % More than % 15. How long are you working in your current job? Less than 6 months 16% Between 7-12 months 6% From 1-2 years 14% More than 2 years 64% 123
124 16. How did you find your current job? Agency 20.00% Through a friend or relative 26.67% Newspaper 2.22% Internet 35.56% Other: Other - Drop CV into Shop 8.89% Other - Not Specified 4.44% Other - College Internship 2.22% 17. Are the nationalities of your co-workers mainly foreign nationals or Irish? Majority foreign nationalities 29.17% Majority Irish 43.75% Mixed 27.08% 18. When you first started your current job, were your co-workers mainly foreign nationals or Irish? Majority foreign nationalities 25.00% Majority Irish 47.92% Mixed 27.08% 19. In your experience, do you think your wage is the same as your Irish co-workers? Lower 13.04% Higher The same 86.96% 20. Are you satisfied with your wage? Very satisfied 4.26% Satisfied 36.17% Dissatisfied 23.40% Neither satisfied nor dissatisfied 23.40% Very dissatisfied 4.26% No comment 8.51% 21. What level was your English when you first arrive in Ireland? None % Beginner 18.52% Intermediate 25.93% Advance 27.78% English is my language 14.81% 22. Do you think your level of English was a barrier to your social integration? Yes 26.42% No 73.58% 23. In your experience, have you ever felt discriminated against in either your work or personal life in Ireland? Yes, a lot 1.85% Yes, a little 27.78% No 64.81% No comment 5.56% QUALITY OF LIVING INFORMATION 24. If at any time you have been unemployed in Ireland, have you ever received any type of social welfare benefits? Yes-all the time 5.88% Part of the time 1.96% Not at all 92.16% 124
125 25. In general how would you describe your life here in Ireland? Very happy 43.40% Happy 50.94% Unhappy 5.66% Very unhappy 26. How long do you think you will stay in Ireland? 1year 20.75% 1-2 years 7.55% 2-3 years 13.21% 3-4 years 13.21% More than 5 years 45.28% 125
126 APPENDIX 3: Description of secondary data sources from the CSO The Quarterly National Hose Survey (QNHS) is a continuous household survey, conducted by the Central Statistics Office (CSO). The QNHS has been in operation since September 1997 (replacing the old Labour Force Survey) and therefore provides a useful means of illustrating and monitoring the labour markets trends over time.the bulk of the data available through the survey is only available at a national level, however the survey does provide a breakdown of ILO Economic Status (In employment, Unemployed, In Labour Force, Unemployment Rate and Participation Rate). The unemployment rate here is calculated using the number of unemployed as a percentage of the total labour force and is based on the ILO (International Labour Office) labour force classification. This means that it s also possible to put the Irish unemployment figures (national and regional) in context with international figures. The QNHS began to include information for non-irish nationalities in the last quarter of The Earning and Labour Costs Survey is a quarterly survey conducted by the Central Statistic Office (CSO) providing data for weekly earnings and more details on components of earnings and labour costs.the survey results relate to enterprises broken up as follows: B E (Industry), F(Construction), G (Wholesale & retail trade: repair of motor vehicles & motorcycles), H (Transportation & storage), I (Accommodation & food services activities), J (Information & communication), K-L (Financial, insurance & real estate activities), M (Professional, scientific & technical activities), N (Administrative & support services activities), O (Public administration & defense), P (Education), Q (Human health & social work activities) and R-S (Arts, &entertainment, recreation & other service activities) with 3 or more employees. Population and Migration Estimates is a source conducted by the Central Statistics Office (CSO) for estimation of the gross annual migration flows which
127 also provides the basis for the classification of the flows by sex, age group, origin/destination and nationality. The migration estimates are compiled against the backdrop of movements in other migration indicators such as the number of Personal Public Service (PPS) numbers allocated to non-irish nationals, the number of work permits issued/renewed and the number of asylum applications. The population for 2006 classified by age, sex and region is taken from the Census of Population 2006, which was held in April that year. The reference period for the population estimates for subsequent years is mid-april each year. The population estimates are subject to revision once the definitive results of the next census become available. The Census of Population data sets is a questionnaire survey of the Irish population held every 5 years. The aim of the Census is to obtain a picture of the socio-economic state of the country. Its contains information on total population, gender, age, marital status, country of birth, economic activity, employment status and various household characteristics. As the last census available is for 2006, I will just use it to get a general vision of the data or as a starting point for my analysis. Also some preliminaries results from Census
128 APPENDIX 4: Enterprise Sector with no significant variable (NONIRISH) Equation Windows and Scatter diagrams INDUSTRY Dependent Variable: AWE Method: Least Squares Date: 03/05/12 Time: 22:07 Sample: 2009Q1 2011Q2 Included observations: 10 Variable Coefficient Std. Error t-statistic Prob. C IRISH NONIRISH R-squared Mean dependent var Adjusted R-squared S.D. dependent var S.E. of regression Akaike info criterion Sum squared resid Schwarz criterion Log likelihood Hannan-Quinn criter F-statistic Durbin-Watson stat Prob(F-statistic)
129 Construction Dependent Variable: AWE Method: Least Squares Date: 03/06/12 Time: 23:48 Sample: 2009Q1 2011Q2 Included observations: 10 Variable Coefficient Std. Error t-statistic Prob. C IRISH NONIRISH R-squared Mean dependent var Adjusted R-squared S.D. dependent var S.E. of regression Akaike info criterion Sum squared resid Schwarz criterion Log likelihood Hannan-Quinn criter F-statistic Durbin-Watson stat Prob(F-statistic)
130 Wholesale and Retail Dependent Variable: AWE Method: Least Squares Date: 03/06/12 Time: 23:57 Sample: 2009Q1 2011Q2 Included observations: 10 Variable Coefficient Std. Error t-statistic Prob. C IRISH NONIRISH R-squared Mean dependent var Adjusted R-squared S.D. dependent var S.E. of regression Akaike info criterion Sum squared resid Schwarz criterion Log likelihood Hannan-Quinn criter F-statistic Durbin-Watson stat Prob(F-statistic)
131 Transport & storage Dependent Variable: AWE Method: Least Squares Date: 03/07/12 Time: 00:22 Sample: 2009Q1 2011Q2 Included observations: 10 Variable Coefficient Std. Error t-statistic Prob. C IRISH NONIRISH R-squared Mean dependent var Adjusted R-squared S.D. dependent var S.E. of regression Akaike info criterion Sum squared resid Schwarz criterion Log likelihood Hannan-Quinn criter F-statistic Durbin-Watson stat Prob(F-statistic)
132 Information & communication Dependent Variable: AWE Method: Least Squares Date: 03/07/12 Time: 22:29 Sample: 2009Q1 2011Q2 Included observations: 10 Variable Coefficient Std. Error t-statistic Prob. C IRISH NONIRISH R-squared Mean dependent var Adjusted R-squared S.D. dependent var S.E. of regression Akaike info criterion Sum squared resid Schwarz criterion Log likelihood Hannan-Quinn criter F-statistic Durbin-Watson stat Prob(F-statistic)
133 Financial Insurance and real estate activities Dependent Variable: AWE Method: Least Squares Date: 03/07/12 Time: 22:57 Sample: 2009Q1 2011Q2 Included observations: 10 Variable Coefficient Std. Error t-statistic Prob. C IRISH NONIRISH R-squared Mean dependent var Adjusted R-squared S.D. dependent var S.E. of regression Akaike info criterion Sum squared resid Schwarz criterion Log likelihood Hannan-Quinn criter F-statistic Durbin-Watson stat Prob(F-statistic)
134 Professional, scientific and technical activities Dependent Variable: AWE Method: Least Squares Date: 03/07/12 Time: 23:07 Sample: 2009Q1 2011Q2 Included observations: 10 Variable Coefficient Std. Error t-statistic Prob. C IRISH NONIRISH R-squared Mean dependent var Adjusted R-squared S.D. dependent var S.E. of regression Akaike info criterion Sum squared resid Schwarz criterion Log likelihood Hannan-Quinn criter F-statistic Durbin-Watson stat Prob(F-statistic)
135 Administrative and support services activities Dependent Variable: AWE Method: Least Squares Date: 03/10/12 Time: 13:46 Sample: 2009Q1 2011Q2 Included observations: 10 Variable Coefficient Std. Error t-statistic Prob. C IRISH NONIRISH R-squared Mean dependent var Adjusted R-squared S.D. dependent var S.E. of regression Akaike info criterion Sum squared resid Schwarz criterion Log likelihood Hannan-Quinn criter F-statistic Durbin-Watson stat Prob(F-statistic)
136 Other Services Dependent Variable: AWE Method: Least Squares Date: 03/10/12 Time: 14:30 Sample: 2009Q1 2011Q2 Included observations: 10 Variable Coefficient Std. Error t-statistic Prob. C IRISH NONIRISH R-squared Mean dependent var Adjusted R-squared S.D. dependent var S.E. of regression Akaike info criterion Sum squared resid Schwarz criterion Log likelihood Hannan-Quinn criter F-statistic Durbin-Watson stat Prob(F-statistic)
137 APPENDIX 5: Effect on the welfare of the residents in the country of destination We assume that migrants do not receive land. Country B Wb W* MPL L1 Leq L Before migration flow: - Total production: Labour income: Rents of land owners: 1 After migration flow: - Total production: Labour income of residents (not immigrants): 3 - Rents of land owners: Rents of immigrants: 5 137


138 APPENDIX 6: Tables Tables: No of workers (in 000) per sector broken down by nationality and average weekly per sector over the period Q Q
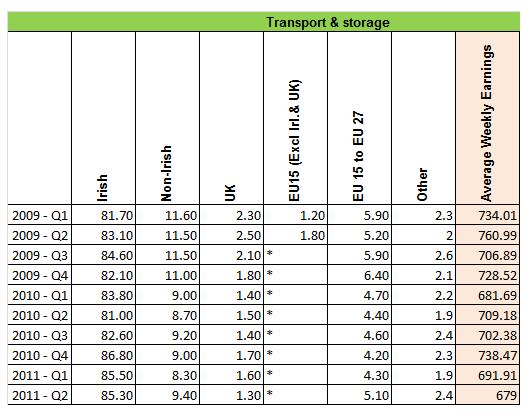
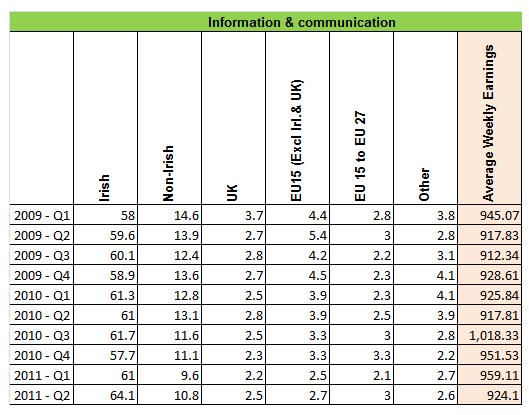
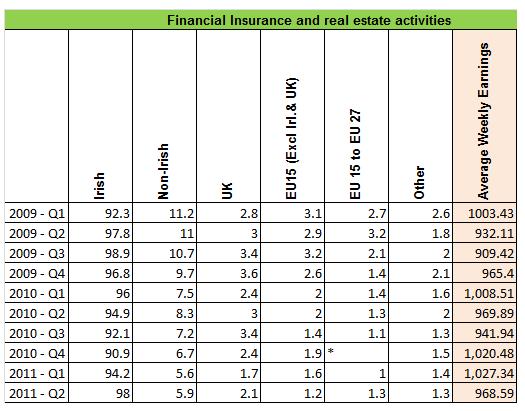
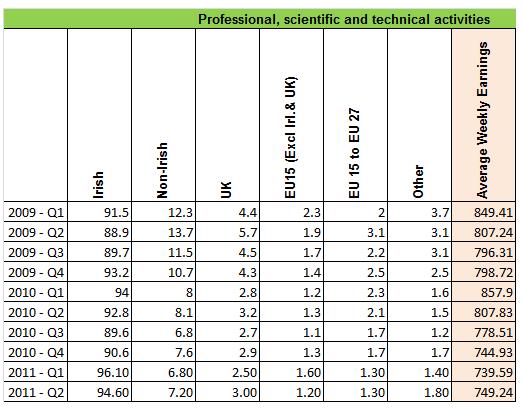
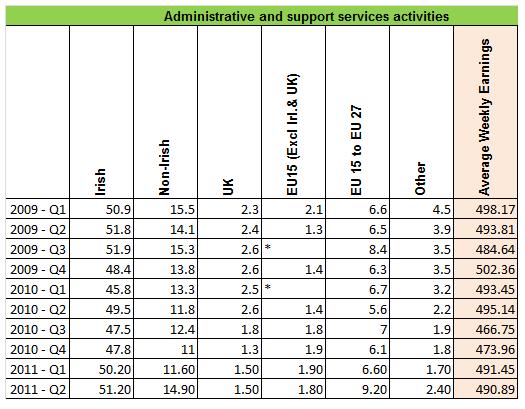
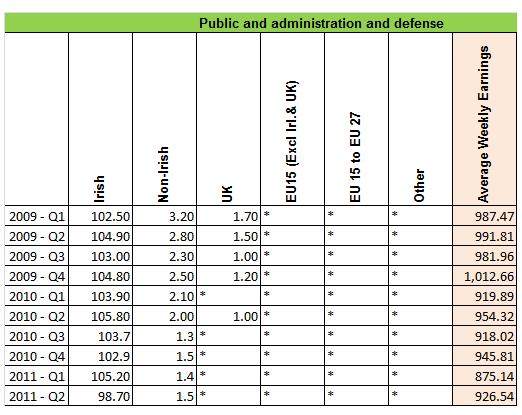
139 139
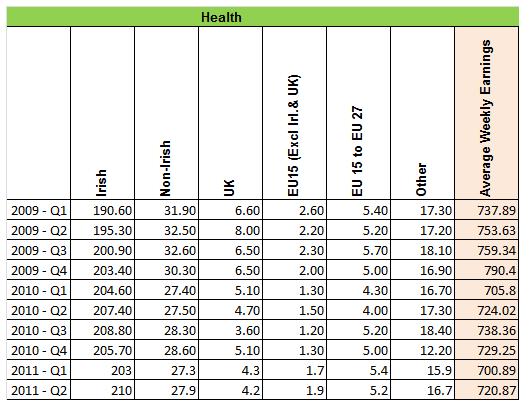
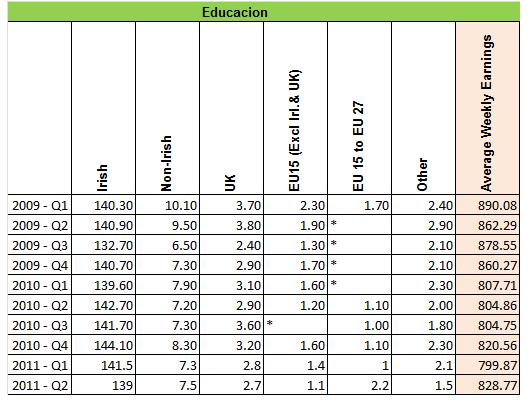
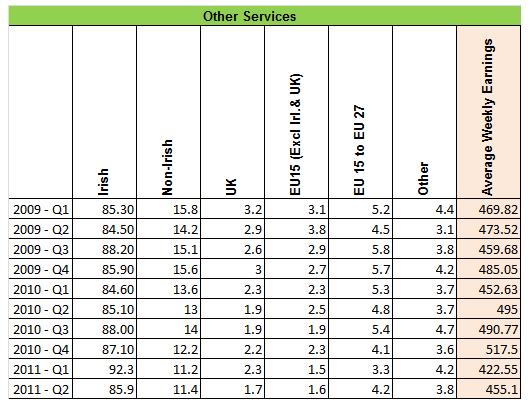
140 140

141 Tables: Average Number ( 000) and Average Percentage of Irish and Non-Irish workers per sector over the periods and
European Integration Consortium. IAB, CMR, frdb, GEP, WIFO, wiiw. Labour mobility within the EU in the context of enlargement and the functioning
 European Integration Consortium IAB, CMR, frdb, GEP, WIFO, wiiw Labour mobility within the EU in the context of enlargement and the functioning of the transitional arrangements VC/2007/0293 Deliverable
Standard Note: SN/SG/6077 Last updated: 25 April 2014 Author: Oliver Hawkins Section Social and General Statistics
 Migration Statistics Standard Note: SN/SG/6077 Last updated: 25 April 2014 Author: Oliver Hawkins Section Social and General Statistics The number of people migrating to the UK has been greater than the
Chapter 4 Specific Factors and Income Distribution
 Chapter 4 Specific Factors and Income Distribution Chapter Organization Introduction The Specific Factors Model International Trade in the Specific Factors Model Income Distribution and the Gains from
European Integration Consortium. IAB, CMR, frdb, GEP, WIFO, wiiw. Labour mobility within the EU in the context of enlargement and the functioning
 European Integration Consortium IAB, CMR, frdb, GEP, WIFO, wiiw Labour mobility within the EU in the context of enlargement and the functioning of the transitional arrangements VC/2007/0293 Deliverable
Notes on exam in International Economics, 16 January, Answer the following five questions in a short and concise fashion: (5 points each)
") Question 1. (25 points) Notes on exam in International Economics, 16 January, 2009 Answer the following five questions in a short and concise fashion: (5 points each) a) What are the main differences between
Question 1. (25 points) Notes on exam in International Economics, 16 January, 2009 Answer the following five questions in a short and concise fashion: (5 points each) a) What are the main differences between
The Impact of Foreign Workers on the Labour Market of Cyprus
 Cyprus Economic Policy Review, Vol. 1, No. 2, pp. 37-49 (2007) 1450-4561 The Impact of Foreign Workers on the Labour Market of Cyprus Louis N. Christofides, Sofronis Clerides, Costas Hadjiyiannis and Michel
International Trade Theory College of International Studies University of Tsukuba Hisahiro Naito
 International Trade Theory College of International Studies University of Tsukuba Hisahiro Naito The specific factors model allows trade to affect income distribution as in H-O model. Assumptions of the
International trade in the global economy. 60 hours II Semester. Luca Salvatici
 International trade in the global economy 60 hours II Semester Luca Salvatici luca.salvatici@uniroma3.it Lesson 14: Migration International Trade: Economics and Policy 2017-18 1 Data on world migration
The Outlook for EU Migration
 Briefing Paper 4.29 www.migrationwatchuk.com Summary 1. Large scale net migration is a new phenomenon, having begun in 1998. Between 1998 and 2010 around two thirds of net migration came from outside the
The Outlook for Migration to the UK
 European Union: MW 384 Summary 1. This paper looks ahead for the next twenty years in the event that the UK votes to remain within the EU. It assesses that net migration would be likely to remain very
Europe, North Africa, Middle East: Diverging Trends, Overlapping Interests and Possible Arbitrage through Migration
 European University Institute Robert Schuman Centre for Advanced Studies Workshop 7 Organised in the context of the CARIM project. CARIM is co-financed by the Europe Aid Co-operation Office of the European
DANMARKS NATIONALBANK
 ANALYSIS DANMARKS NATIONALBANK 10 JANUARY 2019 NO. 1 Intra-EU labour mobility dampens cyclical pressures EU labour mobility dampens labour market pressures Eastern enlargements increase access to EU labour
The outlook for EU migration if the UK remains subject to the free movement of people
 The outlook for EU migration if the UK remains subject to the free movement of people European Union: MW 416 Summary 1. Should the UK remain subject to free movement rules after Brexit as a member of the
THE NOWADAYS CRISIS IMPACT ON THE ECONOMIC PERFORMANCES OF EU COUNTRIES
 THE NOWADAYS CRISIS IMPACT ON THE ECONOMIC PERFORMANCES OF EU COUNTRIES Laura Diaconu Maxim Abstract The crisis underlines a significant disequilibrium in the economic balance between production and consumption,
Postwar Migration in Southern Europe,
 Postwar Migration in Southern Europe, 1950 2000 An Economic Analysis ALESSANDRA VENTURINI University of Torino PUBLISHED BY THE PRESS SYNDICATE OF THE UNIVERSITY OF CAMBRIDGE The Pitt Building, Trumpington
DETERMINANTS OF IMMIGRANTS EARNINGS IN THE ITALIAN LABOUR MARKET: THE ROLE OF HUMAN CAPITAL AND COUNTRY OF ORIGIN
 DETERMINANTS OF IMMIGRANTS EARNINGS IN THE ITALIAN LABOUR MARKET: THE ROLE OF HUMAN CAPITAL AND COUNTRY OF ORIGIN Aim of the Paper The aim of the present work is to study the determinants of immigrants
The new demographic and social challenges in Spain: the aging process and the immigration
 International Geographical Union Commission GLOBAL CHANGE AND HUMAN MOBILITY The 4th International Conference on Population Geographies The Chinese University of Hong Kong (10-13 July 2007) The new demographic
LABOUR-MARKET INTEGRATION OF IMMIGRANTS IN OECD-COUNTRIES: WHAT EXPLANATIONS FIT THE DATA?
 LABOUR-MARKET INTEGRATION OF IMMIGRANTS IN OECD-COUNTRIES: WHAT EXPLANATIONS FIT THE DATA? By Andreas Bergh (PhD) Associate Professor in Economics at Lund University and the Research Institute of Industrial
The present picture: Migrants in Europe
 The present picture: Migrants in Europe The EU15 has about as many foreign born as USA (40 million), with a somewhat lower share in total population (10% versus 13.7%) 2.3 million are foreign born from
Chapter 9. Labour Mobility. Introduction
 Chapter 9 Labour Mobility McGraw-Hill/Irwin Labor Economics, 4 th edition Copyright 2008 The McGraw-Hill Companies, Inc. All rights reserved. 9-2 Introduction Existing allocation of workers and firms is
GLOBALISATION AND WAGE INEQUALITIES,
 GLOBALISATION AND WAGE INEQUALITIES, 1870 1970 IDS WORKING PAPER 73 Edward Anderson SUMMARY This paper studies the impact of globalisation on wage inequality in eight now-developed countries during the
Brain Drain and Emigration: How Do They Affect Source Countries?
 The University of Akron IdeaExchange@UAkron Honors Research Projects The Dr. Gary B. and Pamela S. Williams Honors College Spring 2019 Brain Drain and Emigration: How Do They Affect Source Countries? Nicholas
KRYSTYNA IGLICKA L.K.Academy of Management, WARSAW. The Impact of Workers from Central and Eastern Europe on Labour markets. The experience of Poland.
 KRYSTYNA IGLICKA L.K.Academy of Management, WARSAW The Impact of Workers from Central and Eastern Europe on Labour markets. The experience of Poland. IZA WORKSHOP Berlin, 30 November 2006 Introduction
STATISTICAL REFLECTIONS
 World Population Day, 11 July 217 STATISTICAL REFLECTIONS 18 July 217 Contents Introduction...1 World population trends...1 Rearrangement among continents...2 Change in the age structure, ageing world
Migration and the European Job Market Rapporto Europa 2016
 Migration and the European Job Market Rapporto Europa 2016 1 Table of content Table of Content Output 11 Employment 11 Europena migration and the job market 63 Box 1. Estimates of VAR system for Labor
Migrant population of the UK
 BRIEFING PAPER Number CBP8070, 3 August 2017 Migrant population of the UK By Vyara Apostolova & Oliver Hawkins Contents: 1. Who counts as a migrant? 2. Migrant population in the UK 3. Migrant population
Gender pay gap in public services: an initial report
 Introduction This report 1 examines the gender pay gap, the difference between what men and women earn, in public services. Drawing on figures from both Eurostat, the statistical office of the European
ISBN International Migration Outlook Sopemi 2007 Edition OECD Introduction
 ISBN 978-92-64-03285-9 International Migration Outlook Sopemi 2007 Edition OECD 2007 Introduction 21 2007 Edition of International Migration Outlook shows an increase in migration flows to the OECD International
Options for Romanian and Bulgarian migrants in 2014
 Briefing Paper 4.27 www.migrationwatchuk.com Summary 1. The UK, Germany, France and the Netherlands are the four major countries opening their labour markets in January 2014. All four are likely to be
V. MIGRATION V.1. SPATIAL DISTRIBUTION AND INTERNAL MIGRATION
 V. MIGRATION Migration has occurred throughout human history, but it has been increasing over the past decades, with changes in its size, direction and complexity both within and between countries. When
The Components of Wage Inequality and the Role of Labour Market Flexibility
 Institutions and inequality in the EU Perugia, 21 st of March, 2013 The Components of Wage Inequality and the Role of Labour Market Flexibility Analyses for the Enlarged Europe Jens Hölscher, Cristiano
Upgrading workers skills and competencies: policy strategies
 Federation of Greek Industries Greek General Confederation of Labour CONFERENCE LIFELONG DEVELOPMENT OF COMPETENCES AND QUALIFICATIONS OF THE WORKFORCE; ROLES AND RESPONSIBILITIES Athens 23-24 24 May 2003
DEGREE PLUS DO WE NEED MIGRATION?
 DEGREE PLUS DO WE NEED MIGRATION? ROBERT SUBAN ROBERT SUBAN Department of Banking & Finance University of Malta Lecture Outline What is migration? Different forms of migration? How do we measure migration?
How did immigration get out of control?
 Briefing Paper 9.22 www.migrationwatchuk.org How did immigration get out of control? Summary 1 Government claims that the present very high levels of immigration to Britain are consistent with world trends
Between brain drain and brain gain post-2004 Polish migration experience
 Between brain drain and brain gain post-2004 Polish migration experience Paweł Kaczmarczyk Centre of Migration Research University of Warsaw Conference Fachkräftebedarf und Zuwanderung IAB, Nuernberg May
FOREIGN TRADE AND FDI AS MAIN FACTORS OF GROWTH IN THE EU 1
 1. FOREIGN TRADE AND FDI AS MAIN FACTORS OF GROWTH IN THE EU 1 Lucian-Liviu ALBU 2 Abstract In the last decade, a number of empirical studies tried to highlight a strong correlation among foreign trade,
IMMIGRATION IN THE EU
 IMMIGRATION IN THE EU Source: Eurostat 10/6/2015, unless otherwise indicated Data refers to non-eu nationals who have established their usual residence in the territory of an EU State for a period of at
Population and Migration Estimates
 An Phríomh-Oifig Staidrimh Central Statistics Office 21 September 2010 Components of population growth Population and Migration Estimates April 2010 Natural increase Net migration 80 60 40 20 0 Year ending
3Z 3 STATISTICS IN FOCUS eurostat Population and social conditions 1995 D 3
 3Z 3 STATISTICS IN FOCUS Population and social conditions 1995 D 3 INTERNATIONAL MIGRATION IN THE EU MEMBER STATES - 1992 It would seem almost to go without saying that international migration concerns
Labour Mobility Interregional Migration Theories Theoretical Models Competitive model International migration
 Interregional Migration Theoretical Models Competitive Human Capital Search Others Family migration Empirical evidence Labour Mobility International migration History and policy Labour market performance
Labour mobility within the EU - The impact of enlargement and the functioning. of the transitional arrangements
 Labour mobility within the EU - The impact of enlargement and the functioning of the transitional arrangements Tatiana Fic, Dawn Holland and Paweł Paluchowski National Institute of Economic and Social
The application of quotas in EU Member States as a measure for managing labour migration from third countries
 The application of quotas in EU Member States as a measure for managing labour migration from third countries 1. INTRODUCTION This EMN Inform 1 provides information on the use of quotas 2 by Member States
65. Broad access to productive jobs is essential for achieving the objective of inclusive PROMOTING EMPLOYMENT AND MANAGING MIGRATION
 5. PROMOTING EMPLOYMENT AND MANAGING MIGRATION 65. Broad access to productive jobs is essential for achieving the objective of inclusive growth and help Turkey converge faster to average EU and OECD income
Chapter 4: Specific Factors and
 Chapter 4: Specific Factors and Income Distribution Chapter Organization Introduction The Specific Factors Model International Trade in the Specific Factors Model Income Distribution and the Gains from
International Migration and Development: Proposed Work Program. Development Economics. World Bank
 International Migration and Development: Proposed Work Program Development Economics World Bank January 2004 International Migration and Development: Proposed Work Program International migration has profound
Source: Piketty Saez. Share (in %), excluding capital gains. Figure 1: The top decile income share in the U.S., % 45% 40% 35% 30% 25%
, excluding capital gains. Figure 1: The top decile income share in the U.S., % 45% 40% 35% 30% 25%") The Hecksher-Ohlin-Samuelson (HOS) model Extension of Ricardian model: trade is explained by comparative advantage but those are based on:du modèle ricardien: - differences of endowments in factors of
The Hecksher-Ohlin-Samuelson (HOS) model Extension of Ricardian model: trade is explained by comparative advantage but those are based on:du modèle ricardien: - differences of endowments in factors of
HIGHLIGHTS. There is a clear trend in the OECD area towards. which is reflected in the economic and innovative performance of certain OECD countries.
 HIGHLIGHTS The ability to create, distribute and exploit knowledge is increasingly central to competitive advantage, wealth creation and better standards of living. The STI Scoreboard 2001 presents the
10/11/2017. Chapter 6. The graph shows that average hourly earnings for employees (and selfemployed people) doubled since 1960
 doubled since 1960") Chapter 6 1. Discuss three US labor market trends since 1960 2. Use supply and demand to explain the labor market 3. Use supply and demand to explain employment and real wage trends since 1960 4. Define
Chapter 6 1. Discuss three US labor market trends since 1960 2. Use supply and demand to explain the labor market 3. Use supply and demand to explain employment and real wage trends since 1960 4. Define
The UK and the European Union Insights from ICAEW Employment
 The UK and the European Union Insights from ICAEW Employment BUSINESS WITH CONFIDENCE icaew.com The issues at the heart of the debate This paper is one of a series produced in advance of the EU Referendum
EXECUTIVE SUMMARY. Executive Summary
 Executive Summary This report is an expedition into a subject area on which surprisingly little work has been conducted to date, namely the future of global migration. It is an exploration of the future,
Public Affairs 856 Trade, Competition, and Governance in a Global Economy Lecture 22 4/10/2017. Instructor: Prof. Menzie Chinn UW Madison Spring 2017
 Public Affairs 856 Trade, Competition, and Governance in a Global Economy Lecture 22 4/10/2017 Instructor: Prof. Menzie Chinn UW Madison Spring 2017 Outline Immigration FDI 2 Outline Topic: The movement
VIII. INTERNATIONAL MIGRATION
 VIII. INTERNATIONAL MIGRATION International migration is closely tied to global development and generally viewed as a net positive for both sending and receiving countries. In the sending countries, emigration
Migration as an Adjustment Mechanism in a Crisis-Stricken Europe
 Migration as an Adjustment Mechanism in a Crisis-Stricken Europe Martin Kahanec Central European University (CEU), Budapest Institute for the Study of Labor (IZA), Bonn Central European Labour Studies
Chapter Ten Growth, Immigration, and Multinationals
 Chapter Ten Growth, Immigration, and Multinationals 2003 South-Western/Thomson Learning Chapter Ten Outline 1. What if Factors Can Move? 2 What if Factors Can Move? Welfare analysis of factor movements
IMF research links declining labour share to weakened worker bargaining power. ACTU Economic Briefing Note, August 2018
 IMF research links declining labour share to weakened worker bargaining power ACTU Economic Briefing Note, August 2018 Authorised by S. McManus, ACTU, 365 Queen St, Melbourne 3000. ACTU D No. 172/2018
in an emigration-immigration country -
 Demographic and economic challenges in an emigration-immigration country - the case of Poland Paweł Kaczmarczyk Centre of Migration Research University of Warsaw Driving forces behind demographic trends
Public Affairs 856 Trade, Competition, and Governance in a Global Economy Lecture 23 4/18/2018. Instructor: Prof. Menzie Chinn UW Madison Spring 2018
 Public Affairs 856 Trade, Competition, and Governance in a Global Economy Lecture 23 4/18/2018 Instructor: Prof. Menzie Chinn UW Madison Spring 2018 Outline Immigration FDI 2 Outline Topic: The movement
Migration Policy and Welfare State in Europe
 Migration Policy and Welfare State in Europe Assaf Razin 1 and Jackline Wahba 2 Immigration and the Welfare State Debate Public debate on immigration has increasingly focused on the welfare state amid
Migration and Labor Market Outcomes in Sending and Southern Receiving Countries
 Migration and Labor Market Outcomes in Sending and Southern Receiving Countries Giovanni Peri (UC Davis) Frederic Docquier (Universite Catholique de Louvain) Christian Dustmann (University College London)
Can We Reduce Unskilled Labor Shortage by Expanding the Unskilled Immigrant Quota? Akira Shimada Faculty of Economics, Nagasaki University
 Can We Reduce Unskilled Labor Shortage by Expanding the Unskilled Immigrant Quota? Akira Shimada Faculty of Economics, Nagasaki University Abstract We investigate whether we can employ an increased number
SPANISH NATIONAL YOUTH GUARANTEE IMPLEMENTATION PLAN ANNEX. CONTEXT
 2013 SPANISH NATIONAL YOUTH 2013 GUARANTEE IMPLEMENTATION PLAN ANNEX. CONTEXT 2 Annex. Context Contents I. Introduction 3 II. The labour context for young people 4 III. Main causes of the labour situation
The Application of Quotas in EU Member States as a measure for managing labour migration from third countries
 The Application of Quotas in EU Member States as a measure for managing labour migration from third countries 1. INTRODUCTION This short EMN Inform 1 provides information on the use of quotas 2 by Member
Informal Ministerial Meeting of the EU Accession Countries
 1 of 7 Informal Ministerial Meeting of the EU Accession Countries EU Enlargement and the Free Movement of Labour Geneva, June 14,2001 The on-going negotiations on the eastern enlargement of the European
ASSESSING THE ECONOMIC IMPACT OF FOREIGN WORKERS IN MALTA
 ASSESSING THE ECONOMIC IMPACT OF FOREIGN WORKERS IN MALTA Article published in the Quarterly Review 2016:1, pp. 39-44 BOX 3: ASSESSING THE ECONOMIC IMPACT OF FOREIGN WORKERS IN MALTA 1 Between the late
3 Wage adjustment and employment in Europe: some results from the Wage Dynamics Network Survey
 3 Wage adjustment and in Europe: some results from the Wage Dynamics Network Survey This box examines the link between collective bargaining arrangements, downward wage rigidities and. Several past studies
Population and Migration Estimates
 22 September 2009 Components of population growth Population and Migration Estimates April 2009 Natural increase Net migration 80 60 40 20 0 Year ending April 2008 April 2009 Natural increase 44,600 45,100
The Causes of Wage Differentials between Immigrant and Native Physicians
 The Causes of Wage Differentials between Immigrant and Native Physicians I. Introduction Current projections, as indicated by the 2000 Census, suggest that racial and ethnic minorities will outnumber non-hispanic
INTERNATIONAL TRADE. (prepared for the Social Science Encyclopedia, Third Edition, edited by A. Kuper and J. Kuper)
") INTERNATIONAL TRADE (prepared for the Social Science Encyclopedia, Third Edition, edited by A. Kuper and J. Kuper) J. Peter Neary University College Dublin 25 September 2003 Address for correspondence:
INTERNATIONAL TRADE (prepared for the Social Science Encyclopedia, Third Edition, edited by A. Kuper and J. Kuper) J. Peter Neary University College Dublin 25 September 2003 Address for correspondence:
Chapter 8 Economic Integration, Labour Markets and Migration
 Chapter 8 Economic Integration, Labour Markets and Migration Chapter Overview Unemployment Economic integration and the labour markets Migration 1 2 Why Labour Markets Matter Controversies Abound Economic
2. Labor Mobility in the Enlarged EU: Who Wins, Who Loses?
 2. Labor Mobility in the Enlarged EU: Who Wins, Who Loses? Timo Baas Herbert Brücker Andreas Hauptmann The EU s Eastern enlargement has triggered a substantial labor migration from the new into the old
Majorities attitudes towards minorities in (former) Candidate Countries of the European Union:
 Candidate Countries of the European Union:") Majorities attitudes towards minorities in (former) Candidate Countries of the European Union: Results from the Eurobarometer in Candidate Countries 2003 Report 3 for the European Monitoring Centre on
Majorities attitudes towards minorities in (former) Candidate Countries of the European Union: Results from the Eurobarometer in Candidate Countries 2003 Report 3 for the European Monitoring Centre on
Labour Migration in Lithuania
 Labour Migration in Lithuania dr. Boguslavas Gruzevskis Institute of Labour and Social Research Abstract Fundamental political, social and economic changes of recent years, having occurred in Lithuania,
Migration, Mobility and Integration in the European Labour Market. Lorenzo Corsini
 Migration, Mobility and Integration in the European Labour Market Lorenzo Corsini Content of the lecture We provide some insight on -The degree of differentials on some key labourmarket variables across
Migration Challenge or Opportunity? - Introduction. 15th Munich Economic Summit
 Migration Challenge or Opportunity? - Introduction 15th Munich Economic Summit Clemens Fuest 30 June 2016 What do you think are the two most important issues facing the EU at the moment? 40 35 2014 2015
UK Productivity Gap: Skills, management and innovation
 UK Productivity Gap: Skills, management and innovation March 2005 Professor John Van Reenen Director, Centre for Economic Performance, LSE 1 1. Overview The Productivity Gap (output per hour) What is it
WHO MIGRATES? SELECTIVITY IN MIGRATION
 WHO MIGRATES? SELECTIVITY IN MIGRATION Mariola Pytliková CERGE-EI and VŠB-Technical University Ostrava, CReAM, IZA, CCP and CELSI Info about lectures: https://home.cerge-ei.cz/pytlikova/laborspring16/
Size and Development of the Shadow Economy of 31 European and 5 other OECD Countries from 2003 to 2013: A Further Decline
 January 31, 2013 ShadEcEurope31_Jan2013.doc Size and Development of the Shadow Economy of 31 European and 5 other OECD Countries from 2003 to 2013: A Further Decline by Friedrich Schneider *) In the Tables
ECONOMIC GROWTH* Chapt er. Key Concepts
 Chapt er 6 ECONOMIC GROWTH* Key Concepts The Basics of Economic Growth Economic growth is the expansion of production possibilities. The growth rate is the annual percentage change of a variable. The growth
The impact of Chinese import competition on the local structure of employment and wages in France
 No. 57 February 218 The impact of Chinese import competition on the local structure of employment and wages in France Clément Malgouyres External Trade and Structural Policies Research Division This Rue
Britain, the EU & Tourism
 Written evidence submitted by VisitBritain (IOB0027) Britain, the EU & Tourism About VisitBritain and VisitEngland Tourism is currently worth 126.9 billion to Britain s economy. It is Britain s third largest
Migration in employment, social and equal opportunities policies
 Health and Migration Advisory Group Luxembourg, February 25-26, 2008 Migration in employment, social and equal opportunities policies Constantinos Fotakis DG Employment. Social Affairs and Equal Opportunities
Online Appendices for Moving to Opportunity
 Online Appendices for Moving to Opportunity Chapter 2 A. Labor mobility costs Table 1: Domestic labor mobility costs with standard errors: 10 sectors Lao PDR Indonesia Vietnam Philippines Agriculture,
Mobility of health professionals between the Philippines and selected EU member states: A Policy Dialogue
 The ILO Decent Work Across Borders Mobility of health professionals between the Philippines and selected EU member states: A Policy Dialogue Executive Summary Assessment of the Impact of Migration of Health
Immigration Policy In The OECD: Why So Different?
 Immigration Policy In The OECD: Why So Different? Zachary Mahone and Filippo Rebessi August 25, 2013 Abstract Using cross country data from the OECD, we document that variation in immigration variables
Levels and trends in international migration
 Levels and trends in international migration The number of international migrants worldwide has continued to grow rapidly over the past fifteen years reaching million in 1, up from million in 1, 191 million
Unemployment and the Immigration Surplus
 Unemployment and the Immigration Surplus Udo Kreickemeier University of Nottingham Michael S. Michael University of Cyprus December 2007 Abstract Within a small open economy fair wage model with unemployment
Chapter 10 Worker Mobility: Migration, Immigration, and Turnover
 Chapter 10 Worker Mobility: Migration, Immigration, and Turnover Summary Chapter 9 introduced the human capital investment framework and applied it to a wide variety of issues related to education and
The Social State of the Union
 The Social State of the Union Prof. Maria Karamessini, Panteion University of Social and Political Sciences, Athens, Greece President and Governor of the Public Employment Agency of Greece EuroMemo Group
Working paper 20. Distr.: General. 8 April English
 Distr.: General 8 April 2016 Working paper 20 English Economic Commission for Europe Conference of European Statisticians Work Session on Migration Statistics Geneva, Switzerland 18-20 May 2016 Item 8
Economics of European Integration Lecture # 6 Migration and Growth
 Economics of European Integration Lecture # 6 Migration and Growth Winter Semester 2013/14 Gerald Willmann Gerald Willmann, Department of Economics, Bielefeld University Migration Facts and Theory Immigration:
No. 1. THE ROLE OF INTERNATIONAL MIGRATION IN MAINTAINING HUNGARY S POPULATION SIZE BETWEEN WORKING PAPERS ON POPULATION, FAMILY AND WELFARE
 NKI Central Statistical Office Demographic Research Institute H 1119 Budapest Andor utca 47 49. Telefon: (36 1) 229 8413 Fax: (36 1) 229 8552 www.demografia.hu WORKING PAPERS ON POPULATION, FAMILY AND
Determinants of the Trade Balance in Industrialized Countries
 Determinants of the Trade Balance in Industrialized Countries Martin Falk FIW workshop foreign direct investment Wien, 16 Oktober 2008 Motivation large and persistent trade deficits USA, Greece, Portugal,
Monthly Inbound Update June th August 2017
 Monthly Inbound Update June 217 17 th August 217 1 Contents 1. About this data 2. Headlines 3. Journey Purpose: June, last 3 months, year to date and rolling twelve months by journey purpose 4. Global
Mobility and regional labour markets:
 Mobility and regional labour markets: Lessons for employees and employers William Collier and Roger Vickerman Centre for European, Regional and Transport Economics The University of Kent at Canterbury
The Impact of Ireland s Recession on the Labour Market Outcomes of its Immigrants
 The Impact of Ireland s Recession on the Labour Market Outcomes of its Immigrants Alan Barrett and Elish Kelly Economic and Social Research Institute October 2010 Structure of the talk Some pictures of
BRIEFING. EU Migration to and from the UK.
 BRIEFING EU Migration to and from the UK AUTHOR: DR CARLOS VARGAS-SILVA DR YVONNI MARKAKI PUBLISHED: 31/10/2016 NEXT UPDATE: 31/10/2017 5th Revision www.migrationobservatory.ox.ac.uk This briefing provides
Emigration and source countries; Brain drain and brain gain; Remittances.
 Emigration and source countries; Brain drain and brain gain; Remittances. Mariola Pytliková CERGE-EI and VŠB-Technical University Ostrava, CReAM, IZA, CCP and CELSI Info about lectures: https://home.cerge-ei.cz/pytlikova/laborspring16/
Discussion comments on Immigration: trends and macroeconomic implications
 Discussion comments on Immigration: trends and macroeconomic implications William Wascher I would like to begin by thanking Bill White and his colleagues at the BIS for organising this conference in honour
Globalisation and flexicurity
 Globalisation and flexicurity Torben M Andersen Department of Economics Aarhus University November 216 Globalization Is it Incompatible with High employment Decent wages (no working poor) Low inequality
Labour market trends and prospects for economic competitiveness of Lithuania
 VILNIUS UNIVERSITY Faculty of Economics and Business Administration Luxembourg, 2018 Labour market trends and prospects for economic competitiveness of Lithuania Conference Competitiveness Strategies for