Trends and Changes Affecting Upstate New York. David L. Brown & Robin Blakely-Armitage State of Upstate Conference June 8, 2011
|
|
|
- Gordon Welch
- 5 years ago
- Views:
Transcription


1 Trends and Changes Affecting Upstate New York David L. Brown & Robin Blakely-Armitage State of Upstate Conference June 8, 2011
2 Challenges & Opportunities Change, not stability, is the normal situation Some changes enhance opportunities Other changes pose challenges for people, communities, and regions
3 Demographic Changes are Fundamental Changes in: Population size, Geographic distribution of population Socioeconomic composition of population Affect, and are affected by, most aspects of Society Economy Natural environment But demography is not destiny
4 Some Major Changes in Upstate s Demography Changes in Population Size between NYS grew by 7.7% Most growth concentrated in downstate areas mil. (10.8%) Upstate + 200,000 (2.9%) All upstate growth occurred in metro areas Especially in their outlying counties Nonmetropolitan areas lost 100,000 persons Mostly in counties with small to medium sized cities More rural counties held their own
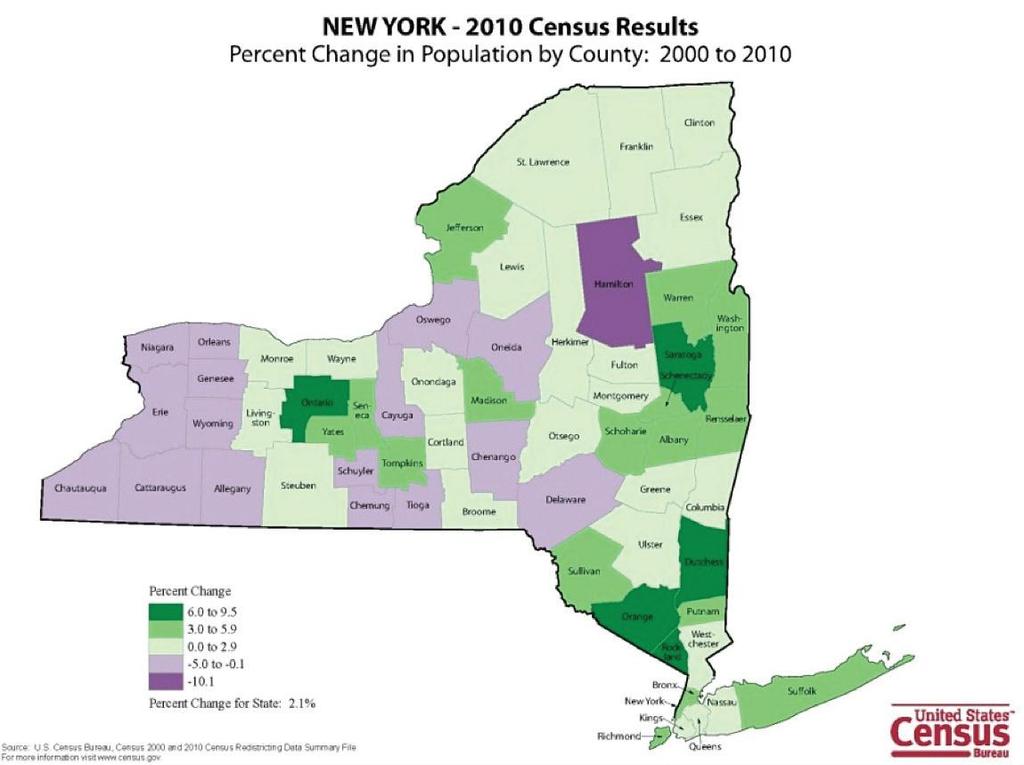
5
6 Migration is a major component of NYS population change NYS receives and sends migrants both to/from other parts of the US and internationally International migration has been a source of population growth for NYS Slowed dramatically during the recession International migration gains are concentrated in downstate Upstate also has positive migration from abroad, but much more moderate Internal migration has been a source of NYS population loss Net Domestic outmigration is much higher in downstate areas Upstate also lost more domestic migrants than it gained but at much lower rates of loss than downstate
7 Migration is specific of certain ages Upstate has been losing young adults since the 1960s Age Source: U.S. Decennial Censuses

8 The Aging of the baby boom in Upstate NYS NYS Median Age increased by 1.8 years since 2000 More rapid aging in Upstate-- by 2.3 years Pct. 65+ reached 15% in 2010 in Upstate Estimated to reach 20% by 2030
9 NYS is ethnically & racially diverse NYS is much more diverse than upstate 15.2% African American vs. 7.8% 16.8% Hispanic vs. 4.9% 21.3% foreign born vs. 5.8% Upstate metropolitan areas are more diverse than nonmetropolitan areas BUT: the most highly rural areas are more diverse than small and medium sized cities

10 Changing Landscape of Diversity Hispanics are now the largest race/ethnic group in NYS In Upstate, African Americans still outnumber Hispanics But, Hispanic rate of growth > African American The vast majority of Upstate counties experienced Hispanic population growth NYS County Percentage Change in Hispanic Population, Source: Center for Disease Control, Race and Ethnicity dataset
11 Demography is Not Destiny Demographic changes can propel communities upward or downward Can pose challenges Can enhance opportunities Impacts of population changes are not automatic Mediated by Local social structure National and international environments in which they are embedded
12 Example: Out migration of young adults can affect the school system Net Out migration of School aged Pop. Decline of enrollment Is the school system response to loss of school age kids the same in all communities?
13 The impacts of Population change are mediated by social structure Community A Net Out migration of school age pop. Economic resources Leadership Citizen mobilization Technical know how School Closure Community B Net Out migration of school age pop. Economic resources Leadership Citizen mobilization Technical know how Consolidate Share admin. services Out-source special classes School Remains open
14 Communities & Regions are Embedded in Macro Structural & Policy Environments Policy Choice Efficiency Equity Population Change Size Composition Distribution Local social & economic structure Social & Economic Well Being Unemployment Poverty reduction Land conversion Service provision Macro Economy & Polity Devolution Privatization Globalization
15 Opinions and Perspectives of Upstate New Yorkers
16 In our chartbook we present both secondary data and survey data The survey data comes from our SOUS Survey 600 Upstate NY households, randomly selected, 60 question phone interview Why both secondary data and survey data? Both have utility, value, and influence
17 What is the value of a survey of public opinion? What is the impact of opinion on public policy? In other words, should it matter what people think?
18 Why opinions are important to public policy An article in Political Research Quarterly (March 2003 vol. 56 no ) showed: the impact of public opinion on public policy is substantial; Relevance/currency enhances the impact of public opinion on policy; the impact of opinion on policy remains strong even when the activities of political organizations and elites are taken into account;
19 What about secondary, or hard data? Can it influence opinion? Made-up Minds, by Chris Mooney (THE WEEK magazine, May 20, 2011, Volume 11, Issue originally appeared in Mother Jones). Some beliefs are so rooted in emotions that facts (data?) are often irrelevant. Motivated Reasoning helps explain why groups are still polarized over matters where the evidence is so unequivocal. Which is why using evidence and argument may backfire when attempting to persuade people may actually hold only their views more strongly. Some examples are climate change, abortion, gun control, etc. It would seem that expecting people to be convinced by the facts flies in the face of, you know, the facts. (based on the research, that is)
20 So if hard data doesn t always sway opinion, and opinions influence public policy, it is doubly important to understand public opinion. But let s not discount or ignore the hard data.
21 We should use both opinions (survey data) and hard data (secondary sources) to understand the complexity of issues in Upstate New York. Some examples
22 Economic Issues

23 Employment/unemployment Unemployment shows significant variation by region. Among the Upstate regions, the North Country posts the highest unemployment as of June 2010, while the Capital Region shows the lowest. All regions report slight declines in unemployment between 2009 and Unemployment Rates by NYS Region, June 2008, 2009, and 2010
24 What is the most important issue in the state and your community? The Economy ranks highest on people s minds, whether employment, taxes, economic issues, etc. At the community level, people are more concerned about employment, and less about taxes, budgets & local government. 35% 30% 25% 20% 15% 10% 5% 0% state community
25 How do you rank these 4 goals of local economic development? 100 Over 60% of respondents identify creating local jobs as most important goal of local economic development Least Important 3rd While the other three goals are ranked equally in terms of most important, 40% of respondents said that reducing poverty was the least important goal creating local jobs increasing tax base reducing poverty improving the quality of life 2nd Most Important
26 Taxes
27 % 90% 80% 70% 60% 50% 40% 30% 20% 10% 0% Local Government Revenue Sources, Upstate NY, Average County Revenues, by source Average City Revenues, by source 100% 90% Other 80% Other Federal Aid 70% Federal Aid 60% State Aid State Aid 50% Charges for Services 40% Charges for Services Other local Sales Tax Property 30% 20% 10% Other local Sales Tax Property 0% Average Town Revenues, by source Average Village Revenues, by source 100% 90% 80% 70% 60% 50% 40% 30% 20% 10% 0% Other Federal Aid State Aid Charges for Services Other local Sales Tax Property 100% 90% 80% 70% 60% 50% 40% 30% 20% 10% 0% Other Federal Aid State Aid Charges for Services Other local Sales Tax Property Property taxes account for 18% of City and County revenues, almost 50% of Town revenues, and 30% of Village revenues. Is often viewed as the major tax with the most local control.
28 Specific tax identified as one of the most important issues facing NYS (24%) Property taxes are by far the most frequently cited tax (as an important issue), particularly among those living in non-core counties (50%) Other Income tax All taxes School tax Gas tax Property tax Metropolitan Micropolitan Non Core
29 Support for Property tax caps Levels of support for proposed property tax cap of 2% % of respondents support property tax caps Oppose strongly Oppose somewhat Neutral Support somewhat Support Strongly
30 Support for Property tax caps Levels of support for proposed property tax cap, alone and if local government would need to reduce current level of services When faced with the prospect of generally reduced local services, support for tax caps declines Support or oppose property tax cap of 2%? Support or oppose property tax cap if local services are reduced? Oppose strongly Oppose somewhat Neutral Support somewhat Support Strongly
31 Schools & Taxes
32 School Enrollment Declining Percent Change in Enrollment in Public Elementary and Secondary Schools, NYS by County Type: Between 1997 and 2007 enrollment in Upstate public schools declined by 8% (a decline of more than 92,000 students), compared to a loss of 3.5% for the state as a whole (a decline of more than 98,000 students). Non-core counties lost over 11,000 public school students during this period, a loss of 12.6%. Metropolitan counties lost 55,000 students or a decline of 6.2%. 2% 0% -2% -4% -6% -8% -10% NYS Upstate Metropolitan Micropolitan Non Core As a percentage, declines were even more significant among districts in micropolitan counties, with enrollment declining by 14.6%, a loss of 26,300 students. -12% -14% -16%
.")

33 Expenditures per pupil increasing Expenditures per pupil 2000 Expenditures per pupil 2008 Upstate New York public school districts are spending an ever increasing amount on their students (New York State has consistently been in the top three of all states in per-pupil spending and led the nation in 2010). In 2000, the vast majority of upstate districts spent between $10,000 and $15,000 per pupil. By 2008, most districts were spending significantly more per pupil at a pace far exceeding inflation. Several district in the Adirondacks were spending more than $30,000 per student, and in two cases were spending about $55,000 per pupil. There is also a cluster of districts in the Sullivan and Ulster County areas that are spending substantially more than the state average per pupil.
34 Support for property tax limits with specific impacts on schools We saw the conditional attitudes on levels of support for the property tax cap Support or oppose property tax cap of 2%? Support or oppose property tax cap if local services are reduced? Oppose strongly Oppose somewhat Neutral Support somewhat Support Strongly
35 Support for property tax limits with specific impacts on schools Support for tax cap declines further when faced with cuts to school budgets Support or oppose property tax cap of 2%? Support or oppose property tax cap if local services are reduced? support of oppose property tax cap if local school budget is cut Oppose strongly Oppose somewhat Neutral Support somewhat Support Strongly
36 Support for property tax limits with specific impacts on schools But there is also significant support to merging neighboring districts if property taxes are reduced Support or oppose property tax cap of 2%? Support or oppose property tax cap if local services are reduced? support of oppose property tax cap if local school budget is cut Support or oppose merging local schools to reduce property tax 0.0 Oppose strongly Oppose somewhat Neutral Support somewhat Support Strongly
37 Poverty
38 Trends in Poverty Rates Percent of People of all ages in poverty Poverty has increased across the board in New York State. Upstate New York s poverty rate increased from about 11 percent in the year 2000 to about 13 percent in New York Upstate Metropolitan Micropolitan Non Core The percent of children in poverty in Upstate has also increased since 2000, to almost 18% in Particularly high rates are noted among non-core and micropolitan county children (around 20%). Percent of Children (<18 yrs) in poverty New York 15 Upstate Metropolitan 10 Micropolitan 5 Non Core
39 Public policies for assisting lower income individuals and families are received with varying degrees of support. Public sentiment towards whether poor people are deserving or not of government assistance often weighs heavily into these levels of support or opposition.
40 Which is the bigger cause of poverty today? 60% of Upstate New Yorkers believe poverty is largely due to circumstances beyond people s control, and 40% believe it is due to poor people not doing enough to help themselves. circumstances beyond one's control poor people not doing enough to help themselves
41 If poverty is due to poor people not doing enough to help themselves, please tell us what you mean Among those believing poverty is caused by poor people not doing enough, the main reasons cited were that poor people are lazy and the abuse of government programs Other Unwilling to take available jobs Lack of education Abuse of govt. programs People are lazy 10 0 Metropolitan Micropolitan Non Core
42 If poverty is due to circumstances beyond poor people s control, please tell us what you mean Lack of jobs, poor economic conditions, and the outsourcing of jobs accounted for the majority of reasons identified why people felt poverty was due to circumstances beyond poor people s control Other Not enough government help Jobs outsourced Poor economic conditions Lack of jobs 10 0 Metropolitan Micropolitan Non Core
43 Issues are often more complex than either the secondary data or the survey data can convey on their own. Best used in combination.
44 We view you, the presenters and participants, as another source of valuable data. Experiences, Perspectives, Practices, Values, Paradigms, Research, Local innovation, etc. Combining these different data and having engaged discussions in our workshops is a major goal of this conference.
45 Intended outcomes of these discussions are strengthened partnerships, examples of local resiliency and innovation, and the identification of future research, policy, and practice.
Demographic Data. Comprehensive Plan
 Comprehensive Plan 2010-2030 4 Demographic Data Population and demographics have changed over the past several decades in the City of Elwood. It is important to incorporate these shifts into the planning
Meanwhile, the foreign-born population accounted for the remaining 39 percent of the decline in household growth in
 3 Demographic Drivers Since the Great Recession, fewer young adults are forming new households and fewer immigrants are coming to the United States. As a result, the pace of household growth is unusually
What Lies Ahead: Population, Household and Employment Forecasts to 2040 April Metropolitan Council Forecasts to 2040
 The Metropolitan Council forecasts population, households and employment for the sevencounty Minneapolis-St. Paul region with a 30-year time horizon. The Council will allocate this regional forecast to
People. Population size and growth
 The social report monitors outcomes for the New Zealand population. This section provides background information on who those people are, and provides a context for the indicators that follow. People Population
Wide and growing divides in views of racial discrimination
 FOR RELEASE MARCH 01, 2018 The Generation Gap in American Politics Wide and growing divides in views of racial discrimination FOR MEDIA OR OTHER INQUIRIES: Carroll Doherty, Director of Political Research
Chapter 5. Residential Mobility in the United States and the Great Recession: A Shift to Local Moves
 Chapter 5 Residential Mobility in the United States and the Great Recession: A Shift to Local Moves Michael A. Stoll A mericans are very mobile. Over the last three decades, the share of Americans who
COMPARATIVE ANALYSIS OF NEIGHBORHOOD CONTEXTS: ANNIE E. CASEY FOUNDATION CITIES
 ANNIE E. CASEY FOUNDATION MAKING CONNECTIONS INITIATIVE COMPARATIVE ANALYSIS OF NEIGHBORHOOD CONTEXTS: ANNIE E. CASEY FOUNDATION CITIES G. Thomas Kingsley and Kathryn L.S. Pettit December 2003 THE URBAN
Post-Secondary Education, Training and Labour September Profile of the New Brunswick Labour Force
 Post-Secondary Education, Training and Labour September 2018 Profile of the New Brunswick Labour Force Contents Population Trends... 2 Key Labour Force Statistics... 5 New Brunswick Overview... 5 Sub-Regional
People. Population size and growth. Components of population change
 The social report monitors outcomes for the New Zealand population. This section contains background information on the size and characteristics of the population to provide a context for the indicators
Extended Abstract. The Demographic Components of Growth and Diversity in New Hispanic Destinations
 Extended Abstract The Demographic Components of Growth and Diversity in New Hispanic Destinations Daniel T. Lichter Departments of Policy Analysis & Management and Sociology Cornell University Kenneth
We know that the Latinx community still faces many challenges, in particular the unresolved immigration status of so many in our community.
 1 Ten years ago United Way issued a groundbreaking report on the state of the growing Latinx Community in Dane County. At that time Latinos were the fastest growing racial/ethnic group not only in Dane
STRENGTHENING RURAL CANADA: Fewer & Older: The Coming Demographic Crisis in Rural Ontario
 STRENGTHENING RURAL CANADA: Fewer & Older: The Coming Demographic Crisis in Rural Ontario An Executive Summary 1 This paper has been prepared for the Strengthening Rural Canada initiative by: Dr. Bakhtiar
Population Outlook for the Portland-Vancouver Metropolitan Region
 Portland State University PDXScholar Institute of Portland Metropolitan Studies Publications Institute of Portland Metropolitan Studies 2007 Population Outlook for the Portland-Vancouver Metropolitan Region
Cook County Health Strategic Planning Landscape
 Cook County Health Strategic Planning Landscape Terry Mason, MD COO Cook County Department of Public Health December 21, 2018 1 Cook County Population Change 2000-2010* U.S. Census 2000 population 2010
STRENGTHENING RURAL CANADA: Fewer & Older: Population and Demographic Crossroads in Rural Saskatchewan. An Executive Summary
 STRENGTHENING RURAL CANADA: Fewer & Older: Population and Demographic Crossroads in Rural Saskatchewan An Executive Summary This paper has been prepared for the Strengthening Rural Canada initiative by:
Illinois: State-by-State Immigration Trends Introduction Foreign-Born Population Educational Attainment
 Illinois: State-by-State Immigration Trends Courtesy of the Humphrey School of Public Affairs at the University of Minnesota Prepared in 2012 for the Task Force on US Economic Competitiveness at Risk:
Changing Times, Changing Enrollments: How Recent Demographic Trends are Affecting Enrollments in Portland Public Schools
 Portland State University PDXScholar School District Enrollment Forecast Reports Population Research Center 7-1-2000 Changing Times, Changing Enrollments: How Recent Demographic Trends are Affecting Enrollments
Hispanic Health Insurance Rates Differ between Established and New Hispanic Destinations
 Population Trends in Post-Recession Rural America A Publication Series of the W3001 Research Project Hispanic Health Insurance Rates Differ between and New Hispanic s Brief No. 02-16 August 2016 Shannon
Rural Pulse 2019 RURAL PULSE RESEARCH. Rural/Urban Findings March 2019
 Rural Pulse 2019 RURAL PULSE RESEARCH Rural/Urban Findings March 2019 Contents Executive Summary 3 Project Goals and Objectives 9 Methodology 10 Demographics 12 Detailed Research Findings 18 Appendix Prepared
The Brookings Institution Metropolitan Policy Program Robert Puentes, Fellow
 The Brookings Institution Metropolitan Policy Program Robert Puentes, Fellow A Review of New Urban Demographics and Impacts on Housing National Multi Housing Council Research Forum March 26, 2007 St. Louis,
Le Sueur County Demographic & Economic Profile Prepared on 7/12/2018
 Le Sueur County Demographic & Economic Profile Prepared on 7/12/2018 Prepared by: Mark Schultz Regional Labor Market Analyst Southeast and South Central Minnesota Minnesota Department of Employment and
MIGRATION STATISTICS AND BRAIN DRAIN/GAIN
 MIGRATION STATISTICS AND BRAIN DRAIN/GAIN Nebraska State Data Center 25th Annual Data Users Conference 2:15 to 3:15 p.m., August 19, 2014 David Drozd Randy Cantrell UNO Center for Public Affairs Research
Trends in the Racial Distribution of Wisconsin Poverty, This report is the second in a series of briefings on the results.
 Briefing 2 Trends in the Racial Distribution of Wisconsin Poverty, 1970-2000 Katherine J. Curtis, Heather O Connell This report is the second in a series of briefings on the results of recent research
Rural Pulse 2016 RURAL PULSE RESEARCH. Rural/Urban Findings June 2016
 Rural Pulse 2016 RURAL PULSE RESEARCH Rural/Urban Findings June 2016 Contents Executive Summary Project Goals and Objectives 9 Methodology 10 Demographics 12 Research Findings 17 Appendix Prepared by Russell
An Equity Assessment of the. St. Louis Region
 An Equity Assessment of the A Snapshot of the Greater St. Louis 15 counties 2.8 million population 19th largest metropolitan region 1.1 million households 1.4 million workforce $132.07 billion economy
Chapter 1: Objectives
 Chapter 1: Objectives Identify Texas political party activists and government officials to inform participation in the political affairs of the state and its counties, cities, and special districts. Understand
Chapter 7. Migration
 Chapter 7 Migration Chapter 7 Migration Americans have traditionally been highly higher levels of educational attainment than Figure 7-1. mobile, with nearly 1 in 7 people changing residence each year.
SECTION TWO: REGIONAL POVERTY TRENDS
 SECTION TWO: REGIONAL POVERTY TRENDS Metropolitan Council Choice, Place and Opportunity: An Equity Assessment of the Twin Cities Region Section 2 The changing face of poverty Ebbs and flows in the performance
Population Vitality Overview
 8 Population Vitality Overview Population Vitality Overview The Population Vitality section covers information on total population, migration, age, household size, and race. In particular, the Population
The Graying of the Empire State: Parts of NY Grow Older Faster
 Research Bulletin No. 7.2 August 2012 EMPIRE The Graying of the Empire State: Parts of NY Grow Older Faster By E.J. McMahon and Robert Scardamalia CENTER FOR NEW YORK STATE POLICY A project of the Manhattan
STRENGTHENING RURAL CANADA: Fewer & Older: The Coming Population and Demographic Challenges in Rural Newfoundland & Labrador
 STRENGTHENING RURAL CANADA: Fewer & Older: The Coming Population and Demographic Challenges in Rural Newfoundland & Labrador An Executive Summary 1 This paper has been prepared for the Strengthening Rural
BLACK-WHITE BENCHMARKS FOR THE CITY OF PITTSBURGH
 BLACK-WHITE BENCHMARKS FOR THE CITY OF PITTSBURGH INTRODUCTION Ralph Bangs, Christine Anthou, Shannon Hughes, Chris Shorter University Center for Social and Urban Research University of Pittsburgh March
The Quarterly Review of Economic News & Insight. Economic Currents. Economic Indices for Massachusetts. Population Change, Housing, and Local Finance
 The Quarterly Review of Economic News & Insight summer 2003 Volume six Issue 2 Economic Currents Economic Indices for Massachusetts Population Change, Housing, and Local Finance The Biotech Industry: A
ANNUAL SURVEY REPORT: ARMENIA
 ANNUAL SURVEY REPORT: ARMENIA 2 nd Wave (Spring 2017) OPEN Neighbourhood Communicating for a stronger partnership: connecting with citizens across the Eastern Neighbourhood June 2017 ANNUAL SURVEY REPORT,
Peruvians in the United States
 Peruvians in the United States 1980 2008 Center for Latin American, Caribbean & Latino Studies Graduate Center City University of New York 365 Fifth Avenue Room 5419 New York, New York 10016 212-817-8438
LEGACIES OF THE WAR ON POVERTY
 LEGACIES OF THE WAR ON POVERTY Sheldon Danziger President, Russell Sage Foundation Grantmakers Income Security Task Force February 27, 2014 Declaration of War On Poverty President Johnson declared an unconditional
Chapter One: people & demographics
 Chapter One: people & demographics The composition of Alberta s population is the foundation for its post-secondary enrolment growth. The population s demographic profile determines the pressure points
RACIAL-ETHNIC DIVERSITY AND SOCIOECONOMIC PROSPERITY IN U.S. COUNTIES
 RACIAL-ETHNIC DIVERSITY AND SOCIOECONOMIC PROSPERITY IN U.S. COUNTIES Luke T. Rogers, Andrew Schaefer and Justin R. Young * University of New Hampshire EXTENDED ABSTRACT Submitted to the Population Association
The Dynamics of Low Wage Work in Metropolitan America. October 10, For Discussion only
 The Dynamics of Low Wage Work in Metropolitan America October 10, 2008 For Discussion only Joseph Pereira, CUNY Data Service Peter Frase, Center for Urban Research John Mollenkopf, Center for Urban Research
The Changing Racial and Ethnic Makeup of New York City Neighborhoods
 The Changing Racial and Ethnic Makeup of New York City Neighborhoods State of the New York City s Property Tax New York City has an extraordinarily diverse population. It is one of the few cities in the
A Regional Comparison Minneapolis Saint Paul Regional Economic Development Partnership
 Greater MSP Baltimore A Regional Comparison Minneapolis Saint Paul Regional Economic Development Partnership TOP EMPLOYERS IN AND MSA GREATER MSP EMPLOYER EMPLOYEES EMPLOYER EMPLOYEES Target Corp. 26,694
The Racial Dimension of New York s Income Inequality
 The Racial Dimension of New York s Income Inequality Data Brief, March 2017 It is well-known that New York State has one of the highest degrees of income inequality among all fifty states, and that the
Pulling Open the Sticky Door
 Pulling Open the Sticky Door Social Mobility among Latinos in Nebraska Lissette Aliaga-Linares Social Demographer Office of Latino/Latin American Studies (OLLAS) University of Nebraska at Omaha Overview
Provincial Review 2016: Western Cape
 Provincial Review 2016: Western Cape The Western Cape s real economy is dominated by manufacturing and commercial agriculture. As a result, while it did not benefit directly from the commodity boom, it
 www.actrochester.org Monroe County General Overview Monroe County is the region s urban center and reflects the highs and lows, and stark disparities, of the Finger Lakes region. It has the most educated
COLORADO LOTTERY 2014 IMAGE STUDY
 COLORADO LOTTERY 2014 IMAGE STUDY AUGUST 2014 Prepared By: 3220 S. Detroit Street Denver, Colorado 80210 303-296-8000 howellreserach@aol.com CONTENTS SUMMARY... 1 I. INTRODUCTION... 7 Research Objectives...
Rural America At A Glance
 Rural America At A Glance 7 Edition Between July 5 and July 6, the population of nonmetro America grew.6 percent. Net domestic migration from metro areas accounted for nearly half of this growth. Gains
Characteristics of Poverty in Minnesota
 Characteristics of Poverty in Minnesota by Dennis A. Ahlburg P overty and rising inequality have often been seen as the necessary price of increased economic efficiency. In this view, a certain amount
COMMUNITY SNAPSHOT A REPORT ON THE ECONOMIC AND SOCIAL WELL-BEING
 ADVERTISING SUPPLEMENT COMMUNITY SNAPSHOT A REPORT ON THE ECONOMIC AND SOCIAL WELL-BEING OF THE NATIONAL CAPITAL AREA MAY 2013 FIRST EDITION Prepared for United Way of the National Capital Area by the
COMPARATIVE ANALYSIS OF METROPOLITAN CONTEXTS: ANNIE E. CASEY FOUNDATION CITIES
 ANNIE E. CASEY FOUNDATION MAKING CONNECTIONS INITIATIVE COMPARATIVE ANALYSIS OF METROPOLITAN CONTEXTS: ANNIE E. CASEY FOUNDATION CITIES G. Thomas Kingsley and Kathryn L.S. Pettit December 3 THE URBAN INSTITUTE
Demographics. Chapter 2 - Table of contents. Environmental Scan 2008
 Environmental Scan 2008 2 Ontario s population, and consequently its labour force, is aging rapidly. The province faces many challenges related to a falling birth rate, an aging population and a large
Rural Life Today. by Robin Kimbrough-Melton
 Institute on Family & Neighborhood Life Rural Life Today by Robin Kimbrough-Melton Fact Sheet FAMILY TRENDS Family life in rural America is often associated with the traditional, two-parent family. Although
CURRENT ANALYSIS. Growth in our own backyard... March 2014
 93619 CURRENT ANALYSIS March 14 Composition of the Canadian population % of total adult population 15+ 8 6 4 2 14.1.9 14.9 42.5 * Labour Force Participation Rate % of Population in the Labour Force 69
University of California Institute for Labor and Employment
 University of California Institute for Labor and Employment The State of California Labor, 2002 (University of California, Multi-Campus Research Unit) Year 2002 Paper Weir Income Polarization and California
New Patterns in US Immigration, 2011:
 Jeffrey S. Passel Pew Hispanic Center Washington, DC Immigration Reform: Implications for Farmers, Farm Workers, and Communities University of California, DC Washington, DC 12-13 May 2011 New Patterns
Growth in the Foreign-Born Workforce and Employment of the Native Born
 Report August 10, 2006 Growth in the Foreign-Born Workforce and Employment of the Native Born Rakesh Kochhar Associate Director for Research, Pew Hispanic Center Rapid increases in the foreign-born population
OLDER INDUSTRIAL CITIES
 Renewing America s economic promise through OLDER INDUSTRIAL CITIES Executive Summary Alan Berube and Cecile Murray April 2018 BROOKINGS METROPOLITAN POLICY PROGRAM 1 Executive Summary America s older
Poverty in New York City, 2005: More Families Working, More Working Families Poor
 : More Families Working, More Working Families Poor A CSS Annual Report September 2006 Mark Levitan, Senior Policy Analyst After four consecutive increases, the nation s poverty rate has stabilized at
Facts & Figures in this issue: income employment growth trends baby boomers millennials immigration
 Facts & Figures in this issue: income employment growth trends baby boomers millennials immigration 2017 Baby Boomers The term baby boomer refers to individuals born in the United States between 1946 and
Why disaggregate data on U.S. children by immigrant status? Some lessons from the diversitydatakids.org project
 Why disaggregate data on U.S. children by immigrant status? Some lessons from the diversitydatakids.org project Dolores Acevedo-Garcia, PhD, MPA-URP Samuel F. and Rose B. Gingold Professor of Human Development
THE WORKMEN S CIRCLE SURVEY OF AMERICAN JEWS. Jews, Economic Justice & the Vote in Steven M. Cohen and Samuel Abrams
 THE WORKMEN S CIRCLE SURVEY OF AMERICAN JEWS Jews, Economic Justice & the Vote in 2012 Steven M. Cohen and Samuel Abrams 1/4/2013 2 Overview Economic justice concerns were the critical consideration dividing
The Trends of Income Inequality and Poverty and a Profile of
 http://www.info.tdri.or.th/library/quarterly/text/d90_3.htm Page 1 of 6 Published in TDRI Quarterly Review Vol. 5 No. 4 December 1990, pp. 14-19 Editor: Nancy Conklin The Trends of Income Inequality and
Ghana Lower-middle income Sub-Saharan Africa (developing only) Source: World Development Indicators (WDI) database.
 Source: World Development Indicators (WDI) database.") Knowledge for Development Ghana in Brief October 215 Poverty and Equity Global Practice Overview Poverty Reduction in Ghana Progress and Challenges A tale of success Ghana has posted a strong growth performance
Knowledge for Development Ghana in Brief October 215 Poverty and Equity Global Practice Overview Poverty Reduction in Ghana Progress and Challenges A tale of success Ghana has posted a strong growth performance
Part 1: Focus on Income. Inequality. EMBARGOED until 5/28/14. indicator definitions and Rankings
 Part 1: Focus on Income indicator definitions and Rankings Inequality STATE OF NEW YORK CITY S HOUSING & NEIGHBORHOODS IN 2013 7 Focus on Income Inequality New York City has seen rising levels of income
A Barometer of the Economic Recovery in Our State
 THE WELL-BEING OF NORTH CAROLINA S WORKERS IN 2012: A Barometer of the Economic Recovery in Our State By ALEXANDRA FORTER SIROTA Director, BUDGET & TAX CENTER. a project of the NORTH CAROLINA JUSTICE CENTER
Demographic, Social, and Economic Trends for Young Children in California
 Occasional Papers Demographic, Social, and Economic Trends for Young Children in California Deborah Reed Sonya M. Tafoya Prepared for presentation to the California Children and Families Commission October
Internal Migration to the Gauteng Province
 Internal Migration to the Gauteng Province DPRU Policy Brief Series Development Policy Research Unit University of Cape Town Upper Campus February 2005 ISBN 1-920055-06-1 Copyright University of Cape Town
3Demographic Drivers. The State of the Nation s Housing 2007
 3Demographic Drivers The demographic underpinnings of long-run housing demand remain solid. Net household growth should climb from an average 1.26 million annual pace in 1995 25 to 1.46 million in 25 215.
THE AMERICAN POLITICAL LANDSCAPE
 THE AMERICAN POLITICAL LANDSCAPE I. The 2008 election proved that race, gender, age and religious affiliation were important factors; do race, gender and religion matter in American politics? YES! a. ETHNOCENTRISM-
Gone to Texas: Migration Vital to Growth in the Lone Star State. Pia Orrenius Federal Reserve Bank of Dallas June 27, 2018
 Gone to Texas: Migration Vital to Growth in the Lone Star State Pia Orrenius Federal Reserve Bank of Dallas June 27, 2018 Roadmap History/Trends in migration to Texas Role in economic growth Domestic migration
FOR IMMEDIATE RELEASE
 ! FOR IMMEDIATE RELEASE May 3, 2018 Contact: Sage Welch 415.453.0430 New studies track low-wage earners fleeing California, even as the number of low-paying jobs increase High-wage earners continue to
Poverty in Wisconsin
 Poverty in Wisconsin Sikh Temple May 23, 2015 Ken Taylor Wisconsin Council on Children and Families Robert Kraig Citizen Action of Wisconsin Education Fund 1 American Poverty Ideology Faith in markets
Heading in the Wrong Direction: Growing School Segregation on Long Island
 Heading in the Wrong Direction: Growing School Segregation on Long Island January 2015 Heading in the Wrong Direction: Growing School Segregation on Long Island MAIN FINDINGS Based on 2000 and 2010 Census
Report Finds that Worcester s Foreign-Born Are Major Economic Contributors
 September 28, 2015 FOR IMMEDIATE RELEASE Report Finds that Worcester s Foreign-Born Are Major Economic Contributors UMass report finds local immigrants play a large and critical role in the local economy
Recent Demographic Trends in Nonmetropolitan America: First Evidence from the 2010 Census Executive Summary
 Recent Demographic Trends in Nonmetropolitan America: First Evidence from the 2010 Census Executive Summary Kenneth M. Johnson Department of Sociology and Carsey Institute University of New Hampshire This
The State of Working Wisconsin 2017
 The State of Working Wisconsin 2017 Facts & Figures Facts & Figures Laura Dresser and Joel Rogers INTRODUCTION For more than two decades now, annually, on Labor Day, COWS reports on how working people
Hispanic Population Growth and Rural Income Inequality
 Hispanic Population and Rural Income Inequality Emilio Parrado, Department of Sociology, Duke University William Kandel, Economic Research Service, U.S. Department of Agriculture September 2006 Draft version:
Openness and Poverty Reduction in the Long and Short Run. Mark R. Rosenzweig. Harvard University. October 2003
 Openness and Poverty Reduction in the Long and Short Run Mark R. Rosenzweig Harvard University October 2003 Prepared for the Conference on The Future of Globalization Yale University. October 10-11, 2003
The Brookings Institution Metropolitan Policy Program Bruce Katz, Director
 The Brookings Institution Metropolitan Policy Program Bruce Katz, Director State of the World s Cities: The American Experience Delivering Sustainable Communities Summit February 1st, 2005 State of the
The State of Rural Minnesota, 2019
 P.O. Box 3185 Mankato, MN 56002-3185 (507)934-7700 www.ruralmn.org The State of Rural Minnesota, 2019 January 2019 By Kelly Asche, Research Associate Each year, the Center for Rural Policy and Development
Baby Boom Migration Tilts Toward Rural America
 Baby Boom Migration Tilts Toward Rural America VOLUME 7 ISSUE 3 John Cromartie jbc@ers.usda.gov Peter Nelson Middlebury College 16 AMBER WAVES The size and direction of migration patterns vary considerably
OVERVIEW. Demographic Trends. Challenges & Opportunities. Discussion
 People on the Move James H. Johnson, Jr. Frank Hawkins Kenan Institute of Private Enterprise Kenan-Flagler Business School University of North Carolina at Chapel Hill January 2017 OVERVIEW Demographic
REGIONAL. San Joaquin County Population Projection
 Lodi 12 EBERHARDT SCHOOL OF BUSINESS Business Forecasting Center in partnership with San Joaquin Council of Governments 99 26 5 205 Tracy 4 Lathrop Stockton 120 Manteca Ripon Escalon REGIONAL analyst june
RACE, RESIDENCE, AND UNDEREMPLOYMENT: 50 YEARS IN COMPARATIVE PERSPECTIVE,
 RACE, RESIDENCE, AND UNDEREMPLOYMENT: 50 YEARS IN COMPARATIVE PERSPECTIVE, 1964-2017 Tim Slack, Louisiana State University Brian C. Thiede, Penn State University Leif Jensen, Penn State University Submitted
Planning for the Silver Tsunami:
 Planning for the Silver Tsunami: The Shifting Age Profile of the Commonwealth and Its Implications for Workforce Development H e n r y Renski A NEW DEMOGRAPHIC MODEL PROJECTS A CONTINUING, LONG-TERM SLOWING
Disaggregating SDG indicators by migratory status. Haoyi Chen United Nations Statistics Division
 Disaggregating SDG indicators by migratory status Haoyi Chen United Nations Statistics Division Defining migratory status Step 1. Country of birth or citizenship Country of birth: foreign-born vs native
London Measured. A summary of key London socio-economic statistics. City Intelligence. September 2018
 A summary of key socio-economic statistics September 2018 People 1. Population 1.1 Population Growth 1.2 Migration Flow 2. Diversity 2.1 Foreign-born ers 3. Social Issues 3.1 Poverty & Inequality 3.2 Life
Making the Case for Multicultural Education in Utah: Utah s Demographic Transformation
 Making the Case for Multicultural Education in Utah: Utah s Demographic Transformation Utah Reach Training Utah State Office of Education May 8, 2009 Pamela S. Perlich, Ph.D. University of Utah Utah s
Migration, Mobility, Urbanization, and Development. Hania Zlotnik
 Migration, Mobility, Urbanization, and Development Hania Zlotnik SSRC Migration & Development Conference Paper No. 22 Migration and Development: Future Directions for Research and Policy 28 February 1
California s Congressional District 37 Demographic Sketch
 4.02.12 California s Congressional District 37 Demographic Sketch MANUEL PASTOR JUSTIN SCOGGINS JARED SANCHEZ Purpose Demographic Sketch Understand the Congressional District s population and its unique
Abstract. Acknowledgments
 Racial/Ethnic Minorities in Rural Areas: Progress and Stagnation, 1980-90. By Linda L. Swanson (ed.), Rural Economy Division, Economic Research Service, U.S. Department of Agriculture. Agricultural Economic
EMBARGOED UNTIL THURSDAY 9/5 AT 12:01 AM
 EMBARGOED UNTIL THURSDAY 9/5 AT 12:01 AM Poverty matters No. 1 It s now 50/50: chicago region poverty growth is A suburban story Nationwide, the number of people in poverty in the suburbs has now surpassed
Attitudes toward Immigration: Iowa Republican Caucus-Goers
 November 0 Survey Attitudes toward Immigration: Iowa Republican Caucus-Goers Partnership for a New American Economy Methodology: Survey Sample frame: Sample size: Weighting: Margin of error: Method/length:
Socio-Economic Mobility Among Foreign-Born Latin American and Caribbean Nationalities in New York City,
 Socio-Economic Mobility Among Foreign-Born Latin American and Caribbean Nationalities in New York City, 2000-2006 Center for Latin American, Caribbean & Latino Studies Graduate Center City University of
Towards a Policy Actionable Analysis of Geographic and Racial Health Disparities
 Towards a Policy Actionable Analysis of Geographic and Racial Health Disparities Institute of Medicine July 30, 2007 Dolores Acevedo-Garcia, PhD, MPA-URP Associate Professor With funding from W. K. Kellogg
Regional Trends in the Domestic Migration of Minnesota s Young People
 HOUSE RESEARCH & STATE DEMOGRAPHIC CENTER A Changing Minnesota Sean Williams, House Research Susan Brower, Minnesota State Demographic Center September 2018 Regional Trends in the Domestic Migration of
ANNUAL SURVEY REPORT: BELARUS
 ANNUAL SURVEY REPORT: BELARUS 2 nd Wave (Spring 2017) OPEN Neighbourhood Communicating for a stronger partnership: connecting with citizens across the Eastern Neighbourhood June 2017 1/44 TABLE OF CONTENTS
SECTION 1. Demographic and Economic Profiles of California s Population
 SECTION 1 Demographic and Economic Profiles of s Population s population has special characteristics compared to the United States as a whole. Section 1 presents data on the size of the populations of
Chapter 1: The Demographics of McLennan County
 Chapter 1: The Demographics of McLennan County General Population Since 2000, the Texas population has grown by more than 2.7 million residents (approximately 15%), bringing the total population of the
Russians Support Putin's Re-Nationalization of Oil, Control of Media, But See Democratic Future
 Russians Support Putin's Re-Nationalization of Oil, Control of Media, But See Democratic Future July 10, 2006 Americans Endorse Russia's G-8 Membership, Are Optimistic about Democracy in Russia Russian