Climate Change Around the World
|
|
|
- Horace Horton
- 6 years ago
- Views:
Transcription
1 Climate Change Around the World Per Krusell Institute for International Economic Studies, NBER, CEPR Anthony A. Smith, Jr. Yale University, NBER Walras-Bowley Lecture Econometric Society World Congress Montréal Août, 215
2
3 The project Construct global model of economy-climate interactions featuring a high degree of geographic resolution (1 1 regions). Use the model as a laboratory to quantify the distributional effects of climate change and climate policy. If a set of regions imposes a carbon tax (or a quantity restriction on emissions), how does the path of global emissions respond? Which regions gain and which lose, and by how much?
4 The data Unit of analysis: 1 1 cells containing land. The model contains 19, regions (or cell-countries). Nordhaus s G-Econ database: gross domestic product (GDP) and population for all such cells in 199, 1995, 2, and 25. Matsuura and Willmott: gridded (.5.5 ) monthly terrestrial temperature data for
5 Global average land temperature (by year) Year
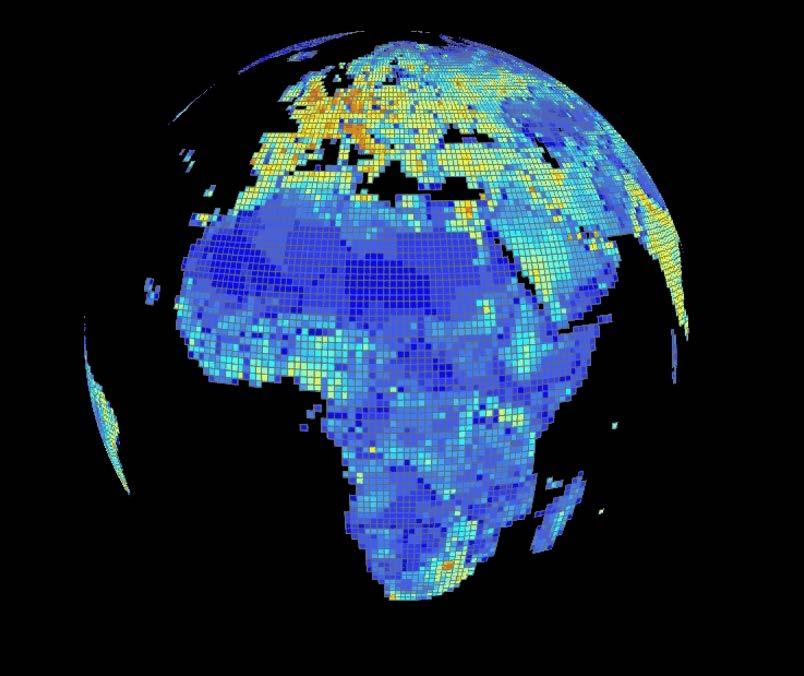
6 Nordhaus s G-Econ globe with output by regions

7
8
9 same data on our map
10 Log of GDP in Latitude Longitude
11 temperature map of the world
12 Average temperature ( ) Latitude Longitude
13 Natural-science background I: the climate What determines the earth s surface temperature, T s? Energy balance: energy in = energy out. With no atmosphere (treat the Earth as a blackbody ): πr 2 (1 α)i = 4πR 2 σt 4 s, where I is the solar flux intensity, α is Earth s albedo, R is the Earth s radius, and σ is the Stefan-Boltzmann constant. T s is the price that equilibrates the two energy flows. Plug in the constants and solve for T s : Earth too cold by 3 degrees.
14 Natural-science background I: the climate (cont d) The (single) layer model with an opaque atmosphere. Short-wave solar radiation penetrates the atmosphere, but long-wave radiation emitted by the Earth s surface does not. Energy balance for the atmosphere: energy radiated by surface = 2 energy radiated by atmosphere (depends on T 4 a ). Energy balance for the surface: incoming solar energy + energy radiated by atmosphere = energy radiated by surface (depends on T 4 s ). Solve the two equations for T s and T a : Earth s surface too warm by 18 degrees.
15 Natural-science background I: the climate (cont d) The atmosphere is semi-opaque: only part of it consists of greenhouse gases which trap long-wave radiation. Forcing, F, from CO 2 in the atmosphere (relative to pre-industrial) is: F = η ln(s/ S) ln(2), where S = 84GtC and S = 6GtC are current and pre-industrial stocks. Equilibrium temperature, T (relative to pre-industrial), is: T = κf = λ ln(s/ S) ln(2), where κ depends on various feedbacks not present in the (simple) layer model. λ 3 ± 1.5 is climate sensitivity.
16 Natural-science background II: the carbon cycle Carbon cycle: how emissions of CO 2 enter/exit atmosphere. Key: emissions spread globally very quickly ( global externality ). Depreciation structure of atmospheric CO 2 : smooth, but very slow; some stays forever in atmosphere nonlinear but linear approximation okay. Emissions: 1GtC/year; S t 4.5GtC/year. Estimated remaining carbon: oil + gas = 3GtC, coal much bigger (> 3,GtC?). So coal is key! To summarize: emissions carbon in atmosphere forcing temperature. Bad if higher T causes damages : the mother of all externalities (Stern).
17 Integrated assessment models Pioneered by Nordhaus (DICE, RICE). Quantitative theory, computational. Key components: climate system (as above) carbon cycle (as above) economic model of emissions AND damages Economic model: needs to be dynamic, forward-looking, possibly allowing stochastics (temperature variations, disasters). Here: climate system more elaborate (regional variation) economic model and damages new.
18 Some relevant background from past work Model development: a number of our earlier papers on this can be viewed as pilot studies for present work in particular, Golosov, Hassler, K, and Tsyvinski (GHKT; Econometrica, 214) develops simple one-sector DSGE setting. Build present structure on earlier insights: one-region version of present model very close to GHKT.
19 Overview for remainder of talk 1. our climate modeling 2. our damage specification 3. economic model 4. calibration, computation 5. results 6. conclusions, future
20 Our climate modeling How will region l s climate respond to global warming? Answer given by complex global and regional climate models. But not feasible to combine these with economic model. Therefore, use pattern scaling (aka statistical downscaling ): statistical description of temperature in a given region as a function of a single state variable average global temperature. Capture sensitivity of temperature in region l to global temperature T in a coefficent (linear structure; standard). With help of climate scientists, use runs of (highly) complex climate models into the future to estimate sensitivities.
21 global map with estimated sensitivities: how much temperature goes up everywhere if T rises by one degree
22 Sensitivity to changes in global temperature Latitude Longitude
23 Our damage specification What are the damages in region l as a result of global warming? Damage measurements: overall, weakest part of quantitative climate-economy models, especially for regional damages. Our approach: formulate a damage function D of local temperature that is: common across all l; like Nordhaus s, a TFP drag; and U-shaped, with three parameters which are estimated to match, when aggregated across all l, the global damages estimated by Nordhaus: Nordhaus s formulation: convex three points used: at 1 degree centigrade,.3% output drag; at 2.5, 1.8%; and at 5, 6.8%. Nordhaus s global estimates not much different from those of others (IPCC has recent summary). Desmet and Rossi-Hansberg (214) also use a common U-shape in a spatial application.
24 picture of 1 minus estimated U-shaped damage function, as function of local temperature
25 Damage function: productivity vs. temperature 1.75 Fraction of optimum Temperature (degrees centigrade)
26 gdp distribution across temperatures (you see that most output is near the optimum)
27 Share of world GDP vs. temperature Share of GDP Temperature (degrees centigrade)
28 population distribution across temperatures (similar graph, but less concentrated near optimum)
29 Share of world population vs. temperature Share of population Temperature (degrees centigrade)
30 gdp distribution across 1 minus damages
31 Share of world GDP vs. productivity (as a fraction of optimum) Share of GDP Productivity
32 population distribution across 1 minus damages
33 Share of world population vs. productivity (as a fraction of optimum) Share of population Productivity
34 global map with 1 minus damage coefficients
35 Damage coefficient x 1 (at temperature in ) Latitude Longitude
36 The economic model Forward-looking consumers and firms in each region determine their consumption, saving, and energy use. No migration. Neoclassical production technologies, different TFPs both exogenously and due to climate. Energy as an input: coal, produced locally, at constant marginal cost (no profits). Coal slowly, exogenously replaced by (same-cost) green tech. Market structure: two cases. Autarky (regions only linked via emission externality). Unrestricted borrowing/lending (world interest rate clears market). Summary: like Aiyagari (1994) and our previous work, though no shocks in this version. Adaptation: consumption smoothing and, in case with international markets, capital mobility ( leakage ).
37 Regional problem In a recursive equilibrium, region l solves v t (ω, A, k, S; l) = max k,b [U(c) + β v t+1(ω, A, k, S ; l)], s.t. c = ω k q t ( k, S)b ω = max e [F (k, (1 D(T l (S )))A, e ) pe )] + (1 δ)k + b A = (1 + g)a k = H t ( k, S) S = Φ t ( k, S ). Can be interpreted as decentralized equilibrium. Set up to deal with shocks, aggregate and/or local.
38 Calibration Annual time step, log utility, δ = 1%, g = 1%, β =.985. Production function F is CES in k α ((1 D)AL) 1 α and Be, with elasticity.1 (we do robustness) and α =.36. Initial distribution of region-specific capital and level of productivity chosen to: (1) match regional GDP per capita in 199 and; (2) equalize MPK across regions. Price of coal and B chosen to match: (1) total carbon emissions in 199; and (2) energy share of 5% along a balanced growth path. Green energy replaces coal slowly (logistic).
39 Carbon cycle The total stock of atmospheric carbon, S t, is the sum of a permanent stock, S 1t, and a (slowly) depreciating stock, S 2t : S t = S 1t + S 2t. S 1t =.25E t + S 1,t 1, where E t is total carbon emissions. S 2t =.36(1.25)E t +.998S 2,t 1. Half-life of a freshly-emitted unit of carbon is 3 years; half-life of the depreciating stock (given no new emissions) is 3 years.
40 Computation Richard Feynman: Imagine how much harder physics would be if electrons had feelings! Transition + heterogeneity = nontrivial fixed-point problem: guess on a temperature path, solve backwards for decisions, run globe forwards to confirm guessed path. Use mostly well-known methods but heterogeneity vast: exogenous TFP wealth/capital l captures entire path of future regional TFP endogenous to climate (this feature NOT one-dimensional); we don t actually solve 19,235 DP problems but so much heterogeneity that we need to solve 7 DPs and then nonlinearly interpolate decision rules between 7 types. Fortran 9 + OpenMP with 2 cores: less than five minutes.
41 Experiments Laissez-faire. Main policy experiment: all regions impose a modest common carbon tax, financed locally (no transfers implied). Throughout: focus on relative effects, not aggregates.
42 Main findings Climate change affects regions very differently. Stakes big at regional level. Though a tax on carbon would affect welfare positively in some average sense, there is a large disparity of views across regions (55% of regions gain, while 45% lose). Findings almost identical for two extreme market structures (autarky and international capital markets).
43 behavior of aggregates over time
44 Gigatons of atmospheric carbon (no taxes; free capital movement) 1991 Gigatons of carbon Year
45 Gigatons of atmospheric carbon (taxes vs. no taxes; free capital movement) 1991 Gigatons of carbon Year
46 Temperature (degrees centrigrade above pre indudstrial) (no taxes; free capital movement) Degrees centigrade Year
47 Temperature (degrees centrigrade above pre indudstrial) (taxes vs. no taxes; free capital movement) Degrees centigrade Year
48 World GDP (trillions of dollars; detrended) (no taxes; free capital movement) Trillions of dollars Year
49 World GDP (trillions of dollars; detrended) (taxes vs. no taxes; free capital movement) Trillions of dollars Year
50 World consumption (trillions of dollars; detrended) (no taxes; free capital movement) Trillions of dollars Year
51 World consumption (trillions of dollars; detrended) (taxes vs. no taxes; free capital movement) Trillions of dollars Year
52 Global emissions of atmospheric carbon (in gigatons) (no taxes; free capital movement) Gigatons of carbon Year
53 Global emissions of atmospheric carbon (in gigatons) (taxes vs. no taxes; free capital movement) Gigatons of carbon Year
54 movie: distribution of mpks
55 Distribution of marginal product of capital in 1999 (triangle = unweighted; circle = weighted by GDP) Marginal product of capital
56 Distribution of marginal product of capital in 29 (triangle = unweighted; circle = weighted by GDP) Marginal product of capital
57 Distribution of marginal product of capital in 219 (triangle = unweighted; circle = weighted by GDP) Marginal product of capital
58 Distribution of marginal product of capital in 229 (triangle = unweighted; circle = weighted by GDP) Marginal product of capital
59 Distribution of marginal product of capital in 239 (triangle = unweighted; circle = weighted by GDP) Marginal product of capital
60 Distribution of marginal product of capital in 249 (triangle = unweighted; circle = weighted by GDP) Marginal product of capital
61 Distribution of marginal product of capital in 259 (triangle = unweighted; circle = weighted by GDP) Marginal product of capital
62 Distribution of marginal product of capital in 269 (triangle = unweighted; circle = weighted by GDP) Marginal product of capital
63 Distribution of marginal product of capital in 279 (triangle = unweighted; circle = weighted by GDP) Marginal product of capital
64 Distribution of marginal product of capital in 289 (triangle = unweighted; circle = weighted by GDP) Marginal product of capital
65 Distribution of marginal product of capital in 299 (triangle = unweighted; circle = weighted by GDP) Marginal product of capital
66 Distribution of marginal product of capital in 219 (triangle = unweighted; circle = weighted by GDP) Marginal product of capital
67 Distribution of marginal product of capital in 2119 (triangle = unweighted; circle = weighted by GDP) Marginal product of capital
68 Distribution of marginal product of capital in 2129 (triangle = unweighted; circle = weighted by GDP) Marginal product of capital
69 Distribution of marginal product of capital in 2139 (triangle = unweighted; circle = weighted by GDP) Marginal product of capital
70 Distribution of marginal product of capital in 2199 (triangle = unweighted; circle = weighted by GDP) Marginal product of capital
71 Distribution of marginal product of capital in 2299 (triangle = unweighted; circle = weighted by GDP) Marginal product of capital
72 movie: percentage change in gdp, laissez-faire
73 Percentage change in GDP: 2 vs Latitude Longitude
74 Percentage change in GDP: 21 vs Latitude Longitude
75 Percentage change in GDP: 22 vs Latitude Longitude

76 Percentage change in GDP: 23 vs Latitude Longitude
77 Percentage change in GDP: 24 vs Latitude Longitude
78 Percentage change in GDP: 25 vs Latitude Longitude
79 Percentage change in GDP: 26 vs Latitude Longitude
80 Percentage change in GDP: 27 vs Latitude Longitude
81 Percentage change in GDP: 28 vs Latitude Longitude
82 Percentage change in GDP: 29 vs Latitude Longitude
83 Percentage change in GDP: 21 vs Latitude Longitude
84 Percentage change in GDP: 211 vs Latitude Longitude
85 Percentage change in GDP: 212 vs Latitude Longitude
86 Percentage change in GDP: 213 vs Latitude Longitude
87 Percentage change in GDP: 214 vs Latitude Longitude
88 Percentage change in GDP: 215 vs Latitude Longitude
89 Percentage change in GDP: 216 vs Latitude Longitude
90 Percentage change in GDP: 217 vs Latitude Longitude
91 Percentage change in GDP: 218 vs Latitude Longitude
92 Percentage change in GDP: 219 vs Latitude Longitude
93 Percentage change in GDP: 22 vs Latitude Longitude
94 movie: level change in gdp, laissez-faire
95 Change in GDP (in millions of $): 2 vs Latitude Longitude
96 Change in GDP (in millions of $): 21 vs Latitude Longitude
97 Change in GDP (in millions of $): 22 vs Latitude Longitude
98 Change in GDP (in millions of $): 23 vs Latitude Longitude
99 Change in GDP (in millions of $): 24 vs Latitude Longitude
100 Change in GDP (in millions of $): 25 vs Latitude Longitude
101 Change in GDP (in millions of $): 26 vs Latitude Longitude
102 Change in GDP (in millions of $): 27 vs Latitude Longitude
103 Change in GDP (in millions of $): 28 vs Latitude Longitude
104 Change in GDP (in millions of $): 29 vs Latitude Longitude
105 Change in GDP (in millions of $): 21 vs Latitude Longitude
106 Change in GDP (in millions of $): 211 vs Latitude Longitude
107 Change in GDP (in millions of $): 212 vs Latitude Longitude
108 Change in GDP (in millions of $): 213 vs Latitude Longitude
109 Change in GDP (in millions of $): 214 vs Latitude Longitude
110 Change in GDP (in millions of $): 215 vs Latitude Longitude
111 Change in GDP (in millions of $): 216 vs Latitude Longitude
112 Change in GDP (in millions of $): 217 vs Latitude Longitude
113 Change in GDP (in millions of $): 218 vs Latitude Longitude
114 Change in GDP (in millions of $): 219 vs Latitude Longitude
115 Change in GDP (in millions of $): 22 vs Latitude Longitude
116 pictures: map (and histogram) of winners and losers from tax, full equalization (then autarky)
117 Welfare gains from taxation (with free capital movement) Latitude Longitude
118 Welfare gains from taxation (in autarchy) Latitude Longitude
119 Welfare gains from taxation (with free movement) (as a percentage of consumption) Fraction Percentage of consumption
120 Welfare gains from taxation (in autarchy) (as a percentage of consumption) Fraction Percentage of consumption
121 Welfare changes from tax: summary measures One region = one vote: 55% gain. One person = one vote: 83% gain. One dollar = one vote: 65% gain. Average gain across all regions:.81% (of consumption). Average gain weighted by regional GDP:.14%. Average gain weighted by regional population:.46%. World consumption path: gain of.3%.
122 picture: welfare gains from free capital movements (laissez-faire)
123 Welfare gains from free capital movement (without taxes) (as a percentage of consumption) Fraction Percentage of consumption
124 picture: differences in gains from taxation (autarky vs. free capital movements)
125 Difference in gains from taxation (autarchy vs. free movement) (as a percentage of consumption).3673 Fraction Percentage of consumption
126 movie: percentage change in gdp, taxes
127 Percentage change in GDP: 2 vs Latitude Longitude
128 Percentage change in GDP: 21 vs Latitude Longitude
129 Percentage change in GDP: 22 vs Latitude Longitude
130 Percentage change in GDP: 23 vs Latitude Longitude
131 Percentage change in GDP: 24 vs Latitude Longitude
132 Percentage change in GDP: 25 vs Latitude Longitude
133 Percentage change in GDP: 26 vs Latitude Longitude
134 Percentage change in GDP: 27 vs Latitude Longitude
135 Percentage change in GDP: 28 vs Latitude Longitude
136 Percentage change in GDP: 29 vs Latitude Longitude
137 Percentage change in GDP: 21 vs Latitude Longitude
138 Percentage change in GDP: 211 vs Latitude Longitude
139 Percentage change in GDP: 212 vs Latitude Longitude
140 Percentage change in GDP: 213 vs Latitude Longitude
141 Percentage change in GDP: 214 vs Latitude Longitude
142 Percentage change in GDP: 215 vs Latitude Longitude
143 Percentage change in GDP: 216 vs Latitude Longitude
144 Percentage change in GDP: 217 vs Latitude Longitude
145 Percentage change in GDP: 218 vs Latitude Longitude
146 Percentage change in GDP: 219 vs Latitude Longitude
147 Percentage change in GDP: 22 vs Latitude Longitude
148 Conclusions Take-away: Results from our model: climate change is about relative effects much more than about average effects! In particular, large disagreements about taxes (so large transfer payments needed to compensate those losing from carbon tax). Methodological insight: we thought the market structure (because it admits more or less adaptation) would be important for the results, but it isn t.
149 Some caveats On one hand, damages too local and symmetric: no common aggregate damages. There are potentially such effects: world technology development (level or growth) can be impacted; biodiversity, ocean acidification,... ; spillovers through trade, migration, tourism,... On other hand, maybe not enough regional heterogeneity yet (rural vs. urban, manufacturing vs. agriculture,... ).
150 Near-future follow-up Within present model/paper: Heterogeneous taxes (results for tax in U.S. and China only). How does climate change influence migration pressure at borders? Easy to compute. (PICTURE!) Sea-level rise and coastal damages (straightforward to incorporate). Applications: Temperature shocks; can be problematic at higher T s because of extreme weather events (programming under way). Rising volatility as globe warms. Agricultural sector and food supplies (includes adding precipitation)....
151 Welfare changes from tax: summary measures One region = one vote: 55% gain (vs. 55%) One person = one vote: 62% gain (vs. 83%). One dollar = one vote: 7% gain (vs. 65%) Average gain across all regions:.18% (vs..81%). Average gain weighted by GDP:.4% (vs..14%). Average gain weighted by population:.12% (vs..46%). World consumption path: gain of.7% (vs..3%). 3% of regions in U.S. gain (vs. 42%). 7% of regions in China gain (vs. 3%). 62% of regions in ROW gain (vs. 57%).
152 Log of lifetime wealth (per effective unit of labor) Latitude Longitude
Climate Change Around the World
 Climate Change Around the World Per Krusell Institute for International Economic Studies, NBER, CEPR Joint with Anthony A. Smith, Jr. Yale University, NBER World Congress Montréal Août, 215 The project
Climate Change Around the World
 Climate Change Around the World Per Krusell Institute for International Economic Studies, NBER, CEPR Anthony A. Smith, Jr. Yale University, NBER The Macro and Micro Economics of Climate Change Laboratory
A Global Economy-Climate Model with High Regional Resolution
 A Global Economy-Climate Model with High Regional Resolution Per Krusell Institute for International Economic Studies, CEPR, NBER Anthony A. Smith, Jr. Yale University, NBER February 6, 2015 The project
Trading Goods or Human Capital
 Trading Goods or Human Capital The Winners and Losers from Economic Integration Micha l Burzyński, Université catholique de Louvain, IRES Poznań University of Economics, KEM michal.burzynski@uclouvain.be
The Costs of Remoteness, Evidence From German Division and Reunification by Redding and Sturm (AER, 2008)
") The Costs of Remoteness, Evidence From German Division and Reunification by Redding and Sturm (AER, 2008) MIT Spatial Economics Reading Group Presentation Adam Guren May 13, 2010 Testing the New Economic
The Costs of Remoteness, Evidence From German Division and Reunification by Redding and Sturm (AER, 2008) MIT Spatial Economics Reading Group Presentation Adam Guren May 13, 2010 Testing the New Economic
Migrant Wages, Human Capital Accumulation and Return Migration
 Migrant Wages, Human Capital Accumulation and Return Migration Jérôme Adda Christian Dustmann Joseph-Simon Görlach February 14, 2014 PRELIMINARY and VERY INCOMPLETE Abstract This paper analyses the wage
Firm Dynamics and Immigration: The Case of High-Skilled Immigration
 Firm Dynamics and Immigration: The Case of High-Skilled Immigration Michael E. Waugh New York University, NBER April 28, 2017 0/43 Big Picture... How does immigration affect relative wages, output, and
Discussion of "Risk Shocks" by Larry Christiano
 Discussion of "Risk Shocks" by Larry Christiano Conference Celebrating Tom Sargent & Chris Sims Lee E. Ohanian Minneapolis Fed May, 2012 Ohanian (Institute) Ohanian 10/10 1 / 15 Firm-Level Shifts in Variance
Being a Good Samaritan or just a politician? Empirical evidence of disaster assistance. Jeroen Klomp
 Being a Good Samaritan or just a politician? Empirical evidence of disaster assistance Jeroen Klomp Netherlands Defence Academy & Wageningen University and Research The Netherlands Introduction Since 1970
Rainfall, Financial Development, and Remittances: Evidence from Sub-Saharan Africa
 Rainfall, Financial Development, and Remittances: Evidence from Sub-Saharan Africa by Rabah Arezki and Markus Brückner September 2011 Abstract: We use annual variations in rainfall to examine the effects
EXPORT, MIGRATION, AND COSTS OF MARKET ENTRY EVIDENCE FROM CENTRAL EUROPEAN FIRMS
 Export, Migration, and Costs of Market Entry: Evidence from Central European Firms 1 The Regional Economics Applications Laboratory (REAL) is a unit in the University of Illinois focusing on the development
Wage Rigidity and Spatial Misallocation: Evidence from Italy and Germany
 Wage Rigidity and Spatial Misallocation: Evidence from Italy and Germany Tito Boeri 1 Andrea Ichino 2 Enrico Moretti 3 Johanna Posch 2 1 Bocconi 2 European University Institute 3 Berkeley 10 April 2018
NBER WORKING PAPER SERIES THE MIGRATION RESPONSE TO INCREASING TEMPERATURES. Cristina Cattaneo Giovanni Peri
 NBER WORKING PAPER SERIES THE MIGRATION RESPONSE TO INCREASING TEMPERATURES Cristina Cattaneo Giovanni Peri Working Paper 21622 http://www.nber.org/papers/w21622 NATIONAL BUREAU OF ECONOMIC RESEARCH 1050
Andrew Blowers There is basically then, from what you re saying, a fairly well defined scientific method?
 Earth in crisis: environmental policy in an international context The Impact of Science AUDIO MONTAGE: Headlines on climate change science and policy The problem of climate change is both scientific and
Migrants Networks:An Estimable Model fo Illegal Mexican Immigration. Aldo Colussi
 Migrants Networks:An Estimable Model fo Illegal Mexican Immigration Aldo Colussi 23 This paper analyzes the network effect of the Mexican immigrants in the U.S. The U.S. wage offer probability depends
The Wage Effects of Immigration and Emigration
 The Wage Effects of Immigration and Emigration Frederic Docquier (UCL) Caglar Ozden (World Bank) Giovanni Peri (UC Davis) December 20 th, 2010 FRDB Workshop Objective Establish a minimal common framework
Poverty Reduction and Economic Growth: The Asian Experience Peter Warr
 Poverty Reduction and Economic Growth: The Asian Experience Peter Warr Abstract. The Asian experience of poverty reduction has varied widely. Over recent decades the economies of East and Southeast Asia
ARTNeT Trade Economists Conference Trade in the Asian century - delivering on the promise of economic prosperity rd September 2014
 ASIA-PACIFIC RESEARCH AND TRAINING NETWORK ON TRADE ARTNeT CONFERENCE ARTNeT Trade Economists Conference Trade in the Asian century - delivering on the promise of economic prosperity 22-23 rd September
LDC Urban Climate Change Adaptation: Challenges and Opportunities. Matthew E. Kahn USC and NBER
 LDC Urban Climate Change Adaptation: Challenges and Opportunities Matthew E. Kahn USC and NBER kahnme@usc.edu 1 Introduction Urbanization should bring about poverty reduction through raising economic opportunities
Honors General Exam Part 1: Microeconomics (33 points) Harvard University
 Harvard University") Honors General Exam Part 1: Microeconomics (33 points) Harvard University April 9, 2014 QUESTION 1. (6 points) The inverse demand function for apples is defined by the equation p = 214 5q, where q is the
Honors General Exam Part 1: Microeconomics (33 points) Harvard University April 9, 2014 QUESTION 1. (6 points) The inverse demand function for apples is defined by the equation p = 214 5q, where q is the
The Dynamic Effects of Immigration
 The Dynamic Effects of Immigration Hautahi Kingi November 2015 Abstract I examine the welfare effects of immigration on United States workers. I build a dynamic search and matching model in which immigrants
East Asian Currency Union
 East Asian Currency Union October 2006 Jong-Wha Lee Korea University and Robert J. Barro Harvard University Motivation Are Current Exchange Rate Arrangements in East Asia Appropriate? Before the crisis,
Computerization and Immigration: Theory and Evidence from the United States 1
 Computerization and Immigration: Theory and Evidence from the United States 1 Gaetano Basso (Banca d Italia), Giovanni Peri (UC Davis and NBER), Ahmed Rahman (USNA) BdI-CEPR Conference, Roma - March 16th,
1. Introduction. Michael Finus
 1. Introduction Michael Finus Global warming is believed to be one of the most serious environmental problems for current and hture generations. This shared belief led more than 180 countries to sign the
WORKING PAPERS IN ECONOMICS & ECONOMETRICS. A Capital Mistake? The Neglected Effect of Immigration on Average Wages
 WORKING PAPERS IN ECONOMICS & ECONOMETRICS A Capital Mistake? The Neglected Effect of Immigration on Average Wages Declan Trott Research School of Economics College of Business and Economics Australian
TIME ALLOWED FOR THIS PAPER: MATERIALS REQUIRED FOR THIS PAPER: IMPORTANT NOTE TO CANDIDATES INSTRUCTION TO CANDIDATES AT THE END OF THE EXAMINATION
 TIME ALLOWED FOR THIS PAPER: Reading time before commencing work: Working time for this paper: 10 minutes 1 hour & 45 minutes MATERIALS REQUIRED FOR THIS PAPER: To be provided by the supervisor - This
Inflation and relative price variability in Mexico: the role of remittances
 Applied Economics Letters, 2008, 15, 181 185 Inflation and relative price variability in Mexico: the role of remittances J. Ulyses Balderas and Hiranya K. Nath* Department of Economics and International
Korean Economic Integration: Prospects and Pitfalls
 International Economic Journal Vol. 26, No. 3, September 2012, 471 485 Korean Economic Integration: Prospects and Pitfalls MAX ST. BROWN, SEUNG MO CHOI & HYUNG SEOK KIM School of Economic Sciences, Washington
WhyHasUrbanInequalityIncreased?
 WhyHasUrbanInequalityIncreased? Nathaniel Baum-Snow, Brown University Matthew Freedman, Cornell University Ronni Pavan, Royal Holloway-University of London June, 2014 Abstract The increase in wage inequality
Skill Classification Does Matter: Estimating the Relationship Between Trade Flows and Wage Inequality
 Skill Classification Does Matter: Estimating the Relationship Between Trade Flows and Wage Inequality By Kristin Forbes* M.I.T.-Sloan School of Management and NBER First version: April 1998 This version:
Why Has Urban Inequality Increased?
 Why Has Urban Inequality Increased? Nathaniel Baum-Snow, University of Toronto Matthew Freedman, University of California, Irvine Ronni Pavan, University of Rochester August, 2017 Abstract This paper examines
The Political Economy of Trade Policy
 The Political Economy of Trade Policy 1) Survey of early literature The Political Economy of Trade Policy Rodrik, D. (1995). Political Economy of Trade Policy, in Grossman, G. and K. Rogoff (eds.), Handbook
Female Migration, Human Capital and Fertility
 Female Migration, Human Capital and Fertility Vincenzo Caponi, CREST (Ensai), Ryerson University,IfW,IZA January 20, 2015 VERY PRELIMINARY AND VERY INCOMPLETE Abstract The objective of this paper is to
CENTRO STUDI LUCA D AGLIANO DEVELOPMENT STUDIES WORKING PAPERS N April Export Growth and Firm Survival
 WWW.DAGLIANO.UNIMI.IT CENTRO STUDI LUCA D AGLIANO DEVELOPMENT STUDIES WORKING PAPERS N. 350 April 2013 Export Growth and Firm Survival Julian Emami Namini* Giovanni Facchini** Ricardo A. López*** * Erasmus
The Migration Response to Increasing Temperatures
 The Migration Response to Increasing Temperatures Cristina Cattaneo (FEEM and CMCC) Giovanni Peri (University of California, Davis) October 2, 2015 Abstract Climate change, especially the warming trend
Managing migration from the traditional to modern sector in developing countries
 Managing migration from the traditional to modern sector in developing countries Larry Karp June 21, 2007 Abstract We model the process of migration from a traditional to a modern sector. Migrants from
WEDGES FOR WEDGES: EVALUATING INTERGRATION FROM A NEOCLASSICAL PERSPECTIVE
 WEDGES FOR WEDGES: EVALUATING INTERGRATION FROM A NEOCLASSICAL PERSPECTIVE SHU-SHIUAN LU 1 Department of Economics National Tsing Hua University 101, Section 2, Kuang-Fu Road, Hsinchu 30013, Taiwan Phone
Chapter 4 Specific Factors and Income Distribution
 Chapter 4 Specific Factors and Income Distribution Chapter Organization Introduction The Specific Factors Model International Trade in the Specific Factors Model Income Distribution and the Gains from
The Impact of Foreign Workers on the Labour Market of Cyprus
 Cyprus Economic Policy Review, Vol. 1, No. 2, pp. 37-49 (2007) 1450-4561 The Impact of Foreign Workers on the Labour Market of Cyprus Louis N. Christofides, Sofronis Clerides, Costas Hadjiyiannis and Michel
Educational Choice, Rural-Urban Migration and Economic Development
 Educational Choice, Rural-Urban Migration and Economic Development Pei-Ju Liao Academia Sinica Ping Wang Wash U in STL & NBER Yin-Chi Wang Chinese U of HK Chong Kee Yip Chinese U of HK July 11, 2018 GRIPS,
Phil 108, April 24, 2014 Climate Change
 Phil 108, April 24, 2014 Climate Change The problem of inefficiency: Emissions of greenhouse gases involve a (negative) externality. Roughly: a harm or cost that isn t paid for. For example, when I pay
CRS Report for Congress Received through the CRS Web
 CRS Report for Congress Received through the CRS Web 98-2 ENR Updated July 31, 1998 Global Climate Change Treaty: The Kyoto Protocol Susan R. Fletcher Senior Analyst in International Environmental Policy
Prevention Working Paper. Environmental and climate change policy: a case study in preventative action
 Prevention Working Paper Environmental and climate change policy: a case study in preventative action Michael Jacobs Visiting Professor, Grantham Research Institute on Climate Change and the Environment,
Wage Trends among Disadvantaged Minorities
 National Poverty Center Working Paper Series #05-12 August 2005 Wage Trends among Disadvantaged Minorities George J. Borjas Harvard University This paper is available online at the National Poverty Center
The Analytics of the Wage Effect of Immigration. George J. Borjas Harvard University September 2009
 The Analytics of the Wage Effect of Immigration George J. Borjas Harvard University September 2009 1. The question Do immigrants alter the employment opportunities of native workers? After World War I,
ECONOMIC GROWTH* Chapt er. Key Concepts
 Chapt er 6 ECONOMIC GROWTH* Key Concepts The Basics of Economic Growth Economic growth is the expansion of production possibilities. The growth rate is the annual percentage change of a variable. The growth
The impact of Temporary Events on Spatial Concentration of Population:
 The impact of Temporary Events on Spatial Concentration of Population: Evidence from a large-scale resettlement Aki Kangasharju GOVERNMENT INSTITUTE FOR ECONOMIC RESEARCH (VATT) Is the current regional
TIME ALLOWED FOR THIS PAPER: Reading time before commencing work: MATERIALS REQUIRED FOR THIS PAPER:
 TIME ALLOWED FOR THIS PAPER: Reading time before commencing work: Working time for this paper: 10 minutes 1 hour & 45 minutes MATERIALS REQUIRED FOR THIS PAPER: To be provided by the supervisor - This
Test Bank for Economic Development. 12th Edition by Todaro and Smith
 Test Bank for Economic Development 12th Edition by Todaro and Smith Link download full: https://digitalcontentmarket.org/download/test-bankfor-economic-development-12th-edition-by-todaro Chapter 2 Comparative
Measuring Sustainable Development: Theory and Application
 Measuring Sustainable Development: Theory and Application PARTHA DASGUPTA In development economics (in welfare economics, more generally), three questions can be asked in connection with human well-being
NBER WORKING PAPER SERIES THE ANALYTICS OF THE WAGE EFFECT OF IMMIGRATION. George J. Borjas. Working Paper
 NBER WORKING PAPER SERIES THE ANALYTICS OF THE WAGE EFFECT OF IMMIGRATION George J. Borjas Working Paper 14796 http://www.nber.org/papers/w14796 NATIONAL BUREAU OF ECONOMIC RESEARCH 1050 Massachusetts
Horizons 2030 Equality at the Centre of Sustainable Development. Alicia Bárcena Executive Secretary
 Horizons 2030 Equality at the Centre of Sustainable Development Executive Secretary Why is the prevailing development pattern unsustainable? Because it is associated with falling growth in production and
Debapriya Bhattacharya Executive Director, CPD. Mustafizur Rahman Research Director, CPD. Ananya Raihan Research Fellow, CPD
 Preferential Market Access to EU and Japan: Implications for Bangladesh [Methodological Notes presented to the CDG-GDN Research Workshop on Quantifying the Rich Countries Policies on Poor Countries, Washington
GCSE 4231/02 GEOGRAPHY. (Specification A) HIGHER TIER UNIT 1 Core Geography. A.M. MONDAY, 13 June hours. Candidate Name.
 HIGHER TIER UNIT 1 Core Geography. A.M. MONDAY, 13 June hours. Candidate Name.") Candidate Name Centre Number Candidate Number 0 GCSE 4231/02 GEOGRAPHY (Specification A) HIGHER TIER UNIT 1 Core Geography A.M. MONDAY, 13 June 2011 1 3 4 hours For s Use Only Question 1 Question 2 Question
Candidate Name Centre Number Candidate Number 0 GCSE 4231/02 GEOGRAPHY (Specification A) HIGHER TIER UNIT 1 Core Geography A.M. MONDAY, 13 June 2011 1 3 4 hours For s Use Only Question 1 Question 2 Question
Do (naturalized) immigrants affect employment and wages of natives? Evidence from Germany
 immigrants affect employment and wages of natives? Evidence from Germany") Do (naturalized) immigrants affect employment and wages of natives? Evidence from Germany Carsten Pohl 1 15 September, 2008 Extended Abstract Since the beginning of the 1990s Germany has experienced a
Do (naturalized) immigrants affect employment and wages of natives? Evidence from Germany Carsten Pohl 1 15 September, 2008 Extended Abstract Since the beginning of the 1990s Germany has experienced a
Is the Great Gatsby Curve Robust?
 Comment on Corak (2013) Bradley J. Setzler 1 Presented to Economics 350 Department of Economics University of Chicago setzler@uchicago.edu January 15, 2014 1 Thanks to James Heckman for many helpful comments.
Is Government Size Optimal in the Gulf Countries of the Middle East? An Answer
 Is Government Size Optimal in the Gulf Countries of the Middle East? An Answer Hassan Aly, Department of Economics, The Ohio State University, E-mail: aly.1@osu.edu Mark Strazicich, Department of Economics,
Immigration, Human Capital and the Welfare of Natives
 Immigration, Human Capital and the Welfare of Natives Juan Eberhard January 30, 2012 Abstract I analyze the effect of an unexpected influx of immigrants on the price of skill and hence on the earnings,
NBER WORKING PAPER SERIES THE RISE OF THE SKILLED CITY. Edward L. Glaeser Albert Saiz. Working Paper
 NBER WORKING PAPER SERIES THE RISE OF THE SKILLED CITY Edward L. Glaeser Albert Saiz Working Paper 09 http://www.nber.org/papers/w09 NATIONAL BUREAU OF ECONOMIC RESEARCH 050 Massachusetts Avenue Cambridge,
Equipping Immigrants: Migration Flows and Capital Movements
 DISCUSSION PAPER SERIES IZA DP No. 2745 Equipping Immigrants: Migration Flows and Capital Movements Fabian Lange Douglas Gollin April 2007 Forschungsinstitut zur Zukunft der Arbeit Institute for the Study
Innovation and Intellectual Property Rights in a. Product-cycle Model of Skills Accumulation
 Innovation and Intellectual Property Rights in a Product-cycle Model of Skills Accumulation Hung- Ju Chen* ABSTRACT This paper examines the effects of stronger intellectual property rights (IPR) protection
Essays on Economic Growth and China s Urbanization
 Essays on Economic Growth and China s Urbanization A thesis submitted to The University of Manchester for the Degree of Doctor of Philosophy in the Faculty of Humanities 2015 Yuxiang Zou Department of
14.54 International Trade Lecture 23: Factor Mobility (I) Labor Migration
 Labor Migration") 14.54 International Trade Lecture 23: Factor Mobility (I) Labor Migration 14.54 Week 14 Fall 2016 14.54 (Week 14) Labor Migration Fall 2016 1 / 26 Today s Plan 1 2 3 One-Good Model of Migration Two-Good
14.54 International Trade Lecture 23: Factor Mobility (I) Labor Migration 14.54 Week 14 Fall 2016 14.54 (Week 14) Labor Migration Fall 2016 1 / 26 Today s Plan 1 2 3 One-Good Model of Migration Two-Good
Migration and Consumption Insurance in Bangladesh
 Migration and Consumption Insurance in Bangladesh Costas Meghir (Yale) Mushfiq Mobarak (Yale) Corina Mommaerts (Wisconsin) Melanie Morten (Stanford) October 18, 2017 Seasonal migration and consumption
Support Vector Machines
 Support Vector Machines Linearly Separable Data SVM: Simple Linear Separator hyperplane Which Simple Linear Separator? Classifier Margin Objective #1: Maximize Margin MARGIN MARGIN How s this look? MARGIN
Trans-boundary Pollution and International. Migration
 Trans-boundary Pollution and International igration KENJI KONDOH School of Economics, Chukyo University, 11-2 Yagotohonmachi Showaku, Nagoya, JPN 466-8666 FX: +81-52-835-7496, e-mail: kkondo@mecl.chukyo-u.ac.jp
Migration and Tourism Flows to New Zealand
 Migration and Tourism Flows to New Zealand Murat Genç University of Otago, Dunedin, New Zealand Email address for correspondence: murat.genc@otago.ac.nz 30 April 2010 PRELIMINARY WORK IN PROGRESS NOT FOR
The Aggregate Productivity Effects of Internal Migration: Evidence from Indonesia
 The Aggregate Productivity Effects of Internal Migration: Evidence from Indonesia Gharad Bryan Melanie Morten May, 2018 Working Paper No. 1001 The Aggregate Productivity Effects of Internal Migration:
GLOBALIZACIÓN, CRECIMIENTO Y COMPETITIVIDAD. Patricio Pérez Universidad de Cantabria
 GLOBALIZACIÓN, CRECIMIENTO Y COMPETITIVIDAD Patricio Pérez Universidad de Cantabria Lima, 10 de mayo de 2018 1. http://www.gifex.com/images/0x0/2009-12- 08-11364/Mapa-de-las-Comunidades- Autnomas-de-Espaa.png
HOW ECONOMIES GROW AND DEVELOP Macroeconomics In Context (Goodwin, et al.)
") Chapter 17 HOW ECONOMIES GROW AND DEVELOP Macroeconomics In Context (Goodwin, et al.) Chapter Overview This chapter presents material on economic growth, such as the theory behind it, how it is calculated,
Chapter 17 HOW ECONOMIES GROW AND DEVELOP Macroeconomics In Context (Goodwin, et al.) Chapter Overview This chapter presents material on economic growth, such as the theory behind it, how it is calculated,
Democratic Tipping Points
 Democratic Tipping Points Antonio Ciccone March 2018 Barcelona GSE Working Paper Series Working Paper nº 1026 Democratic Tipping Points Antonio Ciccone March 2018 Abstract I examine whether transitory
Benefits and Challenges of Trade under NAFTA: The Case of Texas
 Benefits and Challenges of Trade under NAFTA: The Case of Texas AUBER Fall Conference Albuquerque New Mexico October 2017 Jesus Cañas Federal Reserve Bank of Dallas The views expressed in this presentation
High-Skilled Immigration, STEM Employment, and Non-Routine-Biased Technical Change
 High-Skilled Immigration, STEM Employment, and Non-Routine-Biased Technical Change Nir Jaimovich University of Southern California and NBER nir.jaimovich@marshall.usc.edu Henry E. Siu University of British
Immigration and Spending on Public Education: California,
 Immigration and Spending on Public Education: California, 1970 2000 Daniele Coen-Pirani University of Pittsburgh This version: May 2011. Abstract The evolution of education spending in California has received
A Report of Using Nighttime Satellite Imagery as a Proxy Measure of Human Well-Being
 A Report of Using Nighttime Satellite Imagery as a Proxy Measure of Human Well-Being Mengting Lei December 2018 1 Introduction In 1973, the Defense Meteorological Satellite Program (DMSP) was established
Regional Income Trends and Convergence
 Regional Income Trends and Convergence J. Fred Giertz and Shekhar Mehta Institute of Government and Public Affairs University of Illinois February 13, 1996.... This paper is one of a series associated
PROJECTION OF NET MIGRATION USING A GRAVITY MODEL 1. Laboratory of Populations 2
 UN/POP/MIG-10CM/2012/11 3 February 2012 TENTH COORDINATION MEETING ON INTERNATIONAL MIGRATION Population Division Department of Economic and Social Affairs United Nations Secretariat New York, 9-10 February
Highways and Hukou. The impact of China s spatial development policies on urbanization and regional inequality
 Highways and Hukou The impact of China s spatial development policies on urbanization and regional inequality Maarten Bosker a Uwe Deichmann b Mark Roberts b a Erasmus / CEPR; b The World Bank November
Equipping Immigrants: Migration Flows and Capital Movements
 Equipping Immigrants: Migration Flows and Capital Movements Fabian Lange (corresponding author) Yale University Douglas Gollin Williams College JEL Codes: F2, F22 First version: December 2006 This version:
Weather Variability, Agriculture and Rural Migration: Evidence from India
 Weather Variability, Agriculture and Rural Migration: Evidence from India Brinda Viswanathan & K.S. Kavi Kumar Madras School of Economics, Chennai Conference on Climate Change and Development Policy 27
Economic Effects of the Syrian War and the Spread of the Islamic State on the Levant
 Economic Effects of the Syrian War and the Spread of the Islamic State on the Levant Elena Ianchovichina and Maros Ivanic The World Bank Group 10th Defence and Security Economics Workshop Carleton University,
Bilateral Migration and Multinationals: On the Welfare Effects of Firm and Labor Mobility
 Bilateral Migration and Multinationals: On the Welfare Effects of Firm and Labor Mobility Chun-Kai Wang 1 Boston University First Draft: October 2013 This Draft: April 2014 Abstract. This paper starts
NBER WORKING PAPER SERIES THE LABOR MARKET IMPACT OF HIGH-SKILL IMMIGRATION. George J. Borjas. Working Paper
 NBER WORKING PAPER SERIES THE LABOR MARKET IMPACT OF HIGH-SKILL IMMIGRATION George J. Borjas Working Paper 11217 http://www.nber.org/papers/w11217 NATIONAL BUREAU OF ECONOMIC RESEARCH 1050 Massachusetts
NBER WORKING PAPER SERIES THE EFFECT OF IMMIGRATION ON PRODUCTIVITY: EVIDENCE FROM US STATES. Giovanni Peri
 NBER WKG PER SEES THE EFFE OF IMGRATION ON PRODUIVITY: EVEE FROM US STATES Giovanni Peri Working Paper 15507 http://www.nber.org/papers/w15507 NATION BUREAU OF ENOC RESECH 1050 Massachusetts Avenue Cambridge,
5. Destination Consumption
 5. Destination Consumption Enabling migrants propensity to consume Meiyan Wang and Cai Fang Introduction The 2014 Central Economic Working Conference emphasised that China s economy has a new normal, characterised
Space Climate Observatory
 Séminaire THEIA 17 octobre, Agropolis International, Montpellier Dr. Selma Cherchali SCO Program Director SWOT and SWOT downstream program manager Space Climate Observatory International framework Illustration
Gains from "Diversity": Theory and Evidence from Immigration in U.S. Cities
 Gains from "Diversity": Theory and Evidence from Immigration in U.S. Cities GianmarcoI.P.Ottaviano,(Universita dibolognaandcepr) Giovanni Peri, (UC Davis, UCLA and NBER) March, 2005 Preliminary Abstract
7 TH GRADE SOCIAL SCIENCE CHECKLIST Goals Illinois Learning Standards A F
 7 TH GRADE SOCIAL SCIENCE CHECKLIST Goals 14 18 Illinois Learning Standards A F Performance Descriptors This checklist is a suggested guide What is important is not that you stick with the grade level
THE INDICATORS FOR SUSTAINABLE DEVELOPMENT:
 JULY 6, 2018 THE INDICATORS FOR SUSTAINABLE DEVELOPMENT: GENERAL FRAMEWORK 1.1 The Sustainable Development Goals (SDGs) On 25 September 2015, the UN-Assembly General adopted the 2030 Agenda for sustainable
The Effect of Foreign Aid on the Economic Growth of Bangladesh
 Journal of Economics and Development Studies June 2014, Vol. 2, No. 2, pp. 93-105 ISSN: 2334-2382 (Print), 2334-2390 (Online) Copyright The Author(s). 2014. All Rights Reserved. Published by American Research
Investment-Specific Technological Change, Skill Accumulation, and Wage Inequality
 Investment-Specific Technological Change, Skill Accumulation, and Wage Inequality Hui He Zheng Liu July 2006 ABSTRACT Wage inequality between education groups in the United States has increased substantially
Economic Geography Chapter 10 Development
 Economic Geography Chapter 10 Development Development: Key Issues 1. Why Does Development Vary Among Countries? 2. Where Are Inequalities in Development Found? 3. Why Do Countries Face Challenges to Development?
Tilburg University. Can a brain drain be good for growth? Mountford, A.W. Publication date: Link to publication
 Tilburg University Can a brain drain be good for growth? Mountford, A.W. Publication date: 1995 Link to publication Citation for published version (APA): Mountford, A. W. (1995). Can a brain drain be good
A Dynamic Model of Return Migration
 A Dynamic Model of Return Migration Jérôme Adda, Christian Dustmann and Josep Mestres PRELIMINARY VERSION March 2006 Abstract This paper analyzes the decision process underlying return migration using
Rural-urban Migration and Minimum Wage A Case Study in China
 Rural-urban Migration and Minimum Wage A Case Study in China Yu Benjamin Fu 1, Sophie Xuefei Wang 2 Abstract: In spite of their positive influence on living standards and social inequality, it is commonly
George J. Borjas Harvard University. September 2008
 IMMIGRATION AND LABOR MARKET OUTCOMES IN THE NATIVE ELDERLY POPULATION George J. Borjas Harvard University September 2008 This research was supported by the U.S. Social Security Administration through
The partisan effect of elections on stock markets
 The partisan effect of elections on stock markets Bas Gerrits S209701 Tilburg School of Economics and Management Department of Finance Dr. Paul Sengmuller Master Thesis: The partisan effect of elections
There is a seemingly widespread view that inequality should not be a concern
 Chapter 11 Economic Growth and Poverty Reduction: Do Poor Countries Need to Worry about Inequality? Martin Ravallion There is a seemingly widespread view that inequality should not be a concern in countries
Migration in India. Madras School of Economics, Chennai (India) 4 th National Research Conference on Climate Change IIT, Madras
 4 th National Research Conference on Climate Change IIT, Madras") Weather Variability, Agriculture and Migration in India K.S. Kavi Kumar Madras School of Economics, Chennai (India) 4 th National Research Conference on Climate Change IIT, Madras 26 2727 October Otb 2013
Weather Variability, Agriculture and Migration in India K.S. Kavi Kumar Madras School of Economics, Chennai (India) 4 th National Research Conference on Climate Change IIT, Madras 26 2727 October Otb 2013
Global Income Inequality by the Numbers: In History and Now An Overview. Branko Milanovic
 Global Income Inequality by the Numbers: In History and Now An Overview. Branko Milanovic Usually inequality looked at within a state (for govt program access e.g.) Also, across countries (the poor, the