The Unidimensional Congress, Keith T. Poole. Howard Rosenthal. Carnegie-Mellon University
|
|
|
- Cuthbert Nicholson
- 5 years ago
- Views:
Transcription
1 The Unidimensional Congress, Keith T. Poole Howard Rosenthal Carnegie-Mellon University 1. Introduction* A simple unidimensional spatial model provides a highly accurate description of roll call voting in the United States Congress. Moreover, the dimension exhibits remarkable temporal stability. Today s liberal-conservative lineup basically prolongs the major political axis that existed both after World War I and after the Great Depression. These theses are argued on the basis of a statistical analysis of, essentially, every recorded roll call vote in the House and in the Senate in the years The stable, unidimensional alignment of members of Congress is all the more remarkable given the wide span of substantive issues faced by Congress. Indeed, over time, a given issue can completely flip-flop in terms of how it projects onto the basic liberalconservative dimension. Protectionism, for example, a conservative issue during the days of Smoot-Hawley is now primarily championed by liberals. This multiplicity of issues has led theorists to emphasize the fundamental instability of multidimensional politics (e.g. McKelvey, 1975). To model how Congress specifically has dealt with these problems of instability, Shepsle (1979) has emphasized the role of the committee system in partitioning the issue space into jurisdictions. Coupled with agenda control powers embodied in the rules of each house, the partitions can lead to structure induced equilibria. 1
2 Past and current developments in multidimensional theory, however, fail to address a strong empirical regularity documented in this paper. Members of Congress tend to line up relative to one another in a basically stable, unidimensional pattern even though issues and how they are interpreted in liberal-conservative terms are in constant, kaleidoscopic motion. Another way of viewing our results is to place them in the context of the Hinich-Pollard (1981) model of a multidimensional issue space with poorly informed voters. In their model, although voter preferences are multidimensional, voter information about candidates is restricted to knowledge about candidate positions on a predictive (read liberal-conservative) dimension. As a result, voters project their multidimensional ideal points onto this dimension and vote as if they had unidimensional preferences. If, as we argue later, members of Congress are likely to make similar projections as a result of some mixture of coalitional and informational considerations, we can reconcile the multiplicity of issues with our unidimensional empirical results. As we see it, the major theoretical problems raised by these results are to explain: (1) why the stable pattern occurs; (2) how specific issues become related to the stable dimension; and (3) what, for a given roll call, determines the division between yeas and nays along the dimension. 1 This paper s purpose, however, is not to undertake these theoretical developments but simply to document the regularity that needs to be accounted for. Similarly, although we would hazard that the dimension basically defined by questions of income redistribution, 2 we do not attempt to provide a definitive statement as to the historical or substantive meaning of the dimension and how issues project onto it. Nonetheless, as patterns of variation along the 2
3 dimension may provide important clues to answering the theoretical questions we have stated, we will briefly discuss the important elements of change. From the discussion of realignment by Sundquist (1973) to the formal model of Aldrich (1983), scholars have been concerned with issues that would cut across existing lines of party cleavage and reorganize voting along new spatial axes. A permanent shift of this type does not appear in our data. 3 In particular, although the Depression shattered the political world of the 1920s, it did not create a new dimension of conflict. The massive replacement of Republicans by Democrats produced a sharp shift to the left on the dimension existing in the 1920s. In the four Congressional elections from 1930 through 1936, a 100 seat Republican majority gave way to a 242 seat Democratic majority in the House. The swing in the Senate was from a 17 seat Republican majority to a 60 seat Democratic advantage. Party replacement, which was the engine for the policy changes of the 1930s (Brady, 1979, 1982; Sinclair, 1977) moved the center of political opinion to the left. It did not reorganize roll call voting along a new spatial axis. From Roosevelt s New Deal to Johnson s Great Society in the mid-sixties, both the Northern Democrats and the Republicans had a net liberal movement. Newly elected Republicans and Northern Democrats in the sixties tended to be more liberal than the old guard, which, rather than adapting like pure Downsian competitors, generally died with their ideological boots on. Whether this long-term change within the parties grew out of the Depression is an open question. Senate Republicans became more liberal prior to the Depression, swung conservative after Roosevelt s first reelection, and made a substantial liberal move only in the sixties. The same pattern was echoed, with far lesser amplitude, by House Republicans. Northern Democrats in the House made a sharp liberal swing only in 3
4 A. similar, but smoother, pattern is shown by the Senate. (See Figures 3 and 4 below). Prior to the Depression, the Democrats were primarily a sectional, Southern party. At the nadir following Harding s election in 1920, Southern Democrats outnumbered their Northern colleagues 5-to-1 in the House and nearly 2-to-1 in the Senate (see Figure 1). The Southern Democrats, prolonging Bryan s agrarian populism, were, particularly in the House, more liberal than their Northern colleagues. Southern liberalism continued through the Depression when, it will be remembered, FDR risked being outflanked on his left by Huey Long. 4
5 The alignment of the thirties, perhaps motivated by the redistributional conflict between a poor South and a rich North, could not be sustained given another, essentially, redistributional conflict between impoverished, subjugated blacks and richer whites. What happened is evident in the position of Southern Democrats. They became more conservative over time, although the patterns differ between the House and Senate. The thread common to both chambers, however, is a sharp movement of Southern Democrats in a conservative direction in when many roll call votes occurred on issues that arose from black participation in the armed forces. In response to the race issue, which was hardly on the agenda of Congress before World War II, the Southern Democrats realigned, but along the liberal-conservative dimension. They embarked on a conservative defense that reached a 5
6 final paroxysm in the sixties. These more conservative Southern Democrats offset liberal Northern Democrats. This change, paired with the more liberal Republican Party, meant that party differences along the dimension had decreased markedly. This was particularly true in the Senate in the early sixties when that chamber played the key role in the development of civil rights legislation. Through the height of the Vietnam conflict, in 1968 and 1969, party differences were far less, in both houses, than they had been in the twenties and thirties. Daniel Bell s The End of Ideology (1960) marked the transition. From the mid-sixties until the present, the two parties have spread apart, polarizing in the fashion we described in The Polarization of American Politics (Poole and Rosenthal, 1984a). The Republicans, reversing a four decade trend, have become more conservative. The Democrats have become more liberal, largely because the remaining Southern Democrats have become more liberal. (See also Bullock, 1981). The Reagan period continues this trend but does not mark any fundamental change in the political system either in terms of spatial realignment or in terms of strong movement along the dimension. The preceding descriptive assertions about the course of Congressional conflict have been developed from the results of applying a specific quantitative methodology to the entire record of roll call voting in both the House and the Senate from 1919 to Claims such as the one that there is a pervasive, stable ideological dimension are made within the limitations of this methodology. Consequently, we conclude this introduction by providing a brief methodological overview. First, we have, for individual years or pairs of years of roll call voting, carried out 6
7 unidimensional nominal scaling using the NOMINATE procedure of Poole and Rosenthal (1985). Separate scalings are carried out for the House and Senate. Euclidean coordinates for the legislators and roll call alternatives are recovered simultaneously. This methodology is reviewed in Section 2. In that section, we also describe the ability of a one dimensional model to summarize roll call voting. In all, we carried out 90 separate scalings for the 66 year period of our analysis and found that, at any point in time, roll call voting tends to obey a strongly unidimensional pattern. The quality of the scalings was very uniform. (See Tables 1-4 below.) But is, say, the dimension found in our first scaling, for , at all comparable to that found in our last, for 1984? To address that question, we have made a strong assumption, namely, that the spatial (ideological) position of a legislator is constant, up to a random disturbance with mean zero, throughout his tenure in Congress. Thus, this assumption asserts that change in the ideological makeup of Congress is accomplished mainly through the election of new members. While this assumption is strong, it has support in the literature. (See Clausen, 1973; Fiorina, 1974; Stone, 1980; Bullock, 1981). Using this assumption, we bind the separate scalings together using a singular-value decomposition method for matrices with missing data developed by Poole (1983). This technique and the results are presented in Section 3. We find a pervasive liberal-conservative dimension present across the entire time period. The dimension in the House is very consistent. The greatest perturbation, which is quite small, appears related to isolationist sentiment at the outbreak of World War II. There are more deviations for the Senate. Not only is the isolationist factor present, but there is a suggestion of less stable alignments in the Depression and, more importantly, a major 7
8 perturbation due to civil rights in the sixties. These deviations, however, are always episodic. The major dimension always rebounds strongly. A summary of our empirical results and their theoretical implications is presented in Section Unidimensional Voting in Congress, We began our investigation by estimating a unidimensional spatial model for 43 separate data sets for the House and 47 data sets for the Senate. Our scalings correspond to calendar years, except for earlier years when there were relatively few roll calls. In those cases, we used data for a two-year period. Tables 1 and 2 indicate the years covered and the number of roll calls in each data set. 4 The largest scaling, that of the individual votes of 434 representatives on 662 roll calls in 1978, covered 256,442 voting decisions. The roll calls included in each scaling represent all recorded roll call votes with more than 2.5% of the announced votes and pairs cast on the minority side. All legislators with at least 10 recorded votes were included. The model we estimate, except for its stochastic aspect, was proposed by MacRae (1958) and termed a cumulative model by Weisberg (1972). In this model, each legislator is described by a spatial coordinate x i where, i indexes the legislators. Similarly, each roll call, indexed by j is described by two spatial coordinates, one, y, for the yea outcome, and the other, n, for the nay outcome. These coordinates are given as z jy and z jn, respectively. Without any stochastic considerations, each legislator would simply vote for the alternative whose coordinate was closer to his own coordinate or ideal point. We model each legislator as having a utility function composed of a spatial component and a stochastic component. The legislator votes for the alternative with higher utility. The utility for the yea and 8
9 nay alternatives is given by: U U = u + ijy ijy ijy = u + ijn ijn ijn, Where u designates the non-stochastic component of the utility and the errors satisfy the standard assumptions that lead to logit estimation. In particular, the probability of a Yea vote is given by: P ijy = u ijy u ijy + u ijn Our model for the non-stochastic, spatial part of the utility function the quasi-concave function: u w 2 2 i ijl = β exp i jl = yn, ω = ω + ω x + ω x i i 2 1 ( x z ) 2 The parameters x i,, z jl, β, ω 0, ω 1, and ω 2 are estimated via a modified maximum- -likelihood method described in Poole and Rosenthal (1985). The parameterization of ω i included to allow extremists to have tighter utility functions than moderates in line with the social-psychological literature reviewed in Poole and Rosenthal (1984b). 5 As can be seen in Tables 1 and 2, a unidimensional model is quite successful in accounting for the data on a year-by-year basis. This assertion is supported in terms of three 9
10 criteria: (a) geometric mean probabilities, (b) classification errors, (c) roll call coordinate scaling. (a) Geometric means. The geometric mean probabilities are consistently high, (See Tables 1 and 2.) To compute the geometric mean, we take the total log-likelihood and divide it by the total number of votes cast. This normalizes the log-likelihood to give a figure that is comparable across scalings. We then exponentiate this normalized quantity. This produces a probability measure, but one that behaves like a squared error measure in that low probability choices (e.g., Jesse Helms voting against school prayer) are penalized. For example, the geometric mean for the model in which half the legislators vote Yea with probability 0.1 and half with probability 0.9 would be only 0.3, less than the average probability of 0.5. The average geometric mean for the Senate scalings is 0.681, The House, which fits a unidimensional model even better than does the Senate, has an average geometric mean of [Tables 1 and 2 about here] (b) Classification errors. For each scaling in both houses, NOMINATE correctly classifies most of the individual votes, the percentages for the various scalings ranging from 77 per cent to 88 per cent. Again, the House fits better than the Senate. The House average is 84.0 percent as against 81.4 percent in the Senate. To put these figures in perspective, we report the percentages explained by the two party and three party (Northern Democrats, Southern [Confederacy plus Kentucky and Oklahoma] Democrats, Republicans) models proposed by Weisberg (1978). In these models, for each roll call, one finds how the majority of each party voted and then predicts that all party 10
11 members vote with the majority. With reference to the two-party model, note that this is not a party cleavage model where Democrats and Republicans would be predicted to vote on opposite sides of every roll call. Because the Weisberg model can readily predict that all legislators will vote identically on roll calls with strong majorities, it will always be substantially better at classification than a cleavage model. Even better classification is guaranteed for the three-party model. Compared to the two--party model, NOMINATE always does better. In the House, the three-party model does better than NOMINATE in eight scalings, all of which precede In the Senate, NOMINATE outperforms the three-party model in all but three periods , 1960, and These were all key years for civil rights votes. In 1964, voting on the Civil Rights Act produced over one-third of all the roll calls. Civil rights appears to be an issue that is often not fully captured in the main dimension we scale for a given data set. Obviously, civil rights is proxied by the three party split. These comparisons with the party models are nonetheless misleading. Our sample of roll calls contains many Hurrah votes which all three models will trivially- classify correctly. In addition, the party models are designed to minimize classification errors whereas in NOMINATE the estimates are chosen maximize a likelihood. To obtain a better comparison, we (a) restricted our comparison to votes in which the majority was 60 per cent or less and (b) minimized prediction errors -- holding our estimated legislator coordinates fixed-- by finding the midpoint of the yea and nay outcomes that minimizes prediction errors. [Tables 3 and 4 about here] 11
12 As shown in Tables 3 and 4, comparisons with optimized classifications always favor our spatial model, both on close votes and on all roll calls, except for a minute edge to the threeparty model in the Senate in 1964 and in the House in (For discussion of these exceptions, v. infra.) This is especially impressive given that the three-party model can in fact contain more parameters than a one-dimensional spatial model. 6 The results for close roll calls are particularly important. The marginals average about 55 per cent for the majority on these roll calls. A one-dimensional spatial model can correctly classify 81 percent of the votes on these same roll calls in the Senate and 82 percent in the House. Indeed, there is surprisingly little shrinkage in the percent correctly classified when one restricts the analysis to close roll calls. Classification is actually better on close roll calls than on non-close for 12 of the House and 6 of the Senate scalings. We suspect that this is because many of the non-close or Hurrah votes are based on decision rules that fail to fit our Yea vs. Nay two alternative comparison model. Nay vote on such roll calls may simply represent strong dissatisfaction over the final outcome of legislation. NOMINATE performs best when votes count, and its marked improvement over the two party and three party models for these votes demonstrates that a liberal-conservative spatial model contains substantial information not represented in simple classifications by party and region. (c) Roll call coordinate scaling. The scaling of the roll call coordinates does not disclose strong indications of a multidimensional pattern. Some roll calls scaled poorly in that one coordinate was to the left of the most liberal legislator while the other was to the right of the most conservative legislator. These were essentially roll calls that fit the unidimensional pattern well but had less noise than called for by the estimate of β, Other roll calls, those that have both coordinates off the same end of the dimension are more 12
13 troublesome; they do not fit the dimension, 7 Although such roll calls exist, they are always a minority, and many of them represent near unanimous votes. (Again, see Tables 1 and 2 for a complete summary). An additional and more interesting check on our scaling would be to ask if the midpoints estimated by NOMINATE made sense on a series of roll calls where the midpoints could be ordered by a priori information. While this task has not been carried out systematically, Romer and Rosenthal (1985) have used our coordinates to analyze amendment voting on several regulatory policy issues that arose in the seventies. These include wage-price control exemptions for small business, exemption from OSHA inspections for small business, minimum wage, and strip-mining legislation. In all these cases, the estimated midpoints had the order expected. We thus conclude that a unidimensional model is not only able to fit the data in terms of statistical measures but also provide substantively valid placement of roll calls. The degree to which a unidimensional model accounted for roll call voting was fairly uniform throughout our time series. NOMINATE did perform, mainly for the Senate, somewhat above average in the early twenties and somewhat below average in the thirties. Not too much should be made of these distinctions for the degree of fit may depend as much upon the distribution of roll calls in a given year--including the relative number of close vs. non-close votes--as upon the extent to which preferences are highly unidimensional. The three lowest classification percentages for close votes in the Senate and the two lowest in the House do, however, all fall in the first four Congresses elected after the stock market crash of 1929, suggesting that some temporary realignment may well have taken place in this period. To get a firmer handle on realignment, we now proceed to a temporal linkage of the separate 13
14 scalings. 3.Intertemporal Analysis of the Liberal-Conservative Dimension Roll call voting in Congress has, at any point in time, exhibited a strongly unidimensional pattern. But how stable is the dimension? To assess this, we link the separate scalings by the following model: x = c + w x + v ' it t t i. it where x it represents the scaled coordinate in the t-th scaling, v it an additive disturbance with mean zero, x i. the vector location of the legislator in the common space, and c t, w t coefficients of a linear transformation, The parameters x i., c t and w t are estimated by the alternating least squares algorithm of Poole (1983). The algorithm carries out singular value decompositions of matrices (47 scalings by 331 senators. and 43 scalings by 1,321 representatives) with missing entries. 8 Except for the missing data problem, the procedure is equivalent to principal components factor analysis. Since the scale and origin of the spaces for individual scalings are arbitrary, the coefficients of the linear transformation may be chosen freely. Taking advantage of the fact that, between any two adjacent scalings we find substantial overlap in membership (at least two-thirds in the Senate), we can tie the separate spaces together within each house. Although we have assumed that, over time, the expected change in any individual s position is zero, in the common space described by the x i, mean positions for party blocs can vary 14
15 over time, due to the changing composition of Congress. Because there was no overlap to permit a gain to joint estimation, separate singular value decompositions were carried out for the House and the Senate. 9 We estimated one and two dimensional mappings of the scalings into a basic space. The fit of a one dimensional model in the Senate was excellent. With only one dimension we accounted for 86.5 per cent of the variance in the individual x it values, Two dimensions raised this to 93.6 per cent. The fits for the House were even better, with a 92.1 percent figure for one dimension and a 95.5 figure for two dimensions. As two dimensions account for nearly all of the variation in the main yearly dimension, we will confine our attention to the one and two dimensional intertemporal estimations. The fits of 86.5 per cent and 92.1 percent for the one dimensional projection are striking, considering that a time period of 66 years is spanned. There is a persistent character to the left-right or liberal-conservative conflict in American politics. Economic issues, emphasizing income redistribution, would appear to be the one common thread that could run through this long period of time. The few deviations from this highly stable pattern can be examined by studying the squared correlations between the x it values and the x i values for each scaling. We begin with the Senate, which had the strongest exceptions to the unidimensional pattern. The squared correlations are plotted in Figure 2a. [Figure 2 about here] 15
16 16
17 The basic dimension comes out quite strongly at the beginning of our time series. Three of the four Senates that sat in the twenties before the stock market crash have R 2 values in excess of The Depression and events associated with the onset of World War II may in fact have begun a dimensional realignment, for the R 2 values fall to a low in But the long term liberal-conservative pattern quickly reasserted itself. From 1947 to 1959 the scalings have nearly identical R 2 values which are only slightly less than those found before 1929 and after Indeed, the Senate data suggest that it was the civil rights movement, not the Depression that most perturbed the basic line of conflict. The lowest correlation over all 47 scalings occurs in 1964, previewed by less important dips in 1960 and These were years in which civil rights dominated the national agenda, particularly in the Senate. 17
18 The results show that conflict in these years did not run along the usual liberal-conservative lines. Finally, there is a smaller deviation at the time of the Vietnam debate in After 1968, every year has a high fit to the basic space. The fluctuations for earlier years are all but eliminated with a two-dimensional model, as shown in Figure 2a. We cannot, however, infer that the estimates reflect the addition of a single substantive dimension. The second dimension is essentially going to try to pick up what s left over from the first dimension. Consequently, the second dimension will attempt to fit the prewar and the sixties dips seen in the figure. Since there was virtually no overlap between these two widely separated periods (Carl Hayden notwithstanding), second dimension coordinates can be fitted independently for the two groups of senators present in the two eras. Prewar, the second dimension appears to correspond to non-economic issues such as isolationism. It is noteworthy that the lowest fit in two dimensions occurs in , after entry into the war and when civil rights was beginning to appear as an issue. By the sixties, the second dimension should correspond to civil rights--an issue beyond the pale in the thirties. In the House, a second dimension is largely irrelevant, as the House is even more highly structured along liberal-conservative lines than is the Senate. A comparison of Figures 2a and 2b shows that the one dimensional scaling fits for the House are nearly as good as those for the Senate in two dimensions. The more unidimensional character of the House appears to result from (1) the House s lesser involvement with foreign affairs, which dampened pre-war deviations and (2) the Senate s pivotal role, as a result of the filibuster, on the civil rights issue. 18
19 The result worth stressing, however, is the highly unidimensional nature of both houses, disclosed by combining NOMINATE with singular value decomposition. Most important political events can be viewed as movement along the dimension. We now proceed to analyze these movements. To track distributions of positions over time, we must first map the individual scalings onto the basic (one dimensional) space. We accomplish this by transforming each x it by the inverse of the linear transformation for its scaling: [ ] x x c * 1 it = it t wt The x * values for the Senate and the house are not comparable, since the c, w values are only defined up to a linear transformation. However, using interest group ratings of representatives and senators from , Poole and Daniels (1985) also scaled Congress, this time using a least squares metric unfolding (Poole, 1984) of the ratings. For this shorter period, they also report unidimensionality. Their results, via the common ratings scales, are comparable across houses. Like NOMINATE, the metric unfolding procedure is one whose estimation strategy is based on the spatial model of political choice behavior. But the input data to metric unfolding are distances, in the form of ratings, rather than binary choices. As such the mathematical mechanics of estimation are quite different in the two approaches. Consequently, it is important, quite independently of our desire to match up the Senate and.house results, to check if the two approaches validate each other. For the comparable years, we regressed our x* values on theirs and obtained an R 2 value of for the Senate 19
20 and for the House. Having found highly consistent results from the two approaches, we used the regression coefficients to compute linear transformations of the x* values, assuming that the regression was valid for earlier and later years. This is a strong assumption. Consequently, we do not make inter-house comparisons in changes in magnitude. We simply use the transformed values as a vehicle for placing our graphical results in a roughly comparable metric. The remainder of our analysis is based on the transformed x * values. In terms of overall mean positions, what has happened in the two houses is remarkably similar, as disclosed by Figure 3. First, the Depression, via the massive swing in seats to the Democrats outlined in the Introduction, produced a strong shift in the liberal direction. By the Mid-thirties, Congress was given the assumptions of our model as liberal as it has been in contemporary times. As the Republicans rebuilt strength, the pendulum swung back in a conservative direction, peaking in Harry Truman s whipping boy, the 80th Congress. Subsequently, there was a return to liberalism that stabilized in the mid sixties. 20
21 21
22 Of these changes in mean positions, by far the greatest, for both houses, was the liberal shift initiated with the elections of 1930 and continued through those of Other scholars have detailed how this dramatic shift produced a marked change in the type of policies enacted by Congress. 11 Ginsberg (1976), on the basis of a content analysis of party platforms and public laws, emphasizes how it produced alterations in the economic system and redistributions of opportunities in favor of the urban working class elements (p. 49), Sinclair (1977), using Clausen s (1973) five policy dimensions (government management, social welfare, civil liberties, international involvement, agriculture), found that only the government management dimension was present in roll call voting prior to the Depression. The most significant change was the emergence of social welfare issues in the 71st Congress ( ). The debate then was over direct relief. After the 73rd Congress 22
23 ( ), the debate was not over whether, but how much to spend (Sinclair, 1981, p. 225). Although the work of Sinclair and other recent scholars has shown that the Depression initiated great changes in issue content, our results show that these changes were not accompanied by a change in spatial alignments. In particular, those members of Congress who served both in the twenties and in the thirties lined up very similarly in both periods. Thus, with reference to our introduction, the effect of the Depression can be summarized as largely one in which the distribution of Congress shifted along a previous existing liberalconservative dimension while, at the same time, a host of new issues were projected onto this dimension, Simple models of party competition could be used to analyze how the distribution shifts. Research presented and literature reviewed in Poole and Rosenthal (1984) indicate that, even within a constituency, candidates for Congress are not likely to obey the simplest Downsian model in that they tend to take distinct, rather than convergent, liberalconservative positions. This polarization at the constituency level is echoed by differences in the liberal-conservative means for the two parties in Congress. However, an element of Downsian competition might remain in the sense that both parties would track changes in the distribution of voter opinion similarly. For example, if public opinion became more liberal, both parties would move in a liberal direction. A more conservative mood would drive both parties to the right, If the parties did indeed move parallel to one another, we could not track changes in the overall (all legislators) liberal-conservative mean in terms of the seat shares held by the 23
24 two parties. If, for example, there was a liberal movement while seat shares were unchanged, prediction in terms of seat shares would predict no change when change had indeed occurred. If, in contrast, party movements were either uncorrelated or always offsetting, prediction on the basis of seat shares would be relatively successful. Our analysis clearly rejects viewing movement of the overall mean as the outcome of parallel movement of the two parties. Nearly all of the changes in the overall mean on the dimension can, for both the Depression and later periods, he attributed to changes in the seat shares held by the two parties. An illustration is provided by the evident, if small, swing in the conservative direction in the Senate from 1980 to 1981, occasioned by a 15 seat Republican swing in the 1980 election, and the absence of any significant change in the House, better protected by incumbency advantage from political gusts. To document this point systematically, we carried out two forecasting computations. First, we asked what if we had predicted, knowing the results of Congressional elections but not knowing the future roll call voting record, that the mean liberal-conservative position in the future Congress could be found by taking the party means in the past Congress and weighting them by the new seat shares. That is: X t, predicted = N X + N X dt, dt, 1 rt, rt, 1 N + N dt, rt, where X denotes mean, d, Democrats, r, Republicans, and t-1, t, two successive Congresses. The result of this exercise is that the mean liberal-conservative positions from 24
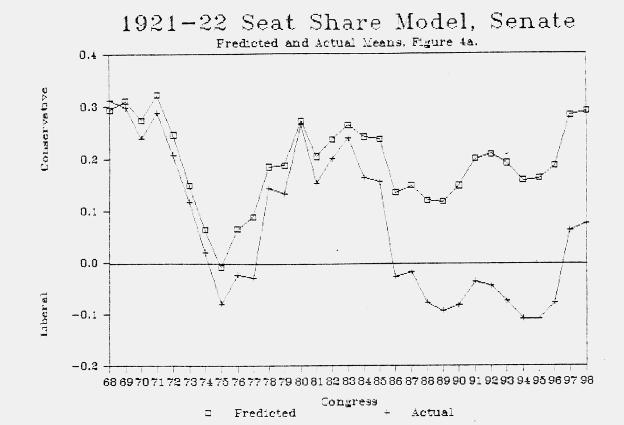
25 NOMINATE could be forecast very accurately one period ahead by this simple party share model. In the House, the root mean square prediction error is while the standard deviation of mean liberal-conservative positions over the 32 Congresses from the 67th to the 98th is The corresponding proportionate-reduction-in-error (R 2 ) measure is Even in terms of forecasting the change (which obviously has less variance than the mean itself) in the mean, the R 2 is For the Senate, the corresponding values of and are somewhat lower, but still very high. Our second forecasting exercise involved always basing the forecasts on the 67th ( ) Congress party means. 13 For the House, these forecasts led to a proportionate-reductionin-error figure of The shrinkage from the one period forecasts (0.961) is largely explicable by a single shift. As can be seen by inspection of Figure 4b, the forecast accurately tracks the actual means until the 90th Congress. Thereafter, the House is uniformly more liberal than the forecast. 14 The average forecast error from the 90th Congress through the 98th is If the prediction is corrected by subtracting from the previously forecast positions for this period, the R 2 jumps to
26 26
27 Uncorrected long-term forecasts for the Senate are very poor. Again, a single shift is the culprit. (See Figure 4a.) If we adjust by the average error of from the 86th Congress onwards, the R 2 becomes 0.877, very comparable to the House results. We do not attach any significance to the fact that the Senate shift appears to predate that in the House, for the Senate scalings were highly influenced (see below) by civil rights issues during this period. On the whole, it appears that a seat share model tracks the data in both houses well until the sixties when there was, independent of seat share considerations, a permanent shift of the political center of gravity in the liberal direction. Afterwards, seat shares again account for changes in the mean liberal-conservative position. Our results show that swings in party seat shares explain, even over very long periods 27
28 of time, almost all the variation in the mean positions of the two houses. The key role of party obviously must reflect, throughout the entire 66 year period, important distinctions in the positions of the two parties, as shown in Figure 3. The only exception is the Senate in 1964 when the civil rights debate overrode party allegiances. But party swings in seats are not the whole story because the differences between the parties changed in important ways during the period of our analysis. In the House, the major change in position is represented by the Republican party which, up until 1966, moved in the liberal direction at a relatively constant pace. Since 1968 the Republican party has become substantially more conservative, but by 1984 the party had not retreated to its positions of the early fifties, let alone the halcyon days of Calvin Coolidge. Changes in position of House Democrats are less dramatic. Prior to the sixties watershed, House Democrats actually move in a slightly conservative direction. Thereafter, they become slightly more liberal. This pattern masks two important trends shown in Figure 5b. The relative positions of Northern and Southern Democrats have changed. Before Roosevelt s presidency, the Southern Democrats were significantly more liberal than Northern Democrats. Consistent with our concept that the dimension largely concerns income redistribution, the relevant distinctions in this period were largely between a rich white North and a poor white South. 28
29 With the Roosevelt presidency, this distinction began to unravel, but the differences persisted. The party was moved slightly in the conservative direction by the strong increase in the number of the somewhat more conservative Northern Democrats in the early thirties. (See Figure lb.) The big switch occurred in Many roll call votes were taken on voting rights of members of the armed forces and other issues related to black service in the military, These signaled forthcoming black-white redistributional issues. The Northern Democrats, who had enrolled by their coalition, shifted strongly in the liberal direction, remaining in that position until the present. The Southern Democrats moved just as strongly in the conservative direction. Moreover, they continued to become more conservative in fairly steady fashion until they approached the Republican position in
30 By 1968, the inconsistencies of the Roosevelt coalition.had become evident. In the 1960 s the South fought (often with violence) a second Civil War that shows up clearly in Figure 3b and even more so in Figure 3a for the Senate. The consequence of the outcome, as ably described by Bullock (1981), was that the Republicans inherited the mantle of Southern conservatism. Faced with competition from Republican conservatives and an enfranchised black population, Southern Democrats gravitated toward the position of their Northern counterparts. This movement and the gradual decline in the number of Southern Democrats (see Figure la) resulted in a liberalization of the Democratic party. The process we have described in the House was largely repeated in the Senate, with important exceptions. (See Figures la, 3a, and 5a.) The liberal swing of the Republicans up until the mid sixties was less regular. As to the Senate Democrats, they have tended to become slightly, but steadily, more liberal over time. Although and were swing periods as in the House, distinctions before and after were somewhat different in the Senate. First, as seen in Figure 5a, there were no important distinctions between Northern Democrats and Southern Democrats pre-roosevelt. Under Roosevelt, the Southern Democrats actually become more liberal--until the big switch. As a result, the party as a whole moved slightly in the liberal direction (Figure 3a). After the big switch, rather than continuing a conservative move as in the House, the Southern Democrats paused while the Northern Democrats became more liberal. The gradual liberal drift of the party was only temporarily offset by the big conservative swing the Southern Democrats in the early sixties. After the sixties, the Senate Northern Democrats, like their colleagues in the House, have maintained a constant liberal position. Despite pundits claims of a more conservative mood in the country, our evidence suggests that Northern Democrats have not 30
31 moderated their positions in recent years. 15 In our discussion of both fit and the underlying, long-run dimension and movement on a year-to-year basis, the race issue or civil rights has played a key role. It should be stressed that some episodic movements, particularly the strong conservative swing of Southern Democrats in 1964, are really a case of a given year not fitting the long-term dimension more than a movement along the dimension. The perturbation of the liberal-conservative dimension by the civil rights issue is shown even more dramatically by Figure 6, which shows the percentage of the total variance of each year s scaling explained by one way analyses of variance in terms of the two party and three party classifications. 16 Although the three party classification cannot explain less variance than the two party classification, breaking down the Democrats into two factions added only minimally to the explained variance in the Senate through In fact, through 1935, as seen in Figure 6a, the addition is essentially zero. From 1959 through 1977, there were, with varying degrees of intensity, clear Northern and Southern factions in the Democratic party. Although these years, like the twenties, relate strongly to the basic dimension, a three party classification is needed to explain variance on the dimension, almost surely because the distributional claims of race cut across those of party. Once again, the split is highlighted by the 1964 results, where the two-party split explains virtually none (0.2%) of the variance. [Figure 6 about here] The variance explained by party classifications in the House shows an attenuation of the pattern observed in the Senate. Just as the House fits the long-term dimension better than the Senate, party generally explains more of the variance in the House and the fluctuations are 31
32 less dramatic. The three party model has more explanatory power than the two party model at an earlier date, but the gap between the two in the sixties is much less than in the. Senate. In both the Senate and the House, party voting was extremely strong at the beginning of our time series. The decline of the role of party was reversed at the end of the sixties, but the resurgence has not yet reached the degree of liberal-conservative polarization along party lines found in the twenties. 4. Conclusion We have argued that roll call voting in the Congress is largely unidimensional. A stable liberal-conservative pattern was only temporarily perturbed by the Depression and the civil rights issues of the sixties. Changes in the relative electoral success of Democrats and Republicans played a critical role in determining the location of the mean position in Congress. At the same time, Congress generally became more liberal and party differences attenuated up until the late sixties. Subsequently, the process has polarized. It is too early to tell if the early eighties contain an important movement in the conservative direction. Our estimates suggest that the net conservative movement from 1980 to 1981 was fairly minor. We estimate the 1980 to 1981 movement to be less than the liberal movement induced by Democratic victories that followed the 1958 recession. The House has been particularly resistant, the conservative shift being actually slightly less than the liberal shift engendered by Watergate and no more than the midterm conservative shift resulting from the 1966 election. Moreover, the midterm elections of 1982 eliminated about half of the conservative shift of 1980 in the House and failed to further increase the shift in the Senate. Not only do our estimates fail to disclose a truly major conservative trend but, even 32
33 more importantly, they suggest that there is no new dimensional realignment. Positions for recent years still correlate extremely highly with the basic space. The field of battle of the political system continues to be sharply defined in traditional liberal-conservative terms. These conclusions require at least two important qualifications. First, our techniques cannot account for shifts in the overall mean of liberal-conservative preferences. If our assumption about the constancy of individual positions is incorrect and if there is, in contrast, some overall average movement of all returning members of either house, this movement will tot be captured. Second, a small change in average coordinates can be amplified into substantial changes in policy under majority rule. Thus, while the average conservative movement from 1980 to 1981 may well have been small by historical standards, the movement as accompanied by the Republicans taking control of the Senate and the Presidency. A conservative President and Senate leadership gained control of much of the agenda of roll call voting. As a result, the shift to conservative policies may have been far greater than the shift in average spatial positions. These caveats suggest caution in making inferences about policy changes from our results. Our results, because of our inability to capture changes in the overall mean, are basically a lower bound on the extent of change from one scaling to the next. Moreover, majority rule may well lead to policy swings of greater amplitude than changes in average liberal-conservative positions. Nonetheless, we are left with the striking conclusion that the relative lineup in Congress has been remarkably stable since the end of World War I. Why such strong unidimensionality? The results of Poole and Daniels (1985) make us 33
34 virtually certain that little systematic behavior will be revealed, even on an intra-year basis, by adding a second dimension to the NOMINATE scaling. Indeed, those roll calls that do not fit the one dimensional model tend not to involve broad policy issues but questions of geographic redistribution. 17 When the debate shifts from a conflict between haves and have nots in general to issues that have differential effects on various parts of the nation, the unidimensional model will not work. That these geographic issues are not more prevalent in our data reflects, we suspect, that they are bargained out at the committee level. When a geographic issue cannot be bargained away, as with civil rights in the sixties, the issue will indeed strongly perturb the long-term dimension. In more typical circumstances, as in strip-mining votes in the mid-seventies, for example, the details on differentials in cost imposed on western and eastern operators appear to have been largely already bargained out prior to roll call votes. As a result, such roll calls, which on the surface appear rich in geographic distributional consequences, in fact are voted on along the dimension, liberals favoring the environment and governmental regulation, conservatives being opposed. 18 Unidimensionality, in addition to being partially a result of a prior bargaining process, may also, we suggest, be found as a consequence of optimizing behavior by political actors in models of incomplete information. 19 Unidimensionality solves the following problems: (1) it allows horse-trading to occur among spatially adjacent actors in defining the midpoint on a given issue. Conditional on the midpoint, liberals and conservatives will look like they are voting in a consistent, non-strategic fashion that maintains their voting histories (Asher and Weisberg, 1978), thereby preserving their reputations (Bernhardt and Ingberman, 1985), with their electorates; (2) from the 34
35 viewpoint of voters and campaign contributors, a simple index greatly simplifies decision problems in an information poor environment; (3) similarly, the dimension greatly facilitates cue-taking by members of Congress, who, massive staffs notwithstanding, are clearly information overloaded when faced with hundreds of roll calls a year. 20 Time and again we see that substantive issues arise and are absorbed into the long-term dimension. Much of the discussion of the paper was devoted to showing that a racial dimension did not survive as a separate spatial axis. Another excellent example is women s rights where feminist organizations reached a position where they could not obtain bipartisan support for their objectives. In the long run, we argue, all the issues get defined in terms of the liberal-conservative dimension. 35
36 FOOTNOTES *This work was supported by National Science Foundation grant SES and by an award from the NSF supercomputer program. We thank Dave Seaman and Bill Whitson of the Purdue University Computer Center for greatly facilitating our work on the Cyber In this latter task, Shepsle s framework will be highly relevant. 2. See Peltzman (1985) for a similar view. 3. Poole and Rosenthal (1985) contains the methodological argument as to why earlier analysts [e.g. MacRae (1958), Clausen (1973)] exaggerated the dimensionality of Congressional voting. See also Schneider (1979) who argues that Congressional voting in the 1970 s was largely unidimensional. 4. Our initial work, for the Senate, was carried out on a DEC-VAX 11/780. As the larger of these scalings proved severely taxing of the virtual memory capacity of this machine, the work for the House and some Senate runs were performed on a Control Data Cyber The remainder of this paper focuses on the estimated coordinates for legislators, the x i. As discussed in the text, Tables 1 and 2 provide a brief summary of how roll call coordinates are distributed relative to legislators. For more detailed discussion of typical sets of roll call coordinates, see Poole and Rosenthal (1985). As to the values of β and the ω parameters, they were quite stable. For 47 Senate scalings, the means (standard 36
Appendix to Non-Parametric Unfolding of Binary Choice Data Keith T. Poole Graduate School of Industrial Administration Carnegie-Mellon University
 Appendix to Non-Parametric Unfolding of Binary Choice Data Keith T. Poole Graduate School of Industrial Administration Carnegie-Mellon University 7 July 1999 This appendix is a supplement to Non-Parametric
NOMINATE: A Short Intellectual History. Keith T. Poole. When John Londregan asked me to write something for TPM about NOMINATE
 NOMINATE: A Short Intellectual History by Keith T. Poole When John Londregan asked me to write something for TPM about NOMINATE and why we (Howard Rosenthal and I) went high tech rather than using simpler
UC-BERKELEY. Center on Institutions and Governance Working Paper No. 22. Interval Properties of Ideal Point Estimators
 UC-BERKELEY Center on Institutions and Governance Working Paper No. 22 Interval Properties of Ideal Point Estimators Royce Carroll and Keith T. Poole Institute of Governmental Studies University of California,
Do two parties represent the US? Clustering analysis of US public ideology survey
 Do two parties represent the US? Clustering analysis of US public ideology survey Louisa Lee 1 and Siyu Zhang 2, 3 Advised by: Vicky Chuqiao Yang 1 1 Department of Engineering Sciences and Applied Mathematics,
Political Economics II Spring Lectures 4-5 Part II Partisan Politics and Political Agency. Torsten Persson, IIES
 Lectures 4-5_190213.pdf Political Economics II Spring 2019 Lectures 4-5 Part II Partisan Politics and Political Agency Torsten Persson, IIES 1 Introduction: Partisan Politics Aims continue exploring policy
Iowa Voting Series, Paper 4: An Examination of Iowa Turnout Statistics Since 2000 by Party and Age Group
 Department of Political Science Publications 3-1-2014 Iowa Voting Series, Paper 4: An Examination of Iowa Turnout Statistics Since 2000 by Party and Age Group Timothy M. Hagle University of Iowa 2014 Timothy
Partisan Nation: The Rise of Affective Partisan Polarization in the American Electorate
 Partisan Nation: The Rise of Affective Partisan Polarization in the American Electorate Alan I. Abramowitz Department of Political Science Emory University Abstract Partisan conflict has reached new heights
1 Electoral Competition under Certainty
 1 Electoral Competition under Certainty We begin with models of electoral competition. This chapter explores electoral competition when voting behavior is deterministic; the following chapter considers
Congressional Gridlock: The Effects of the Master Lever
 Congressional Gridlock: The Effects of the Master Lever Olga Gorelkina Max Planck Institute, Bonn Ioanna Grypari Max Planck Institute, Bonn Preliminary & Incomplete February 11, 2015 Abstract This paper
4^' ^, I' ^4^ o/ tbc^
 4^' ^, I' ^4^ o/ tbc^ l*t^working paper department of economics PATTERNS OF CONGRESSIONAL VOTING Keith T. Poole Kovard Rosenthal No. 536 Revised February 1990 massachusetts institute of technology 50
The California Primary and Redistricting
 The California Primary and Redistricting This study analyzes what is the important impact of changes in the primary voting rules after a Congressional and Legislative Redistricting. Under a citizen s committee,
The Case of the Disappearing Bias: A 2014 Update to the Gerrymandering or Geography Debate
 The Case of the Disappearing Bias: A 2014 Update to the Gerrymandering or Geography Debate Nicholas Goedert Lafayette College goedertn@lafayette.edu May, 2015 ABSTRACT: This note observes that the pro-republican
The Macro Polity Updated
 The Macro Polity Updated Robert S Erikson Columbia University rse14@columbiaedu Michael B MacKuen University of North Carolina, Chapel Hill Mackuen@emailuncedu James A Stimson University of North Carolina,
THE HUNT FOR PARTY DISCIPLINE IN CONGRESS #
 THE HUNT FOR PARTY DISCIPLINE IN CONGRESS # Nolan McCarty*, Keith T. Poole**, and Howard Rosenthal*** 2 October 2000 ABSTRACT This paper analyzes party discipline in the House of Representatives between
The Seventeenth Amendment, Senate Ideology, and the Growth of Government
 The Seventeenth Amendment, Senate Ideology, and the Growth of Government Danko Tarabar College of Business and Economics 1601 University Ave, PO BOX 6025 West Virginia University Phone: 681-212-9983 datarabar@mix.wvu.edu
The Case of the Disappearing Bias: A 2014 Update to the Gerrymandering or Geography Debate
 The Case of the Disappearing Bias: A 2014 Update to the Gerrymandering or Geography Debate Nicholas Goedert Lafayette College goedertn@lafayette.edu November, 2015 ABSTRACT: This note observes that the
5A. Wage Structures in the Electronics Industry. Benjamin A. Campbell and Vincent M. Valvano
 5A.1 Introduction 5A. Wage Structures in the Electronics Industry Benjamin A. Campbell and Vincent M. Valvano Over the past 2 years, wage inequality in the U.S. economy has increased rapidly. In this chapter,
Immigration and Multiculturalism: Views from a Multicultural Prairie City
 Immigration and Multiculturalism: Views from a Multicultural Prairie City Paul Gingrich Department of Sociology and Social Studies University of Regina Paper presented at the annual meeting of the Canadian
Supplementary Materials for Strategic Abstention in Proportional Representation Systems (Evidence from Multiple Countries)
") Supplementary Materials for Strategic Abstention in Proportional Representation Systems (Evidence from Multiple Countries) Guillem Riambau July 15, 2018 1 1 Construction of variables and descriptive statistics.
Supplementary Materials for Strategic Abstention in Proportional Representation Systems (Evidence from Multiple Countries) Guillem Riambau July 15, 2018 1 1 Construction of variables and descriptive statistics.
INTRODUCTION THE MEANING OF PARTY
 C HAPTER OVERVIEW INTRODUCTION Although political parties may not be highly regarded by all, many observers of politics agree that political parties are central to representative government because they
IS THE MEASURED BLACK-WHITE WAGE GAP AMONG WOMEN TOO SMALL? Derek Neal University of Wisconsin Presented Nov 6, 2000 PRELIMINARY
 IS THE MEASURED BLACK-WHITE WAGE GAP AMONG WOMEN TOO SMALL? Derek Neal University of Wisconsin Presented Nov 6, 2000 PRELIMINARY Over twenty years ago, Butler and Heckman (1977) raised the possibility
The League of Women Voters of Pennsylvania et al v. The Commonwealth of Pennsylvania et al. Nolan McCarty
 The League of Women Voters of Pennsylvania et al v. The Commonwealth of Pennsylvania et al. I. Introduction Nolan McCarty Susan Dod Brown Professor of Politics and Public Affairs Chair, Department of Politics
Political Parties Chapter Summary
 Political Parties Chapter Summary I. Introduction (234-236) The founding fathers feared that political parties could be forums of corruption and national divisiveness. Today, most observers agree that
A positive correlation between turnout and plurality does not refute the rational voter model
 Quality & Quantity 26: 85-93, 1992. 85 O 1992 Kluwer Academic Publishers. Printed in the Netherlands. Note A positive correlation between turnout and plurality does not refute the rational voter model
A Vote Equation and the 2004 Election
 A Vote Equation and the 2004 Election Ray C. Fair November 22, 2004 1 Introduction My presidential vote equation is a great teaching example for introductory econometrics. 1 The theory is straightforward,
Median voter theorem - continuous choice
 Median voter theorem - continuous choice In most economic applications voters are asked to make a non-discrete choice - e.g. choosing taxes. In these applications the condition of single-peakedness is
IDEOLOGY. Paul H. Rubin
 IDEOLOGY Paul H. Rubin Correspondence: Paul H. Rubin Department of Economics Emory University Atlanta, GA 30322 (404) 727-6365 prubin@emory.edu Forthcoming in in William F. Shughart II and Laura Razzolini,
Following the Leader: The Impact of Presidential Campaign Visits on Legislative Support for the President's Policy Preferences
 University of Colorado, Boulder CU Scholar Undergraduate Honors Theses Honors Program Spring 2011 Following the Leader: The Impact of Presidential Campaign Visits on Legislative Support for the President's
Strategic Partisanship: Party Priorities, Agenda Control and the Decline of Bipartisan Cooperation in the House
 Strategic Partisanship: Party Priorities, Agenda Control and the Decline of Bipartisan Cooperation in the House Laurel Harbridge Assistant Professor, Department of Political Science Faculty Fellow, Institute
Can Ideal Point Estimates be Used as Explanatory Variables?
 Can Ideal Point Estimates be Used as Explanatory Variables? Andrew D. Martin Washington University admartin@wustl.edu Kevin M. Quinn Harvard University kevin quinn@harvard.edu October 8, 2005 1 Introduction
What is The Probability Your Vote will Make a Difference?
 Berkeley Law From the SelectedWorks of Aaron Edlin 2009 What is The Probability Your Vote will Make a Difference? Andrew Gelman, Columbia University Nate Silver Aaron S. Edlin, University of California,
The Battleground: Democratic Perspective September 7 th, 2016
 The Battleground: Democratic Perspective September 7 th, 2016 Democratic Strategic Analysis: By Celinda Lake, Daniel Gotoff, and Corey Teter As we enter the home stretch of the 2016 cycle, the political
Res Publica 29. Literature Review
 Res Publica 29 Greg Crowe and Elizabeth Ann Eberspacher Partisanship and Constituency Influences on Congressional Roll-Call Voting Behavior in the US House This research examines the factors that influence
Changes in the location of the median voter in the U.S. House of Representatives,
 Public Choice 106: 221 232, 2001. 2001 Kluwer Academic Publishers. Printed in the Netherlands. 221 Changes in the location of the median voter in the U.S. House of Representatives, 1963 1996 BERNARD GROFMAN
Hungary. Basic facts The development of the quality of democracy in Hungary. The overall quality of democracy
 Hungary Basic facts 2007 Population 10 055 780 GDP p.c. (US$) 13 713 Human development rank 43 Age of democracy in years (Polity) 17 Type of democracy Electoral system Party system Parliamentary Mixed:
connect the people to the government. These institutions include: elections, political parties, interest groups, and the media.
 Overriding Questions 1. How has the decline of political parties influenced elections and campaigning? 2. How do political parties positively influence campaigns and elections and how do they negatively
Designing Weighted Voting Games to Proportionality
 Designing Weighted Voting Games to Proportionality In the analysis of weighted voting a scheme may be constructed which apportions at least one vote, per-representative units. The numbers of weighted votes
The Cook Political Report / LSU Manship School Midterm Election Poll
 The Cook Political Report / LSU Manship School Midterm Election Poll The Cook Political Report-LSU Manship School poll, a national survey with an oversample of voters in the most competitive U.S. House
! # % & ( ) ) ) ) ) +,. / 0 1 # ) 2 3 % ( &4& 58 9 : ) & ;; &4& ;;8;
 ) ) ) ) +,. / 0 1 # ) 2 3 % ( &4& 58 9 : ) & ;; &4& ;;8;") ! # % & ( ) ) ) ) ) +,. / 0 # ) % ( && : ) & ;; && ;;; < The Changing Geography of Voting Conservative in Great Britain: is it all to do with Inequality? Journal: Manuscript ID Draft Manuscript Type: Commentary
! # % & ( ) ) ) ) ) +,. / 0 # ) % ( && : ) & ;; && ;;; < The Changing Geography of Voting Conservative in Great Britain: is it all to do with Inequality? Journal: Manuscript ID Draft Manuscript Type: Commentary
Labor markets in the Tenth District are
 Will Tightness in Tenth District Labor Markets Result in Economic Slowdown? By Ricardo C. Gazel and Chad R. Wilkerson Labor markets in the Tenth District are tighter now than at any time in recent memory.
Health Care Speech Brings Small Rebound for Democrats and Serious Problems for Republicans
 Date: September 23, 2009 To: From: Friends of Democracy Corps and Greenberg Quinlan Rosner Research Stanley B. Greenberg, James Carville, Jesse Contario and Kate Monninger Health Care Speech Brings Small
1. A Republican edge in terms of self-described interest in the election. 2. Lower levels of self-described interest among younger and Latino
 2 Academics use political polling as a measure about the viability of survey research can it accurately predict the result of a national election? The answer continues to be yes. There is compelling evidence
EXTENDING THE SPHERE OF REPRESENTATION:
 EXTENDING THE SPHERE OF REPRESENTATION: THE IMPACT OF FAIR REPRESENTATION VOTING ON THE IDEOLOGICAL SPECTRUM OF CONGRESS November 2013 Extend the sphere, and you take in a greater variety of parties and
Introduction CHAPTER 1. Overview
 CHAPTER 1 Introduction Overview In this book I show how to use a simple spatial model of voting as a tool to analyze parliamentary roll call data. Each legislator is represented by one point, and each
Young Voters in the 2010 Elections
 Young Voters in the 2010 Elections By CIRCLE Staff November 9, 2010 This CIRCLE fact sheet summarizes important findings from the 2010 National House Exit Polls conducted by Edison Research. The respondents
Corruption and business procedures: an empirical investigation
 Corruption and business procedures: an empirical investigation S. Roy*, Department of Economics, High Point University, High Point, NC - 27262, USA. Email: sroy@highpoint.edu Abstract We implement OLS,
Segal and Howard also constructed a social liberalism score (see Segal & Howard 1999).
.") APPENDIX A: Ideology Scores for Judicial Appointees For a very long time, a judge s own partisan affiliation 1 has been employed as a useful surrogate of ideology (Segal & Spaeth 1990). The approach treats
APPENDIX A: Ideology Scores for Judicial Appointees For a very long time, a judge s own partisan affiliation 1 has been employed as a useful surrogate of ideology (Segal & Spaeth 1990). The approach treats
Partisan Advantage and Competitiveness in Illinois Redistricting
 Partisan Advantage and Competitiveness in Illinois Redistricting An Updated and Expanded Look By: Cynthia Canary & Kent Redfield June 2015 Using data from the 2014 legislative elections and digging deeper
Of Shirking, Outliers, and Statistical Artifacts: Lame-Duck Legislators and Support for Impeachment
 Of Shirking, Outliers, and Statistical Artifacts: Lame-Duck Legislators and Support for Impeachment Christopher N. Lawrence Saint Louis University An earlier version of this note, which examined the behavior
FOURIER ANALYSIS OF THE NUMBER OF PUBLIC LAWS David L. Farnsworth, Eisenhower College Michael G. Stratton, GTE Sylvania
 FOURIER ANALYSIS OF THE NUMBER OF PUBLIC LAWS 1789-1976 David L. Farnsworth, Eisenhower College Michael G. Stratton, GTE Sylvania 1. Introduction. In an earlier study (reference hereafter referred to as
Persistent Economic Discontent Casts a Continuing Political Pall
 ABC NEWS/WASHINGTON POST POLL: POST-ELECTION POLITICS EMBARGOED FOR RELEASE AFTER 5 p.m. Tuesday, Dec. 14, 2010 Persistent Economic Discontent Casts a Continuing Political Pall Congressional Republicans
Sincere Versus Sophisticated Voting When Legislators Vote Sequentially
 Sincere Versus Sophisticated Voting When Legislators Vote Sequentially Tim Groseclose Departments of Political Science and Economics UCLA Jeffrey Milyo Department of Economics University of Missouri September
Patterns of Poll Movement *
 Patterns of Poll Movement * Public Perspective, forthcoming Christopher Wlezien is Reader in Comparative Government and Fellow of Nuffield College, University of Oxford Robert S. Erikson is a Professor
Accountability, Divided Government and Presidential Coattails.
 Presidential VS Parliamentary Elections Accountability, Divided Government and Presidential Coattails. Accountability Presidential Coattails The coattail effect is the tendency for a popular political
'Wave riding' or 'Owning the issue': How do candidates determine campaign agendas?
 'Wave riding' or 'Owning the issue': How do candidates determine campaign agendas? Mariya Burdina University of Colorado, Boulder Department of Economics October 5th, 008 Abstract In this paper I adress
Incumbency Advantages in the Canadian Parliament
 Incumbency Advantages in the Canadian Parliament Chad Kendall Department of Economics University of British Columbia Marie Rekkas* Department of Economics Simon Fraser University mrekkas@sfu.ca 778-782-6793
Monthly Census Bureau data show that the number of less-educated young Hispanic immigrants in the
 Backgrounder Center for Immigration Studies July 2009 A Shifting Tide Recent Trends in the Illegal Immigrant Population By Steven A. Camarota and Karen Jensenius Monthly Census Bureau data show that the
Explaining the Deteriorating Entry Earnings of Canada s Immigrant Cohorts:
 Explaining the Deteriorating Entry Earnings of Canada s Immigrant Cohorts: 1966-2000 Abdurrahman Aydemir Family and Labour Studies Division Statistics Canada aydeabd@statcan.ca 613-951-3821 and Mikal Skuterud
A Powerful Agenda for 2016 Democrats Need to Give Voters a Reason to Participate
 Date: June 29, 2015 To: Friends of and WVWVAF From: Stan Greenberg and Nancy Zdunkewicz, Page Gardner, Women s Voices Women Vote Action Fund A Powerful Agenda for 2016 Democrats Need to Give Voters a Reason
1. The Relationship Between Party Control, Latino CVAP and the Passage of Bills Benefitting Immigrants
 The Ideological and Electoral Determinants of Laws Targeting Undocumented Migrants in the U.S. States Online Appendix In this additional methodological appendix I present some alternative model specifications
Unequal Recovery, Labor Market Polarization, Race, and 2016 U.S. Presidential Election. Maoyong Fan and Anita Alves Pena 1
 Unequal Recovery, Labor Market Polarization, Race, and 2016 U.S. Presidential Election Maoyong Fan and Anita Alves Pena 1 Abstract: Growing income inequality and labor market polarization and increasing
GENDER EQUALITY IN THE LABOUR MARKET AND FOREIGN DIRECT INVESTMENT
 THE STUDENT ECONOMIC REVIEWVOL. XXIX GENDER EQUALITY IN THE LABOUR MARKET AND FOREIGN DIRECT INVESTMENT CIÁN MC LEOD Senior Sophister With Southeast Asia attracting more foreign direct investment than
Chapter 6 Online Appendix. general these issues do not cause significant problems for our analysis in this chapter. One
 Chapter 6 Online Appendix Potential shortcomings of SF-ratio analysis Using SF-ratios to understand strategic behavior is not without potential problems, but in general these issues do not cause significant
Gender preference and age at arrival among Asian immigrant women to the US
 Gender preference and age at arrival among Asian immigrant women to the US Ben Ost a and Eva Dziadula b a Department of Economics, University of Illinois at Chicago, 601 South Morgan UH718 M/C144 Chicago,
Research Statement. Jeffrey J. Harden. 2 Dissertation Research: The Dimensions of Representation
 Research Statement Jeffrey J. Harden 1 Introduction My research agenda includes work in both quantitative methodology and American politics. In methodology I am broadly interested in developing and evaluating
Comparing Floor-Dominated and Party-Dominated Explanations of Policy Change in the House of Representatives
 Comparing Floor-Dominated and Party-Dominated Explanations of Policy Change in the House of Representatives Cary R. Covington University of Iowa Andrew A. Bargen University of Iowa We test two explanations
Powersharing, Protection, and Peace. Scott Gates, Benjamin A. T. Graham, Yonatan Lupu Håvard Strand, Kaare W. Strøm. September 17, 2015
 Powersharing, Protection, and Peace Scott Gates, Benjamin A. T. Graham, Yonatan Lupu Håvard Strand, Kaare W. Strøm September 17, 2015 Corresponding Author: Yonatan Lupu, Department of Political Science,
THE WORKMEN S CIRCLE SURVEY OF AMERICAN JEWS. Jews, Economic Justice & the Vote in Steven M. Cohen and Samuel Abrams
 THE WORKMEN S CIRCLE SURVEY OF AMERICAN JEWS Jews, Economic Justice & the Vote in 2012 Steven M. Cohen and Samuel Abrams 1/4/2013 2 Overview Economic justice concerns were the critical consideration dividing
Introduction. Chapter State University of New York Press, Albany
 Chapter 1 Introduction Divided nation. Polarized America. These are the terms conspicuously used when the media, party elites, and voters describe the United States today. Every day, various news media
Using Poole s Optimal Classification in R
 Using Poole s Optimal Classification in R January 22, 2018 1 Introduction This package estimates Poole s Optimal Classification scores from roll call votes supplied though a rollcall object from package
Case Study: Get out the Vote
 Case Study: Get out the Vote Do Phone Calls to Encourage Voting Work? Why Randomize? This case study is based on Comparing Experimental and Matching Methods Using a Large-Scale Field Experiment on Voter
Poverty Reduction and Economic Growth: The Asian Experience Peter Warr
 Poverty Reduction and Economic Growth: The Asian Experience Peter Warr Abstract. The Asian experience of poverty reduction has varied widely. Over recent decades the economies of East and Southeast Asia
Schooling and Cohort Size: Evidence from Vietnam, Thailand, Iran and Cambodia. Evangelos M. Falaris University of Delaware. and
 Schooling and Cohort Size: Evidence from Vietnam, Thailand, Iran and Cambodia by Evangelos M. Falaris University of Delaware and Thuan Q. Thai Max Planck Institute for Demographic Research March 2012 2
parties and party systems
 A/449268 classics Series Editor: Alan Ware University of Oxford parties and party systems a framework for analysis Giovanni Sartori with a new preface by the author and an introduction by Peter Mair contents
UNIVERSITY OF CALIFORNIA DAVIS. MAR 1 G i989. Agricultural Econormcs Library. The Demand for Groundwater Quality Legislation -
 C / : r UNIVERSITY OF CALIFORNIA DAVIS MAR 1 G i989 Agricultural Econormcs Library The Demand for Groundwater Quality Legislation - An Economic Analysis of Voting Behavior Thomas P.lHolmes./ us Economic
Economy Hits Dems, GOP Out of Touch Pushing Anti-Incumbency to a 25-Year High
 ABC NEWS/WASHINGTON POST POLL: 2014 Politics EMBARGOED FOR RELEASE AFTER 12:01 a.m. Tuesday, March 4, 2014 Economy Hits Dems, GOP Out of Touch Pushing Anti-Incumbency to a 25-Year High Anti-incumbent sentiment
A Revolt Against the Status Quo Gives the Republicans a Record Lead
 ABC NEWS/WASHINGTON POST POLL: THE 2010 MIDTERMS EMBARGOED FOR RELEASE AFTER 12:01 a.m. Tuesday, September 7, 2010 A Revolt Against the Status Quo Gives the Republicans a Record Lead Swelling economic
RUSSELL SAGE FOUNDATION
 RUSSELL SAGE FOUNDATION Working Paper #201 POLITICAL POLARIZATION AND INCOME INEQUALITY Nolan McCarty Keith T. Poole Howard Rosenthal February 2003 Russell Sage Working Papers have not been reviewed by
Patrick Adler and Chris Tilly Institute for Research on Labor and Employment, UCLA. Ben Zipperer University of Massachusetts, Amherst
 THE STATE OF THE UNIONS IN 2013 A PROFILE OF UNION MEMBERSHIP IN LOS ANGELES, CALIFORNIA AND THE NATION 1 Patrick Adler and Chris Tilly Institute for Research on Labor and Employment, UCLA Ben Zipperer
AMERICAN JOURNAL OF UNDERGRADUATE RESEARCH VOL. 3 NO. 4 (2005)
") , Partisanship and the Post Bounce: A MemoryBased Model of Post Presidential Candidate Evaluations Part II Empirical Results Justin Grimmer Department of Mathematics and Computer Science Wabash College
, Partisanship and the Post Bounce: A MemoryBased Model of Post Presidential Candidate Evaluations Part II Empirical Results Justin Grimmer Department of Mathematics and Computer Science Wabash College
Case 1:17-cv TCB-WSD-BBM Document 94-1 Filed 02/12/18 Page 1 of 37
 Case 1:17-cv-01427-TCB-WSD-BBM Document 94-1 Filed 02/12/18 Page 1 of 37 REPLY REPORT OF JOWEI CHEN, Ph.D. In response to my December 22, 2017 expert report in this case, Defendants' counsel submitted
Politics in Newfoundland and Labrador
 Politics in Newfoundland and Labrador A survey of eligible voters on provincial politics. David Coletto June 29, 2015 Methodology Survey Methodology 722 eligible voters in NL were surveyed using live telephone
Executive Summary. 1 Page
 ANALYSIS FOR THE ORGANIZATION OF AMERICAN STATES (OAS) by Dr Irfan Nooruddin, Professor, Walsh School of Foreign Service, Georgetown University 17 December 2017 Executive Summary The dramatic vote swing
Robert H. Prisuta, American Association of Retired Persons (AARP) 601 E Street, N.W., Washington, D.C
 601 E Street, N.W., Washington, D.C") A POST-ELECTION BANDWAGON EFFECT? COMPARING NATIONAL EXIT POLL DATA WITH A GENERAL POPULATION SURVEY Robert H. Prisuta, American Association of Retired Persons (AARP) 601 E Street, N.W., Washington, D.C.
A POST-ELECTION BANDWAGON EFFECT? COMPARING NATIONAL EXIT POLL DATA WITH A GENERAL POPULATION SURVEY Robert H. Prisuta, American Association of Retired Persons (AARP) 601 E Street, N.W., Washington, D.C.
MEMORANDUM. Independent Voter Preferences
 MEMORANDUM TO: Interested Parties FROM: Ed Gillespie, Whit Ayres and Leslie Sanchez DATE: November 9, 2010 RE: Post-Election Poll Highlights: Independents Propel Republican Victories in 2010 The 2010 mid-term
A Global Economy-Climate Model with High Regional Resolution
 A Global Economy-Climate Model with High Regional Resolution Per Krusell Institute for International Economic Studies, CEPR, NBER Anthony A. Smith, Jr. Yale University, NBER February 6, 2015 The project
Immigration and Internal Mobility in Canada Appendices A and B. Appendix A: Two-step Instrumentation strategy: Procedure and detailed results
 Immigration and Internal Mobility in Canada Appendices A and B by Michel Beine and Serge Coulombe This version: February 2016 Appendix A: Two-step Instrumentation strategy: Procedure and detailed results
This journal is published by the American Political Science Association. All rights reserved.
 Article: National Conditions, Strategic Politicians, and U.S. Congressional Elections: Using the Generic Vote to Forecast the 2006 House and Senate Elections Author: Alan I. Abramowitz Issue: October 2006
Public Preference for a GOP Congress Marks a New Low in Obama s Approval
 ABC NEWS/WASHINGTON POST POLL: Obama and 2014 Politics EMBARGOED FOR RELEASE AFTER 12:01 a.m. Tuesday, April 29, 2014 Public Preference for a GOP Congress Marks a New Low in Obama s Approval Weary of waiting
Enriqueta Aragones Harvard University and Universitat Pompeu Fabra Andrew Postlewaite University of Pennsylvania. March 9, 2000
 Campaign Rhetoric: a model of reputation Enriqueta Aragones Harvard University and Universitat Pompeu Fabra Andrew Postlewaite University of Pennsylvania March 9, 2000 Abstract We develop a model of infinitely
The Impact of Interprovincial Migration on Aggregate Output and Labour Productivity in Canada,
 The Impact of Interprovincial Migration on Aggregate Output and Labour Productivity in Canada, 1987-26 Andrew Sharpe, Jean-Francois Arsenault, and Daniel Ershov 1 Centre for the Study of Living Standards
Political Parties. Chapter 9
 Political Parties Chapter 9 Political Parties What Are Political Parties? Political parties: organized groups that attempt to influence the government by electing their members to local, state, and national
Coalition Formation and Selectorate Theory: An Experiment - Appendix
 Coalition Formation and Selectorate Theory: An Experiment - Appendix Andrew W. Bausch October 28, 2015 Appendix Experimental Setup To test the effect of domestic political structure on selection into conflict
Congressional Agenda Control and the Decline of Bipartisan Cooperation
 Congressional Agenda Control and the Decline of Bipartisan Cooperation Laurel Harbridge Northwestern University College Fellow, Department of Political Science College Fellow, Institute for Policy Research
CALTECH/MIT VOTING TECHNOLOGY PROJECT A
 CALTECH/MIT VOTING TECHNOLOGY PROJECT A multi-disciplinary, collaborative project of the California Institute of Technology Pasadena, California 91125 and the Massachusetts Institute of Technology Cambridge,
Learning and Visualizing Political Issues from Voting Records Erik Goldman, Evan Cox, Mikhail Kerzhner. Abstract
 Learning and Visualizing Political Issues from Voting Records Erik Goldman, Evan Cox, Mikhail Kerzhner Abstract For our project, we analyze data from US Congress voting records, a dataset that consists
Minnesota Public Radio News and Humphrey Institute Poll. Coleman Lead Neutralized by Financial Crisis and Polarizing Presidential Politics
 Minnesota Public Radio News and Humphrey Institute Poll Coleman Lead Neutralized by Financial Crisis and Polarizing Presidential Politics Report prepared by the Center for the Study of Politics and Governance
Congressional Agenda Control and the Decline of Bipartisan Cooperation
 Congressional Agenda Control and the Decline of Bipartisan Cooperation Laurel Harbridge Northwestern University College Fellow, Department of Political Science l-harbridge@northwestern.edu Electoral incentives
SCATTERGRAMS: ANSWERS AND DISCUSSION
 POLI 300 PROBLEM SET #11 11/17/10 General Comments SCATTERGRAMS: ANSWERS AND DISCUSSION In the past, many students work has demonstrated quite fundamental problems. Most generally and fundamentally, these
Part I: Univariate Spatial Model (20%)
") 17.251 Fall 2012 Midterm Exam answers Directions: Do the following problem. Part I: Univariate Spatial Model (20%) The nation is faced with a situation in which, if legislation isn t passed, the level
17.251 Fall 2012 Midterm Exam answers Directions: Do the following problem. Part I: Univariate Spatial Model (20%) The nation is faced with a situation in which, if legislation isn t passed, the level