AND WEST UKRAINE (N=173)
|
|
|
- Anna Perry
- 5 years ago
- Views:
Transcription
1 ATTITUDES TOWARD CHANGE, THE CURRENT SITUATION, AND CIVIC ACTION IN UKRAINE THOMAS P. CARSON, PH.D. PREPARED FOR THE INTERNATIONAL FOUNDATION FOR ELECTION SYSTEMS SAMPLE: 1,500 NATIONAL WITH OVERSAMPLES IN KYIV (N=127) AND WEST UKRAINE (N=173) FIELDWORK: NOVEMBER 28-DECEMBER 5, 2000 INTERVIEWING: SOCIS-GALLUP, KYIV THIS PUBLICATION WAS MADE POSSIBLE THROUGH SUPPORT PROVIDED BY THE OFFICE OF DEMOCRACY AND GOVERNANCE, BUREAU FOR EUROPE AND THE NEW INDEPENDENT STATES, U.S. AGENCY FOR INTERNATIONAL DEVELOPMENT (USAID), UNDER THE TERMS OF COOPERATIVE AGREEMENT NO. EE-A THE OPINIONS EXPRESSED HEREIN ARE THOSE OF THE AUTHOR AND DO NOT NECESSARILY REFLECT THE VIEWS OF USAID OR IFES.
2 This Mission and report were made possile y a grant from the United States Agency for International Development (USAID). This material is in the pulic domain and may e reproduced without permission; citation is appreciated. International Foundation for Election Systems, Washington, D.C Pulished Feruary 2001
3 Attitudes toward Change, the Current Situation and Civic Action in Ukraine: IFES Surveys, Tale of Contents I. Introduction...1 II. Executive Summary...2 III. Attitudes toward Change...6 Perceptions of Social Change in Ukraine... 6 Political Change in Ukraine... 9 Economic Change in Ukraine IV. Attitudes toward the Current Situation...20 Satisfaction with the Overall Situation in Ukraine The View on Corruption Confidence in Leadership and Institutions V. Civic Action, Participation and Sources of Information...28 A. Individual Action Attitudes toward Politics Political Action Electoral Action Support for Human Rights B. Institutional Action Government Political Parties Attitudes toward Non-Governmental Organizations Pulic Information and Media VI. Variations in Attitudes...46 Over Time and People Regional Variations VII. Conclusion...51 APPENDICES Appendix 1: Decemer 2000 Data Appendix 2: The Trend Data Set Appendix 3: Regional Classifications Map of Ukraine
4
5 International Foundation for Election Systems 1 I. Introduction Between the dates of Novemer 28 and Decemer 5, 2000, 1500 adults from across Ukraine were interviewed for the latest national opinion survey commissioned y the International Foundation for Election Systems (IFES). This report summarizes many of these findings, and places them in the context of previous IFES surveys conducted in Ukraine starting in The nationally representative sample included 1,200 face-to-face interviews of adults 18 years of age and aove. Oversamples of 127 in Kyiv and 173 in several olasts in the west of Ukraine were also conducted. The sample was weighted and is representative of the adult population y age, sex, and region. All surveys are suject to errors caused y interviewing a sample rather than the entire population. The theoretical margin of error for a sample of 1,500 is +/- 2.5 at a 95 percent confidence level. The project director and principal analyst for this latest Ukrainian survey was Interviewing was completed y SOCIS-Gallup, Kyiv, under the direction of Oksana Bandurovych. This current survey relies heavily upon IFES cumulative experience with opinion surveys in Ukraine. The questionnaire is a cumulative effort, using the information and experience gained from all previous IFES work carried out in Ukraine, with additional focus placed on emerging interests. This is the seventh national survey commissioned y IFES in Ukraine. Previous IFES project directors include: Elehie Natalie Skoczylas and Gary A. Ferguson. This present work owes much to their efforts. The formatted report and tales were provided y Rakesh Sharma, IFES Applied Research Officer, with editorial assistance provided y Carrie Ellis, IFES Senior Program Assistant, and Nathan Van Dusen, IFES Program Assistant. Béla Lehosik assisted in the statistical analysis and preparation of presentation materials for this project. Over the years, Konstantyn Shevchenko has een the primary IFES staff person in Kyiv responsile for many of these surveys. His assistance and insight into the research findings have enefited the final results. This survey report Provides findings on attitudes toward social, political, and economic change in Ukraine over the previous decade; Descries the pulic s assessment of current conditions in Ukraine concerning overall satisfaction, corruption, and confidence in institutions and leaders; Examines individual attitudes toward politics, political action, participation in elections, and human rights; Descries Ukrainians experience with their elected and appointed officials, political parties, and nongovernmental organizations; Provides pulic evaluations of the amount and quality of information availale to Ukrainians aout political and economic developments and the performance of media; and Summarizes variations in attitudes across social groups and geographical regions in Ukraine. This pulication was made possile through funding provided y the US Agency for International Development.
6 International Foundation for Election Systems 2 II. Executive Summary The Perception of Social Change in Ukraine Nearly all Ukrainians (85%) remark that they have oserved major changes that affect the lives of most people over the last ten years. When asked aout the events of the last decade, 54% mention that the decrease in the standard of living, is the main ad thing that has happened in Ukraine, and 57% that nothing good has happened in the country. The most frequently mentioned positive event, cited y 14%, is Ukrainian independence. Political Change in Ukraine Decemer 2000 data show that: The numer who elieve yes, Ukraine is a democracy has fallen from the somewhat higher figures reached after the 1999 presidential elections. Of those who elieve Ukraine is not a democracy, only 23% elieve it is ecoming one. The numer who elieve political reforms are not happening fast enough has risen again, though it remains elow the 1999 high point. Economic Change in Ukraine Twenty-six percent favor a centrally planned economy and 32% favor a market economy, while 32% favor a system in-etween the two. Satisfaction with the Overall Situation in Ukraine Dissatisfaction appears endemic to Ukrainian consciousness at this point in time. The total level of dissatisfaction has constantly stayed near or aove the 90% level throughout the entire period covered y IFES surveys. The percentage of those very dissatisfied has started to increase according to the recent findings of Decemer The economic situation appears to e the leading factor ehind these negative attitudes. On the whole, dissatisfaction has remained relatively stale over the course of the IFES surveys. The View on Corruption Corruption has een overwhelmingly perceived as common and serious throughout the period that IFES has asked these questions. The Decemer 2000 data does not exhiit a deviation from this pattern. Trend data from IFES surveys indicates that a decline in the commonness of corruption rings relatively small drops in the perceived seriousness of corruption. That is, even though Ukrainians might think that corruption is not as common in a particular survey, their perception of the seriousness of the prolem does not change much. Decemer 2000 findings also show that the perception of the extent of corruption varies across regions in Ukraine, ut attitudes toward the seriousness of it do not vary accordingly. Confidence in Leadership and Institutions The Decemer 2000 survey shows: Ukrainians have the highest level of confidence in the Church: 32% state they have a great amount of confidence.
7 International Foundation for Election Systems 3 Ukrainians report higher levels of confidence in the Prime Minister, Viktor Yushchenko, than in the President, Leonid Kuchma: 12% report a great amount of confidence in Yushchenko versus 8% for Kuchma. The Supreme Rada is rated lower than President Kuchma (3% with a great amount of confidence). Local government and Local Self-Government are oth rated higher than national-level institutions such as the Council of Ministers, the Supreme Rada, and the Presidential Administration. Police receive among the lowest confidence ratings on the list. Attitudes toward Politics Ukrainians are convinced that they have little influence on decisions in Ukraine, and are not convinced that they can change this through the electoral process: 61% at least somewhat disagree with the statement: Voting gives people like me a chance to influence decision-making in our country. Of these, 33% strongly disagree with this statement. 80% at least somewhat agree with the statement: People like me have little or no influence on the way things are run in Ukraine. Of these, 52% strongly agree with this statement. 76% at least somewhat agree with the statement: Sometimes politics is so complicated that people like me can t understand what s really happening. Of these, 44% strongly agree. Despite the fact that most Ukrainians feel alienated from their political system and their representative government, many state that they are interested in politics. Overall, 65% are at least somewhat interested, and only 11% state they are not at all interested. Decemer 2000 results show that 18% are very interested in politics, 47% are somewhat interested in politics, 23% are not too interested in politics, and 11% are not at all interested in politics. The majority of people (58%) discuss politics at least sometimes. Of these, one out of four discuss politics often. Forty-two percent rarely or never discuss political issues. Interest in politics and the desire to discuss political issues increase with age, as younger respondents are less interested and less likely to discuss politics. Attitudes toward Political Action Respondents tended to express support for old versus cautious change: 13% favor positions advocating the most cautious approach to change, and 24% favor moderately cautious action. 31% favor moderately old action, and 26% favor positions advocating the most old approach to change. In the Decemer 2000 survey, IFES asked what the respondent would do if their elected representative was recalled and replaced with another person chosen y officials at a higher level. Results indicate that 25% would do nothing, ecause it is none of their concern, 34% would do nothing, ecause it is useless to complain, 5% would complain, ut nothing else, 4% would pulicly protest, 6% stated that such things do not happen in Ukraine, and 17% stated that it depended upon whether there was a good reason for recalling the elected representative.
8 International Foundation for Election Systems 4 Attitudes toward Elections Leading issues respondents want their elected officials to work on, according to Decemer 2000 data, include: Economic Issues: Raise the standard of living and the amount workers receive in their pay envelopes (30%) Economic development (16%) Resolve unemployment and underemployment (15%) Jo security and creation of opportunities to work (10%) Better pensions (6%) Payment of wage and pension arrears (4%) Lower price level (3%) Law and Order: Law and Order (8%) Eliminate crime and corruption (5%) Social Services: Free access to pulic services (10%) Decreased fees for community services (3%) Many stated that they Did not know (18%), and a few (2%) mentioned agricultural reform. Experience with Government Officials Overall, 24% state they have contacted an elected official efore to help solve a prolem in their lives. Usually, contact was made with the chair of the village or settlement (43% of those contacting an elected official). The city chairman or mayor was contacted half as frequently (21% of those contacting elected officials). Relatively few attempts were made to contact other elected officials. Personal meetings are the most frequent form of contact with elected officials (78% of those contacting elected officials). Letter writing was mentioned y 21%. Most of the attempts to contact an elected official resulted in a response from the official (73%). Twelve percent received a partial response and 15% claim that they received no response from the official. In total, one out of four adult Ukrainians have attempted to contact an elected official. Of these, 73% manage to arrange a meeting. Half of those who do meet are not satisfied with the response they get, and just under half are satisfied. Approximately one out of every six adult Ukrainians (17%) has contacted an appointed official to help resolve a prolem in their life. Nearly all of these contacts were with local executive odies (88% of 260). Fewer people have gone further to the olast level or eyond with their prolem. At the same time, 86% of respondents state that no attempt has een made y pulic officials to contact them and learn of their opinions. Non-Governmental Organizations Many NGOs enjoy relatively high levels of trust, etween 40% and 50% of respondents declaring at least some trust in them. At the same time, very few people are memers. Trade unions have the highest reported memership, with 12% claiming they elong to a trade union. Three percent claim memership in religious organizations. No other group commands more than 1%. Of all the groups mentioned, only memers of trade unions claim they pay memership fees.
9 International Foundation for Election Systems 5 The Decemer 2000 survey also asked respondents which organizations they may join in the future. Welfare organizations received the highest mention (7%). Human rights groups were mentioned y 5% and women s organizations y 4%. Very few respondents, however, report that they go to NGOs for help in resolving their prolems. According to the Decemer 2000 data, 7% claim that they have gone to their trade unions for help and only 2% claim that they have gone to a welfare organization for help. No other organization registers over a 1% mention. Pulic Information and Media The Decemer 2000 survey finds that the pulic has a greater amount of political information in comparison to previous years. In 1997, 71% stated they had either no information at all or not very much information aout political developments in Ukraine. A year later, the June 1998 data show that 63% gave this response, followed y 54% in June 1999 efore the presidential elections of that year. In Decemer 2000, the majority (60%) now reports at least a fair amount of political information. In July 1997, 72% claimed they did not receive enough information on economic developments. This declined slightly in 1998 (70%), and declined significantly in 1999 (58%). The Decemer 2000 data still indicate that a majority does not receive enough information aout economic developments in Ukraine. Once again, however, the percentage reporting that they do not receive enough information has declined (51%). However, respondents also note that they do not have enough information regarding the privatization of pulic enterprises. In total, 70% replied that they are either not informed at all (28%) or not well informed (42%) aout the government s activities concerning privatization. Knowledge of economic developments at the local level is particularly weak, with less than 10% claiming that they are at least somewhat informed aout the allocation of their local community udgets. In total, 84% respond that they are not well informed or not at all informed. Of these, 62% give the extreme answer of not at all informed. Those who are informed aout the local udget were asked where they received their information: 14% saw something on television, 11% read aout the local udget in the local newspapers, and 6% heard something on the radio. Others know something aout the local udget ecause it was discussed during elections (7%). Almost an equal numer received their information through unofficial sources (6%), and even fewer heard official announcements at other times than during elections (2%). The Ukrainian pulic perceives that the media is in a difficult position. The Decemer 2000 survey asked: In your opinion, how safe is it for media in Ukraine to roadcast or print their true opinions, even if these opinions are critical of the government? Less than 20% elieve it is safe. A plurality (42%) elieve it is somewhat dangerous for media to print or roadcast their true opinions. Another 24% elieve it is very dangerous to do so. * * * * * * * The following report is organized into six sections, a conclusion, and appendices. Section I, aove, provides an introduction to the report, while Section II highlights some of the most important findings from the ody of the report. Following this, Section III covers the area of social, political, and economic change as perceived y Ukrainians as measured in IFES surveys starting in Section IV looks at attitudes toward the situation in Ukraine. The next section, V, consists of two parts: a) Political Action and ) Institutional Action. This section provides information on attitudes toward political efficacy and actions and experience with government officials, political parties, and non-governmental organizations. It also includes evaluations of the amount of information availale concerning politics and the economy and the media y which Ukrainians otain this information. Finally, Section VI summarizes variations in attitudes.
10 International Foundation for Election Systems 6 III. Attitudes toward Change Perceptions of Social Change in Ukraine The reakup of the Soviet Union in 1991, along with Ukrainian independence in the same year, accelerated the pace of political change as Ukrainian institutions were created to replace Soviet ones and the new country moved closer toward oth Western democracy and a market economy. These are among the most apparent changes oserved from outside Ukraine over the last ten years. Those within the country experienced this change on a much deeper level. Institutions, ways of living, and social relationships changed virtually overnight. When asked to assess the extent, nearly all Ukrainians (85%) remark that they have oserved major changes that effect the lives of most people over these last ten years. 1 This opinion is held almost uniformly y all age groups, men and women regardless of income, ethnicity, level of education, or place of residence. There is a notale exception to this general pattern. Ukrainians living in the western part of the country are less unified in their opinions. 2 Only 80%, versus 88% in the east and 85% of those in-etween east and west, have oserved major changes. More than one out of ten western Ukrainians (12%) elieve that change has had little impact over the last ten years. Few Ukrainians give this response from other areas of the country. Though most agree change has een vast, what this means varies widely. While some have enefited, most elieve they have een hurt. Economic themes lead the list of changes mentioned y Ukrainians. Continuous disappointment with economic struggle seems to oscure the tremendous political changes that have occurred. When asked aout change, Ukrainians do mention independence and signs of national identity, such as national flags and symols, ut economic change is mentioned more frequently. Other changes, such as a perceived rise in crime and corruption, are also on the pulic mind. In the Decemer 2000 survey, respondents were asked to list good and ad events that have occurred over the last ten years, for oth the country and themselves. Answers were given in an open format, and many respondents gave multiple answers. Responses were then thematically coded. Figure 1 displays results for this series of four questions (multiple answers were allowed, and the percentages do not add to 100%). On the left are presented respondents list of good and ad things that have happened in Ukraine over the last decade. The most frequently mentioned ad and good things that happened in the respondents personal lives are listed on the right side of the tale. As the figure illustrates, the majority of respondents say that nothing good has happened in Ukraine or their personal lives. At this point in time, the answers reflect an overall negative assessment of the previous ten-year period. 1 Decemer 2000 data Do you elieve that major changes in Ukraine have effected the lives of most people, or do you elieve that the changes here have had little effect on the lives of most Ukrainians? 2 The East/West classification is used extensively in this report. For details, refer to Appendix 3, elow.
11 International Foundation for Election Systems 7 Figure 1. Good And Bad Events Over the Last Decade (n=1,500) UKRAINE % PERSONAL LIFE % Good Things Good Things Nothing 57 Nothing 56 Ukrainian independence 14 Birth of children, grandchildren 16 Increase in personal freedom 10 Educational advancement 8 Creation of conditions for usiness 4 Wedding 7 Increased availaility of material goods 4 Improved material position 4 Peace and calm 3 Employment advancement 4 Adoption of national symolism 2 Receipt/uying of apartment/house 4 Land reform 2 Other 1 Bad Things Bad Things Decrease in standard of living 54 Lowered standard of living 41 Unemployment 28 Unemployment 17 Economic crisis 13 Death of relatives 14 Rise in crime 7 Illness/Unale to afford treatment 11 Decline in social support 7 Nothing ad happened 6 Corruption 4 Loss of deposits in USSR anks 5 Decline in law and order 3 Divorce 3 Increased social stratification 3 Delays with wage payments 2 Regardless, good things have happened for oth Ukraine and people s private lives. The leading positive event given y 14% is Ukrainian independence. Another 10% mention an increase in personal freedoms, such as speech and travel. Economic change, such as an improvement in usiness conditions (4%) and increased availaility of material goods (4%), is also mentioned. Positive events in private life mostly refer to normal life events, such as weddings (7%), irth of children (16%), and uying or receiving a house or apartment (4%). Respondents also mention improved material position (4%) and educational (8%) and employment advancement (4%). However, the nays are dominant. For most, a decrease in the standard of living is mentioned (54%), along with unemployment (28%) and economic crisis (13%). Other responses also refer to the consequences of adverse economic conditions: decline in social support (7%) and increased social stratification (3%). Themes relating to crime are next most frequent responses. Several (7%) mention a rise in crime. Others (4%) speak of a general decline in law and order, or a decline in cultural standards and morality (2%). Corruption is mentioned y 4%. Specific negative political events (if they may e classified this way) include the collapse of the USSR (3%) and that leaders from the previous regime have stayed in power (2%). Lower standard of living dominates as the most frequently given adverse event in the respondents own lives, mentioned y 41%. Unemployment follows at 17%. Death of relatives (14%), illness and inaility to afford treatment (11%), and divorce (3%) are also mentioned. Few report that they have een victims of crime (<1%), although crime was frequently mentioned as a ad event for the country. Overall, three out of four respondents (76%) report that the total effect of the last ten years of change has hurt them and their families. Of these, nearly half (48%) choose the extreme end of the scale, indicating a strong and negative answer to this question. A sizale minority (15%) reports no significant change in its situation. An even smaller percentage has enefited (7%). Figure 2 gives further details of the range in attitudes among different social groups regarding the effect of the last ten years of change in Ukraine. Respondents were asked to assess the extent to which they have een hurt or enefited from the change over the past ten years, and shown a scale where 1 = hurt, 3 = their situation has not changed much, and 5 = enefited. Points in-etween these were also indicated on the scale {2,4}. Figure 2 displays responses grouped into three categories: Hurt (1+2), Not Much Change (3), and Benefited (4+5). Specific wording of the question is given at the ottom of the figure.
12 International Foundation for Election Systems 8 Figure 2. Total Effect Last 10 years (in percent) Hurt Same Benefit DK/NA Total Gender Male Female Age Education <Secondary Secondary Higher Ethnicity Ukrainian Russian Other Region Kiev Northern Central Northeastern Northwestern Southeastern Western Southwestern Southern Crimea Eastern East West Question: Over the last 10 years some people have enefited from the change, and others have een hurt. Please look at the picture on this card. The picture shows different responses to this question. 1 represents that you and your family have een hurt y changes over the last 10 years, 3 represents that your situation has not changed much, and 5 represents that you and your family have enefited y the change. Or, you can choose a point in-etween these answers. Please think aout the total effect on your family from changes in Ukraine over these last 10 years. Where would you place yourself on this picture? Expected results are clear in the tale aove. Most elieve they have een hurt y ten years of change. However, some groups have a stronger perception of this phenomenon. Younger respondents more frequently mention that they experienced some enefit over this time: 14% of those years of age and 12% of year olds, compared to 8% of year olds, 6% of those 46 55, and 3% of those over 56 years of age. Interviewers rated how well off respondents appeared to e (not displayed in the tale). Only 15 respondents were rated High in social economic status. Of these, 59% stated they had experienced at least some enefit from recent changes. This would e expected, and provides some validation of the interviewers assessment of the prosperity of the respondents. Of those Moderately well off in the interviewer s assessment, 16% had experienced some enefit. This compares to 7% and only 3% of those perceived as having the lowest levels of well eing. Similarly, only 1% of those without a secondary education experienced some enefit, compared to 8% of those completing secondary with specialized training. Of those with education eyond the secondary level, 12% report some enefit.
13 International Foundation for Election Systems 9 Younger, wealthier, and etter-educated respondents are more likely to have felt that they enefited from the last ten years. Figure 2 shows less ovious results as well. Ethnic Ukrainians are not much more likely to report some enefit compared to ethnic Russians, or those identifying themselves with other ethnic groups, and there is no significant difference etween the different ethnic groups. For the total sample, 7% claim some enefit. However, ethnic Russians are much more likely to claim that they have een hurt over the last ten years: 83%, compared to 74% of ethnic Ukrainians and 76% of those in other ethnic groups. Women are also more likely to claim they have een hurt : 80% versus 72% of males. This is true for Ukrainians in the east (81%) versus those in the west (67%). Western Ukrainians are also more likely to have enefited (11% versus 7% of easterners and only 3% of those inetween the two). 3 Attitudes toward economic and political change are discussed separately elow. Another social change salient in the pulic consciousness is a perceived rise in crime and corruption. Respondents were asked: In Ukraine, has crime increased very much, increased a little, stayed the same, or decreased very much over the past few years? Figure 3 presents the range in responses for the total population. The most striking result is that 79% replied that crime has increased very much. Another 12% state that crime has increased a little. Only 28 respondents failed to give a sustantial answer, replying that they did not know. There is a consensus aout the extent of crime; differences etween social groups in Ukraine are secondary to this finding. (Corruption is discussed in Section IV.) Political Change in Ukraine Figure 3. Change in Crime Over the Past Few Years (n=1,500) Response % Increased very much 79% Increased a little 12% Stayed the same 4% Decreased a little 3% Decreased very much * Don t know / no answer 2% Question wording: Some people say that the prolem of crime has gotten worse over the past few years, other people do not agree. What is your opinion? In Ukraine, has crime increased very much, increased a little, stayed the same, decreased a little, or decreased very much over the past few years? Attitude toward politics and political institutions, as well as political ehavior, has een the most consistently addressed topic in past IFES surveys in Ukraine. These questions explore the level of pulic support for the movement toward a democratic society. This report summarizes findings in several areas that are political in nature. Confidence in institutions is covered in Section IV. Following this, Section V covers political efficacy, approval of various political actions, human rights, and experience with government officials and political parties. The focus of this section is on the trend in attitudes toward underlying themes of democracy. IFES has included three questions on this topic in many of its surveys. These questions are listed elow. Q# refers to the variale in a merged data set [ ] used for the trend analysis reported here. Details on this data set are provided in Appendix 2. Q# T11. In general, would you say that political reforms in Ukraine are occurring too quickly, too slowly, or at the right pace? Q# T12. Is Ukraine a democracy? Q# T13. [If not] Is Ukraine moving toward ecoming a democracy or not? 3 Only the most significant differences etween groups are presented in the tales featured in this report. For a complete set of tales for the 2000 IFES survey, or results from previous years, contact IFES.
14 International Foundation for Election Systems 10 Responses over time to these questions are presented in Figure 4. T11 (Speed of reforms) was asked in every survey starting in Respondents were asked aout the speed at which political reforms were occurring in Ukraine. They could choose from the following options: (1) too quickly, (2) at the right pace, or (3) too slowly. Many stated that reforms are not happening, and this response was also included (4). Figure 4 provides the average response over time for this question. The responses are assumed to form a scale, where 1 = resistance to reform (they are happening too quickly), and 4 = a type of impatience (they are not happening). As the line moves higher, responses indicate an increased sense that reforms are not happening quickly enough. The left-hand margin provides the scale for interpreting the trend line for T11. Figure 4. Attitudes toward Democracy and Political Reforms in Ukraine, Trend Analysis 4 100% % 20% % % 35% 30% 27% 24% 23% 25% 31% 22% 20% 19% 17% 0% Jan. 94 May. 96 Jul. 97 Jun. 98 Jun. 99 Jan. 00 Dec. 00 T11: Speed of Reforms T12: Ukraine Democracy T13: Movement to Democracy The trend for T11 indicates that, on average, most people elieve that reforms are happening too slowly [the line is continually aove 2.5 (at the right pace)]. There is a rief decline in the trend line recorded in June At this point, fewer people held the opinion that political reform should move quicker, and the line reflects a downward movement toward slower paces of reform. A year later, the line ends ack up and the trend after this time indicates a high numer of those who state that political reform is not happening fast enough. Respondents were asked Is Ukraine a democracy? This is an easy question on the surface, and respondents replied yes or no or gave some other answer. (The meaning of democracy to the respondent is discussed elow.) T12 displays the trend as a percentage of those replying yes, that Ukraine is a democracy. The right-hand margin displays a scale of percent points to interpret the figure. As the line moves higher, the percentage of those who claim that Ukraine is a democracy increases. T12 is a relatively steady line (except for January 2000) where approximately 20% state that Ukraine is a democracy. The line is steady, decreasing just efore the 1999 presidential elections. The IFES survey in January 2000 indicates that, after the Novemer 1999 elections, there was an increase in the perception that Ukraine is a democracy, with the numer of yes responses rising to 31%. This effect seems to have worn off, and the line has dropped ack down. Respondents who replied that Ukraine is not a democracy were then asked: Is Ukraine moving toward ecoming a democracy or not? T13 displays the trend in the percentage of respondents that replied yes, it is moving toward a democracy. The right-hand margin provides the percentage scale (Y2 axis) to interpret the figure. All three trend lines are related and together present a clear picture. Events occurring etween June 1999 and the new IFES survey in Decemer 2000 are quite important. The June 1999 IFES survey finds that: 17% elieve that Ukraine is a democracy. Of those who elieve Ukraine is not a democracy, only 24% elieve Ukraine is ecoming one. However, the opinion on average is that political reforms are not happening fast enough.
15 International Foundation for Election Systems 11 By January 2000, just after the presidential elections: More people now report yes, Ukraine is a democracy (31%). Of those who elieve Ukraine is not a democracy, 35% now elieve it is ecoming one. Though the opinion remains that political reforms are not happening fast enough, there is a slight decrease in the numer that holds this opinion. By Decemer 2000, new data indicates that: The numer who elieves yes, Ukraine is a democracy has fallen again to 22%. Of those who elieve Ukraine is not a democracy, now only 23% elieve it is ecoming one. The numer that elieves political reforms are not happening fast enough picks up again, though remains elow the 1999 high point. The picture indicates a decline in the opinion among many that Ukraine is a democracy, and a corresponding decline in the opinion that it is ecoming a democracy. Following the presidential election of 1999, more Ukrainians seemed to e optimistic aout democracy in Ukraine. However, this upward push in opinions fell afterwards, and the numer elieving that political reform is not happening fast enough was again on the rise. The Meaning of Democracy In the West, we often assume that we share an understanding of the concept of democracy with the rest of the world. However, this understanding of democracy is often different from what citizens of the former Eastern Bloc might consider democracy. A new film recently released in Hungary portrays two villagers talking aout democracy, and distinguishing what they once knew as people s democracy and today s version as democracy democracy. There is often confusion in these societies as to what the difference is etween past and present usage. The Decemer 2000 survey followed up on this and asked respondents what they meant y the term. Respondents answered the question in their own words, and responses were thematically coded. Multiple responses were allowed and these results are presented in Figures 5, 6, and 7 on the following pages. Six main thematic categories may e formed from the responses. According to these categories, democracy is: Human rights (55%: free speech, opinion, press, political choice, religion) Legally defined (18%: rule of law, equality of all in front of the law, justice) Politically defined (13%: power of the people, pulic access to power, transparency in government) Economically defined (16%: material prosperity, social welfare) National Sovereignty (2%) Other miscellaneous definitions mentioned y few (1%) Others stated that they did not know (23%) or did not answer the question (3%). Democracy means different things to different people. Men were more likely to mention human rights in their definitions than women (62% versus 49%). Women are more likely to respond that they do not know (29% versus 15%). The use of a human rights definition declines steadily with age, from 73% of the youngest age group to 37% of the oldest. Do not know responses increase with age, from 16% up to 33% and decrease with level of education, from 40% of the lowest educational group to 10% of the highest. One out of four (24%) respondents in eastern Ukraine states that they do not know. This compares to 19% in the west. These differences can e discerned in Figure 5.
16 International Foundation for Election Systems 12 Figure 5. Meaning of Democracy (in percent, n=1500) Human Rights Legal Political Economic Sovereignty Other DK NA Total Gender Male Female Age Education <Secondary Secondary Higher Ethnicity Ukrainian Russian Other Region Kiev Northern Central Northeastern Northwestern Southeastern Western Southwestern Southern Crimea Eastern East West In general, the use of economic definitions (16%) does not vary much throughout Ukrainian society, though it is slightly higher in the east than in the west. Political and legal definitions show a clear increase with education. A small minority equates democracy to national sovereignty (2%). The tale aove provides some clue as to what is on the mind of the respondent when thinking aout democracy. Figures 6 and 7 provide a partial answer to another question: what is the definition of democracy that the respondent is using when deciding whether Ukraine is or is not a democracy?
17 International Foundation for Election Systems 13 Figure 6. Assessment of Ukrainian Democracy y Definition of Democracy (row %, n=1,500) IS UKRAINE A DEMOCRACY? DEFINITIONS GIVEN FOR MEANING OF DEMOCRACY Yes No Other DK (numer of respondents who gave this definition) Row % Row % Row % Row % Human Rights (n=820) Legal (n=273) Political (n=193) Economic (n=237) Sovereignty (n=32) DK (n=342) NA (n=47) Figure 6 illustrates how the definition of democracy is related to the respondent s opinion of whether or not Ukraine is a democracy. The definitions of democracy that were illustrated in the previous figure (Figure 5) are listed vertically along the left-hand margin of this tale. Arranged horizontally along the top of the tale are responses to the question: Is Ukraine a democracy? Possile answers include yes, no, another response esides these, and do not know. The percentages listed in Figure 6 indicate the opinions of respondents on Ukrainian democracy ased on their definition of democracy. We will look at the row with the Human Rights definition as an example. In total, 820 people gave a Human Rights response when asked aout the meaning of democracy. Of these 820 respondents (34%) elieve that Ukraine is a democracy, 55% do not, 2% give another answer esides yes or no, and 10% do not know. There are only a few respondents, 32, who define democracy as national sovereignty. Almost all of them think that Ukraine is a democracy 78%. Of more interest is the range of opinion for those most critical of Ukrainian democracy. These are the respondents who do not think their country has a democratic political system. A majority of respondents who gave a legal definition for democracy do not elieve that Ukraine meets that definition (78%). If we proe further into the legal definitions of democracy, we see other interesting patterns. Of the respondents who gave a legal definition for the meaning of democracy, 34 defined democracy in terms of justice. None of them elieve Ukraine is a democracy. Nearly all (83%) who define democracy as rule of law state that Ukraine is not a democracy. Respondents who use a legal definition of democracy are the least likely to state that Ukraine is a democracy. As noted in Figure 5, respondents offering legal definitions generally have the highest levels of education as well. Those who use economic definitions of democracy are also highly critical. On average, 76% of those using an economic definition do not think Ukraine is a democracy. Tale 5 indicates that people from all education groups use economic definitions of democracy, those with lower levels slightly more so. Those who use a political definition are less likely to say Ukraine is not a democracy, followed y those using human rights as criteria for democracy. The next figure, Figure 7, presents the same information in a different format. In this tale, the focus is first on whether the respondent elieves Ukraine is a democracy or not. For example, 886 respondents do not elieve Ukraine is a democracy. Of these 886 respondents, 51% define democracy as human rights, 24% give a legal definition, and 15% give a political definition. (Note: The percentages in each column may add to more than 100% ecause respondents could give multiple meanings of democracy).
18 International Foundation for Election Systems 14 Figure 7. Definition of Democracy y Assessment of Ukrainian Democracy (column %, n=1,500) IS UKRAINE A DEMOCRACY (numer of respondents who gave this answer) Yes (n=326) No (n=886) Other (n=33) DK (n=246) DEFINITIONS GIVEN FOR MEANING OF DEMOCRACY Col % Col % Col % Col % Human Rights Legal Political Economic Sovereignty Other DK NA This tale identifies several important findings: 51% of those who do not know whether Ukraine is a democracy, also could not define the concept, again replying do not know. Another 5% just did not answer the question. 18% of those who state that Ukraine is not a democracy, replied they do not know when asked to define what democracy is. Another 3% did not answer the question. 14% of those who state that Ukraine is a democracy, replied they do not know when asked to define the concept. Another 1% did not answer the question. Future in Europe In the Decemer 2000 survey, respondents were asked their agreement with the following statement: Ukraine s est hopes for the future lie with joining Europe and the European Union. Agreement indicates support toward joining Europe; disagreement indicates lack of support. Answers to this question are reproduced in Figure 8. Results, overall, indicate that a slight majority favor future union with Europe (53% agree versus 26% who disagree). A large group (20%) is uncertain and those respondents indicate that they do not know. Support for union with Europe is relatively soft. Most supporters at est somewhat agree with future union. Also, the large do not know group is more similar in social-demographic characteristics to those who disagree, and less resemles those who favor integration with Europe. The do not know trend generally increases with age, decreases with a rise in social economic status, education, and size of the respondent s community. Agreement declines with age: 65% of year olds agree, 66% of year olds, 63% of year olds, 54% of year olds and 35% of those over 56. Education and socio-economic status (SES) show similar patterns; as either one increases, so does agreement with the question. Of the 15 respondents classified as high SES y interviewers, all ut one ( don t know ) agrees with European union. The difference etween the moderate SES respondents (69%) and the low SES group (41%) is 28 percentage points (not displayed in tale). The difference in levels of agreement etween the highest and lowest educated respondents is 26 percentage points.
19 International Foundation for Election Systems 15 Figure 8. Memership in European Union (in percent, n=1500) Strongly Agree Somewhat Agree Somewhat Disagree Strongly Disagree DK NA Total Gender Male Female Age Education <Secondary Secondary Higher Ethnicity Ukrainian Russian Other Region Kiev Northern Central Northeastern Northwestern Southeastern Western Southwestern Southern Crimea Eastern East West Regional distriution provides perhaps the most interesting set of findings. The highest levels of agreement with European union are in Kyiv (64%), the Northwestern Region (72%), the Western Region (68%), the Southwestern Region (75%) and Crimea (60%). Other regions exhiit etween 15% - 20% lower levels of agreement. The strongest level of disagreement is found in the Southern region, where 16% strongly disagree, for a total level of disagreement of 34%. Overall, Ukrainians in the west are relatively pro-union with Europe (67% agreement versus 47% in the east and 45% in the intermediate areas). Economic Change in Ukraine The topic of economic change is perhaps foremost in the minds of Ukrainians. Figure 1 provides ample evidence to indicate that Ukrainians think the economic situation is terrile and of great concern. The Decemer 2000 IFES survey asked respondents: Compared to ten years ago, do you think the percentage of poor people in Ukraine has increased, decreased, or stayed the same? Nearly everyone (95%) has the same opinion the percentage of poor people in Ukraine has increased. There is little variation in this response y age, SES, ethnicity, education, or region. In the east of Ukraine, 96% give this answer. Only in the Northwestern Region does the percentage drop elow 90% (89%).
20 International Foundation for Election Systems 16 More variation is seen in responses to the next question: Over the next ten years, do you think the percentage of poor people in Ukraine will increase, decrease, or stay the same? In total, 64% elieve the percentage of poor people will increase, 13% elieve it will stay the same, and 11% elieve it will decrease. The remaining 12% don t know. The percent that is optimistic (that there will e less poor) varies across social groups. Generally, the younger the respondent, the more optimistic the response: 14% of year olds, 8% of year olds, 11% of year olds and year olds, and 10% of those older than 55. Men are more optimistic aout this than women (12% versus 9%). Optimism increases with SES and education, as expected. Those in the west are much more likely to e optimistic: 16% versus 8% in the east, and 7% in the intermediate areas. IFES has asked a series of questions eginning in 1996 to assess support for a market economy in Ukraine. The following questions assess attitudes toward market economies: Q# T5. When it comes to our economic future, should our country develop a market economy as quickly as possile, with steady ut small reforms, or should we not pursue a free market economy at all? Q# T6. Here you see a picture with a scale of one to five where one means a pure market economy and five means an economy that is completely, centrally planned y the state. Where on that scale should Ukraine e located in the future? Q# T8. In your opinion will e economic situation in Ukraine in a year e etter than it is now, remain the same, or get worse? T6 assesses pulic support for a market economy in Ukraine. T5 assesses pulic perception of the rate of reform. T8 is included as a reference. Support for a market economy is affected y perceptions of current economic conditions, and optimism (or lack of it) aout the future. This line may e disregarded for the present discussion. The Do Not Know and No Answer responses are omitted from these analyses ecause the averages (or means) are used. The trend data for these questions is presented in Figure 9. The variales that reflect answers to these questions have all een recoded so that high values reflect support for a market economy. T5 uses the right-hand margin (Y2) axis and a high value means that reforms should happen as soon as possile. T6 uses the left-hand margin (Y1) axis. The original question is recoded so that 5 = market economy, 3 = a point in-etween market and centrally planned and 1 = a centrally controlled economy. Figure 9. Support for Market Economy in Ukraine, Trend Analysis T6: Market vs. Central Planning T5: Pace toward Market Economy T8: Natl. Economy in 1 yr. 1 Jan. 94 May. 96 Jul. 97 Jun. 98 Jun. 99 Jan. 00 Dec. 00-1
21 International Foundation for Election Systems 17 The easiest way to interpret the figure is to look first at the horizontal line across the middle of the chart (running etween the 3 value on the left-hand axis and 0 on the right-hand axis). This is the reak-even point. This corresponds exactly to the midpoint for T6, the variale measuring whether Ukraine should opt for a market economy or central planning. The T6 trend line shows that support for a market economy was almost at the midpoint efore the June 1998 survey (2.76), ut then fell to a low in the June 1998 survey. Since then, support has slowly risen to the current high point (3.06). This is significant ecause it means that, for the first time in IFES surveys, more Ukrainians fall on the side of a market economy than a centrally planned economy. However, this support is fragile. In the present survey, 32% of respondents opted for a market economy while 26% opted for a centrally planned economy. A further 32% pick a point etween these two options. The trend for T6 parallels that for T5, the pace of economic reforms. Again, the horizontal line represents the midpoint for the T5 variale. A point on the horizontal line means that Ukraine should move toward a market economy with small ut steady reforms. A point aove the horizontal line indicates support for faster movement toward a market economy, and a point elow indicates support for a centrally planned economy. The May 1996 survey shows an average score aove the zero line. The desire for a quicker rate of reform dropped steadily from 1996 to the June 1998 survey. After this point, the trend has again picked up, as more people elieve that Ukraine should develop a market economy as quickly as possile. T8 provides a reference line for understanding these trends. T8 measures expectations aout the economy in one year and is scored so that 0 = the economy will e the same, +1 = the economy will e etter in one year and 1 means the economy will e worse. The variale reflecting the answers to this question uses the right-hand (Y2) axis. Any point aove the 0 reference line means that more people elieve the economy will e etter. Points elow the line mean more people elieve the economy will e worse. The T8 trend line shows that most people have little optimism that the economy will e etter in one year. Over time, the trend line moves toward the zero reference line, ut there are several reversals on the way. The June 1999 IFES results indicate a low point, with the trend line exhiiting improvement prior to this period. Shortly after the 1999 Presidential election, optimism aout the economy improves. The Decemer 2000 survey, however, indicates that this optimism has fallen again. In the Decemer 2000 survey, only 13% elieve that the economy will e etter in one year, while 35% elieve that it will remain the same and 41% think it will get worse. Though optimism aout the future of the economy has fallen and many people elieve that there will e increased levels of poor people in Ukraine, support for a market economy remains on an upward trend for the present. Figure 10 presents two more trends on economic questions. The question wording is given elow: Q# T7. In general, would you say that economic reforms in Ukraine are occurring too quickly, too slowly, or at the right pace? Q# T10. In your opinion, how important are foreign investments to the economic recovery of our country? T7 measures opinions on the pace of economic reforms in Ukraine. A high value indicates that reforms are happening too quickly as far as the respondent is concerned. The scale for this variale is provided on the lefthand margin. T10 assess support for foreign investment. A high value on this variale indicates high levels of support for foreign investment.
22 International Foundation for Election Systems 18 Figure 10. Trend in Economic Attitudes Over Time Jan. 94 May. 96 Jul. 97 Jun. 98 Jun. 99 Jan. 00 Dec. 00 T7: Pace of Economic reforms T10 Importance of Foreign Investments Over time, respondents increasingly perceive that economic reforms are not happening fast enough. There is a steady upward movement in this series. This corresponds with the T5 series in Figure 9 that shows an upward trend in the desire to move toward a market economy as quickly as possile. The T10 series shows steady, aleit weak, support for foreign investment. In the Decemer 2000 survey, 52% of respondents think that foreign investment is important for Ukraine s economic recovery (20% very important, 32% somewhat important); 35% think that it is not important (18% not important at all, 17% somewhat unimportant); and 13% don t know. The scale for T10, which represents support of foreign investment, has een reversed so that 4 = very important and the Do not know, Missing Answer category is deleted to calculate the mean (2.62). IFES did not include T10 in the June 1998 survey. The trend line implies that support for foreign investment fell etween July 1997 and June This coincides with a deep economic crisis in Ukraine in August and Septemer 1998 that was caused in part y the fall of the Russian economy and in part y mounting foreign det. The Ukrainian government was unale to repay its ond oligations on time, and the Ukrainian currency (hrivna) lost value overnight. This situation did not stailize until the winter of Coinciding with these events, there has een a steady trend upward in levels of support for foreign investment since June Institutions Trusted to Resolve Economic Difficulties In every IFES survey in Ukraine, respondents have een asked to name the institution they think is most likely to solve the economic prolems facing Ukraine. Figure 11 presents data for this question over the last six surveys. For each year, the ars indicate the percentage of those who mentioned an institution as the one most likely to resolve the economic prolems.
23 International Foundation for Election Systems Figure 11. Institution Most Likely to Solve Economic Prolems (in percent) Executive Branch Supreme Rada Judiciary Local Government None All of them DK/NA May. 96 Jul. 97 Jun. 98 Jun. 99 Jan. 00 Dec. 00 Question: Thinking only of the Executive Branch, the Supreme Rada, the judiciary, and your local government. Which of these four, in your opinion, is most likely to resolve the economic prolems facing Ukraine in the next year? The pattern that emerges here is an interaction etween the expectation that the Executive Branch will fix the economy and the sense that none of them will, or that the respondent does not know or does not answer the question. Except for the May 1996 and January 2000 surveys, only aout 20% elieve that the Supreme Rada is most likely to solve Ukraine s economic prolems. As is clear in these analyses, many Ukrainians have een uncomfortale over the years aout the movement toward a market economy. Studies in many countries that once had a controlled economy have shown that this is a common phenomenon. It is less well known just what people have in mind when they think of capitalism. This analyst has heard the opinion expressed y some Eastern Europeans that, what they told us aout Communism was all lies, and what they told us aout Capitalism was all true. This was meant to e (partially) favorale toward capitalism. However, in this analyst s experience, many young entrepreneurs seem to hold a vision of capitalism and the market economy that etter descries Mercantilism or the days of Roer Barons, rather than a modern market economy. That is, in their view, everything is permitted in Capitalism if it makes money, including degrading work conditions and consumer fraud. These practices are not widely accepted in Western economies. Two questions were included in the Decemer 2000 IFES survey as a partial gauge of what people elieve a market economy is. Respondents were asked to indicate their agreement or disagreement with the following statements: Q66. In the free market economy, uyers need to rely on themselves and not expect the government to protect them in transactions. Q67. A little it of cheating is a normal part of all usiness activity. A majority (53%) agrees with Q66. Of these, 27% strongly agrees. The opinion that one cannot expect the government to protect the consumer in a free market economy is common across all social groups in Ukraine. There is an east/west divide, with 47% agreeing in the east versus 59% in the west and 52% in the intermediate areas. The pattern for the second question is the mirror image; most (52%) disagree. Of these, 27% strongly disagree. Women disagree more than men (55% versus 48%). In the east, 59% disagree, compared to 51% in the west and 42% in-etween the two. These questions were exploratory in nature, and interpretation is difficult. Qualitative methods are more appropriate for gaining a etter understanding of Ukrainians view of the market economy. However, the majority of Ukrainians are against cheating in usiness.
24 International Foundation for Election Systems 20 IV. Attitudes toward the Current Situation Satisfaction with the Overall Situation in Ukraine Results from the Decemer 2000 IFES document the overwhelming sense of dissatisfaction Ukrainians have with the way things are going in their country. Decemer 2000 results show that 59% are generally dissatisfied with the situation in Ukraine and another 33% are somewhat dissatisfied. Comined, this gives an overall level of dissatisfaction that includes 9 out of 10 adults. Another 3% did not answer the question or do not know. That leaves approximately 5% of adults reporting some level of satisfaction. Because there are so few respondents who express this sentiment, it is interesting to note who the satisfied respondents are. There is a slight tendency for younger respondents to report higher levels of satisfaction. The significant difference, however, is in the material well eing of the respondent. Of those evaluated as moderate in SES, 10% report some satisfaction with the current situation. (There are too few cases classified as high SES; however, several of them are also satisfied.) Those in the west report higher levels of satisfaction as well (9% compared to 4% in the east and less than one percent in the intermediate areas.) Almost everyone else is dissatisfied. Thinking ack to Figure 1, the economic situation is the leading factor ehind the negative attitudes. Figure 12, elow, displays trends in satisfaction levels over time. An interpretation of this data suggests that dissatisfaction has ecome ingrained in the Ukrainian consciousness at this point in time. The total level of dissatisfaction has constantly stayed near and aove the 90% level throughout the period covered y IFES surveys. There has een a gradual downward trend in the lowest level of satisfaction, eginning in July 1997 and ottoming out after the 1999 presidential election, ut the percentage of those very dissatisfied has started ack up Figure 12. Dissatisfaction in Ukraine Over Time (in percent) Jan. 94 May. 96 Jul. 97 Jun. 98 Jun. 99 Jan. 00 Dec. 00 Very Dissatisfied Somewhat Dissatisfied Fairly Satisfied Very Satisfied Total dissatisfaction remains relatively stale. The fall in percentage of those most dissatisfied mainly results in a corresponding increase in the percentage of those somewhat dissatisfied, and vice versa. Over time, a majority (etween 59% - 75%) stays very dissatisfied, and approximately 25% - 35% express moderate levels of dissatisfaction. The small percentage of satisfied respondents fluctuates only slightly. The View on Corruption Figure 1, at the eginning of this document, provided some context for pulic dissatisfaction. To repeat, the main categories of ad events happening in Ukraine over the previous decade include adverse economic change, crime, corruption, and decline in law and order. The effects of economic change have een discussed aove. Crime was also discussed separately in the first section. Corruption is discussed next. The opinion that corruption is a common and serious prolem is a consensus across Ukraine and throughout time. The percentage of those saying that corruption is a common prolem has stayed high in all IFES surveys: 87%
25 International Foundation for Election Systems 21 (1994), 84% (1996), 89% (1997), and 88% (1999). The Decemer 2000 survey shows that 93% of adult Ukrainians claim that corruption is common in their society. Most of them (75%) elieve it is very common. Moving to the seriousness of corruption, high percentages have also thought of corruption as a serious prolem: 89% in 1994, 88% in 1996, and 90% in 1997 and This year held the trend, with 96% elieving that corruption is a serious prolem (81% claim it is very serious ). These opinions do not vary much y age, gender, or education. While etter-educated respondents are more likely to choose the extreme very option and worse educated respondents are more likely to choose somewhat, the net effect is similar. The most important variation appears to e regional rather than demographic. Respondents in the west are slightly less likely to state that corruption is common: 89% versus 95% in the east and 94% in the intermediate areas. The degree is less as well, with nearly 80% of respondents in the east and intermediate areas claiming that it is very common, compared to only 66% in the west. Regardless, there is little variation in the perceived severity of the prolem. The numers in the previous paragraph indicate that, since 1994, Ukrainians have constantly seen corruption as an extremely common and serious prolem. The variations over time in these perceptions have never contradicted this thesis. Perceptions regarding the extent of corruption reached a relative low in the May 1996 survey, and, in the Decemer 2000 survey, perceptions of the extent of corruption rose alongside an increased estimation of the seriousness of the prolem. Historically, the perception that the prolem is serious occurs more with rises in the perception that it is common. Declines in the commonness of corruption ring relatively small drops in the perceived seriousness. This implies that a large decline in the extent of corruption (as perceived) may have relatively little effect on the perceived seriousness. This conclusion is mirrored in the Decemer 2000 findings, discussed aove, in that the perception of the extent of corruption varies across regions in Ukraine, ut attitudes toward the seriousness of it do not. Figure 13 displays answers to two questions asked several times y IFES. The white ar on the left hand side shows the percentage who elieve that Ukrainians accept corruption as a fact of life. The figure suggests that fewer Ukrainians over time are accepting corruption as a fact of life. The June 1999 survey found that 62% elieve Ukrainians accepted the corruption of officials as a way of life. This had dropped after the 1999 presidential election, ut rose again slightly in the Decemer 2000 survey. Reflecting on the numers reported a couple of paragraphs aove, one can interpret that the rise in the perceived frequency and seriousness of corruption reported for Decemer 2000 corresponds with an increase in the perception that Ukrainians accept this as a way of life. Figure 13. Acceptance of Corruption and its Impact Jun % 3.49 Jan % 3.54 Corruption as fact of life Contriution to Corruption Dec % 3.26 Q. Do you think the citizens of Ukraine accept official corruption as a fact of life? Q. [If Yes] And to what extent does this contriute to the prolem of official (state) corruption? (Very much, Somewhat, Not very much, Not at all) The gray ar on the right hand side of the figure represents the average response to the follow-on question listed elow the chart. If the respondents answered that Ukrainians accept corruption as a fact of life, they were then asked how much this contriuted to the prolem of official corruption. The average response is given on a scale of 1 to 4. The higher the score, the more respondents elieve that acceptance of corruption contriutes to the prolem of
26 International Foundation for Election Systems 22 official corruption. In every year, most people agreed that accepting corruption contriutes to the prolem (all means are aove 3 and approach the maximum value of 4, a great deal ). The ar for the Decemer 2000 survey indicates that there was a drop in this value from previous years to It is difficult to interpret the drop in level. However, this value still means that most people who elieve that Ukrainians accept corruption as a fact of life think that this attitude contriutes to official corruption in Ukraine. The Severity and Occurrence of Corrupt Acts To ascertain the actions that Ukrainians consider corrupt, the Decemer 2000 survey asked the following two questions aout a series of supposedly corrupt actions. The list of corrupt actions follows the two questions. Q. Please tell me, for each of the following actions, whether the action can always e justified, sometimes e justified, or never e justified. (A high value means the action can never e justified, maximum = 3) Q. For each action, tell me if this activity occurs often here in Ukraine...Does it happen very often, sometimes, not very often, or never at all? (A high value means the action happens very often, maximum = 4) A. Claiming government enefits which you are not entitled to B. Cheating on tax if you had the chance C. Someone taking a rie in the course of their duties D. Accepting money to vote for a politician or political party E. Officials taking money from entrepreneurs to approve usinesses quickly F. High officials enefiting from the privatization of Ukrainian pulic industries G. High officials helping their associates in private usiness H. The use of pulic funds for the personal enefit of officials Of the actions listed, A, B and D are corrupt actions that anyone has the capacity to perform. Action C could e carried out y a wide range of people, including police officers, teachers, and government officials. E through H could e carried out y relatively higher-ranking pulic officials. Figure 14 presents the results for the two questions. Do not know and No answer responses are not reported.
27 International Foundation for Election Systems 23 Figure 14. Occurrence of, and Justification for, Corrupt Actions (in percent, n=1500) How often does this action happen? How often is it justified? Not Very Often/ Sometimes Often/Not At All Always Sometimes Never A. Claiming govt. enefits which you are not entitled to B. Cheating on tax if you had the chance C. Someone taking a rie in the course of their duties D. Accepting money to vote for a politician or political party E. Officials taking money from entrepreneurs to approve usiness quickly F. High officials enefiting from the privatization of Ukrainian pulic industries G. High officials helping their associates in private usiness H. The use of pulic funds for the personal enefit of officials Given the view of most respondents that corruption is common in Ukraine, it is not surprising that more than 70% think that each of these corrupt actions takes place often or sometimes. Actually, for every action except for D, a majority of respondents say that it occurs very often. But it is interesting to note that respondents say that actions C and E-H (all actions that would e undertaken y pulic officials) are never justified to a greater extent than actions A and B (actions that any common citizen could initiate). It seems that Ukrainians are more tolerant of corrupt acts initiated y ordinary citizens than y pulic officials. In the respondents opinion, actions E, F, G, and H are less justified than actions ordinary citizens may undertake. This would e expected and understandale given that enefiting from privatization, or using pulic funds for personal use involve much higher sums of money and the consequences are more detrimental than other activities. Figure 14 implies that these two activities are the most serious of the items on the list. These two actions are never thought of as justified y the highest percentage of respondents, and oth are thought to e actions that occur with some of the highest rates of frequency. To summarize the chart, we can see that actions A and B are the most permitted or justifiale actions. Most people elieve that they cannot e justified, ut they are more lenient toward them than they are toward corrupt acts committed y officials. Action D, accepting money to vote for a politician, is the one act ordinary citizens might do that few people could justify. Another interesting point is that action G (High officials helping their associates in private usiness) is thought to occur frequently, ut is more justifiale than other actions such as taking a rie. Figure 14 implies that cheating on taxes occurs frequently and is somewhat justified in people s opinions. These two opinions provide some asis for this ehavior ecoming normalized in everyday life. Over time, IFES has asked respondents to assess the extent that people rely on the shadow economy, or unofficial market for goods and services. In many ways, this question mirrors the response to cheating on taxes. The Decemer 2000 data show that 64% of respondents elieve that people rely on the informal economy at least a fair amount. Another 20% state that they do not know. The trend in their response to this question has not varied much over time.
28 International Foundation for Election Systems 24 Confidence in Leadership and Institutions IFES has asked respondents to rate the level of confidence they have in social institutions starting with its first survey in Ukraine in The Decemer 2000 survey includes the following results. Two measures are given for rating confidence. The top score ( a great deal of confidence) generally captures a low percentage in Ukraine ecause confidence levels are low, overall. The mean, or average score, is also used ecause it takes into account most of the respondents, excluding those who do not answer the question or do not know. The mean score is used here as the standard to evaluate confidence across different institutions. Ukrainians have the highest level of confidence in the Church: 34% state they have a great amount of confidence. The church also has the highest mean level of confidence [2.90]. 4 Ukrainians report higher levels of confidence in Prime Minister Viktor Yushchenko than President Leonid Kuchma: 12% report a great amount of confidence in Yushchenko versus 8% for Kuchma and a mean of 2.28 versus The Supreme Rada is rated lower than President Kuchma (3% with a great amount of confidence, resulting in a mean of 1.91). Local government and Local Self-Government oth rate higher levels of confidence than national levels: 6% and 4% a great amount, respectfully, and means of 2.08 and While 4% do have a great amount of confidence in the Council of Ministers, its overall confidence rating is lower, a mean of The Presidential Administration has an average confidence rating of 1.90, and only 3% express a great deal of confidence in this institution. The police forces also receive one of the lowest confidence ratings of those on the list: 5% reporting a great amount of confidence and a mean of The complete results for this question are presented in Figure The mean is calculated as the average of none [1], not very much [2], fair amount [3], and great amount [4]. The don t know and no answer responses are eliminated. A high mean value indicates a high level of confidence.
29 International Foundation for Election Systems 25 Figure 15. Confidence in Institutions Sorted in Descending Order y Mean Level of Confidence (n=1,500) Not very Fair Great Don t No answer Mean Institution None much amount amount Know Score % % % % % % Church Military State Security Constitutional Court Council for Security/Defense Viktor Yushchenko Pulic Prosecutors Local Government Local Self-Government Courts Leonid Kuchma Council of Ministers National Bank Supreme Rada Presidential Administration Police Figures illustrate the trend over time in mean levels of confidence for these institutions. Not all institutions were included in each survey, and there are gaps in the trend. The gaps are indicated y an X. The trend in confidence (mean level) is shown for President Kuchma and his administration in Figure 16. Figure 16. Confidence Ratings, Trend Data, Part 1 Survey President Kuchma Executive Branch Presidential Administration May 1996 X 2.03 X July June January Decemer X 1.91 President Kuchma s confidence rating rose steadily until the 1999 Presidential Elections and reached a high point in January Since that time, his confidence rating has dropped to the lowest recorded level in any of the IFES surveys. The Executive Branch and Presidential Administration follow the same asic trend. The confidence rating for the Executive Branch and the Supreme Rada (given elow) decreased etween the May 1996 IFES survey and the next one in June Trends for appointed and representative government are listed in Figure 17. Figure 17. Confidence Ratings, Trend Data, Part II Survey Supreme Rada Council of Ministers Local Government May X 1.88 July June January Decemer
30 International Foundation for Election Systems 26 Confidence in the Supreme Rada declined after the May 1996 survey, ut has generally een higher since July Where availale, parallel trends are shown for the other governmental institutions. Decemer 2000 results indicate an across-the-oard decline in confidence in governmental institutions. Tale 18 shows the mean trends for judicial institutions. Figure 18. Confidence Ratings, Trend Data, Part III Survey Constitutional Court Courts Pulic Prosecutors Police January 1994 X May 1996 X July June January Decemer Legal Protection from the State In the Decemer 2000 survey, respondents were asked if they agreed or disagreed with the statement: I trust the justice system to protect me from unjust treatment of the state. Responses to this question are presented in Figure 19. Only the most striking or significant differences are presented here. Disagreement with this statement indicates that the respondent does not expect the legal system to protect individuals (in this case, the respondent) from unjust treatment. Overall, 76% disagree with this statement (comining the two categories, somewhat and strongly disagree). Disagreement increases with age, then declines among the oldest respondents. Among year-olds, 72% hold this opinion, compared to 81% of those and Disagreement falls to 70% among the oldest (56 and aove). A similar pattern is oserved among the different SES groups. Though there are too few for a reliale measure, only 64% of the highest oserved SES group disagree that the legal system serves to protect individuals. Disagreement increases among the moderate SES respondents (75%) and the lower than moderate group (81%). Disagreement falls again among the lowest SES group (73%). The perception that individuals may not e legally protected from unjust treatment y the state is held more y etter-educated, uran respondents. With one exception (respondents from cities with populations etween 20,00 49,999 [85%]), disagreement is higher in the largest cities and decreases as the size of the city shrinks. (Results not shown here.) Disagreement increases with education, starting at 68% among those with the lowest level of education, rising to 77% among those with secondary level diplomas, climing slightly higher (79%) for those with specialized training, and reaching 79% among the most highly educated respondents. Figure 19 also indicates that ethnic Russians and those from other ethnic ackgrounds are much less convinced than ethnic Ukrainians that the legal system will protect them. Among Russians, 80% {235} disagree as do 82% {72} of other ethnic groups. Fewer ethnic Ukrainians hold this view (75% {836}). Most of the other ethnic groups (51% {45}) strongly disagree with the statement. The difference etween those in the west and those in the east is also presented: 71% {327} disagree in the west versus 79% {545} in the east and 77% {360} in the intermediate area.
31 International Foundation for Election Systems 27 Figure 19. Protection from Unjust Treatment of the State (n=1,500) Strongly Somewhat Somewhat Strongly NA Agree Agree Disagree Disagree % % % % % % Total Gender Male Female Age Education <Secondary Secondary Higher Ethnicity Ukrainian Russian Other Region Kyiv Northern Central Northeastern Northwestern Southeastern Western Southwestern Southern Crimea Eastern East West DK
32 International Foundation for Election Systems 28 V. Civic Action, Participation and Sources of Information A. Individual Action These next pages cover attitudes toward voting, interest in political issues and willingness to discuss politics (Political Attitudes), approval of various politically motivated ehaviors (Political Action), and motivation to participate in the upcoming elections for Supreme Rada in Attitudes toward Politics Results from the Decemer 2000 survey reflect a generally negative view of politics in Ukraine. Ukrainians are convinced that they have little influence on decisions in Ukraine, and are not convinced that they can change this through the electoral process. Overall, results indicate that: 62% at least somewhat disagree with the statement: Voting gives people like me a chance to influence decision-making in our country. Of these, 33% {492} strongly disagree with this statement. 80% at least somewhat agree with the statement: People like me have little or no influence on the way things are run in Ukraine. Of these, 52% {784} strongly agree with this statement. 76% at least somewhat agree with the statement: Sometimes politics is so complicated that people like me can t understand what s really happening. Of these, 44% {659} strongly agree. Most Ukrainians feel alienated y the complexity and insularity of their political system. At the same time, many state they are interested in politics. Overall, 65% are at least somewhat interested, and only 11% state they are not at all interested. The picture presented in these data is of a pulic that is concerned enough aout political events to maintain a high level of interest, ut does not feel it has the means to act upon this interest. Added to this is a very low level of elief that Ukrainians can change or influence what is happening in the political life of their country. Figure 20 presents data on these variales over time. All questions are assumed to provide an underlying scale that measures the extent that participants agree with the statement. For trend questions T14, T15, and T16, the highest value [5] indicates the highest level of agreement with the question ( strongly agree ). 5 For trend question T1, the highest value [4] indicates a high level of interest in politics ( very interested ). The question wording and laels for Figure 20 are given elow: Q# T1. How interested are you in matters of politics and government? [4 = very interested] Q# T14. Voting gives people like you a chance to influence decision-making in our country. [5 = completely agree] Q# T15. Sometimes politics is so complicated that people like you can t understand what s really happening. [5 = completely agree] Q# T16. People like you have little or no influence on the way things are run in Ukraine. [5 = completely agree] 5 T14, T15, and T16 use a five-point scale in order to integrate data from previous surveys that allowed a middle category neither agree or disagree, that is scored = 3.
33 International Foundation for Election Systems 29 Figure 20. Political Interest and Efficacy Over Time T1: Interest in Politics T14: Voting Gives Influence T15: Politics Too Complicated 1 1 T16: No Influence Jan. 94 May. 96 Jul. 97 Jun. 98 Jun. 99 Jan. 00 Dec. 00 Figure 20 presents the trend in mean or average response to these four questions. The left-hand margin (Y1) provides a four-point scale for T1, Interest in Politics. A high value on this scale indicates high levels of interest. The right-hand margin provides a five-point scale for questions T14, T15, and T16. High values on this scale indicate high levels of agreement with the statement. Pulic perceptions that ordinary citizens have no influence on the way things are run in Ukraine (T16) and that politics is too complicated (T15) show a steady increase over time. At the same time, the perception that voting gives people like you a chance to influence decision-making shows a decline in Decemer 2000, reversing a steady increase over previous surveys. These all indicate alienation that people feel a distance etween them and their leaders. The parallel trend for Interest in Politics (T1) is seemingly inconsistent with the other data for this category. June 1998 and June 1999 surveys indicate that interest in politics was declining. This trend reversed y January 2000 and Decemer 2000 data, which indicates that interest has increased, even though Ukrainians feel they have little influence. Decemer 2000 results show that: 18% {267} are very interested in politics 47% {706} are somewhat interested in politics 23% {344} are not too interested in politics 11% {166} are not at all interested in politics. Overall, 65% are at least somewhat interested, compared to 34% who are not. IFES also included two additional questions relevant to this: Q. When you meet your friends, do you talk aout politics? Q. When you yourself hold a strong opinion, do you ever find yourself persuading your friends, relatives, or colleagues to share your views? Most respondents (58%) discuss politics at least sometimes. Of these, one out of four discuss politics often. Fortytwo percent rarely or never discuss political issues. Interest in politics and the desire to discuss political issues increases with age, with younger respondents exhiiting less interest and less willingness to discuss politics.
34 International Foundation for Election Systems 30 Respondents are unlikely to try to persuade others when they hold strong opinions. Overall, 30% state they never persuade others, and another 17% state they rarely do. Only 16% often persuade others when they hold a strong view. The perception that one might try to persuade others increases steadily with education. Twenty-one percent of respondents with a higher education claim that they persuade others, compared to 17% of those with specialized training. This percentage decreases further among those with lower levels of education. Those in the youngest age group (18 24) are also more likely to attempt persuading others in their own self-assessment. Twenty-two percent of the youngest respondents gave this response, compared to 16% of those years of age. The percentages are lower than this for other age groups. Two other questions from the Decemer 2000 survey are relevant here. Respondents were given a 10-point scale on which to indicate their position etween two contrasting statements: Q. One should e cautious aout making major changes in life... You will never achieve much unless you act oldly. Q. Ideas that have stood the test of time are generally est... new ideas are generally etter than old ones. Results from these two questions give reason for concern for those promoting social change in Ukraine. On one hand, there is support for old versus cautious change: 13% favor positions advocating the most cautious approach to change [1 & 2 on the scale]. 24% moderately favor cautious action [points 3 5 on the scale]. 31% moderately favor old action [points 6 8]. 26% favor positions advocating the most old approach to change [9 & 10 on the scale]. As indicated, more favor old versus cautious action (55% versus 37%), and, of these, more than one out of five favor the oldest approach to change. As expected, a higher percentage of young respondents favor old over cautious change (48% of year olds, 33% of year olds, 27% 36 45, 28% 46 55, and 21% of those 55 and older). There is not a clear difference etween those in the west of Ukraine versus those in the east, though those in the intermediate area are the least likely to favor old action (22%). It is interesting that ethnic Russians are more supportive of a old approach to change, 31%, versus 24% of ethnic Ukrainians and 29% of respondents from other ethnic groups. A old approach to change is more popular with the etter educated as well, with 31% of those with advanced levels favoring this approach in comparison to 26% of those in the lowest educational group. Concern arises in relation to responses to the second question: the desired direction for this change. These data indicate that: 21% strongly favor old ideas [1 & 2 on the scale]. 36% moderately favor old ideas [points 3, 4, 5 on the scale]. 25% moderately favor new ideas [points 6, 7, 8 on the scale]. 11% strongly favor new ideas [9 & 10]. While old approaches to change are seen as favorale to cautious approaches, old ideas are clearly preferred to new ideas (57% versus 36%). Of these, one out of four strongly favor old ideas. Younger respondents strongly favor newer ideas: from 17% of year olds and 16% of year olds down to 9% and 10% of the older respondents. Neither material wealth nor SES provides a clear pattern for these responses; nor does level of
35 International Foundation for Election Systems 31 education. In the east, 11% favor newer ideas, versus 15% in the west and only 5% in-etween east and west. Crossing the two responses provides the following groups: Figure 21. Crossta of Bold/Cautious Action with Old/New Ideas (n=1,500) Old Moderate Old Moderate New New Total Cautious [1] 8% Moderate Cautious Moderate Bold [1] 5% [3] 2% Bold [3] 8% [1] 3% [1] 16% [3] 13% [3] 6% [2] 1% [2] 4% [4] 15% [4] 6% [2] 2% [2] <1% 14% 26% [4] 2% 33% Total 23% 38% 27% 12% 100%* * Do not know and no answer responses are dropped from this analysis. Category [1] (32%): Respondents who favor old rather than new ideas, and cautious rather than old action Category [2] (11%): Respondents who favor new rather than old ideas, and cautious rather than old action Category [3] (29%): Respondents who favor old rather than new ideas, and old rather than cautious action Category [4] (31%): Respondents who favor new rather than old ideas, and old rather than cautious action It will e interesting to follow this as Ukraine prepares for the upcoming elections for the Supreme Rada in Political Action Respondents were asked for their approval of a list of political actions that people sometimes take to make their own views pulicly known and to influence others. For each action, the respondent was to indicate their approval, disapproval, or mixed approval. Tale 22 (A & B) gives the overall means and frequencies for each action. 6 [4] 8% 28% 6 The means are calculated: Approve = 3, Approve Somewhat = 2, Disapprove = 1. Do not know and no answer responses are eliminated for the average.
36 International Foundation for Election Systems 32 Figure 22A. Attitudes toward Civic Actions (Means sorted in descending order, n=1,500) GENDER AGE EDUCATION Total male female <secondary secondary Higher Mean Mean Mean Mean Mean Mean Mean Mean Mean Mean Mean Mean Writing Petition Meeting Contacting Protest Joining group Boycott Strike Refusing taxes Blocking traffic Occupying Tale 22A presents the average (mean) level of approval for each activity, ranked in descending order. There is a high level of approval for writing letters to officials, circulating petitions, attending pulic meetings, and contacting officials. More people approve of these actions than disapprove (mean > 2). These may e termed relatively passive activities in comparison to others on the list. Tale 22A shows that women approve of these activities at higher levels than men. Older respondents approve more of these activities than younger respondents. For these four passive activities, respondents with the lowest and highest levels of education are more approving than those with intermediate levels (including specialized training). Tale 22B presents the same information, ut includes only the percent that approve of these activities. [The middle category, approve somewhat is included when calculating the mean (22A) ut left out of the percentage (22B).] The remaining seven activities are much more active in nature. Fewer people approve of these actions. Protest is approved y 44%, in total, with a rating of 2.2 (this compares to 2.5 for writing letters ). Occupying a uilding or property in protest is approved y only 5%, with a rating of 1.2. The response y age is different than what might e expected in Western democracies. In general, the youngest respondents are less likely to approve of strikes than those years of age. Those years of age exhiit higher approval levels for many of the active political acts than either the year olds or the youngest respondents. Respondents years of age are the most approving of contacting a politician, protesting, oycotts, or strikes compared to respondents in any other age group. This is not what one sees when looking at survey data from Western democracies. Figure 22B. Attitudes toward Civic Actions (% Approval, n=1,500) Total male female <secondary secondary higher % % % % % % % % % % % % Writing Petition Meeting Contacting Protest Joining group Boycott Strike Refusing taxes Blocking traffic Occupying
37 International Foundation for Election Systems 33 The Decemer 2000 survey included the question: If the elected mayor or village/settlement chair in your settlement was recalled and another person appointed y a high official to replace him or her, what would your reaction e? Answers were open in format and responses were thematically coded. The question presents a scenario that has actually occurred in Ukraine. In several communities the elected representative has een replaced y another person more acceptale to higher-level officials. This action moves clearly against the intent of democratic governance, and the responses provide some indication of respondents desire to protect their right to choose their representatives. Decemer 2000 data shows that: 25% would do nothing, ecause it is none of your concern. 34% would do nothing, ecause it is useless to complain. 5% would complain, ut nothing else. 4% would pulicly protest. 6% stated that such things do not happen in Ukraine. 17% stated that it depended upon whether there was a good reason for recalling the elected representative. The general response given y most people (approximately 58%) regardless of age was that they would do nothing, either ecause it was not their concern or ecause they perceived the effort as useless. Overt political actions, approved more y older than younger respondents, do not seem to apply to this scenario. Electoral Action Most people expect to vote in the 2002 elections for Supreme Rada (75%). Of these, 46% are very likely to vote. Twenty percent state they are less likely to vote, and, of these, 9% are very unlikely. Another 6% either do not know or did not answer the question. The least likely to vote, in their own assessment, are those years of age (24%), followed y the youngest respondents (22%). At this point in time, respondents elieve the following parties est represent their views and interests: No one (30%) The Communist Party of Ukraine (P. Symonenko) (18%) Do not know (15%) People s Rukh of Ukraine (G. Udovenko) (5%) People s Democratic Party of Ukraine (V. Pustovitenko) (4%) Social Democratic Party of Ukraine (United) (V. Medvedcuk) (4%) Socialist Party of Ukraine (A. Moros) (4%) A full set of responses to this question is availale through IFES. The Decemer 2000 survey also asked respondents to list the issues that they expect their elected officials to work on once they are elected. Decemer results reflect the greatest concerns of respondents. The question was asked in an open format, and respondents could mention several issues. Responses were then thematically coded: Economic Issues: Raise the standard of living and the amount workers receive in their pay envelopes (30%) Economic development (16%) Resolve unemployment and underemployment (15%) Jo security and creation of opportunities to work (10%) Better pensions (6%) Payment of wage and pension arrears (4%)
38 International Foundation for Election Systems 34 Lower price level (3%) Law and Order: Law and Order (8%) Eliminate crime and corruption (5%) Social Services: Free access to pulic services (10%) Decreased fees for community services (3%) Many stated they Did not know (18%). Agricultural reform was mentioned y 33 persons (2%). Overall, most Ukrainians do not think that the upcoming 2002 elections will e fair. In total, 50% elieve it is somewhat unlikely that these elections will e fair, and an additional 21% elieve it is very unlikely that they will e fair. This means that a total of 71% elieve these elections will not e fair. Only 2% elieve it is very likely that they will e fair. Support for Human Rights IFES has asked respondents to rate the importance of human rights in nearly all of the surveys carried out in Ukraine. The list of rights included in the survey follows: One can choose from several parties and candidates when voting Honest elections are held regularly The rights of minority ethnic groups are protected All can freely practice the religion of one s choice All can form associations or unions without any government involvement IFES surveys ask respondents to rate the importance of each right, whether it is very important, somewhat important, not very important, or not at all important. This response forms a scale and can e reordered so that a high value on this scale (4) indicates a high degree of importance attriuted to that right. Figure 23. Importance of Human Right, % Most Important Trend Data: Decemer 2000 (n=1500) January 2000 (n=1484) June 1999 (n=1484) July 1997 (n=1484) May 1996 (n=1544) % % % % % Private property Honest elections Freedom of religion Minority rights Free speech Choice of parties Freedom of association Freedom to form parties Figure 23 provides some figures illustrating the importance attached to these rights over time. The tale lists the percentage of respondents over the course of the IFES surveys who say that a particular right is very important. The rights are then sorted and listed in descending order ased upon their score in the Decemer 2000 survey. Figure 23 shows that Private property is listed as very important more often than any other item. Decemer 2000 data shows that 65% of respondents gave this right the highest rating. Next, Honest elections and Freedom of religion are oth very important to 54%. These are followed y Minority rights (41%), Free speech (37%),
39 International Foundation for Election Systems 35 Choice of parties (36%), Freedom of association (25%) and Freedom to form parties (21%). This pattern has remained stale over time, with the following exceptions: The right to a Choice of parties was rated higher in the past. The January 2000 and June 1999 surveys would have placed this right fourth on the list, rather than sixth. Fewer respondents are now rating this right as very important. The right to Free speech was rated higher in the July 1997 and May 1996 surveys. For oth, Free speech would have placed fourth, rather than fifth. Figure 24 presents averages for each right as rated y different groups in society. Over time, women have consistently placed more importance on Freedom of religion than men. Men have placed greater importance on all of the other rights on the list. This general pattern was different in the recent Decemer 2000 data. For the first time in this series, women placed more importance on Minority rights, Private property and Free speech than did men. The importance of all rights increases with the level of education of the respondent. The importance of rights generally follows a curvilinear pattern with age. The youngest age group (18 24) places less importance on rights than those Ratings fall after this group to a low with the oldest respondents. Those have generally placed a high value on Freedom of association and Freedom to form parties. In recent surveys, the age group has placed high levels of importance on Private property.
40 International Foundation for Election Systems 36 Figure 24. Importance of Human Rights, Means (Trend Data: ) Gender Age Education Total Male Female <Secondary Secondary Higher May 1996 Private property Honest elections Freedom religion Minority rights Free speech Freedom association Choice of parties Free to form parties June 1998 Private property Honest elections Freedom religion Free speech Minority rights Choice of parties Freedom association Free to form parties June 1999 Private property Honest elections Freedom religion Choice of parties Minority rights Free speech Freedom association Free to form parties Decemer 1999 Private property Honest elections Freedom religion Choice of parties Minority rights Free speech Freedom association Free to form parties Decemer 2000 Private property Honest elections Freedom religion Minority rights Free speech Choice of parties Freedom association Free to form parties
41 International Foundation for Election Systems 37 B. Institutional Action This area covers the experience people have in contacting their political leaders, Ukrainians involvement and attitudes toward political parties and non-governmental organizations, and political information and the media. Government The Decemer 2000 survey included a series of questions aout citizen contact with government officials. Respondents were asked: Q. Have you ever contacted your elected officials efore to solve a prolem in your life? Q. Have you ever contacted an appointed official efore? Respondents who had contacted an official, elected or appointed, were then asked different questions aout the level of official they contacted, how they had contacted that official, and the response they received from the official. Figure 25 summarizes the process of contacting elected and appointed officials. One side of the tale lays out the views of respondents who tried to contact elected officials. The right side of the tale contains responses aout appointed officials. Respondents were not asked as many follow-up questions aout appointed officials as they were aout elected officials. Figure 25. Contact with Elected and Appointed Officials (n=1,500) Elected Officials Appointed Officials 24% 17% contacted an Elected Official contacted an Appointed Official Specific Official Contacted (n=352) Specific Official Contacted (n=260) Village/Settlement Chairman 43% Local Executive Bodies 88% City Chairman (Mayor) 21% Olast-level Executive Bodies 12% City Rada Deputy 12% Central Executive Bodies 2% Village/Settlement Rada Deputy 7% People s Deputy of Ukraine 7% Rayon Rada Deputy 6% Other officials 9% Form of Contact (n=352) Personal Meeting 78% Letter 21% Through Someone Else 3% Telephone 3% Did Elected Official Respond? (n=352) Yes 73% Partially 12% No 15% Were You Satisfied With Response? (n=298) Completely Satisfied 20% Somewhat Satisfied 29% Somewhat Dissatisfied 15% Completely Dissatisfied 35% Overall, 24% state they have contacted an elected official efore to help solve a prolem in their lives. Usually, contact was made with the chair of the village or settlement (43% of those contacting an elected official). The city chairman or mayor was contacted half as frequently, y 21% of those contacting elected officials. Relatively few attempts were made to contact other elected officials. Personal meetings are the most frequent form of contact with elected officials (78% of those contacting elected officials). Letter writing was mentioned y 21%. Other types of contact are rarely used, such as approaching an elected official through someone else or calling that official on the telephone. Because personal meetings are used,
42 International Foundation for Election Systems 38 most of the attempts resulted in a response from the official (73%). Another 12% state that they had a partial response, while 15% claim they received no response from that official. The contact and response portion of the process seems to proceed well enough. Only a minority (one out of four) of adult Ukrainians has attempted to contact an elected official, ut most of them have arranged personal meetings with that official. This contact is usually with the village or settlement chair and, to a lesser extent, the city chair or mayor. At this point, the process appears to derail. Of those who received a response {298}, 50% were dissatisfied with the response they received. Most of them (35% of the 298 receiving a response) were completely dissatisfied. A nearly equal amount reports satisfaction with the response they received (49% of 298). Of these, 20% were completely satisfied. Approximately one out of every six adult Ukrainians (17% of 260) has contacted an appointed official to help resolve a prolem in their lives. Nearly all of these contacts were with local executive odies (88% of 260). Fewer people have gone further to the olast level or eyond with their prolem. Respondents to the survey were also asked whether government officials ever take steps to ask their opinion on important issues. The text of the question was as follows: Q. Here is a list of some ways that city or village government officials can ask your opinion on issues or aout prolems that concern you. Which of these have happened to you? Among the choices given were questionnaires, attending a pulic hearing, or participation in an advisory group. Eighty-six percent of respondents had never een approached y government officials for their opinions and small minorities were asked to attend pulic meetings (6%), complete a questionnaire (4%), or participate in advisory groups (2%). These figures suggest that the process goes in one direction. Political Parties Figure 26 presents data on attitudes toward political parties over time. Many IFES surveys have included three questions on this topic: Q# T17. Do you elieve that political parties are necessary for Ukrainian democracy? Q# T18. How important do you think it is for Ukraine to have at least two political parties competing in elections? [4 = very important] Q# T19. Do you find that there are clear differences etween the various political parties and locs in how they plan to solve prolems facing Ukraine? T17 and T19 represent the percentage in each year that answered yes to these questions. The right-hand margin provides the scale needed to interpret these lines. T18 uses a four-point scale, in which a high value indicates that a multi-party system is very important to the respondent. The average (mean) is taken, and do not know and did not answer responses are eliminated from the analysis. The horizontal line etween 2.5 on the left and 50% on the right provides a reference line. Any point aove this line indicates either increased importance for two political parties or that more than 50% agree with statements that generally view political parties in a favorale light.
43 International Foundation for Election Systems 39 Figure 26. Attitudes toward Political Parties Trend Analysis, % % 56% 56% 62% 41% 46% 41% 40% 31% 30% Jan. 94 May. 96 Jul. 97 Jun. 98 Jun. 99 Jan. 00 Dec % 50% 25% 0% T18: Two Parties Important T17: Parties Necessary T19: Parties Different Figure 26 presents a mixed picture of the role of political parties in Ukraine. In July 1997, slightly more than half (58%) stated, yes, political parties are important for democracy. This declined in June 1998 and has increased steadily since then, reaching 62% in Decemer This is good news. On the other hand, the overall importance of having at least two parties competing in an election has declined in the Decemer 2000 survey. At the same time, only 30% elieve that there are clear differences etween the different parties or political locs. The Decemer 2000 data shows that: 62% elieve that political parties are necessary for democracy, 18% do not. 64% elieve that political parties are at least fairly important for democracy and of these 21% say they are very important. 51% state there are not clear differences etween the parties or locs. At the same time, very few people are memers of parties (2%). The Decemer survey asked what reasons would e important enough for the respondent to join a political party. The question used an open format, and respondents could mention more than one answer. Responses were then thematically coded. Many respondents claim they would have no reason to join a party (32%). Others claimed they did not know what would e an important enough reason to join (35%). The most important reasons that would motivate someone to join a political party include: To help ordinary people (5%), and If the party had real activities and achieved positive results (8%). No other reason emerged with more than a 3% response rate. This implies that political parties are not held in high esteem y respondents, though many do elieve they are important for democracy. Attitudes toward Non-Governmental Organizations (NGOs) Ukrainians do not demonstrate strong support for NGOs. On one hand, the perception that NGOs are necessary for democracy has increased over time. Nevertheless, almost no one elongs to an NGO, volunteers time, or indicates that they are likely to join one in the future. Very few people rely on NGOs for help in resolving their prolems. Figures 27 provides trend data for two questions that have een generally asked on IFES surveys in Ukraine; one asking whether NGOs are necessary, and the other asking whether the respondent would volunteer for an NGO. The latter question was not asked in 1996.
44 International Foundation for Election Systems 40 Figure 27. Attitudes toward NGOs Trend Data ( ) (in percent) May 1996 (n=1484) July 1997 (n=1484) June 1999 (n=1484) Decemer 2000 (n=1500) How necessary are these nongovernmental Essential organizations, Very Necessary or NGOs essential, very Not Very Necessary necessary, not very necessary, Not at All Necessary or not at all necessary? DK/NA Would you give your time to work for a non-governmental organization without eing paid? Definitely, Yes Proaly, Yes Proaly, No Definitely, No Depends DK/NA The top half of the tale presents data from May 1996 to Decemer 2000 for the first of these questions. In May 1996, 26% stated that NGOs were not necessary ( not at all and not very necessary comined). One year later, the July 1997 survey shows that 49% held this view. By June 1999, a majority stated that NGOs are not necessary. Decemer 2000 data indicates that this attitude may have softened: only 43% now elieve they are not necessary. However, as indicated y the ottom half of the tale, attitudes have not softened toward volunteering time to an NGO. In July 1997, 28% stated that they would proaly or definitely not volunteer for an NGO. In June 1999, the data shows that 55% would proaly or definitely not volunteer for an NGO (41% would definitely not volunteer). Decemer 2000 data indicates that this figure has held steady. Fifty-one percent would proaly or definitely not volunteer for NGOs (39% definitely not). Two factors may e at play here. As indicated y responses to the economic questions, Ukrainians are preoccupied with their economic situations and may not have the time to give to these organizations. Second, they may not have seen any positive results emanating from NGO activities over the past few years and do not feel it worthwhile to volunteer for them. In the Decemer 2000 survey, respondents were given a list of different types of non-governmental organizations and asked, How much trust do you have in the activities of these groups? Many of these groups enjoy relatively high levels of trust, etween 40% and 50% of respondents reporting at least some trust in them. Veteran s groups (63%), welfare groups (61%), groups enefiting veterans of the Afghan war (60%), and groups working for victims of the Chernoyl disaster (55%) elicit some of the highest levels of trust from respondents. Religious (57%) and environmental groups (51%) also elicit majority support. At the same time, very few people are memers. Trade unions have the highest mention, with 12% of respondents claiming that they elong to one. Religious organizations have 3% claiming memership. No other group has more than 1%. Of these, only memers of trade unions claim that they pay memership fees. The Decemer 2000 survey also asked which organizations respondents might join in the future. Welfare organizations received the highest mention (7%). Human rights groups were mentioned y 5% and women s organizations y 4%. Perhaps the most striking finding is that no one goes to NGOs for help in resolving their prolems. According to the Decemer 2000 data, 7% claim that they have gone to their trade unions for help, only 2% claim that they have gone to a welfare organization for help, and no other organization registers over a 1% mention. Again, this may e a function of the lack of results Ukrainians perceive NGOs to have achieved. Figure 28 presents the trend over time in the percentage of respondents that elong to NGOs.
45 International Foundation for Election Systems 41 Figure 28. Religious and NGO Memership Trend Analysis ( ) 100% 75% 50% 25% 0% 93% 82% 72% 76% 74% 51% 66% 34% 28% 8% 10% 8% 9% 13% 5% 7% 6% 6% 9% Jan. 94 May. 96 Jul. 97 Jun. 98 Jun. 99 Jan. 00 Dec. 00 NGO CHURCH NGO - State Question: Please look again at the list of organizations. Which, if any, do you elong to? The top line shows the trend in the percentage identifying with a church or religious group over time. The ottom two lines show the percent that elong to any organization from the list of non-governmental organizations shown to the respondent. Those who elong to trade unions or collective farms (an option in the January 1994 survey) are given as State Organizations. All others are grouped together as NGOs. As evident, there has een nearly no improvement over time in NGO memership according to the IFES surveys. Approximately 6% claim memership in any of the organizations on the list. This increased to 9% in the Decemer 2000 survey. That list, however, includes recreation groups, welfare associations, and many other groups that are not considered NGOs in the Western sense of the term. If these were segregated, there would e almost nothing to show. Pulic Information and Media The Decemer 2000 IFES survey did not focus on media issues to the same extent as media surveys covering only this topic. Different questions relevant to the democratization of pulic information and the development of free independent and professional media were only touched upon here due to restrictions of space and time. However, the survey does provide some useful asic information. The survey shows that, overall, 53% of the adult population in Ukraine relies on newspapers for information aout political and economic events in the country, while 45% rely on radio and most (86%) rely on television. Respondents were asked to list all sources, therefore the sum is greater than 100 percent. Respondents were then asked aout their main source of information. Most (73%) list television, followed y newspapers (16%), then radio (10%). Few people mention other sources (<1%). Respondents were also asked to assess the amount of information availale to them aout political and economic events in Ukraine. Findings from the Decemer 2000 survey show that a majority has either a fair amount of information aout political developments (48%) or a great deal (12%), resulting in a total of 60%. This is not true for economic developments in Ukraine. A majority states that they have little information (43% not very much and 8% none at all) aout economic developments. Economic events are of great concern to Ukrainians, ut a majority elieves it does not receive enough information aout them. Figure 29 provides results from trend data on the two questions regarding political and economic information availale to the pulic. The top part of the tale concerns political information, the ottom economic developments.
46 International Foundation for Election Systems 42 How much information do you feel you have aout political developments in Ukraine a great deal, fair amount, not very much, or none at all? How much information do you feel you have aout economic developments in Ukraine a great deal, fair amount, not very much, or none at all? Figure 29. Information on Political and Economic Developments Trend Data ( ) (in percent) July 1997 (n=1484) June 1998 (n=1484) June 1999 (n=1484) Great Deal Fair Amount Not Very Much None At All Decemer 2000 (n=1500) DK/NA Great Deal Fair Amount Not Very Much None At All DK/NA The top part of the tale indicates that the Decemer 2000 findings on the amount of political information exhiit an improvement over previous years. In 1997, 71% stated that they had either no information at all or not very much aout political developments in Ukraine. A year later, the June 1998 data show that 64% gave this response, followed y 54% in June 1999 efore the presidential elections of that year. By Decemer 2000, the majority (60%) now reports they have at least a fair amount of political information. The ottom part of the tale also suggests an improvement, over time, in the percentage of respondents who report that they receive at least a fair amount of information aout economic developments. In July 1997, 72% claimed that they did not receive enough information. This declined slightly in 1998 (70%) and then declined significantly in 1999 (58%). The Decemer 2000 data still indicate that a majority of respondents do not receive enough information aout economic developments in Ukraine. Once again, however, the percentage reporting that they do not receive enough has declined (51%). The Decemer 2000 survey further asked respondents: In the last few years the government has egun the process to sell state owned enterprises such as energy and coal. How well informed are you aout the government s efforts at privatization? In total, 70% replied that they were either not informed at all (28%) or not well informed (42%) aout the government s privatization activities. This finding reinforces the pulic s perception that there is a lack of information aout economic developments in the country. There is still far to go. Media sources do not seem to take on the responsiility of a fourth institution or pulic watchdog role that estows upon them the duty of protecting the pulic interest. The distance etween relaying news and investigating and reporting it is seen most clearly in matters related to economics and finance. This is clearly the case when pulic funds are involved. People do not elieve that they have much information regarding the privatization of pulic enterprises. They also do not trust that privatization was conducted in a way that will enefit most Ukrainians. Rather, most respondents elieve that a select few close to power enefit directly from these reforms. This also seems to e true for pulic finances closer to home. The Decemer 2000 survey asked: How well informed are you aout the udget here in your community and how the funds are spent? Less than 10% claim that they are at least somewhat informed aout this process. In total, 89% say they are either not well informed or not at all informed. Of these, 67% give the extreme answer of not at all informed. Those who are informed aout the pulic udget were asked where they received their information. Of the total sample, 11% read aout the local udget in the local newspapers, another 14% saw something on television, and 6% heard something on the radio. Others know something aout the local udget ecause it was discussed during the elections (7%). Almost an equal numer know aout it through unofficial sources (6%) and even fewer heard official announcements at other times than during elections (2%). These questions are concerned with the quantity (amount of coverage) of information on political and economic events in Ukraine. Further questions concerned the quality of coverage. Respondents were asked to name the specific media (television or radio station, or pulication) they relied on the most for information aout political and
47 International Foundation for Election Systems 43 economic events in Ukraine. Once they had identified the specific media, respondents were asked the extent to which they agreed with the following statements: Q. [Media mentioned] is dependale when it comes to political and economic news. Q. Information we get from [Media mentioned] on important national issues, such as the privatization of major industries in Ukraine, is reliale. Q. [Media mentioned] gives us news regarding the activities of all the political parties. Respondents were directed to answer these questions only in reference to their main source of information aout political and economic developments. For each question, the respondent could agree, disagree, or partially agree. Responses are coded so that Agree = 3, Partially Agree = 2, and Disagree = 1. The means for each media are presented elow y category (print, radio, or television). The average for each category is given as well. Time and space restrictions allowed questions for only one media source per respondent. For this reason, the numer of persons (cases) varies for each media source. Data for these questions are presented in Figure 30.
48 International Foundation for Election Systems 44 Figure 30. Media Performance Decemer 2000 Data (n=1500) DEPENDABLE RELIABLE COVERS Q18.1 MAIN SOURCE: NEWSPAPER Mean # Mean # Mean # Vechernie vesty Vysokyi zamok Holos Ukrainy Express Kievskie vedomosti Komsomol"s"kaya pravda v Ukraine Raochaya gazeta Ukrainy Segodnia Sil"s"ki visti Trud Ukraine Ukraine moloda Uriadovyi courier Facty i commentarii Argumenty i facty Ukraine Bisness Local newspapers Other Average for newspaper Q18.2 MAIN SOURCE: RADIO Mean # Mean # Mean # Ukrainian radio 1-st channel Ukrainian radio "Promin" Dovira-Nika-FM Nashe radio Russkoie radio Chit FM Radio Lux FM Radio Svooda Gala-radio Local radio-channel Other Average for radio Q18.3 MAIN SOURCE: TV Mean # Mean # Mean # UT UT-2, Inter ICTV Novyi channel STB NTV RTR Local TV-channel Other Average for TV
49 International Foundation for Election Systems 45 All categories of media averaged higher scores for dependale coverage of general events than reliale coverage of main issues. All media scored lowest on coverage of all political parties. Newspapers were chosen as a main source of information y 224 respondents. Between 220 and 211 of them gave sustantive evaluations on the performance of their selected print media. The remaining few responded do not know or did not answer when asked. Overall, print media was rated highest for its dependale coverage. Print media averaged 2.42 on a scale of respondents chose radio stations as their main source of information. Between 139 and 125 provided evaluations of the radio stations they selected. Radio, on average, scored higher than other media for its coverage of all political parties among those who rely on it respondents chose television stations as their main source of information. Between 953 and 1003 respondents provided evaluations of their chosen TV station. Comparison of performance across different categories of media is complicated y the fact that different people evaluated different media. Valid performance evaluations across different media and types of media would require that the same people evaluate all. These data can only suggest a pattern, and that pattern would need to e replicated in a more extensive media study. The pattern suggested in these findings is that print media is rated higher than radio or television for its dependale and reliale coverage. Radio is rated higher for its coverage of all political parties. Television, relied on y most of the people, is rated lower y its viewers than print y its readers for all three performance attriutes. TV is rated higher for reliale coverage and coverage of all political parties than is radio y its listeners. Internet An additional piece of information gathered in the Decemer 2000 survey is relevant here. Respondents were asked aout the extent and type of their internet usage. The data shows that 7% of the total adults sampled claim to use the internet. Another 24% do not know what the internet is, and another 1% did not answer the question. The rest (69%) have never used it. Almost 90% of internet users primarily use the internet at work or school. These data highlight the amount of work remaining to e done with the media. One pressing need is the development of investigative skills and a sense of responsiility within the media for informing the pulic aout what it needs to know not what others want them to know. There are many ostacles to this in Ukraine. Ownership of media is one concern, and the relationships etween ownership of media and the political system is another. The Ukrainian pulic perceives that the media is in a difficult position. The Decemer 2000 survey asked: In your opinion, how safe is it for the media in Ukraine to roadcast or print their true opinions, even if these opinions are critical of the government? Less than 20% elieve that it is safe for the media to pursue the truth. A plurality (42%) elieve it is somewhat dangerous for the media to print or roadcast their true opinions. Another 24% elieve it is very dangerous to do so.
50 International Foundation for Election Systems 46 VI. Variations in Attitudes Over Time and People The findings discussed aove were ased on visual inspection of trends, and are generalized for the total sample representing the adult population of Ukraine, 18 years of age and aove. Statistical multi-variate regression provides a more systematic summary of patterns in the data ecause the technique allows us to examine the simultaneous influence of different factors, such as education, age, socio-economic status, and region. Regression analysis may e used for different reasons. Frequently, methods of statistical regression are used to model causal relationships that an analyst may expect to appear in the data. Regression allows one to test the influence of a variale A on the target variale B. This approach, however, is not used here, and causation is not implied, ecause the nature of the data does not support it. Regression is used here as a way to summarize the (linear) effect of a variale on a target variale and to isolate effects caused y simultaneous factors, or multi-variate influences, on the variale of interest. 7 Results from regression analyses, summarized here, indicate that specific factors have a statistically significant effect on the pattern of response of particular variales or attitudes. These results are given here so that they may provide additional insight. It should e noted that this report cannot explain these effects and that these explanations are ased on psychological and historical processes eyond the scope of the report. All variales in the trend data set have een recoded so that an increase in the value corresponds with an increase in the phenomena measured y the variale. For example, increased values for the confidence variales indicate increased levels of confidence. Similarly, an increase in the value of a variale such as interest in politics indicates increases in levels of interest. The scale underlying some variales is not evident. In these cases, the variale is recoded to indicate an increase in what this analyst assumes the interest is ehind asking the question in the first place. For example, respondents are asked to choose a point indicating preference etween a market economy and a planned economy. The interest here is in the support for a market economy, and the variale is recoded so that a high value indicates increased levels of support. Several variales are recoded as dichotomies to facilitate analyses. This is usually done for questions that ask for a yes or no response from respondents. Please note that recoding does not necessarily change the question. It is done, in this case, to orient the variales in similar directions so that (meta) interpretation of them is easier. In summary, there is a slight upward trend over time to most of the attitudes measured in the IFES surveys. Compared with past surveys, later surveys show slightly higher levels in attitudes that political reforms are not happening fast enough, that Ukraine is ecoming a democracy, and that it should adopt a market economy. A similar increase appears in the general satisfaction Ukrainians feel with their personal situations (or at least that levels of dissatisfaction are declining) and in confidence levels for all institutions except the Supreme Rada (which shows no change over time). Interest in politics and the elief that voting gives influence also increases slightly over time. The perception that there is adequate political and economic information shows slight increase as well. There are also declines over time, however, in the preference for economic reforms and estimations of the actual rate of economic reform. People elieve that these are happening too quickly. There is also an increase over time in the commonness and seriousness of corruption, and the perception that it is accepted. At the same time, there is a decline in the elief that this acceptance contriutes to the prolem of corruption. Support for the importance of elections, the rights of minorities, private property, freedom to form political parties, freedom of religion, and freedom of association shows a decline over time. Fewer elieve that NGOs are either necessary or indicate that they would volunteer their time for one. 7 The ase model includes characteristics aout the individual (age, education and socio-economic status) plus the environment that the individual is located in physically (city size) and temporally (time of the survey). Dichotomous coding is used for categoric variales. Additional models test the additive effects of other factors.
51 International Foundation for Election Systems 47 Females differ from males in their sentiments on the pace of economic reform and their level of support for a market economy. When the effects of other factors are accounted for, women exhiit higher levels of confidence in the military, courts, pulic prosecutors, and the police than men. Overall, 25% of women versus 22% of men are confident in the police, 38% versus 25% are confident in the pulic prosecutors, 37% of women versus 24% of men are confident in the courts, and 70% versus 67% are confident in the military in the comined data set. Women also are less likely to e interested in politics or to elieve that voting gives them influence and are more likely to elieve politics is too complicated and that people like them have little influence. Women are less likely than men to elieve that choice of political parties, honest elections, minority rights, and freedom to form parties are important. Freedom of religion is more important to women than men. Women also tend to elieve that there is not enough political and economic information availale to them. This difference is quite significant: 13% of women versus 7% of men claim there is no information availale aout political issues and 15% of women versus 8% of men claim there is no economic information availale to them, in the comined data set. As SES rises, the perception that political reform is too slow decreases and the sense that Ukraine is a democracy (or moving toward one) increases. The higher the SES, the higher the sense that economic reforms are moving too slowly and that the President can resolve Ukraine s economic prolems. Satisfaction and confidence in all institutions rises as SES increases. Political efficacy and the perception that politics is too complicated decreases in the same manner. Support for most human rights increases. Respondents with a higher SES tend to elieve that NGOs are necessary and are more likely to volunteer time for one. High levels of SES are also associated with the elief that there is enough political and economic information. Education follows a similar pattern to SES, with the following exceptions. The higher the education, the more likely the respondent is to elieve that Ukraine is not a democracy. Level of education is also negatively associated with confidence in the Constitutional Court, the State Security, pulic prosecutors, and the police. As age increases, so does the perception that political reforms are not happening fast enough and that Ukraine is not a democracy (or is not ecoming one). Older respondents are less supportive of a market economy, less optimistic aout the future of the economy, and less satisfied with the general situation in Ukraine. Older respondents are also more likely to think that corruption is common and that people accept it. Confidence in the Supreme Rada, the Executive Branch, local government, the military, and the courts increases with age, while confidence in the National Bank decreases. As age increases, so does interest in politics, and older respondents are more likely to elieve elections, minority rights, and religion are important, while less likely to think private property and freedom of association are. As the size of city where the respondent lives increases, the elief that Ukraine is a democracy (or moving toward one) decreases. Those in larger cities are less optimistic aout the future of the economy or that the President will resolve economic troules. They are more likely to elieve that economic reforms are not happening fast enough and more supportive of a market economy. Those in larger cities are less satisfied with the situation in Ukraine and less likely to think corruption is common or to think that people accept corruption as a way of life. Confidence in nearly all institutions decreases as the size of the city the respondent lives in increases. Residents of larger cities are more interested in politics and less likely to think politics is too complicated or that they have no influence. They tend to elieve there is adequate information aout politics, ut are more likely to think that voting does not give influence. The larger the city, the more likely the respondent is to elieve that elections are important and that the right to form political parties free from the state and freedom of association are important. They are also more likely to elieve that NGOs are necessary. Ethnic Russians are not likely to e optimistic aout the future of the economy compared to ethnic Ukrainians. They are also less satisfied and less confident in all social institutions and place a higher value on minority rights than ethnic Ukrainians. Respondents who identify with other ethnic groups are less likely than ethnic Ukrainians to think that Ukraine is a democracy and more likely to think that the actual pace of economic reforms is moving too quickly. They tend to elieve that corruption is serious and that people accept it. Identifying with an other ethnic group is associated with
52 International Foundation for Election Systems 48 increased confidence in the Supreme Rada, ut decreased confidence in all other legal institutions. They have a tendency toward less interest in politics and a sense that voting does not give them influence. Those identifying with other ethnic groups place more importance on honest elections and the rights of minorities than ethnic Ukrainians. Both ethnic Russians and ethnic others are less likely to state that they have een discriminated against ecause of their ethnicity than ethnic Ukrainians. Regional Variations Appendix 3 explains the regional categories created y SOCIS-Gallup to classify the geography of Ukraine. This section discusses differences in patterns of response etween the different regions. These differences persist even after the respondent s age, level of education, SES, the size of settlement they reside in, and the time of the survey is accounted for. These differences seem to descrie distinctive characteristics of the regions that should e considered. SOCIS-Gallup divides Ukraine into 11 regions: 1. Kyiv 2. Northern 3. Central 4. Northeastern 5. Northwestern 6. Southeastern 7. Western 8. Southwestern 9. Southern 10. Crimea 11. Eastern Regions tend to form locks that resemle each other in the extra effects living in that region seems to have on patterns of responses. The Southern and Eastern regions and Crimea show tendencies toward a lack of confidence in social institutions when the other effects (i.e. the ase model) are accounted for. They have a tendency toward attaching lesser importance to human rights and political parties, and have lower political efficacy the elief that they have influence in political matters. Respondents from these regions are more likely to hold the view that the elections will not e honest. Crimea is different from the other two in that respondents there have an extra sense they are isolated from political and economic information, while the Eastern and Southern Regions (political information, only) do not. In Crimea, 14% state they have at least a fair amount of information aout politics. In the Southeast and East regions, 46% and 43%, respectively, give this response. Respondents from the Eastern and Southern Regions are more likely than the national average to say that they have information aout their rights under the Constitution. The Eastern Region differs from the other two in that there is a tendency there to think political reforms are not happening fast enough. In the Southern Region, there is a tendency for support for the Supreme Rada, which is not found in the other two. Corruption has special emphasis for respondents in Crimea. The Western and Southwestern Regions resemle each other in their sense of optimism aout the national economy in one year and the importance of foreign investment. Both also show a tendency toward satisfaction with the current situation in Ukraine and toward confidence in many social institutions. Respondents in oth regions have tendencies toward the elief that there is enough information aout politics and the economy. On the negative side, respondents in these regions predict that the elections for Supreme Rada will not e honest. Both perceive that there are clear differences etween parties. Being in the Southwest seems to increase the perception that several human rights are important, which is not true for the West. The Southwest also has a significantly lower tendency in thinking corruption is common. Kyiv, the Northern and Central Regions have more similarities than differences. Those living in these areas exhiit higher levels of confidence in social institutions and economic optimism. Kyiv and the Northern Region also view
53 International Foundation for Election Systems 49 the President in a positive light, indicating that he will resolve economic troules and place increased importance of foreign investment. Both tend to express satisfaction with the current situation, yet seem concerned that acceptance of corruption y Ukrainians helps to further exacerate that very prolem. Respondents in Kyiv and the Central Region are less likely to say that politics is too complicated or that they have no influence on political outcomes. In the Central Region, there is a decrease in the perception that political parties are important. Respondents from the Northern Region differ from those in the other two on the issues of political and economic information. Higher percentages of people in Kyiv and the North regions report at least a fair amount of information aout politics and economics compared to the Central region: 44% in Kyiv and 42% in the North versus 33% in the Central region for the amount of political information. For economic information, 37% of respondents in Kyiv report at least a fair amount of information, compared to 36% for the North and only 27% for the Central region. The difference is greater for knowledge of rights under the Constitution: 30% in Kyiv versus 22% in the North and only 17% in the Central region report they have at least some information. Perceived access to information in Kyiv and the North regions are consistently higher than the Central region. The difference etween Kyiv and the North is that most of positive increase in amount of information oserved in Kyiv is carried y other factors such as increased levels of education and SES found there. The increased levels of information reported in the North remain, statistically, even after these other factors are accounted for. The Northeastern, Northwestern, and Southeastern Regions appear more unique. Northeastern Residents tend to have greater confidence in many social institutions, place less importance on foreign investment, and are less likely to elieve that corruption is a serious prolem. There is also a diminished interest in politics, a decrease in the view that individuals have influence on politics, and a lower perception of the importance of NGOs. At the same time, there is an increased sense that all human rights (except private property) are important. Northwestern residents have little additional confidence in social institutions, with the exception of their confidence in President Kuchma, which is higher than the national average. There is a tendency in this region toward satisfaction with the current situation, optimism aout the future of the economy, and the sense that the President will resolve Ukraine s economic troules. There is less of a perception that corruption is a serious prolem. Southeastern residents exhiit less confidence in the Cainet of Ministers and the Police and tend to elieve that voting does not give citizens influence. They do not find politics too complicated to understand, and, corresponding to this, they have an increased sense that there is enough information aout politics and the economy. There is also less importance placed on protection of private property and freedom of religion. Ukraine may also e divided into three regions: east, west, and an intermediate area etween the two. This classification is covered in more detail elow, Appendix 3. Classifying regions into these categories divides the trend data set into 52% east, 30% west, and 18% intermediate. Most of the IFES variales have a clear dimension or scale underlying them. This was discussed aove. Taking the mean or average indicates how far a group or set of groups is on that scale. An Analysis of Variation (ANOVA) was then run on all trend variales to assess the statistical difference etween these three regions the differences etween means for each region on each variale. Overall, the analyses show that these distinctions are very useful in summarizing distinctive differences etween respondents. In many cases, the intermediate area is not statistically different from the east. In fewer cases, this area is not statistically different from the west. This supports the classification that this area is in-etween the east and west. The geography of mean responses tends to follow expected patterns. Full details are not provided here, ut the following summary captures the essential points of the analysis. Modified variale laels are used elow to simplify the discussion. This may e hard to follow for people who are unfamiliar with the structure of the IFES questionnaires. Appendix 2 provides some help in this regard. The patterns fall into several scenarios: Case I. There is no significant difference in attitudes etween respondents in the west, east, and intermediate areas. The variales falling into this category include: Actual pace of economic reforms, Accepting corruption contriutes
54 International Foundation for Election Systems 50 to the prolem, Accepting corruption as a way of life, Politics too complicated, Importance of Honest Elections, Importance of Free Speech, Possiility to Form NGOs, NGOs are necessary and Volunteer for a NGO. Case II. The average in the West is greater than the average in the East, which is greater than the average in the Intermediate areas. This includes the variales: Pace toward a market economy, Market versus planned economy, Knowledge aout rights under the constitution, Two political parties are important for democracy, the Amount of information availale aout politics, and the Amount of information availale aout economics. Case III. The average in the West is greater than the average in the Intermediate areas, and together these are greater than the average in the East. In this category are: Movement toward democracy, Type of economy preferred, National economic conditions in one year, Confidence in the Executive Branch, Confidence in the Presidential Administration, Confidence in Leonid Kuchma, and Confidence in the courts. Case IV. The Intermediate average is greater than the West average, which is greater than the East average. Only Confidence in the State Security falls into this category. Case V. The Intermediate average is greater than the East average, which is greater than the West average, ut differences etween East and West are not significant. This includes the variales: Voting gives no influence, Corruption is common, Importance of minority rights, and Importance of private property. Case VI. The West average is greater than either the East or the Intermediate, ut differences etween some pairs are not significant. The remaining variales in the trend data set are in this category. To summarize, respondents in the west are more supportive of a market economy, more likely to elieve that at least two parties are necessary for democracy, and more likely to elieve that there is enough information availale aout politics and the economy. Respondents in the intermediate areas are more confident in the State Security Service, more certain that corruption is common and that voting gives no influence, and stress the importance of minority and property rights. Respondents in the east are more supportive of a market economy and the pace toward this than those in the intermediate areas. They are also are likely to elieve that information is availale aout politics and the economy than those in the intermediate area.
55 International Foundation for Election Systems 51 VII. Conclusion This report egan y summarizing Ukrainians experience of change in their country since its independence in The Decemer 2000 data indicates that all ut a small minority (perhaps 15% of the sample) claim that these changes have een significant. An even smaller minority (perhaps 7%) reports that it has actually enefited from these changes. The rest elieve that they have een hurt y a decade of vast social, economic, and political change, and a majority state that nothing good has happened in the country, or in their private lives, over this time. Is Ukraine going in the wrong direction? Economic prolems seem to oscure the important and eneficial developments that Ukrainians have witnessed in their lives. Independence and statehood is viewed an important accomplishment for many. Still others see hope in further movement toward the European Community and the world market. A majority (53%) favors eventual integration into Europe, and those who favor a market-type economy outnumer those who do not (32% versus 26%, and 32% choosing a point in-etween the two). A slim majority also elieves that foreign investment is important to achieving these ends (52%). However, Ukrainians do not elieve that their country is a democracy, regardless of how they conceptualize this term. Many do not think that their country is even moving toward democracy, and a majority thinks that political reforms in general are occurring too slowly. Ukrainians are very concerned aout crime, and most (79%) elieve it has increased very much over the last decade. Corrupt ehavior carried out y officials is considered a serious and widespread prolem according to nearly all respondents. Most Ukrainians would say that the country is going in the wrong direction and would support change. What sort of change, however, do they envision? Data from pulic opinion polls are sophisticated measures of pulic mood, ut they only supplement a more in-depth understanding of a country undergoing rapid change. This report has aimed to pull out and summarize asic trends from pulic opinion data collected y the International Foundation for Election Systems over these last seven years in Ukraine. These data provide some asis for hope and show that many in Ukraine are supportive of the changes they endure, even as they feel threatened y them. Unfortunately, this support appears shallow. Unanticipated events could easily turn support for change away from the West and toward a more reactionary alternative. Dissatisfaction with the overall situation in Ukraine runs deep. The continual perception of personal hardship and deprivation will undoutedly motivate a solution. In the search for such a solution, many Ukrainians turn to their president as the most likely candidate for resolving the country s economic prolems the main ostacle to their pursuit of a etter life. Recent events, however, may ring increased pressure to ear on President Kuchma, though the result of these developments remains to e seen. Several concerns emerge from the analyses presented here. For one, there is much support for old ideas and former political solutions. In the Decemer 2000 data, nearly one third of the sample might e descried as passive supporters of the previous social order. A further one third (29%) might e considered active supporters. The numers are rough estimations, ut the tendencies are clearly there. Several groups in Ukraine are at risk of rejecting proactive and pro-western political and economic reforms. Consistent with this trend, the Communist Party of Ukraine has the highest level of support of any individual political party. Ethnic Russians, approximately 20% of the sample, consistently report low levels of confidence in social institutions, lack faith that national elections will e held in a fair and honest manner, and are quite concerned aout the level of corruption they see around them. They appear to feel out of touch with the current political order in Ukraine and are the most likely catalysts for reactionary measures. There are also clear differences in Ukraine etween the three major divisions of the country. Those from the west are more supportive of a market economy, more confident in social institutions and more convinced that President Kuchma will resolve their economic troules. Ukrainians in the east are not as convinced of this. Those in the
56 International Foundation for Election Systems 52 intermediate areas can go in different directions depending on the issue. They appear more supportive of the current administration and social institutions and are more pro-market than those from the east, yet they seem to feel more powerless than either those in the west or those in the east. It seems as if those in the intermediate areas perceive themselves as minorities. It may e important to understand this group etter. Results from Crimea indicate that this region has low levels of confidence in institutions, low levels of political efficacy, and they elieve that they lack political and economic information. This comination is not good for a region located on the periphery of the country. Women appear to e reacting to the crime and corruption around them with increased support for institutions that enforce law and order in society: the military, police, courts, and pulic prosecutors. They do not appear to e at the forefront of political change, nor are they as involved with non-governmental organizations as men. At the same time, many women express a great need for more information aout political and economic events in their country. With perhaps two-thirds of the adult population supporting old ideas, who remains to enact social change? Moreover, what group has the political will to accomplish this? The finding that over 59% of the adult population would do nothing if higher political officials chose to replace their elected representative with an appointed alternative is telling. Within the donor community, much hope and attention is directed toward non-governmental organizations. The data yields a mixed review of this approach. Ukrainians show no tendency to support such organizations en masse. While the population is fairly evenly split in its opinion aout the necessity of these groups and etween 40% and 50% report at least some trust in them, very few people suggest they might join and very few people currently turn toward NGOs to solve their prolems. It is hard to see road-ased support for this sector emerging in the short run to moilize for political change in the short run. At the same time, Ukrainians have the highest level of confidence in the church as an institution. There is a dramatically increasing trend over time in the numer of Ukrainians that identify themselves as participating or elonging to a church. Ukrainians expect their representatives and leaders to solve the country s prolems. The data suggests that reform and the drive to resolve these prolems may have to come from aove if anyone expects dramatic steps to e taken in the immediate future. Situated at the order of Europe, right next to countries slated for EU memership, Ukrainians can see how well their neighors living conditions have improved in a relatively short period of time. It must e hard to accept that a country as rich in resources as Ukraine cannot find a etter life for its people. In terms of general catalysts for reform, economic development is proaly the most significant. The survey data indicate a correlation etween higher economic well eing and confidence in institutions, political efficacy and support for democratic and market reforms. It also makes for a etter life.
57 International Foundation for Election Systems == rounding error = less than 0.5% A1-1 Appendix 1. Decemer 2000 Data 8 The Decemer 2000 survey was conducted etween Novemer 27 and Decemer 5, Interviews averaged 61 minutes and ranged etween 22 and 150 minutes. Respondents were given a choice of language for the interview. Of 1500 total interviews, 573 (38%) were carried out in Ukrainian and 927 (62%) in Russian. Interviewers rated respondents level of cooperation. Less than 10% were rated as uncooperative. Slightly under half (41%) cooperated, ut gave little detail in their responses, and another 38% were cooperative, and gave much detail. Finally, 13% were rated as very cooperative y the interviewers. The sample represents the adult population of Ukraine aged 18 years and older. A random route method was used to select starting points for interviewing. After the initial start, an agreed upon interval was used y all interviewers to select the following households. Selection of respondents within the household was done using the random selection method of closest irthday. The data uses post-stratification weighting to achieve a representative sample of adult Ukrainians y age, gender, and settlement type according to statistics from the 1990 census. Tale App.1.1 Demographic Characteristics of the Sample Unweighted Weighted Count Percent Count Percent Gender Male Female Age Education Primary and incomplete secondary Secondary Secondary + specialized training University incomplete University complete Advanced study Settlement Type City 500, City 200, , City 50, , City 20,000 49, < 20, CTS Rural This methodological section is ased upon the report provided y SOCIS-Gallup.
58 International Foundation for Election Systems == rounding error = less than 0.5% A Region Tale App Demographic Characteristics of the Sample (Continued) Unweighted Weighted Count Percent Count Percent Region Kyiv North Center North East East South East North West West South West South Crimea Dates of fieldwork Tale App Details of the Fieldwork # sampling # interviewers points (city +village) 5. Completed interviews 6. Uncompleted Interviews 7. # contacts (5+6) Kyiv North Center North-East East South-East North-West West South-West South Crimea TOTAL Main reasons for refusal to participate included: shortage of time, no confidence in pulic surveys, and did not wish to open the door to unknown people. The Social Context of the Fieldwork. Difficult weather delayed the start of fieldwork in 6 olasts and caused power shortages and loss of gas and heat for nearly 2000 settlements. Transportation was difficult due to ice, which delayed food supplies from reaching many settlements. In the opinion of the interviewers, all of these prolems negatively affected the emotional state of the respondents. Settlements lost power in the evenings. During fieldwork, A. Moros, the leader of the Socialist Party of Ukraine, released an audiocassette, which served as evidence to implicate President Kuchma in the murder of the journalist Georgiy Gongadze. This was actively deated and received a wide hearing among the population. This may have aggravated an already low level of trust in officials in Kyiv.
59 International Foundation for Election Systems == rounding error = less than 0.5% A1-3 Section 1: Perceptions of Social Change Q1. Do you elieve that major changes in Ukraine over the last 10 years have effected the lives of most people, or do you elieve that the changes here have had little effect on the lives of most Ukrainians? Major changes have effected the lives of 85% most people Changes have had little impact on the lives 7% of most Ukrainians Had effect on some, others not 7% [VOLUNTEERED] Don t Know 1% No Answer Q2. In your opinion what good things have happened in the country since 1990? Ukrainian independence 14% Increase in personal freedom 10% Increased availaility of material goods 4% Creation of conditions for usiness, private property 4% Peace and calm 3% Adoption of national symol (flag, hymn) 2% Land reform 2% Religious freedom 2% Adoption of Ukrainian Constitution, new laws 2% Nothing good [VOLUNTEERED] 57% Other 4% Don t Know 7% No Answer
60 International Foundation for Election Systems == rounding error = less than 0.5% A1-4 Q3. In your opinion what ad things have happened in the country since 1990? Decrease in the standard of living 54% Unemployment 28% Economic crisis 13% Rise in crime 7% Decline in social support (medical, education) 7% Corruption 4% Decline in law and order 3% Increased social stratification 3% Loss of money deposits in USSR Savings Bank 3% General social decline 3% Collapse of USSR 3% Decline in cultural standards and morality 3% Other 4% Don t know 11% Q4. In your opinion what good things have happened to your household since 1990? Birth of grandchildren 16% Educational advancement 8% Wedding 7% Improved material position 4% Advancement (getting a new/etter jo) 4% Receiving/uying/uilding an apartment or house 4% Other 1% Nothing good [VOLUNTEERED] 56% Don t Know 8% Q5. And what ad things have happened to your household since 1990? Lower standard of living (personal 37% reference) Unemployment 17% Death of relatives 14% Illness/unale to afford treatment 11% Loss of deposits in USSR Savings Bank 5% Lower standard of living (in general) 4% Divorce 3% Delays with wages/pension payments 2% Underemployment (decrease in work/lower 2% level of jo) Other 1% Nothing ad happened 6% Don t Know 12%
61 International Foundation for Election Systems == rounding error = less than 0.5% A1-5 Q6. Over the last 10 years some people have enefited from the change, and others have een hurt. Please look at the picture on this card. The picture shows different responses to this question. 1 represents that you and your family have een hurt y changes over the last 10 years, 3 represents that your situation has not changed much, and 5 represents that you and your family have enefited y the change. Or, you can choose a point in-etween these answers. Please think aout the total effect on your family from changes in Ukraine over these last 10 years. Where would you place yourself on this picture? 1 (Hurt) 48% 2 29% 3 (Situation has not changed much) 15% 4 6% 5 (Benefited) 1% Don t Know 1% No answer Q7. Compared to ten years ago, do you think that the percentage of poor people in Ukraine has increased, decreased, or stayed aout the same? Increased 95% Decreased 2% Stayed aove the same 2% Don t Know 1% No Answer Q8. Over the next ten years, do you think the percentage of poor people in Ukraine will increase, decrease, or stay aout the same? Increase 64% Decrease 11% Stay aout the same 13% Don t Know 12% No Answer
62 International Foundation for Election Systems == rounding error = less than 0.5% A1-6 Q9. Some people say that the prolem of crime has gotten worse over the past few years, other people do not agree. What is your opinion? In Ukraine, has crime increased very much, increased a little, stayed the same, decreased a little, or decreased very much over the past few years? Increased very much 79% Increased a little 12% Stayed the same 4% Decreased a little 3% Decreased very much Don t know 2% No answer Q10. Do you agree or disagree with the following statement. I trust the justice system to protect me from unjust treatment of the state. Do you strongly agree, somewhat agree, somewhat disagree, or strongly disagree with this statement? Strongly agree 4% Somewhat agree 11% Somewhat disagree 36% Strongly disagree 40% Don t know 8% No answer Total 99%=
63 International Foundation for Election Systems == rounding error = less than 0.5% A1-7 For Q. 11 and Q. 12: Now I want to ask you some questions aout your outlook on life. Please look at these cards. On them you see two contrasting statements. Using the scale shown in the picture, could you tell me where you would place your own view? 1 means you agree completely with the statement on the left, 10 means you agree completely with the statement on the right, or you can choose any numer in etween. Q11. One should e cautious aout making major changes in life... You will never achieve much unless you act oldly. 1 (Completely agree with cautious) 8% 2 5% 3 7% 4 8% 5 10% 6 8% 7 10% 8 14% 9 8% 10 (Completely agree with old) 18% Don t know 5% No answer Total 101%= Q12. Ideas that have stood the test of time are generally est... New ideas are generally etter than old ones. 1 (Completely agree with old ideas ) 13% 2 9% 3 11% 4 9% 5 16% 6 9% 7 8% 8 8% 9 4% 10 (Completely agree with new ideas ) 7% Don t know 6% No answer
64 International Foundation for Election Systems == rounding error = less than 0.5% A1-8 Section 2: Information Availale in Society Q13. How much information do you feel you have aout political developments in Ukraine -- a great deal, fair amount, not very much, or none at all? 7/97 5/98 6/99 1-2/00 Great deal 3% 5% 5% 7% 12% Fair amount 21% 25% 36% 31% 48% Not very much 56% 52% 47% 47% 32% None at all 15% 12% 7% 10% 6% Don t know 5% 6% 4% 4% 2% No answer 1% 100% 99% 100% 100% Q14. How much information do you feel you have aout economic developments in Ukraine -- a great deal, fair amount, not very much, or none at all? 7/97 5/98 6/99 1-2/00 Great deal 2% 2% 5% 5% 7% Fair amount 15% 22% 32% 25% 39% Not very much 55% 55% 51% 51% 43% None at all 22% 15% 8% 14% 8% Don t know 7% 5% 5% 4% 3% No answer 1% Total 101%= 99%= 100% 100% 100% Q15. In the last few years the government has egun the process to sell state owned enterprises such as energy and coal. How well informed are you aout the government s efforts at privatization? Well informed 4% Somewhat informed 23% Not well informed 42% Not informed at all 28% Don t know 3% No answer
65 International Foundation for Election Systems == rounding error = less than 0.5% A1-9 Q16. What media are your main sources of information aout political and economic events in Ukraine? MARK ALL Newspaper 53% Radio 45% Television 86% Other 3% Don t know 3% No answer Q17. Of all these you mentioned, which one do you rely on the most for political and economic news? (1446) Newspaper 16% Radio 10% Television 73% Other Don t know 3% No answer Total 102%= Q18A. And, which newspaper is the most important to you? [ASKED OF THOSE WHO SELECTED NEWSPAPER IN Q17] (224) Vechernie vesty 2% Vysokyi zamok 4% Holos Ukrainy 1% Express 3% Kievskie vedomosti 1% Komsomol s kaya Pravda 3% Molod Ukrainy Raochaya gazeta Segodnia 1% Sil s ki visti 5% Trud Ukraine Ukraine moloda 2% Uriadovyi courier 2% Facty i commentarii 34% Argumenty i facty Ukraine 1% Bisness Local newspapers 3% Other 37% Total 99%=
66 International Foundation for Election Systems == rounding error = less than 0.5% A1-10 Q18B. And, which radio station is the most important to you? [ASKED OF THOSE WHO SELECTED RADIO IN Q17] (144) Ukrainian radio 1-st channel 66% Ukrainian radio Promin 7% Dovira-Nika-FM 1% Nashe radio 1% Russkoie radio 4% Chit FM 1% Radio Lux FM 1% Radio Svooda 4% Gala-radio Local radio channel 8% Other 9% Total 102%= Q18C. And, which television station is the most important to you? [ASKED OF THOSE WHO SELECTED TELEVISION IN Q17] (1020) UT-1 10% UT-2, % Inter 45% ICTV Novyi channel 1% STB 1% NTV 2% RTR 1% Local TV channel 1% Other 6% For Q 19: You said that you rely the most on [MEDIA MENTIONED IN Q18]. Thinking of [MEDIA MENTIONED IN Q18]. How much do you agree or disagree with the following statements. Q19A. [MEDIA MENTIONED IN Q18] is dependale when it comes to political and economic news. Do you... (1389) Agree 38% Disagree 5% Agree somewhat/disagree somewhat 55% Don t know 2% No answer
67 International Foundation for Election Systems == rounding error = less than 0.5% A1-11 Q19B. Information we get from [MEDIA MENTIONED IN Q18] on important national issues, such as the privatization of major industries in Ukraine, is reliale. Do you... (1389) Agree 27% Disagree 12% Agree somewhat/disagree somewhat 54% Don t know 7% No answer Q19C. [MEDIA MENTIONED IN Q18] gives us news regarding the activities of all the political parties. (1389) Agree 29% Disagree 18% Agree somewhat/disagree somewhat 47% Don t know 6% No answer Q20. In your opinion, how safe is it for media in Ukraine to roadcast or print their true opinions, even if these opinions are critical of the government? Is it very safe, somewhat safe, somewhat dangerous, or very dangerous? Very safe 3% Somewhat safe 17% Somewhat dangerous 42% Very dangerous 24% I don t care aout this [VOLUNTEERED] 6% Don t know 8% No answer
68 International Foundation for Election Systems == rounding error = less than 0.5% A1-12 Q21. What aout in your personal conversations. When you meet your friends, do you talk aout politics often, sometimes, rarely or never? Often 24% Sometimes 34% Rarely 27% Never 15% Don t know No answer Q22. When you yourself, hold a strong opinion, do you ever find yourself persuading your friends, relatives or colleagues to share your views? IF YES, does it happen often, from time to time, or rarely? No, never 30% Yes, often 16% Yes, from time to time 31% Yes, rarely 16% Don t know 4% No answer Total 97%= Section 3: Government Q23. Here is a list of some ways that city or village government officials can ask your opinion on issues or aout prolems that concern you. Which of these have happened to you? [MULTIPLE CHOICE ALLOWED] City or village government officials have never 86% asked me my opinion City or village government officials sent or gave 4% me a questionnaire to complete I was asked to attend a pulic hearing 6% I was asked to participate in an advisory group 2% Other 1% Don t know 5% No answer 2%
69 International Foundation for Election Systems == rounding error = less than 0.5% A1-13 Q24. Have you ever contacted your elected officials efore to help solve a prolem in your life? [IF RESPONDENT HAS CONTACTED ELECTED OFFICIALS MORE THAN ONCE BEFORE, ASK RESPONDENT TO THINK OF THE LAST TIME RESPONDENT CONTACTED HIS/HER ELECTED OFFICIAL.] Yes 24% No 75% Don t know No answer 2% Total 101%= Q25A. Why haven t you ever contacted your elected officials efore? Not necessary 22% Don t elieve they will help/hopeless 25% Effort/cost greater than enefit 15% Work out my prolems unassisted 8% Other 2% Don t know 6% No answer 2% Not asked 25% Q25B. [IF YES, CONTINUE, OTHERWISE SKIP TO Q29] What level of elected official did you contact? (352) Village/settlement chairman 43% City chairman (mayor) 21% Village/settlement rada deputy 7% City rada deputy 12% City-rayon rada deputy 4% Rayon rada deputy 6% Olast rada deputy 3% People s Deputy of Ukraine 7% Other national leader President of Ukraine 1% Don t know No answer
70 International Foundation for Election Systems == rounding error = less than 0.5% A1-14 Q26. How did you attempt to contact this official? (352) Wrote a letter 21% Telephone call 3% Personal meeting 78% Through someone else 3% Don t know No answer Q27. Did your official respond to you? (352) Yes 73% No 15% Partially 12% Don t know No answer Q28. [IF YES OR PARTIALLY IN Q27] How satisfied were you with the response of your elected official? (298) Completely dissatisfied 35% Somewhat dissatisfied 15% Somewhat satisfied 29% Completely satisfied 20% Don t know 1% No answer Q29. Have you ever contacted an appointed official efore? Yes 17% No 81% Don t know 1%
71 International Foundation for Election Systems == rounding error = less than 0.5% A1-15 Q30. [IF Q29 = YES] Which level of appointed official did you contact? (260) Officials working for local executive odies 88% Officials working for olast level executive 12% odies (including governor) Officials working for central executive odies 2% (including Cainet of Ministers, Ministries, State Committees and Departments, and Administration of the President of Ukraine Don t know No answer Q31. Considering officials, overall. If you had a serious prolem, which of these, if any, would first try to contact regarding this? [ONE CHOICE ALLOWED] ELECTED OFFICIALS Village/settlement chairman 14% City chairman (mayor) 10% Village/settlement rada deputy 2% City-rayon rada deputy 3% City rada deputy 2% Rayon rada deputy 2% Olast rada deputy 1% People s Deputy of Ukraine 5% Other national leader President of Ukraine 3% APPOINTED OFFICIALS Officials working for local executive odies 7% Officials working for olast level 2% executive odies (including governor) Officials working for central executive 1% odies (including Cainet of Ministers, Ministries, State Committees and Departments, and Administration of the President of Ukraine) No one 36% Other 4% Don t know 9% No answer Total 101%=
72 International Foundation for Election Systems == rounding error = less than 0.5% A1-16 Q32. Why would you contact this official first? Trust this official/level 18% Official/level has more power 9% Their responsiility 7% This is the level to start with 6% Official/level closer to people 5% This is the required place to go 4% Previous experience (self and others) 3% Other Don t know 4% No answer Think now aout your city or village. Q33. How well informed are you aout the udget here in your [city or village] and how the funds are spent? Are you well informed, somewhat informed, not well informed, not at all informed? Well informed 2% Somewhat informed 7% Not well informed 22% Not informed at all 67% Don t know 2% No answer Q34. How do you get information aout the udget? I do not receive information aout the udget 56% From newspapers in my city or village 11% From radio in my city or village 6% From TV in my city or village 14% From pulic speeches (after the elections) 2% From other people esides officials 6% I only hear aout this during elections 7% Other 2% Don t know 3%
73 International Foundation for Election Systems == rounding error = less than 0.5% A1-17 Q35. In your opinion, who should decide how the udget is used? Village/settlement chairman; mayor 19% Village/settlement/city-rayon/ or city rada 40% Rayon rada 8% Olast level 10% National level 3% Other 2% Don t know 18% Total 101%= Q36. If the [elected mayor] OR [village/settlement chairman] in your settlement was recalled and another person appointed y a high official to replace him or her, what would your reaction e? Would you... Do nothing, ecause it is none of your concern 25% Do nothing, ecause it is useless to complain 34% Complain, ut nothing else 5% Pulicly protest 4% Such things do not happen [VOLUNTEERED] 6% It depends if there was good reason for it 17% [VOLUNTEERED] Don t know 9% Total 101%= Here on this card is a list of possile answers for the next questions. I am now going to ask you aout several government odies and individuals. For each, please tell me how much confidence you have in them using the answers on your list. Q37A. The Supreme Rada 7/97 6/99 1-2/00 A great deal 2% 3% 4% 3% Fair amount 14% 18% 18% 18% Not very much 36% 39% 36% 40% None at all 43% 32% 31% 33% Don t know 5% 7% 10% 6% No answer 1% 1% 1% 100% 100% 101%=
74 International Foundation for Election Systems == rounding error = less than 0.5% A1-18 Q37B. Cainet of Ministers 7/97 6/99 1-2/00 A great deal 2% 2% 7% 4% Fair amount 14% 18% 30% 22% Not very much 36% 38% 30% 35% None at all 43% 31% 20% 31% Don t know 5% 10% 12% 7% No answer 1% 1% 1% 100% 100% 100% Q37C. Presidential Administration 7/97 6/99 1-2/00 A great deal 2% 2% 9% 3% Fair amount 19% 19% 28% 19% Not very much 31% 34% 28% 34% None at all 37% 32% 20% 33% Don t know 10% 11% 14% 10% No answer 2% 2% 1% Total 99%= 100% 101%= 100% Q37D. Council for National Security and Defense of Ukraine A great deal 8% Fair amount 33% Not very much 20% None at all 18% Don t know 21% Total 101%= Q37E. Local government odies 7/97 6/99 1-2/00 A great deal 3% 3% 6% 5% Fair amount 14% 22% 24% 25% Not very much 31% 34% 31% 35% None at all 48% 33% 26% 28% Don t know 4% 7% 11% 6% No answer 2% 2% 1% 101%= 100% 100%
75 International Foundation for Election Systems == rounding error = less than 0.5% A1-19 Q37F. Local self-government odies A great deal 6% Fair amount 23% Not very much 30% None at all 28% Don t know 10% No answer Total 97%= Q37G. National Bank of Ukraine 7/97 6/99 1-2/00 A great deal 5% 4% 7% 5% Fair amount 19% 24% 23% 20% Not very much 24% 24% 20% 25% None at all 33% 26% 17% 32% Don t know 18% 20% 31% 17% 2% 2% 1% 100% 100% 100% Q37H. Ukraine s military forces 7/97 6/99 1-2/00 A great deal 21% 17% 28% 24% Fair amount 35% 42% 40% 43% Not very much 22% 15% 9% 12% None at all 14% 12% 7% 12% Don t know 8% 12% 14% 9% No answer 1% 2% 1% 99%= 100% 101%= Q37I. Constitutional Court 6/99 1-2/00 A great deal 8% 15% 11% Fair amount 27% 28% 29% Not very much 20% 17% 22% None at all 16% 12% 18% Don t know 26% 26% 19% No answer 2% 2% 1% Total 99%= 100% 100%
76 International Foundation for Election Systems == rounding error = less than 0.5% A1-20 Q37J. State Security Service 7/97 6/99 1-2/00 A great deal 11% 12% 16% 13% Fair amount 25% 32% 32% 33% Not very much 24% 17% 15% 17% None at all 22% 17% 12% 17% Don t know 18% 21% 23% 20% 2% 2% 1% Total 101%= 101%= 100% 101%= Q37K. Leonid Kuchma 6/99 1-2/00 A great deal 2% 20% 8% Fair amount 13% 29% 21% Not very much 32% 19% 28% None at all 32% 21% 37% Don t know 20% 9% 6% No answer 2% 2% 1% Total 101%= 100% 101%= Q37L. Viktor Yushchenko A great deal 12% Fair amount 29% Not very much 21% None at all 27% Don t know 10% Q37M. Church 1-2/00 A great deal 34% 32% Fair amount 30% 30% Not very much 9% 11% None at all 9% 15% Don t know 17% 11% 1% 100%
77 International Foundation for Election Systems == rounding error = less than 0.5% A1-21 And how much confidence do you have in each of the following ranches of the legal system to treat people with fairness and justice when making their decisions? Q38A. The courts 7/97 6/99 1-2/00 A great deal 4% 7% 8% 6% Fair amount 24% 28% 26% 23% Not very much 37% 27% 26% 30% None at all 28% 22% 21% 30% Don t know 7% 14% 16% 10% No answer 1% 2% 99%= 99%= 99%= Q38B. Pulic prosecutors 7/97 6/99 1-2/00 A great deal 5% 6% 8% 7% Fair amount 24% 31% 28% 25% Not very much 34% 25% 25% 28% None at all 28% 22% 21% 29% Don t know 8% 15% 16% 12% No answer 1% 2% 1% Total 99%= 100% 100% 102%= Q38C. The police 7/97 6/99 1-2/00 A great deal 4% 4% 7% 6% Fair amount 17% 18% 19% 16% Not very much 32% 31% 27% 32% None at all 42% 36% 34% 40% Don t know 5% 10% 11% 7% No answer 1% 2% 1% 100% 100% 102%=
78 International Foundation for Election Systems == rounding error = less than 0.5% A1-22 Section 4: Support for Civic Organizations On this card you see a list of some rights many people elieve are important. How important is it to you that the following rights e respected in Ukraine? Is it very important, somewhat important, not very important, or not important at all. Q39A. One can choose from several parties and candidates when voting 7/97 6/99 1-2/00 Very important 38% 39% 46% 36% Somewhat important 28% 38% 36% 32% Not very important 17% 12% 9% 18% Not at all important 10% 4% 3% 8% Don t know 6% 5% 6% 5% 1% 1% 1% 99%= 101%= 100% Q39B. Honest elections are held regularly 7/97 6/99 1-2/00 Very important 65% 50% 59% 54% Somewhat important 22% 34% 29% 29% Not very important 7% 6% 4% 6% Not at all important 3% 2% 2% 4% Don t know 3% 6% 6% 5% 1% 1% 1% Total 101%= 99%= 101%= 99%= Q39C. The rights of minority ethnic groups are protected 7/97 6/99 1-2/00 Very important 39% 36% 44% 41% Somewhat important 29% 39% 30% 33% Not very important 16% 11% 13% 13% Not at all important 8% 4% 3% 5% Don t know 7% 9% 9% 7% 1% 1% 1% 100% 100% 100%
79 International Foundation for Election Systems == rounding error = less than 0.5% A1-23 Q39D. The private property of individuals is protected y law 7/97 6/99 1-2/00 Very important 77% 55% 62% 65% Somewhat important 16% 32% 25% 24% Not very important 2% 5% 4% 5% Not at all important 2% 2% 2% 2% Don t know 3% 6% 7% 3% 1% 1% 1% Total 101%= 101%= 101%= 100% Q39E. Citizens have the right to form political parties 7/97 6/99 1-2/00 Very important 22% 22% 24% 21% Somewhat important 24% 28% 26% 28% Not very important 29% 30% 26% 30% Not at all important 16% 11% 13% 14% Don t know 8% 7% 11% 7% 1% 1% 1% 100% 101%= 101%= Q39F. The right to pulicly criticize the government is protected 7/97 6/99 1-2/00 Very important 58% 35% 39% 37% Somewhat important 26% 32% 28% 34% Not very important 9% 18% 14% 15% Not at all important 3% 6% 7% 7% Don t know 4% 8% 10% 6% 1% 1% 1% Total 101%= 100% 99%= 100% Q39G. All can freely practice the religion of one s choice 7/97 6/99 1-2/00 Very important 60% 46% 56% 54% Somewhat important 26% 38% 28% 29% Not very important 9% 9% 8% 9% Not at all important 3% 2% 3% 4% Don t know 2% 3% 4% 3% No answer 1% 1% 100% 100% 99%=
80 International Foundation for Election Systems == rounding error = less than 0.5% A1-24 Q39H. All can form associations or unions without any government involvement 7/97 6/99 1-2/00 Very important 23% 23% 25% 25% Somewhat important 27% 28% 21% 27% Not very important 26% 26% 24% 25% Not at all important 14% 11% 13% 12% Don t know 10% 11% 16% 11% 1% 1% 1% Total 101%= 100% 100% 101%= Q40. In your opinion, do citizens of Ukraine have the possiility to unite into groups or form associations without the participation of government or not? 7/97 6/99 1-2/00 Yes 60% 55% 51% 59% No 17% 10% 18% 22% Depends 6% 16% 6% -- Other 1% Don t know 16% 17% 23% 18% No answer 2% 1% 1% Total 99%= 100% 99%= 101%= Q41. How necessary are these non-governmental organizations, or NGOs-- essential, very necessary, not very necessary, or not at all necessary? 7/97 6/99 1-2/00 Essential 9% 12% 8% 13% Very necessary 23% 11% 13% 22% Not very necessary 33% 39% 26% 34% Not at all necessary 12% 11% 16% 9% Depends 8% 3% 9% -- Don t know 14% 21% 26% 22% 2% 2% 1% 99%= 100% 101%=
81 International Foundation for Election Systems == rounding error = less than 0.5% A1-25 Q42. Do you elieve that non-governmental pulic organizations, NGOs, can deliver some social services more effectively than state organizations? Yes 37% No 26% Don t know 37% Total 101%= Q43. What reasons do you have for this opinion? Have no resources 8% They work more effectively, with 8% enthusiasm Less corrupt/more independent 8% Lack of faith in NGOs 7% Closer to the people 5% Positive personal experience with 5% NGOs Have no power 5% General lack of elief in positive 3% change Other 1% Don t know 50% No answer 4% Q44. Today, some non-governmental pulic organizations, NGOs, are making contracts with governments to deliver pulic services in some cities and villages. These arrangements are called Social Partnerships. Do you know of any social partnerships of this type? Yes 9% No 82% Don t know 9% Total 101%=
82 International Foundation for Election Systems == rounding error = less than 0.5% A1-26 Q45. Would you give your time to work for a non-governmental organization without eing paid definitely yes, proaly yes, proaly no, or definitely no? 7/97 6/99 Definitely yes 15% 5% 8% Proaly yes 26% 20% 31% Proaly no 10% 14% 12% Definitely no 9% 41% 39% Depends 4% 14% Don t know 4% 5% 9% No answer 32% 1% 1% 100% 100% Q46. Please look at this list of voluntary organizations and activities. On the ottom are some possile answers for the first question. How much trust do you have in the activities of these groups. Do you have much trust, some trust, little trust, or no trust at all in the activities of Q46A-1. Social welfare services for elderly, handicapped or deprived people Much trust 25% Some trust 36% Little trust 25% No trust at all 8% Don t know 6% Total 101%= Q46A-2. Religious or church organizations Much trust 23% Some trust 34% Little trust 20% No trust at all 14% Don t know 9% Total 101%=
83 International Foundation for Election Systems == rounding error = less than 0.5% A1-27 Q46A-3. Education, arts, music or cultural activities Much trust 16% Some trust 34% Little trust 22% No trust at all 7% Don t know 20% Q46A-4. Trade unions Much trust 10% Some trust 25% Little trust 31% No trust at all 21% Don t know 12% Q46A-5. Local community action on issues like poverty, employment, housing Much trust 14% Some trust 23% Little trust 28% No trust at all 17% Don t know 17% No answer 2% Total 101%= Q46A-6. Human rights Much trust 18% Some trust 28% Little trust 26% No trust at all 14% Don t know 13%
84 International Foundation for Election Systems == rounding error = less than 0.5% A1-28 Q46A-7. Conservation of the environment Much trust 19% Some trust 33% Little trust 26% No trust at all 10% Don t know 13% Total 102%= Q46A-8. Professional associations Much trust 12% Some trust 27% Little trust 25% No trust at all 12% Don t know 24% Total 101%= Q46A-9. Children and youth associations Much trust 16% Some trust 32% Little trust 22% No trust at all 6% Don t know 23% Q46A-10. Sports or recreation Much trust 17% Some trust 30% Little trust 20% No trust at all 8% Don t know 24%
85 International Foundation for Election Systems == rounding error = less than 0.5% A1-29 Q46A-11. Women s groups Much trust 17% Some trust 29% Little trust 21% No trust at all 7% Don t know 25% Q46A-12. Health organizations Much trust 15% Some trust 25% Little trust 27% No trust at all 16% Don t know 16% Q46A-13. Recreation (union of hunting, fishing) Much trust 14% Some trust 22% Little trust 19% No trust at all 10% Don t know 34% No answer 2% Total 101%= Q46A-14. NGO for Chernoyl disaster Much trust 20% Some trust 35% Little trust 20% No trust at all 7% Don t know 16% Total 99%=
86 International Foundation for Election Systems == rounding error = less than 0.5% A1-30 Q46A-15. Veterans associations Much trust 26% Some trust 37% Little trust 17% No trust at all 6% Don t know 14% Total 101%= Q46A-16. Veterans of Afghan war Much trust 25% Some trust 35% Little trust 16% No trust at all 6% Don t know 16% No answer 2% Q46B. Please look again at the list of organizations. Which, if any, do you elong to? Social welfare services for elderly, 1% handicapped or deprived people Religious or church organizations 3% Education, arts, music or cultural activities 1% Trade unions 12% Local community action on issues like poverty, employment, housing Human rights Conservation of the environment Professional organizations 1% Children s or youth association Sports or recreation 1% Women s organization Health organization Recreation (Union of hunting, fishing) 1% NGO for Chernoyl disaster 1% Veterans associations 1% Veterans of Afghan war Other None 79% Don t know No answer
87 International Foundation for Election Systems == rounding error = less than 0.5% A1-31 Q46C. Which, if any, are you currently doing unpaid voluntary work for? Social welfare services for elderly, handicapped or deprived people Religious or church organizations 1% Education, arts, music or cultural activities 1% Trade unions 1% Local community action on issues like poverty, employment, housing Human rights Conservation of the environment Professional organizations 1% Children s or youth association Sports or recreation Women s organization Health organization Recreation (Union of hunting, fishing) NGO for Chernoyl disaster Veterans associations Veterans of Afghan war Other None 95% Don t know No answer Q46D. Which of these organizations do you or have you paid memership fees to? Social welfare services for elderly, 1% handicapped or deprived people Religious or church organizations 2% Education, arts, music or cultural activities Trade unions 22% Local community action on issues like poverty, employment, housing Human rights Conservation of the environment 1% Professional organizations 1% Children s or youth association 1% Sports or recreation Women s organization Health organization 1% Recreation (Union of hunting, fishing) 1% NGO for Chernoyl disaster Veterans associations Veterans of Afghan war Other 1% None 74% Don t know No answer
88 International Foundation for Election Systems == rounding error = less than 0.5% A1-32 Q46E. Which of these that you are not involved in would you e the most willing to volunteer time for if you were ale to? Social welfare services for elderly, 7% handicapped or deprived people Religious or church organizations 3% Education, arts, music or cultural activities 2% Trade unions 2% Local community action on issues like 3% poverty, employment, housing Human rights 5% Conservation of the environment 2% Professional organizations 1% Children s or youth association 2% Sports or recreation 2% Women s organization 4% Health organization 3% Recreation (Union of hunting, fishing) 1% NGO for Chernoyl disaster 1% Veterans associations 1% Veterans of Afghan war 1% Other 1% None 67% Don t know No answer
89 International Foundation for Election Systems == rounding error = less than 0.5% A1-33 Q46F. Which of these, if any, have you gone to efore to help you solve a prolem? Social welfare services for elderly, 2% handicapped or deprived people Religious or church organizations 1% Education, arts, music or cultural activities Trade unions 7% Local community action on issues like 1% poverty, employment, housing Human rights 1% Conservation of the environment Professional organizations Children s or youth association Sports or recreation Women s organization Health organization Recreation (Union of hunting, fishing) NGO for Chernoyl disaster 1% Veterans associations 1% Veterans of Afghan war Other None 85% Don t know No answer Q46G. [IF THEY MENTION A NGO CATEGORY, CONTINUE] Was the organization capale of solving your prolem? (228) Yes 73% No 24% Don t know 2% Q47. Are you a memer of any political party? 6/99 Yes 1% 2% No 98% 96% Don t know 1% No answer 2% 100%
90 International Foundation for Election Systems == rounding error = less than 0.5% A1-34 Q48. [IF Q47 = NO] What reason would e important enough for you to join a political party? Have no reason 32% Real activities, positive results 8% To help ordinary people 5% To improve personal material condition 2% If party represents my outlook and 2% opinions Worthy leadership 2% Realistic and positive program 2% Other 3% Do not know 35% No answer 8% Total 99%= Q49. Do you elieve that political parties are necessary for Ukrainian democracy or not? 9 7/97 5/98 6/99 1-2/00 Yes, necessary for 58% 46% 56% 56% 62% democracy No, not necessary 28% 40% 29% 32% 18% for democracy Other % Don t know 14% 13% 15% 11% 16% No answer 1% 1% 1% 100% 101%= 99%= 100% Q50. How important do you think it is for Ukraine to have at least two political parties competing in an election not at all important, not very important, fairly important, or very important? 7/97 5/98 6/99 1-2/00 Very important 26% 23% 21% 34% 21% Somewhat important 31% 35% 40% 34% 44% Not very important 15% 16% 16% 13% 18% Not at all important 13% 14% 9% 8% 9% Don t know 14% 11% 12% 10% 9% 2% 1% 1% 99%= 100% 100% 102%= 9 For surveys conducted etween July 1997 and Feruary 2000, respondents were given the following options as a response: Necessary, Strongly; Necessary, Not Strongly; Not Necessary, Not Strongly; and Not Necessary, Strongly. Necessary, Strongly and Necessary, Not Strongly have een comined and included under the response yes, necessary for democracy. Similarly, Not Necessary, Not Strongly and Not Necessary, Strongly have een comined and included under the response no, not necessary for democracy.
91 International Foundation for Election Systems == rounding error = less than 0.5% A1-35 Q51. Do you find that there are clear differences etween the various political parties and locs in how they plan to solve prolems facing Ukraine? 7/97 5/98 6/99 Yes, clear differences 31% 41% 40% 30% No, not clear differences 49% 39% 37% 51% Other % Don t know 19% 19% 21% 16% No answer 1% 1% 1% Total 99%= 100% 99%= 99%= Q52. Please look at this list of kinds of actions that people sometimes take to make their own views pulicly known and to influence others. For each, please tell me whether you approve or disapprove of this activity, in general: Q52A. Signing a petition Approve 57% Somewhat approve/somewhat disapprove 28% Disapprove 11% Don t know 3% No answer Total 99%= Q52B. Joining in a oycott Approve 24% Somewhat approve/somewhat disapprove 31% Disapprove 39% Don t know 5% Q52C. Attending a protest demonstration or rally Approve 42% Somewhat approve/somewhat disapprove 33% Disapprove 20% Don t know 4%
92 International Foundation for Election Systems == rounding error = less than 0.5% A1-36 Q52D. Attending a pulic meeting Approve 48% Somewhat approve/somewhat disapprove 29% Disapprove 17% Don t know 5% Q52E. Joining in an unofficial strike Approve 15% Somewhat approve/somewhat disapprove 28% Disapprove 50% Don t know 6% Q52F. Blocking traffic Approve 10% Somewhat approve/somewhat disapprove 19% Disapprove 67% Don t know 4% No answer Q52G. Writing to a newspaper Approve 60% Somewhat approve/somewhat disapprove 25% Disapprove 12% Don t know 3% Total 101%=
93 International Foundation for Election Systems == rounding error = less than 0.5% A1-37 Q52H. Contacting a politician Approve 47% Somewhat approve/somewhat disapprove 27% Disapprove 20% Don t know 5% Q52I. Refusing to pay rent, rates, or taxes Approve 12% Somewhat approve/somewhat disapprove 25% Disapprove 57% Don t know 5% Q52J. Occupying a uilding or property in protest Approve 5% Somewhat approve/somewhat disapprove 10% Disapprove 80% Don t know 5% Total 101%= Q52K. Joining a group involved pulicly active on an issue you elieve in Approve 33% Somewhat approve/somewhat disapprove 32% Disapprove 23% Don t know 12% Total 101%=
94 International Foundation for Election Systems == rounding error = less than 0.5% A1-38 Section 5: General Social and Political Attitudes Here is a list with possile answers for the next questions. How much do you agree or disagree with the following statements: Q53. Voting gives people like you a chance to influence decision-making in our country. 7/97 5/98 6/99 1-2/00 Strongly agree 7% 5% 11% 17% 13% Somewhat agree 21% 20% 24% 23% 21% Somewhat disagree 17% 26% 29% 25% 29% Strongly disagree 50% 33% 29% 27% 33% Neither agree nor 2% 9% 2% 1% -- disagree Don t know 4% 6% 5% 6% 4% No answer 1% 1% Total 101%= 100% 100% 100% 100% Q54. Sometimes politics is so complicated that people like you can t understand what s really happening. 6/99 1-2/00 Strongly agree 34% 36% 44% Somewhat agree 29% 34% 32% Somewhat disagree 19% 15% 14% Strongly disagree 11% 8% 6% Neither agree nor disagree 1% 1% -- Don t know 4% 5% 4% 1% 1% Total 99%= 100% 101%= Q55. People like you have little or no influence on the way things are run in Ukraine. 6/99 1-2/00 Strongly agree 44% 46% 52% Somewhat agree 27% 27% 28% Somewhat disagree 14% 15% 11% Strongly disagree 9% 6% 5% Neither agree nor disagree 1% -- Don t know 4% 4% 3% 1% 1% 99%= 100%
95 International Foundation for Election Systems == rounding error = less than 0.5% A1-39 Q56. How interested are you in matters of politics and government -- are you very interested, somewhat interested, not too interested, or not at all interested? 7/97 5/98 6/99 1-2/00 Very interested 16% 14% 13% 15% 18% Somewhat interested 39% 36% 30% 35% 47% Not too interested 23% 23% 35% 30% 23% Not at all interested 20% 25% 21% 18% 11% Don t know 1% 2% 1% 1% 1% No answer 100% 100% 100% 100% Q57. In general, would you say that political reforms in Ukraine are occurring too quickly, too slowly, or at the right pace? 7/97 5/98 6/99 1-2/00 Too quickly 7% 13% 5% 6% 6% Too slowly 56% 45% 43% 38% 52% At the right pace 9% 8% 6% 9% 5% Reforms not 26% 21% 20% happening Reforms are late % -- Don t know 27% 31% 19% 22% 16% 4% 2% 1% 1% 101%= 101%= 100% 100% Q58. Is Ukraine a democracy? 7/97 5/98 6/99 1-2/00 Yes 20% 19% 17% 31% 22% No 52% 55% 58% 50% 59% Other 8% 9% 10% 6% 2% Don t know 20% 15% 14% 12% 16% 1% 1% 1% Total 101%= 99%= 100% 99%= 100%
96 International Foundation for Election Systems == rounding error = less than 0.5% A1-40 Q59. [IF Q58 = NO, OTHER, DON T KNOW, NO ANSWER] Is Ukraine moving toward ecoming a democracy or not? 7/97 5/98 6/99 1-2/00 Moving toward ecoming 24% 22% 20% 35% 23% a democracy Not moving toward 37% 36% 38% 38% 51% ecoming a democracy Don t know 19% 22% 25% 26% 25% 1% 1% 1% 1% Total 101%= 100% 101%= 100% 100% Q60. What does the term democracy mean to you? Freedom of opinion 24% Freedom (no specific mentions) 11% Material prosperity (without mention of 11% social welfare) Human rights 10% Rule of law 9% Power of the people 9% Equality in all efore the law 7% Social welfare 5% Free elections, free political choice 4% Freedom of press 4% Pulic access to power/aility to 3% influence Freedom of religion 2% Justice 2% National sovereignty 2% Other 3% Don t know 23% No answer 3% Q61. How likely is it that you will vote in the 2002 elections for the Supreme Rada? Is it very likely, somewhat likely, somewhat unlikely, or very unlikely that you will vote in the next elections? Very likely 46% Somewhat likely 29% Somewhat unlikely 10% Very unlikely 9% Don t know 6% Total 101%=
97 International Foundation for Election Systems == rounding error = less than 0.5% A1-41 Q62. Which political party do you think est represents your views and interests? Agrarian Party of Ukraine (M.Hladii) Communist Party of Ukraine (P.Symonenko) 18% People's Rukh of Ukraine (G.Udovenko) 5% People's Democratic Party of Ukraine 5% (V.Pustovoitenko) Party of Greens (V.Kononov) 3% Progressive Socialist Party of Ukraine 2% (N.Vitrenko) Selyanska Party of Ukraine (A.Tkachenko) 1% Social Democratic Party of Ukraine 4% (United) (V.Medvedchuk, G.Surkis) Socialist Party of Ukraine (A.Moros) 4% Ukrainian People's Rukh (Yu.Kostenko) 1% Party of Industrialists and Entrepreneurs of 1% Ukraine (A.Kinakh) Party "Democratic Union" (A.Volkov) 1% All-Ukrainian Association "Batkyivstchyna 1% (Yu.Timoshenko) Congress of Ukrainian Nationalists (Ya.Stetsko) Political Party "Young Ukraine" 1% Party "Reforms and Order" (V. Pinzenyk) 2% Laour Ukraine (S. Tigipko) 2% Christian Democratic Party of Ukraine 1% (V.Zhuravsky ) Other 1% No one 31% Don t know 15%
98 International Foundation for Election Systems == rounding error = less than 0.5% A1-42 Q63. What are the most important issues to you that you expect your elected officials to work on when they are elected? Raise in standard of living 30% Economic development 16% Resolve unemployment/ underemployment 15% Jo security/creation of work 10% Free access to pulic service (medical, education) 10% Law and order 8% Better pensions 6% Eliminate crime and corruption 5% Payment of wage and pension arrears 4% Decreased fees for community services 3% Lowering of prices 3% Agricultural reform 2% Other 4% Don t know 18% No answer 3% Q64. How likely is it that the 2002 elections for Supreme Rada will e free and fair: very likely, somewhat likely, not very likely, or not likely at all? Very likely 2% Somewhat likely 15% Somewhat unlikely 50% Very unlikely 21% Don t know 11% Please tell me do you strongly agree, somewhat agree, somewhat disagree, or strongly disagree with the following questions. Q65. If I were wrongly accused of a crime, I am sure that our judicial system would acquit me. Strongly agree 4% Somewhat agree 17% Somewhat disagree 33% Strongly disagree 34% Don t know 12% No answer
99 International Foundation for Election Systems == rounding error = less than 0.5% A1-43 Q66. In the free market economy, uyers need to rely on themselves and not expect the government to protect them in transactions. Strongly agree 27% Somewhat agree 26% Somewhat disagree 22% Strongly disagree 18% Don t know 7% No answer Q67. A little it of cheating is a normal part of all usiness activity. Strongly agree 18% Somewhat agree 22% Somewhat disagree 25% Strongly disagree 27% Don t know 8% Total 101%= Q68. In your opinion, how common is the prolem of official corruption? 7/97 6/99 1-2/00 Very common 67% 62% 62% 75% Somewhat common 22% 26% 26% 18% Not very common 2% 2% 2% 2% Not common at all Don t know 8% 8% 9% 5% No answer 1% 1% 1% Total 99%= 99%= 100% 101%= Q69. And how serious is the prolem of official corruption -- is it very serious, fairly serious, not too serious, or not serious at all? 7/97 6/99 1-2/00 Very serious 72% 69% 67% 81% Somewhat serious 18% 21% 23% 15% Not too serious 1% 2% 1% 1% Not serious at all 1% Don t know 8% 7% 8% 3% No answer 1% 1% 100% 100% 100%
100 International Foundation for Election Systems == rounding error = less than 0.5% A1-44 Q70. Do you think the citizens of Ukraine accept official corruption as a fact of life? 6/99 1-2/00 Yes 62% 56% 58% No 13% 22% 25% Don t know 22% 21% 16% No answer 2% 2% 1% Total 99%= 101%= 100% Q71. And to what extent does this contriute to the prolem of state (official) corruption: Very much, somewhat, not very much, not at all? 6/99 1-2/00 (876) Very much 37% 63% 55% Somewhat 13% 16% 20% Not very much 4% 7% 7% Not at all 3% 4% 12% Don t know 5% 9% 5% No answer 38% 99%= 99%= Q72A. Next, I will read you a list of actions people sometimes do. Please tell me for each, whether the action can always e justified, sometimes e justified, or never e justified. These answers are listed on your card. Q72A-1. Claiming government enefits which you are not entitled to Always e justified 6% Sometimes e justified 27% Never e justified 60% Don t know 6% Q72A-2. Cheating on tax if you had the chance Always e justified 8% Sometimes e justified 38% Never e justified 48% Don t know 6% Total 101%=
101 International Foundation for Election Systems == rounding error = less than 0.5% A1-45 Q72A-3. Someone taking a rie in the course of their duties Always e justified 4% Sometimes e justified 12% Never e justified 79% Don t know 4% Q72A-4. Accepting money to voter for a politician or political party Always e justified 3% Sometimes e justified 9% Never e justified 80% Don t know 6% Total 99%= Q72A-5. Officials taking money for entrepreneurs for approving usinesses quickly Always e justified 4% Sometimes e justified 13% Never e justified 74% Don t know 8% Q72A-6. High officials enefiting from the privatization of Ukrainian pulic industries Always e justified 3% Sometimes e justified 5% Never e justified 86% Don t know 5%
102 International Foundation for Election Systems == rounding error = less than 0.5% A1-46 Q72A-7. High officials helping their associates in private usiness Always e justified 4% Sometimes e justified 16% Never e justified 72% Don t know 7% Q72A-8. The use of pulic funds for the personal enefit of officials Always e justified 3% Sometimes e justified 4% Never e justified 89% Don t know 3% Q72B. Q72B-1. Now, I will read the list to you again. For each, tell me if this activity occurs often here in Ukraine. Please use the answers listed on your card. Does [READ FROM LIST] happen very often, sometimes, not very often, or never at all. Claiming government enefits which you are not entitled to Happen very often 50% Sometimes 27% Not very often 9% Never at all 3% Don t know 10% Q72B-2. Cheating on tax if you had the chance Happen very often 63% Sometimes 24% Not very often 5% Never at all 2% Don t know 6% Total 101%=
103 International Foundation for Election Systems == rounding error = less than 0.5% A1-47 Q72B-3. Someone taking a rie in the course of their duties Happen very often 77% Sometimes 14% Not very often 3% Never at all 1% Don t know 4% Q72B-4. Accepting money to vote for a politician or political party Happen very often 46% Sometimes 26% Not very often 10% Never at all 2% Don t know 17% Total 102%= Q72B-5. Officials taking money from entrepreneurs to approve usinesses quickly Happen very often 64% Sometimes 20% Not very often 4% Never at all 1% Don t know 11% Total 101%= Q72B-6. High officials enefiting from the privatization of Ukrainian pulic industries Happen very often 71% Sometimes 15% Not very often 3% Never at all Don t know 10%
104 International Foundation for Election Systems == rounding error = less than 0.5% A1-48 Q72B-7. High officials helping their associates in private usiness Happen very often 72% Sometimes 16% Not very often 2% Never at all Don t know 8% Total 99%= Q72B-8. The use of pulic funds for the personal enefit of officials Happen very often 78% Sometimes 13% Not very often 3% Never at all Don t know 5% Q73. Are you generally satisfied or dissatisfied with the situation in Ukraine today? 7/97 5/98 6/99 1-2/00 Generally satisfied 1% Somewhat satisfied 2% 3% 2% 5% 4% Somewhat dissatisfied 21% 28% 29% 36% 33% Generally dissatisfied 75% 68% 65% 56% 59% Don t know 2% 1% 2% 2% 2% No answer 1% 100% 98%= 99%= 100% Q74. Here you see a picture with a scale of one to five where one means a pure market economy and five means an economy that is completely centrally planned y the state. Where on that scale should Ukraine e located in the future? 7/97 5/98 6/99 1-2/00 1 (Pure market economy) 11% 9% 9% 9% 14% 2 14% 10% 11% 19% 18% 3 224% 23% 26% 33% 32% 4 12% 12% 15% 12% 13% 5 (Centrally planned) 22% 26% 22% 14% 14% Don t know 14% 18% 16% 13% 10% No answer 2% 2% 1% 1% Total 99%= 100% 100% 101%= 101%
105 International Foundation for Election Systems == rounding error = less than 0.5% A1-49 Q75. In your opinion will the economic situation in Ukraine in a year e etter than it is now, remain the same, or get worse? 7/97 5/98 6/99 1-2/00 Better than now 12% 10% 7% 16% 13% Remain the same 34% 38% 35% 35% 35% Get worse 45% 40% 44% 36% 41% Don t know 8% 11% 14% 13% 12% No answer Total 99%= 99%= 100% 100% 101%= Q76. Thinking only of the Executive Branch, the Supreme Rada, the judiciary, and your local government. Which of these four, in your opinion, is most likely to resolve the economic prolems FACING UKRAINE in the next year? 7/97 5/98 6/99 1-2/00 Executive ranch 19% 17% 26% -- 23% --Presidency % -- --Cainet of Ministers % -- Supreme Rada 18% 21% 19% 5% 19% Judiciary 13% 5% 3% 1% 4% Local government 2% 16% 11% 4% 8% All 15% -- None 24% 23% 18% 18% 25% Don t know 22% 17% 22% 13% 20% No answer 2% 1% 99%= 99%= 99%= 99%= Q77. In your opinion, how important are foreign investments to the economic recovery of our country? Are foreign investments very important, somewhat important, somewhat unimportant, or not important at all to the economic recovery of Ukraine? 7/97 6/99 1-2/00 Very important 26% 18% 17% 20% Somewhat important 29% 25% 28% 32% Somewhat unimportant 12% 17% 17% 17% Not important at all 18% 23% 23% 18% Don t know 15% 16% 16% 13% 1% 1% 1% Total 101%= 100% 100% 101%=
106 International Foundation for Election Systems == rounding error = less than 0.5% A1-50 Q78. How much do you agree or disagree with the following statement: Ukraine s est hopes for the future lie with joining to Europe and the European Union. Do you strongly agree, somewhat agree, somewhat disagree, or strongly disagree with this statement? Strongly agree 20% Somewhat agree 33% Somewhat disagree 16% Strongly disagree 10% Don t know 20% Section 6: Respondent Background We have only a few more questions aout yourself that we need to etter understand your answers. Q79. Sex of Respondent Male 45% Female 55% Q80. Age % % % % % Total 101%= Q81. What is the highest level of education you received? Primary 6% Incomplete secondary 13% Secondary complete 28% Secondary + specialized vocational 31% training University degree incomplete 4% University degree completed 18% Advance degree (eyond university degree) No answer 100%
107 International Foundation for Election Systems == rounding error = less than 0.5% A1-51 Q82. What is your employment situation? Employed Full-time at One Jo 34% Employed Part-time at One Jo 7% Employed at More than One Part-time 1% Jo Student 3% Pensioner 33% Not Employed 15% Homemaker 6% Other 1% Don t know No answer Q83. What is your field of employment? Intellectual Worker-Teacher, 3% Journalist, Writer Executive or Professional at Seniorlevel 5% (Government or Private) Executive or Professional at Mid-level 7% (Government or Private) Skilled Laorer 17% Unskilled Laorer 5% Soldier, in Military Service 1% Farmer 1% Other 3% Don t know 58% No answer Q84a. Occupation-State Sector Industrial productions 23% Construction 6% Transportation, Communications 13% Culture and Nauka 13% Trade and Services 11% Agriculture 6% Security Defense 7% Other 20% Total 99%=
108 International Foundation for Election Systems == rounding error = less than 0.5% A1-52 Q84. Occupation-Private Sector Industrial productions 17% Construction 9% Transportation, Communications 12% Culture and Nauka 1% Trade and Services 42% Agriculture 12% Security Defense 1% Other 7% Total 101%= Q85. Are you currently owed any ack wages or pension payments from your employer or the government? Yes 21% No 68% Don t know 2% No answer 9% Q86. [IF Q85 = YES] For how long a period are you owed ack payments? One Month or Less 28% Two Months 26% Three Months 14% Four Months 4% Five Months 3% Six Months 5% More than Six Months 18% Don t know 2% No answer 2% Total 102%= Q87. What is your marital status? Married 61% Single/Never Married 14% Divorced/Separated 9% Widowed 15%
109 International Foundation for Election Systems == rounding error = less than 0.5% A1-53 Q88. How many people are in your family, who live with you and keep one household (including you)? 1 15% 2 27% 3 25% 4 19% 5 10% 6 4% 7 1% 8 9+ Total 101%= Q89. What is your nationality? Please pick the appropriate category from this list. Ukrainian 75% Russian 20% Ukrainian and Russian 1% Crimean Tatar Polish 1% Hungarian Bulgarian Gipsy Jewish Byelorussian 1% Moldovan 1% Other 1% No answer Q90A. What is the main language you speak in your home? Ukrainian 46% Russian 40% Ukrainian and Russian, oth 13% Other 1% No answer Q90B. Do you support the principle that in the future, Ukraine should e mainly Ukrainian speaking? Yes 44% No 40% Somewhat support/somewhat against 15% Don t know 1% No answer
110 International Foundation for Election Systems == rounding error = less than 0.5% A1-54 Q90C. In your opinion, should the Ukrainian government now spend tax money to provide opportunities for secondary education oth in Russian and Ukrainian? Yes 65% No 15% Somewhat yes/somewhat no 14% Don t know 6% Total 101%= Q91. With which church or religious group do you identify yourself? Ukrainian Orthodox 36% Other Ukrainian Orthodox 2% (Autocephalna) Russian Orthodox 7% Orthodox Christianity 17% Roman Catholic 1% Greek Catholic 6% Protestant 1% Muslim 1% Jewish Other 3% None 25% Q92. How often do you attend religious services? Daily Multiple times weekly 2% Weekly 5% A few times a month 8% A few times each year 25% Once a year or less 11% Depends 13% Don't attend 34% Don t know 1%
111 International Foundation for Election Systems == rounding error = less than 0.5% A1-55 Q93. Which numer est descries the current financial situation of you and your family living there with you? Very poor, we do not have enough 24% money for our most asic needs Poor, we arely have enough money to 29% uy food, we rarely uy clothes Modest, we have enough to eat, we 36% occasionally uy clothes, ut we have nothing left over to save Moderate, we have some savings 10% Aove average, we have savings, and can afford a lot Q94. In your opinion, how much do most people in Ukraine rely on the shadow economy for their livelihood? A great deal 30% A fair amount 34% Not very much 11% Not at all 5% Don t know 20% No answer Q95. Have you ever used the INTERNET efore? [IF YES] How often and where do you use INTERNET? Don't know what it is 24% Never used it 69% Sometimes use it at work/school 4% Sometimes use it at home Often use it at work/school 2% Often use it at home
112 International Foundation for Election Systems A2-1 Appendix 2. The Trend Data Set IFES has conducted national surveys of pulic opinion in Ukraine since This report seeks to integrate as much of the data as possile in order to maintain and clarify the trend in responses over time. To do so, we examined repeating core questions for their similarities and differences from survey to survey: 1. January May July June June January Decemer 2000 Tale App.2.1 maps the IFES Decemer 2000 variales to the Trend Data Set. Tale App Variale Map: IFES Decemer 2000 and Trend Data Set Trend Data Variale Lael Var. Name Decemer 2000 Variale Lael Var. Name Church Church Religion Q91 NGO Memership NGO Constructed From NGO List Q46 Interest In Politics T1 Interest In Politics Q56 Foreign Investment T10 Importance Foreign Invest Q77 Pace Political Reforms T11 Speed Reforms Q57 Ukraine Democracy T12 Ukraine Democracy Q58 Becoming Democracy T13 Movement to Democracy Q59 Vote Efficacy T14 Voting Gives Influence Q53 Understand Politics T15 Politics Too Complicated Q54 Influence Politics T16 No Influence Q55 Parties Necessary T17 Parties Necessary Q49 Importance of Two Parties T18 Two Parties Important Q50 Clear Differences T19 Parties Different Q51 Satisfaction T2 Satisfaction w/ Situation Q73 Form NGOs T22 Possiility of Association Q40 NGO Necessary T23 Ngos NECESSARY Q41 Volunteer T24 Volunteer NGO Q45 Choice Parties T25 Importance: Choice of Parties Q39A Honest Elections T26 Importance: Honest Elections Q39B Minority Rights T27 Importance: Minority Rights Q39C Private Property T28 Importance: Private Property Q39D Right to Form Parties T29 Importance: Free to Form Parties Q39E Right to Criticize T30 Importance: Free Speech Q39F Freedom of Religion T31 Importance: Freedom Religion Q39G Form Associations T32 Importance: Freedom Association Q39H Supreme Rada T33 Confidence: Supreme Rada Q37A Cainet of Ministers T34_exe Confidence: Council of Ministers Q37B Presidential Administration T35 Confidence: Presidental Administration Q37C Local Government T36 Confidence: Local Government Q37E Central Bank T37 Confidence: National Bank Q37G Military T38 Confidence: Military Q37H Judicial Branch T39 Confidence: Constitutional Court Q37I State Security Service T40 Confidence: State Security Q37J President Kuchma T41 Confidence: Leonid Kuchma Q37K
113 International Foundation for Election Systems A2-2 Tale App Variale Map: IFES Decemer 2000 and Trend Data Set (continued) Trend Data Variale Lael Var. Name Decemer 2000 Variale Lael Var. Name Courts T42 Confidence: Courts Q38A Pulic Prosecutors T43 Confidence: Pulic Prosecutors Q38B Militia T44 Confidence: Police Q38C Common T45 Corruption Common Q68 Serious T46 Corruption Serious Q69 Fact of Life T47 Accept Corruption Q70 Contriute to Prolem T48 Contriute to Corruption Q71 Amount Political Info T49 Information on Politics Q13 Amount Economic Info T50 Information on Economics Q14 Shadow Economy T52 Shadow Economy Q94 Ideal Economy T6 Market Vs. Central Plan Q74 Economy One Year T8 National Economy One Year Q75 Resolve Econ Prolems T9 Resolve Economy Q76
114 International Foundation for Election Systems A3-1 Appendix 3. Regional Classifications Regional classifications are provided y SOCIS-Gallup ased upon their own research. The following classifications are used in this report: 1. The NORTHERN Region: Kyivs ka Zhytomyrs ka and Chernigivs ka olasts; 2. The CENTRAL Region: Vinnits ka, Kirovograds ka, Poltavs ka and Cherkas ka olasts; 3. The NORTHWESTERN Region: Volyns ka, Rivens ka and Khmelnits ka olasts; 4. The SOUTHWESTERN Region: Zakarpats ka and Chernivets ka olasts; 5. The WESTERN Region: Lvivs ka, Ivano-Frankivs ka and Ternopil ska olasts; 6. The NORTHEASTERN Region: Kharkivs ka and Sums ka olasts; 7. The EASTERN Region: Dnipropetrivs ka and Zaporiz ka olasts; 8. The SOUTHEASTERN Region: Donets ka and Lugans ka olasts; 9. The SOUTHERN Region: Odes ka, Mykolajivs ka and Khersons ka olasts; and 10. Autonomous Repulic of the Crimea. These regions are also grouped into roader classifications as follows: 1) west Ukraine, 2) east Ukraine and 3) an intermediate area in-etween the east and west. Regrouping the SOCIS regions provides the following: Tale App Regional Classifications Region West East Intermediate Total Kyiv Northern Central Northeastern Northwestern Southeastern Western Southwestern Southern Crimea Eastern Total The counts provided aove reflect the total numer of cases in the complete merged data set, , in each regional classification. This three-way classification is kept through many of the descriptive analyses. However, it ecame clear that data from respondents in the intermediate area followed the same pattern as those in the east. In regression analyses, the three-way classification is further reduced to a two-way classification, and the intermediate areas are grouped into the east. These regions are displayed on the map on the following page.
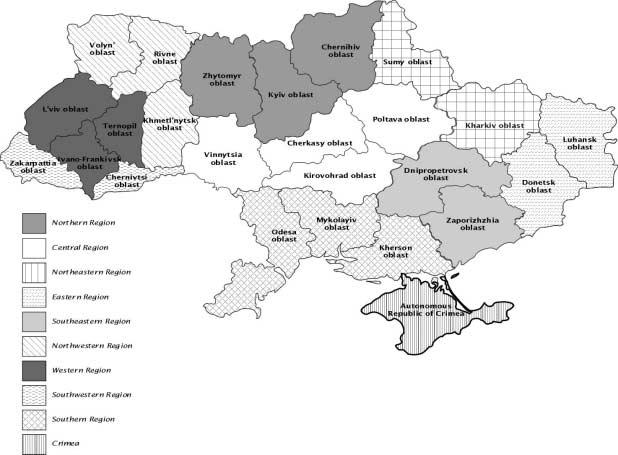
115
A Comparison of Capital Region Residents on Selected Aspects of Their Wellbeing
 Victoria Capital Region Community Welleing Survey: A Comparison of Capital Region Residents on Selected Aspects of Their Welleing A report for The Victoria Foundation and Capital Region District Keely
The most important results of the Civic Empowerment Index research of 2014 are summarized in the upcoming pages.
 SUMMARY In 2014, the Civic Empowerment Index research was carried out for the seventh time. It revealed that the Lithuanian civic power had come back to the level of 2008-2009 after a few years of a slight
ANNUAL SURVEY REPORT: BELARUS
 ANNUAL SURVEY REPORT: BELARUS 2 nd Wave (Spring 2017) OPEN Neighbourhood Communicating for a stronger partnership: connecting with citizens across the Eastern Neighbourhood June 2017 1/44 TABLE OF CONTENTS
ANNUAL SURVEY REPORT: ARMENIA
 ANNUAL SURVEY REPORT: ARMENIA 2 nd Wave (Spring 2017) OPEN Neighbourhood Communicating for a stronger partnership: connecting with citizens across the Eastern Neighbourhood June 2017 ANNUAL SURVEY REPORT,
ANNUAL SURVEY REPORT: REGIONAL OVERVIEW
 ANNUAL SURVEY REPORT: REGIONAL OVERVIEW 2nd Wave (Spring 2017) OPEN Neighbourhood Communicating for a stronger partnership: connecting with citizens across the Eastern Neighbourhood June 2017 TABLE OF
Youth, Democracy, and Politics: Hungary
 Youth, Democracy, and Politics: Hungary Survey results NDI Youth Research Project March 2018 In cooperation with Political Capital RESEARCH METHODOLOGY SAMPLE DESIGN The sample is statistically representative
Fieldwork: January 2007 Report: April 2007
 Flash Eurobarometer European Commission Entrepreneurship Survey of the EU ( Member States), United States, Iceland and Norway Summary Fieldwork: January 00 Report: April 00 Flash Eurobarometer The Gallup
Public Attitudes Survey Bulletin
 An Garda Síochána Public Attitudes Survey Bulletin 2017 Research conducted by This bulletin presents key findings from the first quarter of the Public Attitudes Survey conducted between January and March
Public Attitudes Survey Bulletin
 An Garda Síochána Public Attitudes Survey Bulletin 218 Research conducted by This bulletin presents high level findings from the second quarter of the Public Attitudes Survey conducted between April and
Public Opinion In Belarus 1999
 Public Opinion In Belarus 1999 A Publication in the VOICES OF THE ELECTORATE Series Larissa Titarenko, Ph.D. November 1999 Prepared for International Foundation for Election Systems 1101 15th Street, NW,
ANNUAL SURVEY REPORT: GEORGIA
 ANNUAL SURVEY REPORT: GEORGIA 2 nd Wave (Spring 2017) OPEN Neighbourhood Communicating for a stronger partnership: connecting with citizens across the Eastern Neighbourhood June 2017 TABLE OF CONTENTS
Attitudes towards the EU in the United Kingdom
 Flash Eurobarometer European Commission Attitudes towards the EU in the United Kingdom Analytical Report Fieldwork: January 200 Publication: May 200 Flash Eurobarometer 203 The Gallup Organization This
Public Attitudes Survey Bulletin
 An Garda Síochána Public Attitudes Survey Bulletin 218 Research conducted by This bulletin presents high level findings from the third quarter of the Public Attitudes Survey conducted between July and
Global Corruption Barometer 2010 New Zealand Results
 Global Corruption Barometer 2010 New Zealand Results Ben Krieble TINZ Summer Intern www.transparencynz.org.nz executive@transparency.org.nz Contents Executive Summary 3 Summary of global results 4 Summary
WISCONSIN ECONOMIC SCORECARD
 RESEARCH BRIEF Q4 2013 Joseph Cera, PhD CUIR Survey Center University of Wisconsin Milwaukee WISCONSIN ECONOMIC SCORECARD The Wisconsin Economic Scorecard is a quarterly poll of Wisconsin residents conducted
IFES PRE-ELECTION SURVEY IN NIGERIA 2014
 IFES PRE-ELECTION SURVEY IN NIGERIA 2014 January 2015 This publication was produced by IFES for the U.S. Agency for International Development concerning Cooperative Agreement Number AID-620-A-14-00002.
The European Emergency Number 112. Analytical report
 Flash Eurobarometer 314 The Gallup Organization Gallup 2 Flash Eurobarometer N o 189a EU communication and the citizens Flash Eurobarometer European Commission The European Emergency Number 112 Analytical
RECOMMENDED CITATION: Pew Research Center, May, 2015, Free Trade Agreements Seen as Good for U.S., But Concerns Persist
 NUMBERS, FACTS AND TRENDS SHAPING THE WORLD FOR RELEASE MAY 27, 2015 FOR FURTHER INFORMATION ON THIS REPORT: Carroll Doherty, Director of Political Research Jocelyn Kiley, Associate Director, Research
Report. Poverty and Economic Insecurity: Views from City Hall. Phyllis Furdell Michael Perry Tresa Undem. on The State of America s Cities
 Research on The State of America s Cities Poverty and Economic Insecurity: Views from City Hall Phyllis Furdell Michael Perry Tresa Undem For information on these and other research publications, contact:
ANNUAL SURVEY REPORT: AZERBAIJAN
 ANNUAL SURVEY REPORT: AZERBAIJAN 2 nd Wave (Spring 2017) OPEN Neighbourhood Communicating for a stronger partnership: connecting with citizens across the Eastern Neighbourhood June 2017 TABLE OF CONTENTS
Improving democracy in spite of political rhetoric
 WWW.AFROBAROMETER.ORG Improving democracy in spite of political rhetoric Findings from Afrobarometer Round 7 survey in Kenya At a glance Democratic preferences: A majority of Kenyans prefer democratic,
STUDY OF PRIVATE SECTOR PERCEPTIONS OF CORRUPTION
 STUDY OF PRIVATE SECTOR PERCEPTIONS OF CORRUPTION This sur vey is made possible by the generous suppor t of Global Af fairs Canada. The Asia Foundation and the Sant Maral Foundation have implemented the
Date Printed: 11/03/2008. JTS Box Number: IFES 4. Tab Number: Document Title: Document Date: Document Country: Global R01621 IFES ID:
 Date Printed: 11/03/2008 JTS Box Number: Tab Number: Document Title: Document Date: Document Country: IFES ID: IFES 4 28 Global Trends in Womens Access and Leadership: Data from five lfes Surveys 2000
THE 2004 NATIONAL SURVEY OF LATINOS: POLITICS AND CIVIC PARTICIPATION
 Summary and Chartpack Pew Hispanic Center/Kaiser Family Foundation THE 2004 NATIONAL SURVEY OF LATINOS: POLITICS AND CIVIC PARTICIPATION July 2004 Methodology The Pew Hispanic Center/Kaiser Family Foundation
Youth, Democracy, and Politics: Poland
 Youth, Democracy, and Politics: Poland Survey results NDI Youth Research Project March 2018 In cooperation with the Institute of Public Affairs (IPA) RESEARCH METHODOLOGY SAMPLE DESIGN The sample is statistically
Survey sample: 1,013 respondents Survey period: Commissioned by: Eesti Pank Estonia pst. 13, Tallinn Conducted by: Saar Poll
 Survey sample:,0 respondents Survey period:. - 8.. 00 Commissioned by: Eesti Pank Estonia pst., Tallinn 9 Conducted by: Saar Poll OÜ Veetorni, Tallinn 9 CHANGEOVER TO THE EURO / December 00 CONTENTS. Main
Changing Times, Changing Enrollments: How Recent Demographic Trends are Affecting Enrollments in Portland Public Schools
 Portland State University PDXScholar School District Enrollment Forecast Reports Population Research Center 7-1-2000 Changing Times, Changing Enrollments: How Recent Demographic Trends are Affecting Enrollments
Georgian National Study
 Georgian National Study February, 0 International Republican Institute, Baltic Surveys Ltd. / The Gallup Organization, The Institute of Polling And Marketing with funding from the United States Agency
Armenia National Study
 Armenia National Study October 7 November, 007 International Republican Institute Baltic Surveys Ltd. / The Gallup Organization Armenian Sociological Association with funding from the United States Agency
Introduction of the euro in the new Member States. Analytical Report
 Flash Eurobarometer 270 The Gallup Organization Flash Eurobarometer European Commission Introduction of the euro in the new Member States Fieldwork: May 2009 This survey was requested by Directorate General
FOR RELEASE NOVEMBER 07, 2017
 FOR RELEASE NOVEMBER 07, 2017 FOR MEDIA OR OTHER INQUIRIES: Carroll Doherty, Director of Political Research Jocelyn Kiley, Associate Director, Research Bridget Johnson, Communications Associate 202.419.4372
Borders First a Dividing Line in Immigration Debate
 JUNE 23, 2013 More Say Legalization Would Benefit Economy than Cost Jobs Borders First a Dividing Line in Immigration Debate A Pew Research Center/USA TODAY Survey FOR FURTHER INFORMATION CONTACT THE PEW
Standard Eurobarometer 88. National report PUBLIC OPINION IN THE EUROPEAN UNION MALTA.
 PUBLIC OPINION IN THE EUROPEAN UNION MALTA http://ec.europa.eu/commfrontoffice/publicopinion This survey has been requested and co-ordinated by the European Commission, Directorate-General for Communication.
PUBLIC OPINION IN TAJIKISTAN 2010 FINDINGS FROM AN IFES SURVEY
 PUBLIC OPINION IN TAJIKISTAN 2010 FINDINGS FROM AN IFES SURVEY Project Funded by: British Embassy Dushanbe Methodological Details 2 Fieldwork conducted between December 18, 2009 and January 6, 2010 Fieldwork
Jeffrey M. Stonecash Maxwell Professor
 Campbell Public Affairs Institute Inequality and the American Public Results of the Fourth Annual Maxwell School Survey Conducted September, 2007 Jeffrey M. Stonecash Maxwell Professor Campbell Public
European Parliament Eurobarometer (EB79.5) ONE YEAR TO GO UNTIL THE 2014 EUROPEAN ELECTIONS Institutional Part ANALYTICAL OVERVIEW
 ONE YEAR TO GO UNTIL THE 2014 EUROPEAN ELECTIONS Institutional Part ANALYTICAL OVERVIEW") Directorate-General for Communication Public Opinion Monitoring Unit Brussels, 21 August 2013. European Parliament Eurobarometer (EB79.5) ONE YEAR TO GO UNTIL THE 2014 EUROPEAN ELECTIONS Institutional
Directorate-General for Communication Public Opinion Monitoring Unit Brussels, 21 August 2013. European Parliament Eurobarometer (EB79.5) ONE YEAR TO GO UNTIL THE 2014 EUROPEAN ELECTIONS Institutional
Vancouver Police Community Policing Assessment Report Residential Survey Results NRG Research Group
 Vancouver Police Community Policing Assessment Report Residential Survey Results 2017 NRG Research Group www.nrgresearchgroup.com April 2, 2018 1 Page 2 TABLE OF CONTENTS A. EXECUTIVE SUMMARY 3 B. SURVEY
STEM CELL RESEARCH AND THE NEW CONGRESS: What Americans Think
 March 2000 STEM CELL RESEARCH AND THE NEW CONGRESS: What Americans Think Prepared for: Civil Society Institute Prepared by OPINION RESEARCH CORPORATION January 4, 2007 Opinion Research Corporation TABLE
QUESTIONNAIRE SURVEY ON THE
 NICOS POULANTZAS INSTITUTE QUESTIONNAIRE SURVEY ON THE Data, profiles, personal values and views of delegates at the 3 rd EL Congress, 3-5 December 2010, Paris Athens 2013 This document does not represent
Flash Eurobarometer 337 TNS political &social. This document of the authors.
 Flash Eurobarometer Croatia and the European Union REPORT Fieldwork: November 2011 Publication: February 2012 Flash Eurobarometer TNS political &social This survey has been requested by the Directorate-General
Views on European Union Enlargement
 Flash Eurobarometer 257 The Gallup Organization Flash EB N o 255 Dual circulation period, Slovakia Flash Eurobarometer European Commission Views on European Union Enlargement Analytical Report Fieldwork:
EUROPEAN ELECTIONS European Parliament Eurobarometer (EB Standard 70) - autumn 2008 Analysis
 - autumn 2008 Analysis") Directorate General for Communication Direction C - Relations with citizens Public Opinion Monitoring Unit EUROPEAN ELECTIONS 2009 Strasbourg, 12 January 2009 European Parliament Eurobarometer (EB Standard
Directorate General for Communication Direction C - Relations with citizens Public Opinion Monitoring Unit EUROPEAN ELECTIONS 2009 Strasbourg, 12 January 2009 European Parliament Eurobarometer (EB Standard
It's Still the Economy
 It's Still the Economy County Officials Views on the Economy in 2010 Richard L. Clark, Ph.D Prepared in cooperation with The National Association of Counties Carl Vinson Institute of Government University
How s Life in Austria?
 How s Life in Austria? November 2017 Austria performs close to the OECD average in many well-being dimensions, and exceeds it in several cases. For example, in 2015, household net adjusted disposable income
COMMUNITY PERCEPTIONS OF MIGRANTS AND IMMIGRATION
 COMMUNITY PERCEPTIONS OF MIGRANTS AND IMMIGRATION 3 1 EXECUTIVE SUMMARY 4 1.1 EXECUTIVE SUMMARY INTRODUCTION This report presents the findings from a Community survey designed to measure New Zealanders
EUROBAROMETER 64 PUBLIC OPINION IN THE EUROPEAN UNION AUTUMN
 Standard Eurobarometer European Commission EUROBAROMETER 64 PUBLIC OPINION IN THE EUROPEAN UNION AUTUMN 2005 Standard Eurobarometer 64 / Autumn 2005 TNS Opinion & Social NATIONAL REPORT EXECUTIVE SUMMARY
The Rights of the Child. Analytical report
 Flash Eurobarometer 273 The Gallup Organisation Analytical Report Flash EB N o 251 Public attitudes and perceptions in the euro area Flash Eurobarometer European Commission The Rights of the Child Analytical
How s Life in Mexico?
 How s Life in Mexico? November 2017 Relative to other OECD countries, Mexico has a mixed performance across the different well-being dimensions. At 61% in 2016, Mexico s employment rate was below the OECD
Equality Awareness in Northern Ireland: General Public
 Equality Awareness in Northern Ireland: General Public Equality Awareness Survey General Public 2016 Table of Contents 1. Introduction... 1 2. Social Attitudes and Perceptions of Equality... 11 3. Perception
Bulletin Vol. IV no. 5
 NEC s monthly monitor of Palestinian perceptions towards politics and economics Special focus: The Palestinian Media Bulletin Vol. IV no. 5 May-June 2009 NEC s Bulletin and the surveys associated with
Opinion Polling and Research in the ENPI Countries and Territories (OPPOL)
") EuropeAid/127122/C/SER/Multi Opinion Polling and Research in the ENPI Countries and Territories (OPPOL) Country report on the opinion poll 1, Ukraine 17 March 2010 MWH47501381.034. rev.1 This project is
EuropeAid/127122/C/SER/Multi Opinion Polling and Research in the ENPI Countries and Territories (OPPOL) Country report on the opinion poll 1, Ukraine 17 March 2010 MWH47501381.034. rev.1 This project is
RECOMMENDED CITATION: Pew Research Center, July, 2015, Negative Views of Supreme Court at Record High, Driven by Republican Dissatisfaction
 NUMBERS, FACTS AND TRENDS SHAPING THE WORLD FOR RELEASE JULY 29, 2015 FOR FURTHER INFORMATION ON THIS REPORT: Carroll Doherty, Director of Political Research Bridget Jameson, Communications Associate 202.419.4372
RECOMMENDED CITATION: Pew Research Center, July, 2016, 2016 Campaign: Strong Interest, Widespread Dissatisfaction
 NUMBERS, FACTS AND TRENDS SHAPING THE WORLD FOR RELEASE JULY 07, 2016 FOR MEDIA OR OTHER INQUIRIES: Carroll Doherty, Director of Political Research Jocelyn Kiley, Associate Director, Research Bridget Johnson,
DRAFT EXECUTIVE SUMMARY WASHTENAW COUNTY SURVEY, Survey Methodology
 Survey Methodology The team of CJI Research Corporation and Triad Research Group completed a total of 1,100 telephone interviews with a random sample of registered voters in Washtenaw County between October
Telephone Survey. Contents *
 Telephone Survey Contents * Tables... 2 Figures... 2 Introduction... 4 Survey Questionnaire... 4 Sampling Methods... 5 Study Population... 5 Sample Size... 6 Survey Procedures... 6 Data Analysis Method...
Working Paper No. 109 THE LIMITED IMPACTS OF FORMAL EDUCATION ON DEMOCRATIC CITIZENSHIP IN AFRICA. by Robert Mattes and Dangalira Mughogho
 Working Paper No. 109 THE LIMITED IMPACTS OF FORMAL EDUCATION ON DEMOCRATIC CITIZENSHIP IN AFRICA y Roert Mattes and Dangalira Mughogho AFROBAROMETER WORKING PAPERS Working Paper No. 109 THE LIMITED IMPACTS
NUMBERS, FACTS AND TRENDS SHAPING THE WORLD. FOR RELEASE September 12, 2014 FOR FURTHER INFORMATION ON THIS REPORT:
 NUMBERS, FACTS AND TRENDS SHAPING THE WORLD FOR RELEASE September 12, 2014 FOR FURTHER INFORMATION ON THIS REPORT: Carroll Doherty, Director of Political Research Jocelyn Kiley, Associate Director Rachel
EUROBAROMETER PUBLIC OPINION IN THE CANDIDATE COUNTRIES. Fieldwork: February - March 2004 Publication: July 2004
 Candidate Countries Eurobarometer European Commission EUROBAROMETER 2004.1 PUBLIC OPINION IN THE CANDIDATE COUNTRIES Fieldwork: February - March 2004 Publication: July 2004 NATIONAL REPORT EXECUTIVE SUMMARY
World Public Favors Globalization and Trade but Wants to Protect Environment and Jobs
 World Public Favors Globalization and Trade but Wants to Protect Environment and Jobs Majorities around the world believe economic globalization and international trade benefit national economies, companies,
Standard Eurobarometer 89 Spring Report. European citizenship
 European citizenship Fieldwork March 2018 Survey requested and co-ordinated by the European Commission, Directorate-General for Communication This document does not represent the point of view of the European
EUROBAROMETER 72 PUBLIC OPINION IN THE EUROPEAN UNION
 Standard Eurobarometer European Commission EUROBAROMETER 72 PUBLIC OPINION IN THE EUROPEAN UNION AUTUMN 2009 COUNTRY REPORT SUMMARY Standard Eurobarometer 72 / Autumn 2009 TNS Opinion & Social 09 TNS Opinion
OPEN NEIGHBOURHOOD. Communicating for a stronger partnership: connecting with citizens across the Southern Neighbourhood
 OPEN NEIGHBOURHOOD Communicating for a stronger partnership: connecting with citizens across the Southern Neighbourhood OPINION POLL SECOND WAVE REPORT Spring 2017 A project implemented by a consortium
RECOMMENDED CITATION: Pew Research Center, May, 2015, Negative Views of New Congress Cross Party Lines
 NUMBERS, FACTS AND TRENDS SHAPING THE WORLD FOR RELEASE MAY 21, 2015 FOR FURTHER INFORMATION ON THIS REPORT: Carroll Doherty, Director of Political Research Jocelyn Kiley, Associate Director, Research
THE PRESIDENT, THE STATE OF THE UNION AND THE TROOP INCREASE January 18-21, 2007
 For release: January 22, 2007 6:30 P.M. EST THE PRESIDENT, THE STATE OF THE UNION AND THE TROOP INCREASE January 18-21, 2007 President George W. Bush will make his 2007 State of the Union message to a
The People, The Press & Politics. Campaign '92: The Bounce Begins
 FOR RELEASE: SATURDAY, JULY 11, 1992, A.M. The People, The Press & Politics Campaign '92: The Bounce Begins Survey IX FOR FURTHER INFORMATION CONTACT: Donald S. Kellermann, Director Andrew Kohut, Director
An in-depth examination of North Carolina voter attitudes in important current issues. Registered Voters in North Carolina
 An in-depth examination of North Carolina voter attitudes in important current issues Registered Voters in North Carolina January 21-25, 2018 Table of Contents Key Survey Insights... 3 Satisfaction with
RECOMMENDED CITATION: Pew Research Center, December, 2016, Low Approval of Trump s Transition but Outlook for His Presidency Improves
 NUMBERS, FACTS AND TRENDS SHAPING THE WORLD FOR RELEASE DECEMBER 8, 2016 FOR MEDIA OR OTHER INQUIRIES: Carroll Doherty, Director of Political Research Jocelyn Kiley, Associate Director, Research Bridget
EUROBAROMETER 68 AUTUMN 2007 NATIONAL REPORT UNITED KINGDOM. Standard Eurobarometer PUBLIC OPINION IN THE EUROPEAN UNION
 Standard Eurobarometer European Commission EUROBAROMETER 68 PUBLIC OPINION IN THE EUROPEAN UNION AUTUMN 2007 Standard Eurobarometer 68 / Autumn 2007 TNS Opinion & Social NATIONAL REPORT UNITED KINGDOM
KAZAKHSTAN 1995 The Public Speaks An Analysis of National Public Opinion
 KAZAKHSTAN 1995 The Public Speaks An Analysis of National Public Opinion Elehie Natalie Skoczylas Steven Wagner Barbara Frass Varon A PUBLICATION IN THE VOICES OF THE ELECTORATE SERIES SEPTEMBER 1995 INTERNATIONAL
Immigration and Multiculturalism: Views from a Multicultural Prairie City
 Immigration and Multiculturalism: Views from a Multicultural Prairie City Paul Gingrich Department of Sociology and Social Studies University of Regina Paper presented at the annual meeting of the Canadian
DAILY LIVES AND CORRUPTION: PUBLIC OPINION IN EAST AFRICA
 DAILY LIVES AND CORRUPTION: PUBLIC OPINION IN EAST AFRICA Transparency International is the global civil society organisation leading the fight against corruption. Through more than 90 chapters worldwide
IX. Differences Across Racial/Ethnic Groups: Whites, African Americans, Hispanics
 94 IX. Differences Across Racial/Ethnic Groups: Whites, African Americans, Hispanics The U.S. Hispanic and African American populations are growing faster than the white population. From mid-2005 to mid-2006,
Public Awareness of the System for Complaints against the Police in Northern Ireland, 2004
 Research Report 02/2004 Public Awareness of the System for Complaints against the Police in Northern Ireland, 2004 Malcolm Ostermeyer Research Branch Office of the Police Ombudsman for Northern Ireland
Italian Report / Executive Summary
 EUROBAROMETER SPECIAL BUREAUX (2002) Italian Report / Executive Summary Survey carried out for the European Commission s Representation in ITALY «This document does not reflect the views of the European
EXECUTIVE SUMMARY EXECUTIVE SUMMARY 1
 EXECUTIVE SUMMARY Afghanistan in 2018: A Survey of the Afghan People is The Asia Foundation s fourteenth annual public opinion survey in Afghanistan. The longest-running barometer of Afghan perception
Preliminary Analysis of LAPOP s National Survey in Guyana, 2016
 Preliminary Analysis of LAPOP s National Survey in Guyana, 2016 May 2016 Author: Juan Carlos Donoso, Ph.D. LAPOP Leadership: Elizabeth J. Zechmeister, Director of LAPOP & Professor of Political Science,
KEY FINDINGS: IFES INDONESIA ELECTORAL SURVEY 2010
 KEY FINDINGS: IFES INDONESIA ELECTORAL SURVEY 2010 September 2010 Funded by the Australian Agency for International Development (AUSAID) In August 2010, IFES contracted Polling Center of Jakarta to conduct
FOR RELEASE MAY 10, 2018
 FOR RELEASE MAY 10, 2018 FOR MEDIA OR OTHER INQUIRIES: Carroll Doherty, Director of Political Research Jocelyn Kiley, Associate Director, Research Olivia O Hea, Communications Assistant 202.419.4372 RECOMMENDED
Rising Share of Americans See Conflict Between Rich and Poor
 Social & Demographic Trends Wednesday, Jan 11, 2012 Rising Share of Americans See Conflict Between Rich and Poor Paul Taylor, Director Kim Parker, Associate Director Rich Morin, Senior Editor Seth Motel,
Who influences the formation of political attitudes and decisions in young people? Evidence from the referendum on Scottish independence
 Who influences the formation of political attitudes and decisions in young people? Evidence from the referendum on Scottish independence 04.03.2014 d part - Think Tank for political participation Dr Jan
EUROPEAN COMMISSION APPLICANT COUNTRIES PUBLIC OPINION IN THE COUNTRIES APPLYING FOR EUROPEAN UNION MEMBERSHIP MARCH 2002
 EUROPEAN COMMISSION APPLICANT COUNTRIES PUBLIC OPINION IN THE COUNTRIES APPLYING FOR EUROPEAN UNION MEMBERSHIP MARCH 02 Release: March 02 Fieldwork: October 01 Directorate-General Press and Communication
WISCONSIN ECONOMIC SCORECARD
 RESEARCH BRIEF Q1 2014 Joseph Cera, PhD CUIR Survey Center University of Wisconsin Milwaukee WISCONSIN ECONOMIC SCORECARD The Wisconsin Economic Scorecard is a quarterly poll of Wisconsin residents conducted
Attitudes to global risks and governance
 Attitudes to global risks and governance Global Challenges Foundation 2017 Table of contents Introduction 3 Methodology 4 Executive summary 5 Perceptions of global risks 7 Perceptions of global governance
The European emergency number 112
 Flash Eurobarometer The European emergency number 112 REPORT Fieldwork: December 2011 Publication: February 2012 Flash Eurobarometer TNS political & social This survey has been requested by the Directorate-General
PEW RESEARCH CENTER. FOR RELEASE January 16, 2019 FOR MEDIA OR OTHER INQUIRIES:
 FOR RELEASE January 16, 2019 FOR MEDIA OR OTHER INQUIRIES: Carroll Doherty, Director of Political Research Jocelyn Kiley, Associate Director, Research Bridget Johnson, Communications Manager 202.419.4372
Preliminary results. Fieldwork: June 2008 Report: June
 The Gallup Organization Flash EB N o 87 006 Innobarometer on Clusters Flash Eurobarometer European Commission Post-referendum survey in Ireland Fieldwork: 3-5 June 008 Report: June 8 008 Flash Eurobarometer
INTRODUCTION OF THE EURO IN THE MORE RECENTLY ACCEDED MEMBER STATES
 Eurobarometer INTRODUCTION OF THE EURO IN THE MORE RECENTLY ACCEDED MEMBER STATES REPORT Fieldwork: April 2013 Publication: June 2013 This survey has been requested by the European Commission, Directorate-General
Asian American Survey
 Asian American Survey Findings from a Survey of 700 Asian American Voters nationwide plus 100 each in FL, IL, NV, and VA Celinda Lake, David Mermin, and Shilpa Grover Lake Research Partners Washington,
R Eagleton Institute of Politics Center for Public Interest Polling
 2002 SURVEY OF NEW BRUNSWICK RESIDENTS Conducted for: Conducted by: R Eagleton Institute of Politics Center for Public Interest Polling Data Collection: May 2002 02-02 EXECUTIVE SUMMARY TABLE OF CONTENTS
The People, The Press & Politics. Campaign '92:
 FOR IMMEDIATE RELEASE: The People, The Press & Politics Campaign '92: Air Wars II FOR FURTHER INFORMATION CONTACT: Donald S. Kellermann, Director Andrew Kohut, Director of Surveys Carol Bowman, Research
Kansas Policy Survey: Fall 2001 Survey Results
 Kansas Policy Survey: Fall 2001 Survey Results Prepared by Tarek Baghal with Chad J. Kniss, Donald P. Haider-Markel, and Steven Maynard-Moody September 2002 Report 267 Policy Research Institute University
Armenian National Study
 Armenian National Study January 0, 008 International Republican Institute Baltic Surveys Ltd. / The Gallup Organization Armenian Sociological Association with funding from the United States Agency for
Phenomenon of trust in power in Kazakhstan Introduction
 Phenomenon of trust in power in Kazakhstan Introduction One of the most prominent contemporary sociologists who studied the relation of concepts such as "trust" and "power" is the German sociologist Niklas
Motivations and Barriers: Exploring Voting Behaviour in British Columbia
 Motivations and Barriers: Exploring Voting Behaviour in British Columbia January 2010 BC STATS Page i Revised April 21st, 2010 Executive Summary Building on the Post-Election Voter/Non-Voter Satisfaction
Release #2475 Release Date: Wednesday, July 2, 2014 WHILE CALIFORNIANS ARE DISSATISFIED
 THE FIELD POLL THE INDEPENDENT AND NON-PARTISAN SURVEY OF PUBLIC OPINION ESTABLISHED IN 1947 AS THE CALIFORNIA POLL BY MERVIN FIELD Field Research Corporation 601 California Street, Suite 210 San Francisco,
RECOMMENDED CITATION: Pew Research Center, June, 2015, Broad Public Support for Legal Status for Undocumented Immigrants
 NUMBERS, FACTS AND TRENDS SHAPING THE WORLD FOR RELEASE JUNE 4, 2015 FOR FURTHER INFORMATION ON THIS REPORT: Carroll Doherty, Director of Political Research Alec Tyson, Senior Researcher Rachel Weisel,
Kansas Speaks Fall 2018 Statewide Public Opinion Survey
 Kansas Speaks Fall 2018 Statewide Public Opinion Survey Prepared For The Citizens of Kansas By The Docking Institute of Public Affairs Fort Hays State University Copyright October 2018 All Rights Reserved
COLORADO LOTTERY 2014 IMAGE STUDY
 COLORADO LOTTERY 2014 IMAGE STUDY AUGUST 2014 Prepared By: 3220 S. Detroit Street Denver, Colorado 80210 303-296-8000 howellreserach@aol.com CONTENTS SUMMARY... 1 I. INTRODUCTION... 7 Research Objectives...
RECOMMENDED CITATION: Pew Research Center, September 2014, Growing Public Concern about Rise of Islamic Extremism At Home and Abroad
 NUMBERS, FACTS AND TRENDS SHAPING THE WORLD FOR RELEASE September 10, 2014 FOR FURTHER INFORMATION ON THIS REPORT: Carroll Doherty, Director of Political Research Seth Motel, Research Analyst Rachel Weisel,
Swing Voters Criticize Bush on Economy, Support Him on Iraq THREE-IN-TEN VOTERS OPEN TO PERSUASION
 NEWS RELEASE 1150 18 th Street, N.W., Suite 975 Washington, D.C. 20036 Tel (202) 293-3126 Fax (202) 293-2569 FOR IMMEDIATE RELEASE Wednesday, March 3, 2004 FOR FURTHER INFORMATION Andrew Kohut, Director