A SURVEY OF THE. Afghan People AFGHAN I STAN IN 2017
|
|
|
- Juliet Greer
- 5 years ago
- Views:
Transcription


1 A SURVEY OF THE Afghan People AFGHAN I STAN IN 2017
2
3 AFGHANISTAN IN 2017 A SURVEY OF THE AFGHAN PEOPLE
4 AFGHANISTAN IN 2017 A SURVEY OF THE AFGHAN PEOPLE Project Direction The Asia Foundation Editors Tabasum Akseer, Zachary Warren, John Rieger Authors Tabasum Akseer, Mohammad Shoaib Haidary, Rebecca Miller, Sayed Masood Sadat, Christina Satkowski, Helen Seese, Mohammad Jawad Shahabi, Kris Veenstra, Zachary Warren, Fahim Ahmad Yousufzai Fieldwork and Monitoring Afghan Center for Socio-Economic and Opinion Research (ACSOR) Sayara Research Book Design Rohullah Mohammadi Photography Naimat Rawan and Rohullah Mohammadi 2017 The Asia Foundation Cover design: Kristin Kelly Colombano; Cover image: Naimat Rawan Printed on acid-free 100% recycled paper About The Asia Foundation The Asia Foundation is a nonprofit international development organization committed to improving lives across a dynamic and developing Asia. Informed by six decades of experience and deep local expertise, our work across the region addresses five overarching goals strengthen governance, empower women, expand economic opportunity, increase environmental resilience, and promote regional cooperation. Headquartered in San Francisco, The Asia Foundation works through a network of offices in 18 Asian countries and in Washington, DC. Working with public and private partners, the Foundation receives funding from a diverse group of bilateral and multilateral development agencies, foundations, corporations, and individuals. For more information, visit: asiafoundation.org
5 TABLE OF CONTENTS EXECUTIVE SUMMARY 5 1. NATIONAL MOOD National Mood: Direction of the Country Reasons for Optimism or Pessimism Local Mood Biggest Problems in Local Area Biggest Problems Facing Women Biggest Problems Facing Youth Self-Reported Happiness SECURITY Fear for Safety Crime and Violence Perceptions of the Afghan National Security Forces Peace and Reconciliation 55 3 ECONOMIC GROWTH AND EMPLOYMENT Overall Perceptions of the Economy Household Economic Situation Employment Women and the Economy Household Assets Household Income Wealth and Happiness DEVELOPMENT AND SERVICE DELIVERY Electricity Supply Nutrition and Access to Health Care Education Awareness of Development Projects GOVERNANCE Satisfation with Government Performance Confidence in Public Institutions Corruption Justice and Dispute Resolution POLITICAL PARTICIPATION Exercising Basic Political Freedoms Ability to Influence Local Government Decisions Politics and Religion Women and Politics Attitudes towards Democracy ACCESS TO INFORMATION AND THE MEDIA Sources of News and Information Access to the Internet and Use of Social Media Role of the Media in Public Opinion and Behavior 128
6 8. WOMEN IN SOCIETY Women s Access to Justice Customs and Cultural Practices Political Participation Education Economic Opportunities General Factors Associated with Support for Women s Rights MIGRATION Willingness to Migrate Reasons for Leaving Promoting Decisions to Stay Perceptions of Returnee Experiences 179 APPENDIX 1: METHODOLOGY Summary Questionnaire Design Sample Design Provincial Population Margin of Error Interviewers Sampling Replacements Quality Controls GPS Coordinates Coding and Data Entry 195 APPENDIX 2: SAMPLE DEMOGRAPHICS 199 APPENDIX 3: INTERVIEW QUESTIONNAIRE 203
7 TABLE OF FIGURES 1.1 National Mood: Direction of the Country National Mood, by Ethnicity National Mood, by Province Reasons for Optimism, by Region Reasons for Optimism, Security vs. Rebuilding Reasons for Optimism Reasons for Optimism, by Ethnicity Reasons for Pessimism Reasons for Pessimism, Urban vs. Rural Reasons for Pessimism, by Region What Is Going Well Locally What Is Going Well Locally, by National Mood Biggest Problems in Local Area Biggest Problems Locally, by Region Biggest Problems Facing Women Locally Biggest Problems Facing Women, Urban vs. Rural Biggest Problems Facing Youth Self-Reported Happiness, by Region Fear for Personal Safety Fear for Personal Safety, by Province Fear for Personal Safety, by Security Provider Level of Fear, by Activity Awareness of ISIS/Daesh, by Region Perception of ISIS/Daesh as a Threat, By Region Experience of Crime or Violence, by Region Reporting Crime to Institutions Perception of Who Provides Security in the Local Area Who Provides Security in the Local Area, by Province Perceptions of the Afghan National Police Perceptions of the Afghan National Army Confidence Levels for Afghan National Security Forces Perceptions of Improvement in Afghan National Security Forces, by Region Perceptions of the Afghan National Army Sympathy for Armed Opposition Groups Sympathy for the Taliban, by Province Reasons Taliban are Fighting Against Government Sympathy for ISIS/Daesh, by Province Reasons ISIS/Daesh are Fighting Government Economic Concerns, by Problem Area Economic Indicators: Worse Compared to One Year Ago Generating Income, by Gender and Urban vs Rural Men Earning Income 70
8 3.5 Women Earning Income Support for Women Working Outside the Home Households where Women Contribute to Income, by Province TV Ownership Household Land Ownership Households Owning Livestock, by Province Average Household Income, by Region Income and Happiness Perception of Improved Electricity Supply, Compared to 12 Months Ago, by Province Perception of Decreased Quality of Food in Diet Compared to 12 Months Ago, by Province Highest Level of Education, by Gender University Education, by Region Years Studied in Islamic Madrasa Years Studied in Islamic Madrasa, by Region Awareness of Development Projects in Local Areas Effect of Local Development Projects on National Mood: Change in Optimism, by Project Satisfaction with Government Performance Overall Confidence in Officials, Institutions, and Organizations Perception of Corruption: Major Problem Average Amounts of Bribes, by Institution Dispute Resolution: Use of Huquqs or Shuras/Jirgas Opinions of Dispute Resolution Institutions Types of Cases Taken to Dispute Resolution Fear while Voting Fear while Participating in Political Activities, by Region Influence over Local Government Decisions Perception of Ability to Influence Local Government Decisions, by Province Factors Associated with Perceived Local Influence Attitude towards Religious Leaders in Politics Support for Religious Leaders in Politics, by Gender Women and Electoral Decision-Making Women and Electoral Decision-Making, by Gender and Urban vs. Rural Satisfaction with Democracy Satisfaction with Democracy, by Province Factors Associated with Satisfaction with Democracy Perception of Members of Parliament, by Region Source of News and Information Source of News and Information, by Gender and Settlement Personal Access to the Internet Perceptions of Baad and Baddal, by Media Type Perceptions of Women s Rights, by Media Type Perceptions of Women in Political Sphere, by Media Type Appropriate Dress for Women in Public, by Media Type 134
9 8.1 Type of Dispute, by Location: Women Acceptability of Baad and Baddal Appropriate Dress for Women in Public: Perceptions of Men vs. Women Perception of Appropriate Dress for Women In Public, by Level of Education Appropriate Dress for Women in Public, by Ethnicity Ideal Age for Marriage Ideal Age for a Woman to Marry Strong Opinions on Women in Leadership Positions Preferred Gender for Member of Parliament, Rural vs. Urban Strong Support for Women in Leadership Positions, by Year Perception of Political Leadership Positions Support for Women Voting Support for Women's Independence in Voting, by Gender Support for Gender Equality in Access to Education Support for Gender Equality in Access to Education, by Province Support for Gender Equality in Access to Education, Over Time Support for Gender Equality in Access to Education, by Region Support for Women Working Outside the Home Reasons Women should not be Allowed to Work Outside the Home Acceptable Places of Employment for Women Women s Contribution to Household Income Factors Associated with Support for Women s Rights Experiences of Violence and/or Crime, by Gender Biggest Problems Facing Women, by Gender Desire to Leave Afghanistan, by Region Desire to Leave Afghanistan, Rural vs. Urban Desire to Leave Afghanistan, by Ethnicity Desire to Leave Afghanistan, by Age Desire to Leave Afghanistan, by Level of Confidence in Government Institutions Desire to Leave Afghanistan, by Confidence in the Media Reasons for Staying 179
10 Ghaz Jawzjan Balkh Faryab Sar-e-Pul Samanga Badghis Bamyan Herat Ghor W Daikundi Uruzgan Farah Zabul Nimroz Helmand Kandahar
11 Kunduz Takhar Badakhshan n Baghlan Panjshir Nuristan Parwan Kapisa Laghman Kunar ardak Kabul Logar Nangarhar ni Paktika Paktia Khost REGIONS CENTRAL/KABUL EAST SOUTH EAST SOUTH WEST WEST NORTH EAST CENTRAL/HAZARAJAT NORTH WEST
12 PREFACE In a nation undergoing complex change and transition, Afghans continue to weather challenges: a fragmented political system, a decline in aid and growth, and ongoing security and terrorism threats. Even in the face of often seemingly imperceptible progress, Afghans are eager for a better future, and recent data reflects this sentiment. Afghanistan in 2017: A Survey of the Afghan People is The Asia Foundation s thirteenth annual public opinion survey in Afghanistan. The longest-running barometer of Afghan opinion, the Survey has gathered the views of more than 97,000 Afghans since 2004, and provides a longitudinal portrait of evolving public perceptions of security, the economy, governance and government services, elections, media, women s issues, and migration. In 2017, the number of Afghans who say the country is moving in the right direction this year has increased. The downward trajectory in national mood which began in 2013 has reversed, and optimism has risen slightly this year. However, security fears and economic concerns color Afghan attitudes about the future of their country. More Afghans indicate they would be willing to leave the country if afforded the opportunity, the second-highest level recorded to date. Almost all Afghans believe corruption is a problem in all areas of their lives, consistent with last year s data. At the same time, perceptions of government institutions have improved after a two-year decline. More than half of Afghans surveyed believe the National Unity Government (NUG) is doing a good job, a 7.1-point increase over 2016 data. Nearly half of the respondents say they have influence over local government decisions, a notable increase since Public perceptions of the Afghan National Police, which after 2014 declined in all categories of capacity and performance assessed by the Survey, have stabilized in Year after year, the Survey findings remind us that the steady gains in the delivery of basic public services health, education, roads, drinking water, sanitation make an enormous difference in people s daily lives and are an antidote to extremism, instability, and vulnerability. In 2017, Afghans report improvements in the quality of food in Afghan diet and the health of family members, up from This year, similar to last year s data, the majority of Afghans support women working outside the home. Afghanistan today remains one of the world s most challenging research environments. Against this backdrop, the importance of comprehensive, reliable data cannot be overstated. The Survey is a map of social change over time, presenting a concise snapshot of the gains and gaps that Afghans perceive in a rapidly transforming nation. Through this annual project, we are committed to providing a deeper understanding of Afghanistan to help advance informed policymaking and sustain lasting progress. Over the decades, The Asia Foundation has had a longstanding commitment in Afghanistan providing a wide range of support in leadership development, institution building, and support for economic growth. As Afghanistan faces a crucial period of political and economic transition, this is an important moment to consider how the international community can constructively support Afghanistan s continued journey to a prosperous and stable democracy. David D. Arnold President, The Asia Foundation November 2017
13 ACKNOWLEDGEMENTS A Survey of the Afghan People is the product of numerous contributions from the partners and staff of The Asia Foundation. The survey report was produced under the guidance of Afghanistan Country Representative Abdullah Ahmadzai, and led by a team of Afghan data analysts including Fahim Ahmad Yousufzai, Mohammad Shoaib Haidary, Sayed Masood Sadat, Mohammad Yahya Atash, Fatima Saadat, Ajmal Rahimi, working under the direction of Dr. Tabasum Akseer, acting director, Dr. Zachary Warren, consultant, and Mohammad Jawad Shahabi, program manager of policy research. Rohullah Mohammadi led the report design with assistance from Zeeba Mohammadi and Sayed Rashid Sadat, graphic design interns, with publication by Rouge Communications in Delhi, India. Editorial and production support was provided by The Asia Foundation s Global Communications team and Washington, DC, office. Jaime Medrano of JD Systems constructed the online tool for visualizing survey data. ACSOR-Surveys, a subsidiary of D3 Systems, Inc., worked closely with the Foundation to conduct all survey fieldwork. The Foundation is grateful for ACSOR s facilitation of third-party monitoring by Sayara Research, and for their commitment to quality-control best practices in one of the world s most challenging research environments. Special thanks are due to ACSOR Managing Director Ashraf Salehi and Sayara Research s Haroon Rasheed for their professionalism and attention to detail. The General Directorate for the Office of the Minister of Interior provided valuable assistance in securing permission to conduct fieldwork, while the Afghan Central Statistics Organization (CSO) provided population estimates used for the construction of survey weights. The Asia Foundation thanks the United States Agency for International Development (USAID), the Australian Department for Foreign Affairs and Trade (DFAT), and the German government s Deutsche Gesellschaft für Internationale Zusammenarbeit (GIZ) for their support for this survey and for Afghan research capacity.
14
15 EXECUTIVE SUMMARY Afghanistan in 2017: A Survey of the Afghan People is The Asia Foundation s thirteenth annual public opinion survey in Afghanistan. The longest-running barometer of Afghan opinion, the Survey has gathered the views of more than 97,000 Afghans since 2004, and provides a longitudinal portrait of evolving public perceptions of security, the economy, governance and government services, elections, media, women s issues, and migration. Unique in its broad scope and long duration, the Survey tracks trend lines on questions of special interest to Afghans and the international community alike. Since 2006, the Survey has always begun by asking Afghans whether the country is moving in the right direction, an indication of optimism, or in the wrong direction, an indication of pessimism. This year, the downward trajectory in national mood which began in 2013 has reversed, and optimism has risen marginally, from 29.3% in 2016 to 32.8% in This year s slight increase in optimism is difficult to explain. On the surface, it would appear to be just a continuation of the status quo. However, regional and provincial changes are significant and paint a complex picture. This year s Survey polled 10,012 Afghan respondents 18 years and older, 50.1% of them male and 49.9% female, representing all major and most minor ethnic groups from all 34 provinces in the country. Face-to-face interviews were conducted from July 5 to July 23 by a team of 929 trained Afghan enumerators, matched with respondents by gender men interviewed men and women interviewed women. All enumerators are recruited from the provinces where they conducted interviews. Survey results have been weighted to be gender balanced and nationally representative using the most recent population data ( ) released by the Afghan Central Statistics Organization. The total sample consisted of 20.2% urban households and 79.8% rural households, and this year s margin of error is ±1.4%, based on a design effect of 2.06 and a confidence interval of 95%. The Asia Foundation s longstanding research partner, the Afghan Center for Socio-Economic and Opinion Research, conducted all survey fieldwork and logistics, while its parent company, D3 Systems, Inc., provided analytical and methodological support. As in the 2013, 2014, 2015, and 2016 surveys, Sayara Research conducted third-party validation of fieldwork, a best practice for survey research in challenging environments. Together with its partners, the Foundation is committed to quality-control processes guided by principles of validity and reliability. The survey data is available for further analysis at This year s Survey includes several new questions proposed by key users of the report s findings. New questions explore Afghans views on prisons and incarceration, disciplining of individuals who cannot repay debt, and disciplining community members who harass females. We also ask respondents about the value of any bribes they have given to various organizations or in certain situations. Questions on why respondents think the Taliban are fighting against the Afghan government, and whether reconciliation between the two is possible, have also been added, along with the same questions regarding ISIS/Daesh. We also gauge Afghans level of sympathy for both opposition groups. Following up on last year s questions about migration, we ask participants who prefer to stay in Afghanistan to offer two reasons why. We ask respondents if they know of any returnees to Afghanistan, how they were treated abroad, the reasons for their return, and whether they faced any difficulty upon their return to Afghanistan. An in-depth discussion of the Survey methodology is provided in Appendix 1. EXECUTIVE SUMMARY 5
16 NATIONAL MOOD Direction of the country: The highest rate of optimism in the period since the Survey began was recorded in 2013, when 58.2% of Afghans said the country was moving in the right direction. The downward trajectory of optimism that began the following year, in 2014, reversed course slightly in The number of Afghans who say the country is moving in the right direction this year has increased, albeit marginally, to 32.8%, while the number who say the country is moving in the wrong direction has declined to 61.2% from a record high of 65.9% in This year s general increase in reported optimism applies to all ethnic groups, with the exception of Uzbeks. Pashtuns are the most optimistic about the direction of the country (40.6%), compared to Tajiks (29.3%), and Hazaras (26.2%). The proportion of Uzbeks who say the country is moving in the right direction has fallen since last year, from 29.0% to 25.8%. Residents in the East report the highest levels of optimism, followed by the South East and the South West (45.3%, 42.8%, and 42.2%, respectively). Reasons for optimism: Among Afghans who say the country is moving in the right direction, the two most frequently cited reasons relate to rebuilding the country (51.0%) and improved security (50.6%). Other reasons include improved governance (26.7%), improved rights for women (14.9%), and economic improvements (11.6%). Reasons for pessimism: Insecurity, economic concerns, and governance issues are by far the most commonly cited reasons for pessimism about the direction of the country. Concerns relating to security or crime top the list (69.5%), followed by economic concerns (39.9%), and governance issues (36.9%). Looking at the urban-rural divide, Afghans in urban areas point to economic concerns more frequently than Afghans in rural areas (49.3% vs. 36.3%), while rural Afghans are more likely than urban respondents to cite concerns over governance (38.6% vs. 32.4%). Local mood: For insight into Afghans views of their local environment, the Survey asks respondents to provide two examples of what is going well in their local area and the biggest problems in their local area. This year, almost a third of respondents (32.7%) say they don t know what is going well locally, and nearly one in five (19.0%) say nothing. These are marginal increases from last year s findings of 30.0% and 17.0%, respectively. Educational development, agricultural development, good security, and the building of roads and bridges are frequently cited as things that are going well locally (19.7%, 18.6%, 14.4%, and 11.3%, respectively). Afghans most frequently point to unemployment and security issues as their biggest local problems (31.0% and 24.1%, respectively). Biggest problems facing women: Like last year, over a third of all respondents (36.4%) say that education/illiteracy is a problem for women, making this the most frequently cited women s issue across gender, age, ethnicity, and the rural/urban divide. The next-most frequently cited problems for women are unemployment (22.7%); lack of rights (18.8%, up slightly from 14.9% in 2016); domestic violence, which has declined since last year (to 18.3% from 22.1%); forced marriages/dowries (11.8%); poverty (8.3%); and a lack of hospitals and clinics (8.0%). 6 AFGHANISTAN IN 2017
17 Biggest problems facing youth: When respondents are asked to name the two biggest problems facing those between the ages of 15 and 24 in their area, they most frequently cite unemployment (70.6%). This is consistent with 2016; it is similar across all regions; and it is particularly pronounced in the Central/Kabul region (76.8% of respondents). Illiteracy is next, at 31.9%, an increase of more than 6 percentage points from last year s 25.7%. Regionally, illiteracy is reported most frequently by Afghans in the West and, as in 2016, least often by those in the Central/Hazarajat region (39.4% vs. 20.3%). SECURITY Fear for personal safety: Security continues to deteriorate in 2017, though less rapidly than in previous years. Fear for personal safety increased by 0.9 percentage points in 2017, to a total of 70.7% of Afghans who fear for their personal safety always, often, or sometimes. More notable than the overall trend, however, are regional variations in respondents sense of security. In the South West, which led the prevailing trend towards greater insecurity in previous years, fear for personal safety fell by 7.8 percentage points in 2017, to 74.0% of respondents, a significant drop. The East region also recorded a significant drop in perceived insecurity: 5.7 percentage points, to 74.4%. In the South East, where last year s Survey recorded a staggering 14.0-point drop in perceived insecurity, to 67.0%, this year s roughly comparable figure (69.5%) suggests that the improvement was not an anomaly. The main focus of insecurity in 2017 appears to be in the West, where fear for personal safety increased steeply, from 67.5% in 2016 to 80.2% in Experience and reporting of crime and violence: Overall, the incidence of violence and crime experienced by Afghans fell slightly in 2017, by 0.9 points, to 18.5%. Crime and violence continue to be most prevalent in the South West (29.6% of respondents), followed by the East (26.6%) and the South East (25.7%). There are no major changes this year in the types of crimes committed: physical assault (34.6%), livestock theft (20.6%), and racketeering (19.6%) continued to predominate. Murder (10.6%) and kidnapping (10.2%) also remain prominent, as do suicide attacks (16.0%). In 2017, similarly to previous years, 62.5% of respondents who were victims of crime say they reported it to an authority outside the family. The agencies to which they made their reports are also substantially the same: 50.7% went to the Afghan National Police (ANP), and 18.0% turned to the Afghan National Army (ANA). Informal dispute resolution, involving shuras and elders (34.9%) or maliks (village headmen) and tribal leaders (22.6%), also remains popular. Perceptions of the Afghan National Security Forces: Public perceptions of the ANP, which after 2014 declined in all categories of capacity and performance assessed by the Survey, have stabilized in The proportion of Afghans who strongly agree that the ANP helps improve security has stopped falling, a slight uptick of 2.0 percentage points can be seen this year in assessments that the ANP is efficient at arresting criminals, and those strongly agreeing that the ANP is honest and fair increased by 7.2 percentage points over Findings for the ANA parallel the ANP, with a 5.2-point gain since 2016 for honest and fair, a 4.6-point gain for helps improve security, and a 3.4-point gain for protects civilians. EXECUTIVE SUMMARY 7
18 Peace and reconciliation: Only limited trend analysis of confidence in the peace process is possible in 2017, due to changes in the Survey questions. Instead of focusing on how reconciliation might affect security and stability, the Survey now focuses on whether negotiations with the Taliban are possible. Only half of the Afghan respondents (52.3%) believes in 2017 that reconciliation with the Taliban is possible. Yet, responding to a different question in 2016, 62.9% of Afghans believed that reconciliation could help stabilize the country. Afghans from the East are most likely to believe reconciliation is possible (70.2%), followed by the South West (61.1%) and the South East (55.1%). Afghans from Central/Hazarajat are the least confident (37.1%). Fear of encountering armed forces: Fear of encountering the ANP (43.3%) and the ANA (39.6%) fell slightly from 2016 (44.8% and 42.1%, respectively). Opposition forces remain a source of fear for the vast majority of Afghans, with 92.3% reporting some or a lot of fear of encountering the Taliban. Just a few provinces stand out for a notable proportion of respondents reporting no fear of encountering the Taliban, including Zabul (52.7%), Paktika (21.4%), and Helmand (20.6%). Paktika also merits attention for the 12.6% of respondents who say they do not fear encountering ISIS/Daesh, compared to the 93.9% of Afghans overall who say they fear encountering ISIS/Daesh. This year, 78.6% of Afghans report fear of encountering international forces. Knowledge and threat of ISIS/Daesh: There is a minimal drop overall in awareness of ISIS/Daesh, from 81.3% in 2016 to 79.0% this year, but with substantial declines of 16.7 points in Central/ Hazarajat and 8.1 points in the North East. ISIS/Daesh maintained high levels of awareness, however, in Central/Kabul (87.0%), the East (87.1%), and the South East (87.4%). After dropping 6.3 points in 2016, the perception that ISIS/Daesh is a threat to security has increased in 2017 by 0.6 percentage points, to 48.5%. ECONOMIC GROWTH AND EMPLOYMENT Perception of the economy: Economic concerns continue to color Afghan attitudes about the future of the country. Among the 61.2% of Afghans who say the country is moving in the wrong direction, unemployment (27.2%) is the second-most common reason cited (after security). Other reasons for overall pessimism include the poor economy (10.9%), lack of reconstruction (4.6%), and high prices (3.9%). When Afghans are asked to shift their frame of reference from national problems to local ones, economic issues become their primary concern. This pattern holds true in all previous years of the Survey. Afghans appear to want jobs for their community, and security for the country. The most commonly cited local problem is unemployment (31.0%), followed by a lack of security and services. Some respondents do not mention unemployment but nevertheless express general economic anxieties about, for example, the poor economy (6.5%), high prices (5.9%), and poverty (3.9%). As in previous years, when asked about the biggest problems for youth, Afghans overwhelmingly cite unemployment (70.6%); and when asked about the problems facing women, unemployment is the second-most commonly cited (22.7%). Afghans are not entirely pessimistic, however: among the 32.8% of respondents who say the country is moving in the right direction, the most common reason for optimism is reconstruction/rebuilding (34.4%) 8 AFGHANISTAN IN 2017
19 Household economic situation: Perception-based indicators of economic health have worsened since last year. One-third of respondents (33.5%) report that the financial well-being of their household has declined compared to last year, while 20.3% report improvement, and 46.0% report no change. Employment: In 2017, 45.0% of Survey respondents report involvement in an economic activity that generates income, reflecting no significant change since last year. More than half of respondents (58.1%) report that their employment opportunities have worsened since last year, up significantly from 2012 (28.5%), but not significantly different from 2016 (59.9%). Women and the economy: This year, a majority of Afghans (72.4%) support women working outside the home (comparable to last year s 74.0%). The Survey also reveals a link between respondents support for women working outside the home and their level of education. While 66.2% of those with a primary education (one to six years of formal schooling) support women working outside the home, this figure rises to 80.7% among those who have attended university. Household assets: Compared to previous years, more Afghans than ever before report owning at least one TV (66.4% in 2017 vs. 61.3% in 2016), an increase seen both in rural areas (58.1% in 2017 vs. 54.0% in 2016) and urban areas (91.4% in 2017 vs. 83.2% in 2016). On the other hand, ownership of other tools and appliances is more or less unchanged from last year. When asked how many members of their household have a mobile phone, 86.6% of Afghans report owning at least one, a slight decrease from 88.8% in This year, 59.1% of Afghans report having at least one jerib of land (one jerib is equal to 2,000 square meters), unchanged since 2014, when the question was first introduced. Agriculture including livestock-related activities continues to be the backbone of the rural Afghan economy: 72.0% of those who live in rural areas report owning livestock other than poultry, compared to 13.8% in urban areas. Household income: This year, Afghans report an average monthly income of AFN 11,859 (USD 173), an increase from AFN 10,949 (USD 165) in Respondents in the South West region report the highest monthly income, at AFN 17,290 (USD 253), while residents of Central/Hazarajat report the lowest, at AFN 4,852 (USD 71). Uruzgan stands out as the province with the highest average monthly household income, at AFN 32,664 (USD 478). DEVELOPMENT AND SERVICE DELIVERY Electricity: Despite initiatives by the government to expand the national electrical grid, just 12.2% of Afghans in 2017 say their electricity supply has improved, down from 13.9% in 2016, while 43.4% say it has gotten worse, the same as last year. Health: Overall, the perception that family members health is getting better has increased somewhat since last year, from 18.8% to 19.6%, and 16.6% of Afghans say the quality of food in their diet has improved, up from 16.1% in This is a significant drop from 2012, a period of relatively greater economic prosperity, when 40.9% reported the quality of food had improved, the highest rate in the Survey s history. EXECUTIVE SUMMARY 9
20 Education: Educational attainment among adults remains low in Afghanistan, with just under half of the adult population reporting no formal schooling (48.4%). Looking more closely at the different levels of schooling, 15.8% say they have attended primary school, 25.8% have attended secondary school (middle and high school), and 7.9% say they have attended university. Awareness of development projects: While 2016 saw an increase in public awareness of development projects across every category, awareness of these projects in 2017 is still low. Public awareness of the following kinds of projects increased in the last 12 months: a new private school (16.1%), water supply for irrigation (17.2%), health care (22.4%), reconstruction/programs in agriculture (20.3%), and reconstruction/programs in industry (5.2%). As in 2016, the highest rate of awareness is of projects to build or repair roads and bridges (33.9%), followed by the building of mosques (29.9%) and drinking water supplies (24.5%). The greatest increase in awareness is of new private schools, although the increase is marginal (1.4 percentage points, from 14.7% in 2016 to 16.1% in 2017). Overall, the change in awareness of development and infrastructure projects has been small in 2017, particularly when compared to six years ago, when international and military aid expenditure was at its peak. GOVERNANCE Satisfaction with government performance: After a two-year decline in Afghan perceptions of how well various government institutions do their job, including a historic decline in 2016, perceptions this year have improved. More than half of Afghans surveyed (56.2%) believe the National Unity Government (NUG) is doing a good job ( very good or somewhat good ), a 7.1-point increase over 2016 (49.1%). A similar improvement can be seen this year at the provincial level, as 56.9% of Afghans report satisfaction with their provincial governments. Urban residents are more satisfied with municipal government in 2017 (up from a record low of 42.4% in 2016 to 47.1% this year), and rural respondents are more satisfied with their district governments (up from 50.7% in 2016 to 55.8% this year). Confidence in public institutions: For the second consecutive year, Afghans report the highest levels of confidence in their religious leaders (67.3%), followed by the media (65.7%) and community shuras/jirgas (65.7%). Members of parliament (MP) (35.4%), government ministers (35.9%), and the parliament as a whole (36.8%) receive the lowest levels of confidence. Among various governmental and nongovernmental institutions, the most significant changes in confidence since 2016 are associated with community development councils (up from a record low of 53.4% to 57.9% this year) and the Independent Election Commission (up from a record low of 33.7% to 38.1% this year). Asked which issues their MP cares about most, 37.0% of Afghans say personal interests, 22.8% say ethnic interests, 18.1% say provincial issues, 10.4% say national issues, and 9.4% say district or municipal issues. Corruption: In 2017, and consistent with last year, almost all Afghans believe corruption is a problem in all areas of their lives, with 83.7% saying corruption is a major problem in Afghanistan as a whole, while 13.1% say it is a minor problem. Concerns about corruption in daily life have grown consistently over the years, and this year have reached a record high, with 69.8% of respondents saying corruption is a major problem in their daily life, and 23.0% saying it is a minor problem. For the first time, the 10 AFGHANISTAN IN 2017
21 2017 Survey asked respondents about the amount, or the equivalent value in cash, of the favor or gift they most recently had to give in order to obtain services. The new questions were included to focus on the sizes of bribes. Afghans on average report giving the biggest bribes to the judiciary/courts, when applying for a job, and to provincial governors offices. Justice and dispute resolution: For the second consecutive year, the Survey asked Afghans if a person arrested for a crime should have the right to a lawyer, regardless of whether they are guilty or not. There seems to be a slight increase in the overall positive response to this question (from 79.2% in 2016 to 81.4% in 2017). When asked which type of defense lawyers they would trust if they were arrested, Afghans continue to report the highest levels of confidence in defense lawyers hired by the government (62.0%), followed by defense lawyers not hired by either the government or an organization (59.0%), defense lawyers hired by civil society organization (50.3%), and defense lawyers hired by an international organization (40.1%). One in five Afghans (20.4%) report that they have appealed to an outside party such as the Huquq (rights) Department, a state court, or a local shura/jirga to resolve a dispute in the past two years. Residents of rural areas are twice as likely as urban residents to say they had to go to an outside party to resolve their dispute (23.2% vs. 12.0%). POLITICAL PARTICIPATION Basic political freedoms: This year, 51.5% of Afghans say they experience some fear or a lot of fear while participating in a national election, down slightly from 53.7% in Women (55.1%) are slightly more likely than men (47.9%) to report fear while voting. Urban respondents (53.7%) are slightly more likely than rural respondents (50.8%) to report feeling fear. An even higher percentage of Afghans, 71.8%, say they would be afraid to participate in a peaceful demonstration. Women (77.0%) are more likely than men (66.5%) to report fear of engaging in peaceful protest. Similarly, 72.7% of all Afghans say they would feel fear while running for political office. The Survey also asks Afghans the extent to which they feel safe criticizing their government in public. In 2017, 54.4% of Afghans say they feel safe doing so, a rate that is virtually unchanged since the 2016 Survey. Influence over local government: Nearly half (49.5%) of Afghans say they have some or a lot of influence over local government decisions. This represents a notable increase since 2016, when only 43.3% said they felt they can influence local government decisions, and it is the first year-on-year increase since a high of 55.9% following the 2014 presidential election. Men (50.1%) and women (48.9%) say they can influence local government policy at similar rates, as do residents of urban (47.2%) and rural (50.3%) areas. Politics and religion: In 2017, the percentage of Afghans who say that religious leaders should be involved in politics is slightly higher, at 61.6%, than in 2016 Survey, at 57.2%. Residents of the South West (76.6%) and East (74.7%) are most likely to support the involvement of religious leaders in politics, while residents of the West (53.1%) and North West (55.3%) are least likely to support this view. The provinces with the greatest support for mixing religion and politics are Panjshir (97.3%), Helmand (88.1%), and Kapisa (80.2%), while the provinces with the least support are Khost (44.5%), Herat (44.6%), and Logar (46.5%). EXECUTIVE SUMMARY 11
22 Women and politics: A large majority of Afghans believe women should be allowed to vote in elections (89.0%), a result that is virtually unchanged from the 2016 Survey (88.2%) or the 2009 Survey (83.4%), when this question was previously included in the questionnaire. Women (90.9%) are only slightly more likely than men (87.2%) to hold this view. Fewer than two in three Afghans (59.8%) say that women should decide who to vote for on their own, while 16.9% say men should decide for women. Afghans are twice as likely to say they prefer to be represented by a man in parliament (43.7%) than a woman (20.6%), though more than a third of respondents (34.1%) say it makes no difference if their MP is a man or a woman. Men (63.5%) are much more likely than women (24.0%) to prefer only a male MP. Attitudes towards democracy: In 2017, Afghans expressed lukewarm satisfaction (57.0%) with democracy, halting a decline in the public s opinion of the democratic system since the 2014 Survey, the year of the bitterly contested presidential election. Women (58.3%) are only slightly more likely than men (55.7%) to express a favorable opinion of democracy. Just over half (58.4%) say that their MP does a somewhat good job or a very good job of listening to his or her constituents and representing their needs. ACCESS TO INFORMATION AND THE MEDIA Sources of news and information: Like last year, family and friends continue to be the most common source of information in 2017, followed by television and radio. Reliance on family and friends for information has remained steady (80.4% in 2016, 79.8% in 2017). Radio use has declined, from 70.5% in 2016 to 62.3% in 2017, and television use has also declined slightly, from 66.4% to 64.9%. Mobile phones remain a common tool for Afghans to obtain information (42.1% in 2016, 43.4% in 2017). Mosques and community shuras also remain common sources of information, but declining slightly since 2016, from 47.5% to 45.5% for mosques, and from 38.9% to 36.3% for community shuras. Surprisingly, after a strong climb since 2013, the use of the Internet as an information source has not increased in 2017, remaining at the same level, 11.6%, as Access to the Internet: This year, 41.1% of respondents overall say the Internet is available in their area, through a cable connection, a wireless connection, or 2G/3G, a slight increase from 40.0% in Internet accessibility is particularly common in Kabul (81.9%) and urban areas generally (70.2%), while rural areas remain underserved. Role of the media in public opinion and behavior: The media can be a powerful tool for changing public opinion and behavior. People who watch TV for news and information say that they always or often fear for their own personal safety slightly more frequently (38.3%) than consumers of other sources of news, such as radio (37.3%). When considering overall satisfaction with democracy (i.e., the popular election of representative government), Afghans who get their news and information from the Internet are most likely to say they are very satisfied or very dissatisfied with democracy 16.7% in both cases, more than any other news source. Satisfaction with the NUG is highest among those who listen to radio for news, 17.4% of whom say it is doing a very good job, while dissatisfaction is highest among Internet users, 21.1% of whom say the NUG is doing a very bad job. Internet users 12 AFGHANISTAN IN 2017
23 are most likely to disapprove of baad and baddal practices (91.2% and 78.5%, respectively), followed by those who get their news and information from television (89.2% and 72.7%, respectively). Users of these media also hold more liberal views on women in the political sphere: 90.5% of Internet users and 93.5% of TV viewers believe women should be allowed to vote, for example, and 49.3% of Internet users and 48.7% of TV viewers say positions of political leadership should be filled by both men and women. WOMEN IN SOCIETY Access to justice: Among respondents who have sought to resolve a dispute, somewhat more men (45.2%) than women (41.2%) say they took their case to a village shura/jirga, but marginally more women than men turned to state courts (40.4% vs. 38.5%) and the Huquq Department (25.1% vs. 21.7%). Not surprisingly, when the dispute involves family problems, more than half of women (53.4%) say they turn to the village/neighborhood-based shura/jirga. Customs and cultural practices: Overall support among Afghans for the practices of baad and baddal continues to decline. Only 12.0% of Afghan respondents in this year s Survey agree (strongly or somewhat) that baad is acceptable, compared to 18.0% who agreed with the practice in The majority of Afghans, 89.9%, agree strongly or somewhat that a daughter is entitled to miras, and there is little difference between the proportions of men and women who hold this opinion (90.3% and 89.6%, respectively). Similarly, urban and rural Afghans differ only slightly in their agreement with the practice (91.2% and 89.5%, respectively). Perceptions of women s attire in public: When asked about their perceptions of appropriate dress for women in public, 32.7% of respondents, nearly a third, pointed to the picture of a woman wearing a burqa, 28.5% selected the niqab, 16.4% selected the close-fitting hijab, and 14.7% selected the chador, or headscarf. Fewer Afghans (6.8%) pointed to the loose hijab, and fewer than 0.6% selected the image of a woman with no headwear. Differences between rural and urban respondents are pronounced. Significantly more rural than urban respondents (36.7% vs. 20.5%) prefer the burqa as the most appropriate garment for women in public. Political participation: Overall, Afghans express support for women s access to leadership positions, although there is some variation according to the particular role. There is a high level of agreement (69.7%) that women should be able to join a community development council, but there is less agreement regarding corporate or government roles. That said, more than half of respondents say that a woman should be able to become a CEO of a private company (54.6%), a provincial governor (55.4%), and a cabinet member (56.0%). There is less support (48.2%) for a woman s candidacy for president. In all cases, support for women in leadership positions is significantly stronger in urban areas than rural areas, with differences ranging from 13 to almost 17 percentage points, depending on the position in question. The most marked difference is in support for a female minister or cabinet member (urban support, 68.6%; rural support, 51.8%). EXECUTIVE SUMMARY 13
24 Education: In 2006, a record 91.5% of respondents expressed agreement with the idea that women should have the same opportunities as men in education. In 2017, that agreement has fallen to 82.3%. A higher proportion of Afghans living in urban areas (56.6%) than rural areas (35.4%) strongly agree with equal access to education. Women (47.8%) are more likely than men (33.6%) to strongly agree with equal access to education. Work: In 2006, 70.9% of respondents agreed that women should be allowed to work outside the home. This percentage dropped to a record low of 62.5% in 2011, then gradually rose again to 74.0% in This year, the figure declined marginally, to 72.4% of Afghans who agree women should be allowed to work outside the home. Employment venues: Respondents were also asked whether they think it is acceptable for women to work in certain types of employment. Support for women working in female-only schools (85.8%) and in hospitals or clinics (84.4%) remains roughly unchanged since 2016 (85.9% and 84.4%, respectively). There is significantly less support for women working in the security field, with 36.0% of respondents supporting women s presence in the army/police force. There is even less support for women working in a private company that employs both men and women (35.9%). MIGRATION Willingness to migrate: This year, the overall proportion of Afghans who indicate they would be willing to leave the country if afforded the opportunity has risen to 38.8% the second-highest level recorded to date. Afghans in the Central/Hazarajat region are the most willing to leave if afforded the opportunity (45.4%), with similar proportions in the East (44.2%), the North East (43.8%), and the South East (42.3%). Afghans living in the South West are the least willing to leave Afghanistan (28.2%). Men are somewhat more likely than women to say they would leave Afghanistan if they had the opportunity (41.2% vs. 36.3%). Reasons for leaving: Domestic insecurity is a major factor affecting respondents willingness to leave Afghanistan in Just over three-quarters (76.3%) of respondents who say they are willing to leave Afghanistan if given the opportunity cite insecurity as one of two reasons. This year, 40.5% of those who are aware of ISIS/Daesh indicate a willingness to leave, compared to 32.7% of those who have not heard of this group. Of Afghans who always fear for their own or their family s safety, 40.3% say they would leave Afghanistan if they had the opportunity, compared to 34.1% of those who say they never fear for their personal safety. Additionally, Afghans who have experienced violence over the past 12 months are more willing to leave the country than those who have not (43.5% vs. 37.8%). Unemployment is a particularly important factor in Afghan migration decisions. This year, 54.5% cite it as a reason for wishing to leave. Consistent with this, Afghans who believe employment opportunities have grown worse are more likely to express a willingness to leave than those who believe employment opportunities have improved (40.4% vs. 34.2%). Last year, Afghans with relatives abroad were more than twice as likely to indicate a willingness to leave as those without (44.1% vs. 20.5%). This year, the strength of that association has weakened somewhat, to 46.5% and 33.4%, respectively. Having relatives 14 AFGHANISTAN IN 2017
25 abroad who provide financial assistance is also more strongly associated with a willingness to leave Afghanistan than having relatives abroad who do not provide financial assistance (51.4% vs. 43.8%). Reasons for staying: For the first time, this year s Survey looked at the factors that might encourage Afghans not to migrate. By far the most frequently cited reason for staying relates to Afghan identity, with 82.9% of those who want to stay giving reasons such as this is my country, I feel comfortable here, for the freedom of my country, and the like. Another 14.3% give reasons for staying that reflect a desire to serve or improve Afghanistan by rebuilding the country, for example, or by eliminating ISIS/Daesh and the Taliban. Similar proportions refer to various obstacles to leaving, such as the family disallowing it (13.9%) or poor prospects elsewhere for things such as employment (12.4%). EXECUTIVE SUMMARY 15
26
27 1 NATIONAL MOOD Since 2006, the Survey has always begun by asking Afghans whether the country is moving in the right direction, an indication of optimism, or in the wrong direction, an indication of pessimism. This year, optimism has risen marginally, from 29.3% in 2016 to 32.8% in Optimism peaked in 2013 at 58.2%, when fieldwork was conducted in the midst of high expectations during the presidential election season. The sudden drop in 2015, which continued in 2016, has been attributed largely to a shift in Afghan expectations of their new democracy and government. Declining optimism was accompanied by a lack of public confidence in government, including the executive branch, the judicial system, and the military. This year s slight increase in optimism is difficult to explain. On the surface, it would appear to show an extension of the status quo. However, regional and provincial changes are significant and paint a complex picture. Since last year s Survey, the security situation in Afghanistan has worsened, with several of the major actors now competing with one another. The Taliban have gained influence and territory in rural parts of the country, while Daesh, also known as the Islamic State of Iraq and Syria or the Islamic State of Iraq and the Levant (ISIS/ISIL), in the form of its Afghan affiliate the Islamic State Khorasan Province (ISKP), 1 has increased its presence in urban areas 2 with a number of high profile attacks, notably in Kabul. 3 In total, eight provinces and 24 districts are now impacted by ISIS/Daesh attacks, an increase from one province and seven districts during the same period last year. 4 At the same time, the Afghan National Security Forces (ANSF) continue to suffer from significant challenges, including high average rates of attrition, poor combat readiness, and low morale. 5 At the same time, perceptions of both Afghanistan and the Afghanistan National Army (ANA) have improved this year. The spreading conflict has led to high civilian casualties and increasing numbers of Afghans on the move. Approximately 11,400 civilian casualties (including deaths and injuries) were reported in 2016, 6 and 5,243 civilian casualties were recorded between January and June of this year. 7 The number of Afghans who have been internally displaced by the conflict is high over 160,000 during the first half of Additionally, the number of Afghans returning to the country is rising. 9 Between January and August 2017, an estimated 307,000 undocumented Afghans have returned from Pakistan and Iran. 10 Moreover, the agreement between the European Union and Afghanistan 11 signed in October 2016 will expedite the repatriation of Afghans whose asylum appeals have been rejected in Europe. This agreement may further increase the number of internally displaced Afghans. The country s capacity to provide basic services and/or jobs to these individuals is under increasing strain. In fact, in this year's Survey, unemployment is cited by 70.6% of respondents as the biggest problem facing youth. Further, complex government power-sharing arrangement and the downstream effects has hindered government progress. This situation is expected to grow worse as parliamentary elections move closer. 12 This chapter explores reasons why Afghans say they are optimistic or pessimistic about the future. It also addresses Afghan responses to questions about what is going well, and not so well, in their local areas, including the difficulties faced by women and youth. NATIONAL MOOD 17
28 1.1 NATIONAL MOOD: DIRECTION OF THE COUNTRY KEY QUESTION Q-1. Overall, based on your own experience, do you think things in Afghanistan today are going in the right direction, or do you think they are going in the wrong direction? This year, and for the first time since 2013, the number of Afghans who say the country is moving in the right direction has increased, albeit marginally. In 2016, 29.3% of respondents expressed optimism. This year, the proportion has risen slightly, to 32.8%. Conversely, the number of Afghans who say the country is moving in the wrong direction has decreased, from 65.9% in 2016 to 61.2% this year (figure 1.1). Each year, the Survey finds that around 4% to 8% of respondents say they don t know the answer to this question. This year, that figure is 5.3%. NATIONAL MOOD: DIRECTION OF THE COUNTRY 70% 60% 50% 40% 30% % 10% % RIGHT DIRECTION WRONG DIRECTION DON'T KNOW FIG. 1.1: Q-1. Overall, based on your own experience, do you think things in Afghanistan today are going in the right direction, or do you think they are going in the wrong direction? DEMOGRAPHIC AND GEOGRAPHIC FACTORS Again this year, differences between the proportions of men and women reporting optimism and pessimism are marginal (optimism, 33.8% and 31.7%, respectively; pessimism, 60.2% and 62.2%, respectively). For Afghans between the ages of 18 and 55, there are only slight variations in reported optimism just over 2 percentage points across that age range. Afghans over 55, however, are less optimistic about the direction of the country (27.7%) than other age groups, in particular those 18 to 25 (34.3%). Optimism does not vary to any great extent by marital status (single, 33.4%; married, 32.9%), and only marginal differences in optimism are evident between Afghans with no formal schooling and those who are university educated (31.1% and 34.7%, respectively). A positive association is evident, however, between income levels and optimism those who earn more are more likely to report that they feel the country is moving in the 18 AFGHANISTAN IN 2017
29 right direction. The strongest predictor of optimism is whether respondents believe their household situation has improved or worsened over the past 12 months in relation to a range of factors, including, but not limited to, their employment opportunities, health and well-being, and access to electricity and schools. Respondents reporting that their overall household situation has improved over the past 12 months are more likely to report optimism. Other factors that are positively correlated with optimism include self-reported happiness, a belief that reconciliation between the Taliban and the Afghan government is possible, higher confidence in informal and formal authorities, and a positive perception of the ANSF. Optimism is negatively correlated with fear for the safety of oneself and one s family respondents who report less fear are more likely to report feeling optimistic about the future direction of Afghanistan. 13 This year s general increase in reported optimism applies to all ethnic groups, with the exception of Uzbeks (figure 1.2). Pashtuns report the most optimism about the direction of the country (40.6%), compared to Tajiks (29.3%), Hazaras (26.2%), and other minority groups, including Turkmeni, Aimak, and others 14 (29.8%). Perhaps reflecting disappointment with the diminished political authority of the first vice president and Uzbek leader, General Abdul Rashid Dostum, 15 the proportion of Uzbeks who say the country is moving in the right direction has fallen since last year from 29.0% to 25.8%. NATIONAL MOOD, BY ETHNICITY 45% 40% 35% 30% 25% 20% 15% 10% 5% 0% PASHTUN TAJIK UZBEK HAZARA OTHER FIG. 1.2: Q-1. Overall, based on your own experience, do you think things in Afghanistan today are going in the right direction, or do you think they are going in the wrong direction? (Percent who say right direction. ) As with last year, higher levels of optimism are reported in rural than in urban areas (34.5% vs. 27.5%). In 2015, optimism among rural Afghans was at 39.8%, dropping in 2016 to 31.6% before this year s rise. A similar trend was evident among urban respondents, with optimism at 27.2% in 2015, falling to 22.2% in 2016, then rebounding to 27.5% this year. NATIONAL MOOD 19
30 Pessimism is particularly pronounced among urban women. A considerably higher proportion of women than men living in urban areas report that they feel the country is going in the wrong direction (76.1% vs. 61.0%). Urban women are also considerably more likely than rural women to report pessimism (76.1% vs. 58.2%). Only marginal differences in pessimism are evident between Afghan men from urban and from rural areas (61.0% and 59.9%, respectively). Reported levels of optimism and pessimism also vary regionally. This year, Afghans in the East are the most likely to report an optimistic outlook about the direction of the country, followed by those living in the South East and the South West, (45.3%, 42.8%, and 42.2%, respectively). These regions are predominantly Pashtun. At the same time, there has been an easing of pessimism in all regions since last year s Survey, except for the North West and West, where the proportions of those with a pessimistic outlook are marginally higher than Afghans living in Central/Kabul most frequently report that Afghanistan is moving in the wrong direction (70.5%). This finding, which reflects a 10 percentage point reduction from 2016, incorporates particularly high rates of pessimism in the provinces of Panjshir (95.2%) and Kabul (76.6%). Afghans in the North West region are the second-most likely to report that Afghanistan is moving in the wrong direction: here, pessimism increased marginally, from 63.3% in 2016 to 66.2% this year. Rates of pessimism are also notable in the Jawzjan province in the North West region (76.6%). This is an area where support for General Dostum has been high, 16 and where militant groups have recently made significant inroads. 17 There is little difference in the levels of pessimism reported by respondents in the North East and Central/ Hazarajat (62.7% and 62.3%, respectively). In the West, over half of respondents in 2017 believe the country is going in the wrong direction (58.1%) a marginal increase from 56.4% last year led by the Western province of Farah (78.2%), an area that is also reported to be particularly vulnerable to conflicts between the ANSF and the Taliban. 18 Looking across provinces (figure 1.3), respondents from Paktika report the highest levels of optimism (69.1%), and more than half of respondents in Helmand, Laghman, Logar, and Khost report that they believe Afghanistan is moving in the right direction (54.8%, 53.3%, 52.4%, and 51.6%, respectively). Respondents in Panjshir are the least likely to say the country is going in the right direction (4.2%), followed by Faryab (19.5%) and Jawzjan (19.9%). 20 AFGHANISTAN IN 2017
31 NATIONAL MOOD, BY PROVINCE Jawzjan Balkh Kunduz Takhar Badakhshan Faryab Sar-e-Pul Samangan Baghlan Herat Badghis Ghor Bamyan Panjshir Nuristan Parwan Kapisa Kunar Laghman Kabul Wardak Nangarhar Logar Daikundi Ghazni Paktia Khost Farah Uruzgan Zabul Paktika Nimroz Helmand Kandahar >50% 41 50% 31 40% 21 30% 11 20% 0 10% FIG. 1.3: Q-1. Overall, based on your own experience, do you think things in Afghanistan today are going in the right direction, or do you think they are going in the wrong direction? (Percent who say right direction. ) 1.2 REASONS FOR OPTIMISM OR PESSIMISM KEY QUESTIONS Q-2. (If Q-1 answer is right direction ) What are two reasons you think that Afghanistan is going in the right direction? Q-3. (If Q-1 answer is wrong direction ) What are two reasons you think that Afghanistan is going in the wrong direction? The Survey asks respondents to give two reasons why they think Afghanistan is going in the right or the wrong direction. The percentages reported in this section are proportions of respondents. Because respondents are asked to give two reasons, proportions sum to greater than 100%. RIGHT DIRECTION The two most frequently cited reasons for optimism relate to the themes of improved security and rebuilding the country (50.6% and 51.0% of respondents, respectively). 19 These reasons emerge in almost equal proportions among Afghan men (50.1% and 50.3%, respectively) and women (51.1% and 51.8%, respectively). They NATIONAL MOOD 21
32 are also the most frequently cited reasons among the main ethnic groups. Among Pashtuns, 54.4% point to improved security. This falls to 50.8% for Hazaras, 48.6% for Uzbeks, and 45.6% for Tajiks (figure 1.7). Improved security is more likely to be cited as a reason for optimism by rural than by urban respondents (52.9% vs. 41.9%). Interestingly, this finding diverges from 2016, when rural and urban Afghans differed little on this measure (50.6% vs. 51.5%). Similar proportions of rural and urban Afghans point to rebuilding as a reason for optimism (50.3% and 53.9%, respectively). At the regional level, greater proportions of Afghans in the East, South East, South West, and Central/Hazarajat regions cite improved security, rather than rebuilding, as a reason for their optimism. This pattern is reversed in the Central/Kabul, West, North East, and North West regions (figure 1.4). REASONS FOR OPTIMISM, BY REGION NORTH WEST CENTRAL/HAZARAJAT NORTH EAST WEST SOUTH WEST SOUTH EAST EAST CENTRAL/KABUL % 10% 20% 30% 40% 50% 60% 70% REBUILDING IMPROVED SECURITY FIG. 1.4: Q-2. (If Q-1 answer is right direction ) What are two reasons you think that Afghanistan is going in the right direction? As with last year, sharp provincial differences are evident (figure 1.5). In Panjshir, for instance, only 4.2% of respondents express optimism about the direction of the country, but all of them point to rebuilding as a reason for this optimism, while a much lower proportion point to improved security (100% vs. 13.5%). Improved security is most frequently cited as a reason for optimism in Paktia (71.9%), and it is least frequently cited in Panjshir (13.5%) and Herat (22.4%). In Zabul, only 11.1% of respondents refer to rebuilding as a reason for their optimism, compared with 78.8% in Farah and 78.3% in Sar-e-Pul. 22 AFGHANISTAN IN 2017
33 REASONS FOR OPTIMISM, SECURITY VS. REBUILDING SECURITY REBUILDING FIG. 1.5: Q-2. (If Q-1 answer is right direction ) What are two reasons you think that Afghanistan is going in the right direction? This year s Survey also brings to light other notable trends in why Afghans say their country is going in the right direction (figure 1.6). Around a quarter of respondents (26.7%) cite reasons relating to improved governance. Another 14.9% cite improved rights for women, and 11.6% cite economic improvements. International assistance is cited by just 5.8% of optimistic respondents, and greater freedom and improvements in human rights are mentioned by just 2.1%. Only a very small proportion cite a reduction in foreign intervention as a reason to be optimistic (0.8%).20 Improvements in the economy were cited by more urban than rural residents as reasons for optimism (16.5% and 10.3%, respectively). REASONS FOR OPTIMISM REBUILDING 51 IMPROVED SECURITY 51 IMPROVED GOVERNANCE 27 IMPROVED RIGHTS FOR WOMEN 15 ECONOMIC IMPROVEMENTS 12 INTERNATIONAL ASSISTANCE 6 IMPROVED HUMAN RIGHTS 2 OTHER 2 REDUCED FOREIGN INTERVENTION 1 0% 10% 20% 30% 40% 50% 60% FIG. 1.6: Q-2. (If Q-1 answer is right direction ) What are two reasons you think that Afghanistan is going in the right direction? Understandably, women are more likely than men to point to improved rights for women as a reason to be optimistic (18.4% vs. 11.6%). Men, on the other hand, are more likely than women to cite improved NATIONAL MOOD 23
34 governance (29.9% vs. 23.4%). Improved governance was particularly salient among respondents of Nuristan, Zabul, and Wardak (54.3%, 50.6%, and 44.5%, respectively). Tajiks and Pashtuns more frequently cite economic improvements as a reason to be optimistic (14.0% and 11.8%, respectively) than Hazaras and Uzbeks (8.8% and 6.8%, respectively). Compared to the other main ethnic groups, Hazaras were the least likely to refer to improved governance as a reason for optimism, and the most likely to refer to improved rights for women (figure 1.7). REASONS FOR OPTIMISM, BY ETHNICITY REBUILDING IMPROVED SECURITY IMPROVED GOVERNANCE IMPROVED RIGHTS FOR WOMEN ECONOMIC IMPROVEMENT INTERNATIONAL ASSISTANCE IMPROVED HUMAN RIGHTS REDUCED FOREIGN INTERVENTION OTHER 0% 10% 20% 30% 40% 50% 60% 70% OTHER HAZARA UZBEK TAJIK PASHTUN FIG. 1.7: Q-2. (If Q-1 answer is right direction ) What are two reasons you think that Afghanistan is going in the right direction? WRONG DIRECTION Insecurity, economic concerns, and governance issues are by far the three most commonly cited reasons for pessimism about the country s direction (figure 1.8). Concerns relating to security or crime are the reasons that Afghans say most frequently that the country is moving in the wrong direction, cited by 69.5% of pessimistic respondents. Over a third of respondents (39.9%) cite economic concerns, most related to unemployment (27.2%). Similiarly, 37.2% of pessimistic Afghans point to governance issues, with a large proportion of these particular responses (21.1%) citing corruption 21 as a reason they think the country is moving in the wrong direction. Lack of infrastructure is less frequently cited as an issue (9.5%). 24 AFGHANISTAN IN 2017
35 REASONS FOR PESSIMISM INSECURITY 69 ECONOMY 40 GOVERNANCE 37 LACK OF INFRASTRUCTURE/SERVICES 10 FOREIGN INTERVENTION 6 INJUSTICE/HUMAN RIGHTS 4 LACK OF INTERNATIONAL ASSISTANCE 2 MORALITY/RELIGIOUS DIRECTION OTHER 1 1 0% 10% 20% 30% 40% 50% 60% 70% 80% FIG. 1.8: Q-3. (If Q-2 answer is wrong direction ) What are two reasons you think that Afghanistan is going in the wrong direction? The predominance of insecurity, economic concerns, and governance as reasons for Afghans pessimism holds even when demographic lenses are applied. They predominate irrespective of gender, age, ethnic group, urban or rural area, and region of residence. The only exception to this finding relates to provinces. Afghanistan s Ministry of Foreign Affairs recently called on Pakistan to stop rocket attacks on Afghan soil. 22 In Nuristan, which borders Pakistan, concerns about foreign intervention are more frequently cited than concerns about the economy (23.9% vs. 13.9%). In Ghor, a very remote province of the country, lack of infrastructure and services is reported somewhat more frequently than economic issues (19.8% vs. 15.9%). Looking at the urban-rural divide (figure 1.9), Afghans in urban areas more frequently point to economic concerns than Afghans in rural areas (49.3% vs. 36.3%). Afghans in urban areas are less likely to cite concerns with governance than rural Afghans (32.4% vs. 38.6%). Rural Afghans are somewhat more likely than urban Afghans to cite lack of infrastructure or services as a reason the country is going in the wrong direction (10.7% vs. 6.6%), and they are more focused on foreign intervention as a reason to be pessimistic about the country s future (6.7% vs. 3.6%). NATIONAL MOOD 25
36 REASONS FOR PESSIMISM, URBAN VS. RURAL INSECURITY GOVERNANCE ECONOMY LACK OF INFRASTRUCTURE/SERVICES FOREIGN INTERVENTION INJUSTICE/HUMAN RIGHTS LACK OF INTERNATIONAL ASSISTANCE % 10 % 2 0 % 3 0 % 4 0 % 5 0 % 6 0 % 7 0 % 8 0 % URBAN RURAL FIG. 1.9: Q-3. (If Q-1 answer is wrong direction ) What are two reasons you think that Afghanistan is going in the wrong direction? While insecurity, economic concerns, and governance issues predominate across regions, other reasons for pessimism about the direction of the country do reveal regional differences (figure 1.10). For example, foreign intervention is cited by 5.9% of respondents as a reason for pessimism. Afghans who live in Central/Hazarajat are the least likely to cite this as a reason for their pessimism (1.2%), whereas those bordering Pakistan, in the South East, are the most likely (10.4%). In contrast, Afghans in Central/Hazarajat are the most likely to refer to a lack of international assistance as a reason for pessimism, while Afghans in Central/Kabul are the least likely to raise this issue (6.4% vs. 0.8%). Overall, only small proportions of respondents cite injustice or human rights (3.9%) or lack of international assistance (1.7%) as reasons for their pessimism. Less than 1% of respondents refer to issues with morality/religious direction. REASONS FOR PESSIMISM, BY REGION 80% 70% 60% 50% 40% 30% 20% 10% 0% CENTRAL/ KABUL EAST SOUTH EAST SOUTH WEST WEST NORTH EAST CENTRAL/ HAZARAJAT NORTH WEST INSECURITY ECONOMY GOVERNANCE DON'T KNOW LACK OF INFRASTRUCTURE/SERVICES FIG. 1.10: Q-3. (If Q-1 answer is wrong direction ) What are two reasons you think that Afghanistan is going in the wrong direction? 26 AFGHANISTAN IN 2017
37 1.3 LOCAL MOOD WHAT IS GOING WELL IN THE LOCAL AREA KEY QUESTION Q-4. In your view, what is going well in your local area? (Allow two answers.) For insight into the views of Afghans with regard to their local environment, the Survey asks respondents to provide two examples of what is going well in their local area and what are the biggest problems in their local area. Educational development, agricultural development, good security, and the building of roads and bridges are frequently cited as things that are going well locally (19.7%, 18.6%, 14.4%, and 11.3% of respondents, respectively) (figure 1.11). These proportions vary little from 2016, although agricultural development has risen from 13.5% last year to 18.6% this year. Development of the country, unity among people, availability of drinking water, building dams, and building clinics are also cited, but less frequently (9.8%, 7.5%, 5.1%, 5.0%, and 5.0% of respondents, respectively). Only 4.4% of respondents cite availability of jobs as something that is going well locally. AVAILABILITY OF JOBS BUILDING CLINICS BUILDING DAMS AVAILABILITY OF DRINKING WATER UNITY AMONG PEOPLE DEVELOPMENT OF COUNTRY BUILDING ROADS AND BRIDGES GOOD SECURITY AGRICULTURAL DEVELOPMENT NOTHING EDUCATIONAL DEVELOPMENT DON'T KNOW WHAT IS GOING WELL LOCALLY /5 5/5 7/ % 5% 10% 15% 20% 25% 30% 35% FIG. 1.11: Q-4. In your view, what is going well in your local area? This year, almost a third of respondents (32.7%) say they don t know what is going well locally, and nearly one in five (19.0%) say nothing. These are marginal increases from last year s findings (30.0% and 17.0%, respectively). Urban Afghans are nearly twice as likely to report nothing is going well as those living in rural areas (28.4% vs. 15.9%). Afghans who cite good security, building dams, development of the country, and availability of jobs as things that are going well locally are most likely to say the country is moving in the right direction. Those pessimistic about the direction of the country are much more likely to report nothing is going well than those who are optimistic about Afghanistan s direction (figure 1.12). Afghans living in the Central/Hazarajat region are the most likely to report that they don t know what is going well locally (59.4%) 20 points more likely than respondents in the West (39.7%). Afghans in the North East NATIONAL MOOD 27
38 are the most likely to point to unity among people as something that is going well locally, while those in the Central/Hazarajat region are the least likely to refer to this (14.5% vs. 0.8%). WHAT IS GOING WELL LOCALLY, BY NATIONAL MOOD GOOD SECURITY BUILDING DAMS DEVELOPMENT OF COUNTRY AVAILABILITY OF DRINKING WATER BUILDING CLINICS EDUCATIONAL DEVELOPMENT BUILDING ROADS AND BRIDGES UNITY AMONG PEOPLE AGRICULTURAL DEVELOPMENT AVAILABILITY OF JOBS DON'T KNOW BUILDING MOSQUES NOTHING 0% 10% 20% 30% 40% 50% 60% 70% 80% 90% 100% RIGHT DIRECTION WRONG DIRECTION REFUSED DON'T KNOW FIG. 1.12: Q-4. In your view, what is going well in your local area? 1.4 BIGGEST PROBLEMS IN LOCAL AREA KEY QUESTION Q-5. In your view, what are the biggest problems in your local area? (Allow two answers.) When asked about the biggest problems in their local area (figure 1.13), Afghans most frequently point to unemployment and security issues (31.0% and 24.1% of respondents, respectively). These are followed by issues with electricity (21.9%); drinking water (17.6%); roads (14.5%); education, schools, and literacy (9.3%); health-care facilities (8.6%); poor economy (6.5%); and high prices (5.9%). 28 AFGHANISTAN IN 2017
39 40% BIGGEST PROBLEMS IN LOCAL AREA 35% 30% % 20% 15% 10% 5% 0% UNEMPLOYMENT ELECTRICITY SECURITY DRINKING WATER FIG. 1.13: Q-5. In your view, what are the biggest problems in your local area? These findings vary little from 2016, although the proportion of respondents concerned with security is marginally higher this year than last (24.1% vs. 22.7%). Less than 5% of respondents cited corruption as a local problem (4.7%). Looking across regions (figure 1.14), unemployment is the most frequently reported local issue in all regions except the West and Central/Hazarajat. In the West, where insecurity from criminal activities such as assassinations, kidnappings, and thefts is on the rise, 23 over a third of Afghans (34.6%) cite lack of security as a local problem. This is in stark contrast to the 2.9% of Afghans living in Central/Hazarajat who point to security as a problem. In that region, lack of drinking water is the most frequently cited local issue (34.5%). Significant proportions of Afghans living in Central/Kabul and the North West also report issues with drinking water (23.7% and 25.8%, respectively) and unemployment (31.1% and 31.3%, respectively). In the East, South East, and North East, concerns with unemployment (cited by 34.9%, 32.8%, and 32.1%, respectively) and electricity (cited by 29.8%, 28.1%, and 25.7%, respectively) are the most frequently reported problems facing the local area. Residents in the West and South West most frequently refer to security (34.6% and 24.1%, respectively) and unemployment (29.4% and 26.3%, respectively) as the biggest problems in their area. NATIONAL MOOD 29
40 CENTRAL/ KABUL BIGGEST PROBLEMS LOCALLY, BY REGION EAST SOUTH EAST SOUTH WEST WEST NORTH EAST CENTRAL/ HAZARAJAT % % % % % % % % UNEMPLOYMENT SECURITY ELECTRICITY DRINKING WATER ROADS REFUSED EDUCATION HEALTH CARE POOR ECONOMY HIGH PRICES CORRUPTION POVERTY FIG. 1.14: Q-5. In your view, what are the biggest problems in your local area? NORTH WEST At the provincial level, unemployment is most frequently cited as a problem for the local community in Kunduz, Sar-e-Pul, and Nangarhar (50.3%, 47.9%, 42.7% of respondents, respectively). It is least frequently cited by residents of Zabul and Paktika (8.1% and 12.5%, respectively). Concerns with security are reported by almost two-thirds of Uruzgan residents (62.9%) and by over half of the Afghans living in Faryab, in the North West (55.5%), and Farah, in the West (52.6%). Those who least frequently report security as a big problem for their local area reside in the provinces of Bamyan (1.4%), Panjshir (3.2%), and Daikundi (4.3%). Respondents living in Badakhshan most frequently report issues with electricity (43.5%), and over half the residents of Samangan report drinking water as a local problem (51.9%). Curiously, and perhaps reflecting a higher threshold of concern, given their history of persecution, Hazaras, at 18.6%, are the least likely to report security as a big problem locally. This compares to 23.2% of Tajiks, 25.5% of Pashtuns, 26.1% of other minorities, and 27.8% of Uzbeks. 1.5 BIGGEST PROBLEMS FACING WOMEN KEY QUESTION Q-7. What, if anything, is the biggest problem facing women in this area today? What is the nextbiggest problem? Limited access to education and health care, restrictions on freedom of movement, unjust punishment for crimes of morality, unequal participation in government, forced marriage, and violence remain major challenges for women and girls in Afghanistan. In the first six months of 2017, the Afghanistan Independent Human Rights Commission documented thousands of cases of domestic violence, which included beatings, killings, and acid attacks AFGHANISTAN IN 2017
41 The Survey asks respondents to identify the two biggest problems facing women in their area (figure 1.15). Like last year, over a third of all respondents (36.4%) say that education/illiteracy is a problem for women, making this the women s issue most frequently cited across gender, age, ethnicity, and the rural/urban divide. It is also the most frequently reported issue facing women in all regions (particularly in Central/Hazarajat, at 55.7% of respondents) except for the South West, where a higher proportion of respondents cite domestic violence (27.6%) than education/illiteracy (22.3%). 60% BIGGEST PROBLEMS FACING WOMEN LOCALLY 50% 40% 30% 20% 10% % EDUCATION/ILLITERACY UNEMPLOYMENT/LACK OF JOBS DON'T KNOW LACK OF RIGHTS DOMESTIC VIOLENCE FIG. 1.15: Q-7. What, if anything, is the biggest problem facing women in this area today? What is the next biggest problem? The next-most frequently cited problems for women are unemployment (22.7%); lack of rights (18.8%, up slightly from 14.9% in 2016); domestic violence, which has declined since last year (to 18.3% from 22.1%); forced marriages/dowries (11.8%); poverty (8.3%); and a lack of hospitals and clinics (8.0%). More women than men report domestic violence as a problem for women (22.4% vs. 14.1%), but urban and rural respondents report domestic violence at roughly the same rates (18.8% and 18.1%, respectively). Domestic violence is cited almost twice as often by Pashtuns as Hazaras (21.6% vs. 10.9%). It is cited most frequently as a problem facing women in Khost (42.2%), Helmand (34.9%), and Faryab (34.3%). In rural areas, the proportion of respondents who regard forced marriage/dowries as a problem for women is more than double that in urban areas (13.6% vs. 6.2%), with the highest proportion in the province of Laghman, where 40.6% of respondents cited forced marriage/dowries as the biggest problem facing women. In a similar pattern, 21.1% of rural respondents, but just 12.1% of urban respondents, cite women s lack of rights (figure 1.16). Unemployment is cited significantly more frequently as an issue for women by Uzbeks (37.4%) than by Pashtuns (14.5%). NATIONAL MOOD 31
42 BIGGEST PROBLEMS FACING WOMEN, URBAN VS. RURAL NOTHING 2 11 POVERTY 8 9 NO HOSPITALS/CLINICS 6 9 FORCED MARRIAGE/DOWRY 6 14 DOMESTIC VIOLENCE LACK OF RIGHTS DON'T KNOW UNEMPLOYMENT EDUCATION/ILLITERACY % 5% 10% 15% 20% 25% 30% 35% 40% URBAN RURAL FIG. 1.16: Q-7. What, if anything, is the biggest problem facing women in this area today? 1.6 BIGGEST PROBLEMS FACING YOUTH KEY QUESTION Q-6. In your view, what are the two biggest problems facing youth in your area? By youth, I mean people between the ages of 15 and 24. Around half (47.3%) of Afghanistan s population is under the age of 15, 25 and 60 percent is under the age of This places the burden of providing for young people on a much smaller number of adults, a challenge that is exacerbated by a weak labor market. More than a third of Afghanistan s male population (34.3%) and over half of its female population (51.1%) is unable to find adequate work. 27 It is therefore no surprise that, when respondents are asked to name the two biggest problems facing those between the ages of 15 and 24 in their area, unemployment is cited most frequently, by 70.6% of respondents (figure 1.17). This is consistent with 2016, is similar across all regions, and is particularly pronounced in the Central/Kabul region (76.8% of respondents). While unemployment is reported least frequently in the South East, it is notably still cited by 56.5% of respondents. Afghan men more than women (73.4% vs. 67.8%), and urban Afghans more than rural (78.8% vs. 67.8%) say unemployment is a problem for young people. 32 AFGHANISTAN IN 2017
43 80% 60% BIGGEST PROBLEMS FACING YOUTH % 20% 0% UNEMPLOYMENT DON'T KNOW POOR ECONOMY NO HIGHER EDUCATION OPPORTUNITIES ILLITERACY DRUG ADDICTION INSECURITY FIG. 1.17: Q-6. In your view, what are the two biggest problems facing youth in your area? By youth, I mean people between the ages of 15 and 24. The literacy rate in Afghanistan is estimated at around 31% of the population over age Not unexpectedly, illiteracy is the next-most commonly reported issue for young people (31.9% of respondents). This reflects an increase of more than 6 percentage points from last year s 25.7%. Illiteracy is reported most frequently by Afghans in the West and, as in 2016, least often by those in the Central/Hazarajat region (39.4% vs. 20.3%). Over a third of Afghans living in rural areas (34.1%) report illiteracy as a problem for Afghan youths, compared to a quarter of urban Afghans (25.4%). Perhaps reflecting the increase in opium production across the country 29 and a decline in the number of provinces that have been declared poppy free, % of respondents express the concern that Afghan youth may become drug addicted. This varies widely by region, however. Considerable proportions of Afghans in the South East and South West, large poppy-growing regions, 31 point to drug addiction as a problem for young people 27.9% and 23.2%, respectively. Only 6.8% of respondents, however, cited this concern in Central/ Hazarajat, where 30.6% mentioned the poor economy as a problem facing youth, more than double the 15.2% rate for all respondents. This year, Afghans are relatively less concerned about security as a problem for youth, with just 8.3% identifying this issue, compared to 11.5% in Afghans in Central/Hazarajat are the least likely to report security issues as a problem for youth, while those living in the North East are most likely (1.0% vs. 11.7%). Over the past three years, the proportion of respondents who say a lack of opportunity for higher education is a particular problem for youth has declined significantly. It was 15.3% in 2015; it fell to 7.9% in 2016; and this year, the Survey reveals a further decline, to just 4.6% of respondents who say lack of opportunity for higher education is a problem for Afghanistan s youth. Lack of schools has similarly declined as a perceived problem for young people over the same three years (5.2%, 4.3%, and 3.8%). NATIONAL MOOD 33
44 1.7 SELF-REPORTED HAPPINESS KEY QUESTION D-16. In general in your life, would you say you are very happy, somewhat happy, not very happy, or not at all happy? All Survey respondents are asked whether, in general, they are very happy, somewhat happy, not very happy, or not at all happy in their life. For ease of interpretation, responses to this question have been aggregated: very happy and somewhat happy are combined to create the measure generally happy; not very happy and, not at all happy are combined to create generally unhappy. Results reveal very little difference between last year and this year in Afghans general happiness or unhappiness. This year, 76.7%, of respondents say they are generally happy in their lives, about the same as last year s figure of 76.8%, while 23.3% this year say they are generally unhappy, compared to 22.9% in Intercept respondents, who reside in particularly insecure areas, are less likely to report general happiness than respondents in the main sample (67.8% vs. 76.7%). Optimism and happiness are, understandably, related. Respondents who report they believe Afghanistan is moving in the right direction are more likely to report that they are generally happy than respondents who are pessimistic about the direction of the country (84.2% vs. 73.0%). Demographic and geographic groupings also reveal differences in self-reported general happiness. Consistent with previous years, men are marginally more likely than women to report being generally happy (77.9% vs. 75.6%). Across age groups, respondents of age are noticeably more likely to say they are generally happy (79.9%) than 26- to 35-year-olds (76.4%); 36- to 45-year-olds (74.7%); 46- to 55-year-olds (73.7%); and over-55-year-olds (76.0%). Overall, single respondents report somewhat higher proportions of general happiness than married respondents (80.4% vs. 76.4%). For men living in rural areas, being married makes little difference to self-reports of general happiness (married, 75.3%; single, 75.0%). In rural areas, however, single women are somewhat more likely to report general happiness than married women (78.8% vs. 74.7%). Afghans living in urban areas are also more likely to report that they are generally happy than rural respondents (82.2% vs. 74.9%). Hazaras are the least likely to say they feel generally happy (69.0%), compared to Uzbeks (73.6%), other minorities (75.1%), Tajiks (78.4%), and Pashtuns (78.6%). Trends in self-reported happiness since last year vary across regions (figure 1.18). Happiness declined from 2016 in the East, the South East, and the West, with almost no change in the North East. This decline was most notable in the West, where reported general happiness fell 12 percentage points, from 75.4% in 2016 to 63.2% in AFGHANISTAN IN 2017
45 SELF-REPORTED HAPPINESS, BY REGION 100% 90% 80% 70% % 50% 40% 30% 20% 10% 0% CENTRAL/ KABUL EAST SOUTH EAST SOUTH WEST WEST NORTH EAST CENTRAL/ HAZARAJAT NORTH WEST FIG. 1.18: D-16. In general in your life, would you say you are very happy, somewhat happy, not very happy, or not at all happy? (Percent who respond very happy or somewhat happy.) On the other hand, increases in general happiness were reported by respondents in Central/Kabul, the South West, Central/Hazarajat, and the North West compared to last year. Focusing solely on regional trends, however, gives an incomplete picture. Despite rising rates of general happiness in the South West, for example, respondents in Zabul, located in the South West, reported lower general happiness in 2017 (48.8%) than in 2016 (53.1%). Only one of the four provinces in the North East, Takhar, show a decline in self-reported happiness since last year (80.2% in 2016 vs. 73.7% this year), and Panjshir has defied the upward trend in Central/Kabul with a decrease from 81.2% last year to 77.5% this year. While happiness rose in Balkh, Jawzjan, Sar-e-Pul, and Faryab in the North West, around 8 percentage points fewer respondents in Samangan said they were generally happy this year (80.4%) than last (88.5%). There are a number of provinces in addition to Zabul where self-reports of general happiness are notably lower than the overall average of 76.7%. These include Wardak (55.2%), Badghis (58.5%), Herat (58.6%), and Faryab (59.9%). In other provinces, self-reported general happiness is singularly high, namely Badakhshan (93.5%), Parwan (92.9%), and Logar (91.5%). NATIONAL MOOD 35
46 Although no causal attributions can be made, there is a range of other factors that correspond with happiness. As with reported optimism, respondents who believe their household situation has grown better rather than worse over the last year are more likely to say they are happy. Respondents whose households earn more money, are better educated, and are less fearful for their own and their family s safety also more frequently report that they are generally happy in their lives. Similarly, those who have experienced less corruption, have a more positive perception of the ANSF, hold more confidence in formal and informal authorities, and believe they have some influence over local government decisions are more likely to report that they are happy AFGHANISTAN IN 2017
47 End Notes 1 While there has been a proliferation of names and acronyms for the Islamic State and its affiliates, the Survey this year retains its past practice of referring to them as ISIS or Daesh. 2 AAN Team, What to watch? Key issues to follow in Afghanistan in 2017 (Afghanistan Analysts Network, January 27, 2017), 3 Adam Wunische, When Islamic State and the Taliban Compete, Afghanistan Loses, Diplomat, March 18, 2017, thediplomat.com/2017/03/when-islamic-state-and-the-taliban-compete-afghanistan-loses/. 4 United Nations Office for the Coordination of Humanitarian Affairs (UNOCHA), Humanitarian Response Plan 2017: Mid- Year Review, January June 2017 (UNOCHA, 2017), year.pdf. 5 AAN Team, What to watch? 6 United Nations Assistance Mission in Afghanistan (UNAMA), Afghanistan: Protection of Civilians in Armed Conflict; Annual Report 2016 (Kabul: UNAMA, February 2017), armed_conflict_annual_report_8feb_2016.pdf. 7 United Nations Assistance Mission in Afghanistan (UNAMA), Afghanistan: Protection of Civilians in Armed Conflict; Midyear Report 2017 (Kabul: UNAMA, July 2017), armed_conflict_midyear_report_2017_july_2017.pdf. 8 UNOCHA, Humanitarian Response Plan World Bank, Afghanistan Development Update (World Bank Group, May 2017), org/bitstream/handle/10986/27550/ revised-public-afg-development-update-spring-2017-final. pdf?sequence=1&isallowed=y. 10 International Organization for Migration (IOM), Return of Undocumented Afghans: Weekly Situation Report, Aug 13 19, 2017, IOM, situation_report_aug_13_-_19-ilovepdf-compressed.pdf. 11 European Union and the Islamic Republic of Afghanistan, Joint Way Forward on migration Issues between Afghanistan and the EU, October 2, 2016, 12 AAN Team, What to watch? 13 Logit regression was used to regress perceived direction of Afghanistan (q1) onto gender (d1), age (d2), urban/rural (m6b), income (d6 and d7), education (d10), fear for personal safety (q17), a scale for fear when participating in different social and political activities (alpha=0.69), self-reported happiness (d16), a household well-being scale (alpha=0.76), awareness of projects (q9s), confidence that a guilty party will be punished (q24), experience of corruption scale (alpha=0.87), perception of influence over local government decisions (q47), a scale for confidence in formal and informal authorities (alpha=0.85), confidence about outcome of reconciliation between government and the Taliban (q53), perception of ANSF scale (alpha=0.67), and satistfaction with available dispute resolution in local area (q32). The model was weighted by urban/ rural, provincial, gender distribution, excluding the intercept interviews. The full model explained 16.0% of all variance in the perceived direction of Afghanistan (R2=0.1595, p<.0001). 14 Other minority groups includes Turkmen, Baloch, Kirghiz, Nuristani, Aimak, Arab, Pashaye, and Sadat. 15 Thomas Ruttig, Defying Dostum: A new Jombesh and the struggle for leadership over Afghanistan s Uzbeks (Afghanistan Analysts Network, July 19, 2017), 16 Ibid. 17 Obaid Ali, Non-Pashtun Taleban of the North (4): A case study from Jawzjan (Afghanistan Analysts Network, September 18, 2017), 18 AAN Team, What to watch? 19 Rebuilding includes reasons relating to reconstruction and infrastructure development. 20 The balance of responses, including other reasons, such as return of refugees, reduction in foreign intervention, could not be appropriately assigned to these categories, and totalled 2.4% 21 Corruption includes responses of corruption and administrative corruption. NATIONAL MOOD 37
48 22 Tamim Hamid, Kabul Will Use All Means To End Pakistani Missile Attacks, TOLO News, February 19, tolonews.com/afghanistan/kabul-will-use-all-means-end-pakistani-missile-attacks. 23 S. Reza Kazemi, The Battle between Law and Force: Scattered political power and deteriorating security test Herat s dynamism (Afghanistan Analysts Network, January 11, 2017), 24 Amnesty International, Afghanistan 2016/2017, in Amnesty International Report 2016/17: The State of the World s Human Rights (London: Amnesty International, 2017), 58 61, afghanistan/report-afghanistan/. 25 Islamic Republic of Afghanistan Central Statistics Organization (CSO), Afghanistan Living Conditions Survey : Midterm results Highlights, April September 2016 (CSO, March 2017), 26 Hervé Nicolle, Nassim Majidi, and Diane Bolme, Urban Displaced Youth in Afghanistan: Mental Health Matters, Humanitarian Bulletin Afghanistan, issue 61 (February 1 28, 2017): 5, 27 CSO, Afghanistan Living Conditions Survey. 28 United Nations Educational Scientific and Cultural Organization (UNESCO) Office in Kabul, Enhancement of Literacy in Afghanistan (ELA) program, UNESCO, 29 World Bank, Afghanistan Development Update, p AAN Team, What to watch? 31 Afghan opium production up 43 per cent: Survey, United Nations Office on Drugs and Crime, unodc/en/frontpage/2016/october/afghan-opium-production-up-43-percent_-survey.html. 32 Using ordered logit regression, self-reported happiness (d16) was regressed on gender (d1), age (d2), income (d6 and d7), education (d10), urban/rural (m6b), source of news and information (q65s), having a family member abroad (q89), a household condition scale (alpha=0.76), employment status (d3), experience of corruption scale (alpha=0.87), fear for personal safety (q17), perception of ANSF scale (alpha=0.67), a scale for confidence in formal and informal authorities (alpha=0.85), confidence about outcome of reconciliation between government and the Taliban (q53), and perception of influence over local government decisions (q47). The model was weighted by urban/rural, provincial, gender distribution, excluding the intercept interviews. The full model explained 6.6% of all variance in the perceived direction of Afghanistan (R2=0.0656, p<0.0001). 38 AFGHANISTAN IN 2017
49
50
51 2 SECURITY After several years of deteriorating security and growing concerns over the capabilities of the Afghan National Security Forces (ANSF), international supporters are set to revise their strategies on security-sector assistance in Afghanistan in In 2014, responsibility for security was transferred from foreign to Afghan forces. After the transition, the country witnessed accelerating violence, including a rise in civilian as well as ANSF casualties. 1 In 2015 and 2016, Taliban territorial control across the country expanded rapidly, with the group encircling and threatening to overrun several provincial centers. So far, fears that at least some of these centers would not be able to hold out in 2017 the most vulnerable being Uruzgan, Helmand, Farah, and Kunduz have not materialized. Instead, there appears to be a stalemate, in which the Taliban maintain control over rural areas but cannot expand into urban centers. 2 Some analysts speculate that the Taliban are simply not interested in accepting governance responsibility for urban communities at this time. This year s Survey was conducted in the month of July, after Ramadan and the harvest season. The Taliban fighting season begins earlier in the spring. 3 Compared to last year, nationwide perceptions of insecurity in this year s Survey have neither worsened nor improved significantly, with a marginal increase of just one percentage point, to 70.7%, in the number of Afghans who report feeling fear for their personal safety. Disaggregated by region, however, the data shows a significant increase in fear among respondents in the North West, rising levels of fear in areas encircling Herat city, and increased levels of fear in heavily contested provinces such as Kunduz and Uruzgan. 4 As security has deteriorated since 2014, observers have increasingly questioned the capability of the ANSF. 5 Fighting in Helmand, in particular, produced a stream of public discussions of corruption, mismanagement, and lack of leadership in the ANSF. 6 These developments have been reflected in previous years of the Survey. On the other hand, the public s opinion of the Afghan National Army (ANA) and the Afghan National Police (ANP) improved in Perceptions that the ANA and ANP are honest and fair improved by 2.3 percentage points, possibly reflecting efforts by the ANSF to strengthen community relations and improve performance. This year s findings also suggest, however, that these improvements have mostly been in urban areas. One proposal to bolster Afghanistan s security sector is to strengthen local security elements such as the Afghan Local Police (ALP). 7 Although it has drawn criticism from a range of stakeholders, one-fifth of Afghans consistently identify the ALP as the primary security provider in their community. This year s findings, however, suggest that the effectiveness of the ALP may be uneven, with levels of public acceptance varying widely among provinces. Many argue that long-term peace and security require reconciliation with the government s opponents. Toward this goal, the government finalized a peace agreement with Gulbuddin Hekmatyar, politician and leader of the Hezb-e Islami, that some hope will serve as a model for further negotiations with the Taliban. This peace agreement granted Hekmatyar asylum in Kabul, allowing him to leave his base in Pakistan, and provided reintegration support for his followers. 8 The Survey cannot answer the question of how this peace SECURITY 41
52 agreement may have affected public perceptions of security, but findings this year show a growing confidence in reconciliation efforts among respondents living in the East, where Hekmatyar s traditional power base is located. Other parts of the country do not share these attitudes. Instead, this year shows a growing division along ethnic lines, with Pashtun respondents increasingly supporting reconciliation efforts, while other groups increasingly oppose them. This division represents a potential source of further conflict. In 2015, ISIS/Daesh emerged as a destabilizing force in the country. Initially based in Muhmand Dara, a district in Nangarhar province that borders Pakistan, the group attempted to expand in 2016, with mixed results. Overall, Afghan forces and international partners were successful in undoing ISIS/Daesh territorial gains, though pockets of ISIS/Daesh presence persisted in The North West emerged as a new area of focus for ISIS/Daesh operations, 9 while Paktika and Ghazni in the South East region were also affected. Despite a dedicated approach, in which the United States at one point deployed its largest conventional bomb against a ISIS/Daesh cave compound, 10 Survey findings suggest that perceptions of ISIS/Daesh as a threat in Nangarhar, ISIS/Daesh s initial staging ground, have not diminished since This year, the Survey also asks Afghans to speculate about why ISIS/Daesh is fighting with the Afghan government (figure 2.19). The most common answers are to gain power, and foreign influence, a reference often aimed at neighboring countries. No answers indicate social acceptance of ISIS/Daesh or its goals. The following chapter explores in detail how these developments are reflected in Afghans perceptions of safety and security in their country, their confidence in the ANSF, issues of violence and crime, and the government s peace and reconciliation efforts. 2.1 FEAR FOR SAFETY KEY QUESTIONS Q-17. How often do you fear for your own personal safety or security or for that of your family these days? Would you say you always, often, sometimes, rarely, or never fear for you and your family s safety? Q-45. Please tell me how you would respond to the following activities or groups. Would you respond with no fear, some fear, or a lot of fear? (a) Voting in a national/provincial election. (b) Participating in a peaceful demonstration. (c) Running for public office. (d) Encountering the ANP. (e) Encountering the ANA. (f) Traveling from one part of Afghanistan to another part of the country. (g) Encountering international forces (Western military only). (h) Encountering the Taliban. (i) Encountering ISIS/Daesh. Q-18 Have you heard of the group called ISIS/Islamic State/Daesh? Q-19. (If Q-18 answer is yes ) In your view, does ISIS/Daesh currently pose a threat to the security of your district? Security continued to deteriorate in 2017, though less rapidly than in previous years. Fear for personal safety increased by 0.9 percentage points in 2017, to a total of 70.7% of Afghans who fear for their personal safety always, often, or sometimes (figure 2.1). 42 AFGHANISTAN IN 2017
53 FEAR FOR PERSONAL SAFETY 80% 70% 60% 50% 40% % 40 20% 10% 0% FIG. 2.1: Q-17. How often do you fear for your own personal safety or security or for that of your family these days? Would you say you always, often, sometimes, rarely, or never fear for you and your family s safety? (Percent who respond always, often, or sometimes. ) More notable than the overall trend, however, are regional variations in respondents sense of security. In the South West, which led the prevailing trend towards greater insecurity in previous years, fear for personal safety fell by 7.9 percentage points in 2017, to 74.0% of respondents, a significant drop. The East region also recorded a significant drop in perceived insecurity 5.7 percentage points, to 74.4%. In the South East, where last year s Survey recorded a staggering 14.0-point drop in perceived insecurity, to 67.0%, this year s roughly comparable figure (69.5%) suggests that the improvement was not an anomaly. The main focus of insecurity in 2017 appears to be in the West, where fear for personal safety increased steeply, from 67.5% in 2016 to 80.2% in Viewed by province, a more complex story emerges. In the South West, findings from Helmand are the predominant factor in a dramatic regional decline in fear for personal safety, from 92.3% in 2016 to 61% in At the same time, the example of Helmand highlights an important methodological issue. In 2017, the vast majority of respondents from Helmand were recruited in just the two largest districts the provincial center of Lashkar Gah, and nearby Nahr-e Saraj due to strong Taliban presence elsewhere in the province. 12 For the remaining districts, only intercept interviews could be conducted, which are not a random sample and therefore are not folded into the final figures. 12 Compared to the standardized data, these intercept interviews produce a 29.1-percentage-point higher result for fear for personal safety in Helmand province (90.1% vs. 61.0%), and a 10.1-percentage-point higher result in the South West region (84.1% vs. 74.0%). So, the dramatic decline in insecurity reported in Helmand is based on results, the standard interviews, that exclude the most dangerous districts, and thus the true level of insecurity is likely understated. The same phenomenon can be observed in the South East, where intercept interviews suggest higher levels of fear for personal safety in the inaccessible areas of all four provinces in that region, resulting in an 11.7-percentage-point discrepancy between standard interviews (69.5%) and intercept interviews (81.2%). SECURITY 43
54 Despite such distortions, findings aggregated at the provincial level still offer meaningful insights. For instance, elevated levels of fear for personal safety recorded in Uruzgan (94.0%), despite the gravitation of data collection towards the provincial center of Tarin Kowt, underline the urgency of the security situation in that province. In the West, growing insecurity in the provinces of Badghis (83.0%), Ghor (83.4%), and Farah (90.1%) from 2016 to 2017 illustrates the advancing encirclement of neighboring Herat (75.6%). In the North, Kunduz, which has been repeatedly threatened by Taliban offensives over the years, shows greater fear for security in 2017 (89.4%) than 2016 (75.8%), despite the Survey s restricted outreach in the province (figure 2.2). FEAR FOR PERSONAL SAFETY, BY PROVINCE Jawzjan Faryab Badakhshan Kunduz Balkh Samangan Sar-e-Pol Faryab Baghlan Herat Wardak Nangarhar Herat Kunar Nangarhar Logar Daikundi Paktya Khost Khost Ghazni Uruzgan Uruzgan Farah Farah Paktika Zabul Helmand Nuristan Kapisa Laghman Wardak Ghor Paktya Ghazni Baghlan Parwan Bamyan Kabul Logar Daikundi Badghis Kunar Kapisa Laghman Kabul Ghor Samangan Takhar Panjshir Nuristan Parwan Bamyan Badakhshan Kunduz Balkh Sar-e-Pul Panjshir Badghis Jawzjan Takhar Kandahar Nimroz Paktika Zabul 2016 >8 0% % % 41 50% 0 40% Helmand Nimroz Kandahar 2017 >8 0% % % 41 50% 0 40% FIG. 2.2: Q-17. How often do you fear for your own personal safety or security or for that of your family these days? Would you say you always, often, sometimes, rarely, or never fear for you and your family s safety? (Percent who respond always, often, or sometimes. ) Pashtuns remain the ethnic group most affected by insecurity, although fear for their personal safety has gradually decreased over the past three years, from 77.3% in 2015, to 75.8% in 2016, to 73.4% in Tajiks, on the other hand, have grown more insecure over the same period, rising from 59.8% in 2015, to 67.1% in 2016, to 72.2% in 2017, almost closing the gap between the two ethnicities. With levels comparable to 2016, Uzbeks (64.7%) and Hazaras (66.0%) feel relatively less insecure in 2017 than Pashtuns and Tajiks. As in 2016, more urban Afghans in 2017 fear for their safety (75.9%) than rural respondents (69.0%), a marked change from 2015, when the urban population trailed rural residents by 9.2 percentage points. The presence of armed opposition groups is felt more in rural areas than in urban areas, as 2.3% of rural respondents report armed opposition groups are providing security in their local area, compared to 0.3% in urban areas (see section 2.3, Perceptions of the Afghan National Security Forces ). Similar to previous years, respondents from regions where armed opposition groups are reported to provide security have higher levels of fear for their own or their families safety than respondents from areas controlled by the ANSF (figure 2.3). 44 AFGHANISTAN IN 2017
55 FEAR FOR PERSONAL SAFETY, BY SECURITY PROVIDER NATIONAL POLICE LOCAL POLICE NATIONAL ARMY ARMED OPPOSITION GROUPS 0% 10% 20% 30% 40% 50% 60% 70% 80% 90% 100% ALWAYS OFTEN SOMETIMES RARELY NEVER FIG. 2.3: Q-11. There are many security forces in the country. Which of these groups would you say is most responsible for providing security in your village/gozar? Q-17. How often do you fear for your own personal safety or security or for that of your family these days? Would you say you always, often, sometimes, rarely, or never fear for you and your family s safety? Apart from general concerns for personal safety, the Survey queries respondents on their fear of engaging in specific activities (figure 2.4). Again, the 2017 data do not diverge substantially from For example, 51.5% of Afghans in 2017 say they would feel at least some fear participating in elections, compared to 53.7% in Similarly, 71.8% of respondents in 2017, the same as in 2016, say they would fear participating in a peaceful demonstration, and 72.7% would feel fear running for public office, compared to 74.8% in Fear of travel fell slightly in 2017, from 81.5% in 2016 to 80.3%, but it remained high compared to earlier years, and the small improvement primarily reflects results from the East region, where fear of traveling dropped 9.6 percentage points in 2017, to 71.5%, the lowest level recorded in this year s Survey. Fear of encountering the ANP (43.3%) and the ANA (39.6%) fell slightly from 2016 (44.8% and 42.1%, respectively). The West region was an exception, where fear of encountering the ANP increased by 12.3 percentage points, to 65.3%, and fear of encountering the ANA increased by 7.9 percentage points, to 64.4%. Opposition forces remain a source of fear for the vast majority of Afghans, with 92.3% reporting some or a lot of fear of encountering the Taliban. Just a few provinces stand out for the notable proportion of respondents reporting no fear of encountering the Taliban, including Zabul (52.7%), Paktika (21.4%), and Helmand (20.6%). Paktika also merits attention for the 12.6% of respondents who say they would not fear encountering ISIS/Daesh, compared to 93.9% of Afghans overall who say they fear encountering ISIS/ Daesh. In other provinces with relatively little fear of the Taliban, no similar lack of fear of ISIS/Daesh can be discerned, supporting the general notion that ISIS/Daesh and the Taliban are competing opposition groups. SECURITY 45
56 Again, findings differ somewhat between the main sample and the intercept interviews, conducted with respondents from inaccessible areas. Intercept interviewees, for instance, are more often fearful than respondents from the main sample of participating in elections (67.7% vs. 51.5%) and running for public office (82.7% vs. 72.7%). Intercept interviewees are also more fearful than respondents from the main sample of encountering the ANA (57.2% vs. 39.6%) or the ANP (60.0% vs. 43.3%). CENTRAL/ KABUL LEVEL OF FEAR, BY ACTIVITY EAST SOUTH EAST SOUTH WEST WEST NORTH EAST CENTRAL/ HAZARAJAT NORTH NATIONAL AVERAGE % % % % % % % % % VOTING IN A NATIONAL/ PROVINCIAL ELECTION PARTICIPATING IN A PEACEFUL DEMONSTRATION RUNNING FOR PUBLIC OFFICE ENCOUNTERING ANP ENCOUNTERING ANA TRAVELING FROM ONE PART OF AFGHANISTAN TO ANOTHER ENCOUNTERING INTERNATIONAL FORCES (WESTERN MILITARY FORCES ONLY) ENCOUNTERING THE TALIBAN ENCOUNTERING ISIS/DAESH FIG. 2.4: Q-45. Please tell me how you would respond to the following activities or groups. Would you respond with no fear, some fear, or a lot of fear? (a) Voting in a national/provincial election. (b) Participating in a peaceful demonstration. (c) Running for public office. (d) Encountering ANP. (e) Encountering ANA. (f) Traveling from one part of Afghanistan to another part of the country. (g) Encountering international forces (Western military only). (h) Encountering the Taliban. (i) Encountering ISIS/Daesh. (Percent who report some or a lot. ) Levels of awareness of ISIS/Daesh suggest that the group s expansion in Afghanistan has stalled. Overall, awareness dropped from 81.3% in 2016 to 79.0% this year, with substantial declines of 16.7 points in Central/ Hazarajat and 8.1 points in the North East. ISIS/Daesh maintained high levels of awareness, however, in Central/Kabul (87.0%), the East (87.1%), and the South East (87.4%) (figure 2.5). 46 AFGHANISTAN IN 2017
57 AWARENESS OF ISIS/DAESH, BY REGION 100% 90% 80% 70% 60% 50% 40% 30% 20% 10% 0% CENTRAL/ KABUL EAST SOUTH EAST SOUTH WEST WEST NORTH EAST CENTRAL/ NORTH WEST HAZARAJAT FIG. 2.5: Q-18. Have you heard of the group called ISIS/Islamic State/Daesh? (Percent who say yes.) The perception of ISIS/Daesh as a local security threat has remained roughly unchanged, from 40.3% in 2015, to 38.9% in 2016, to 38.3% in Respondents who view ISIS/Daesh as a security threat have become fewer in four of the eight regions Central/Kabul, South West, West, and North East (figure 2.6). In the East, South East, and North West, responses suggest growing ISIS/Daesh activity in In the North West, there are rising threat perceptions in Jawzjan (up 21.1 percentage points), Sar-e-Pul (up 11.4 percentage points), and Faryab (up 21.1 percentage points). A more isolated case is Parwan, the only province in the North East region where perceptions of an ISIS/Daesh threat have increased, from 1.9% in 2016 to 32.9% in Ghazni (74.1%) and Paktika (45.1%) form another geographic cluster where ISIS/Daesh threat perceptions are trending upwards. Despite concerted efforts to degrade it, ISIS/Daesh also has managed to maintain its presence in the East region, where the threat assessment climbed by four percentage points, to 66.9%. In Nangarhar, a major ISIS/Daesh battleground, where the United States deployed its massive MOAB bomb against ISIS/Daesh strongholds in Achin district, 77.3% of respondents call ISIS/Daesh a threat, virtually unchanged from 74.8% in SECURITY 47
58 80% 70% 60% 50% 40% 30% 20% 10% 0% CENTRAL/ KABUL PERCEPTION OF ISIS/DAESH AS A THREAT, BY REGION EAST SOUTH EAST SOUTH WEST WEST NORTH EAST CENTRAL/ HAZARAJAT NORTH WEST FIG. 2.6: Q-19. (If Q-18 answer is yes ) In your view, does ISIS/Daesh currently pose a threat to the security of your district? (Percent who say yes.) 2.2 CRIME AND VIOLENCE KEY QUESTIONS Q-20. Have you or has anyone in your family suffered from violence or some criminal act in the past year? Q-21. (If Q-20 answer is yes ) If it is okay to ask, what kind of violence or crimes did you or someone in your family experience in the past year? Q-22. (If Q-20 answer is yes ) Were the crimes or violent acts reported to anybody outside your family, or not? Q-23. (If Q-22 answer is yes ) Who did you report the crime to? Anyone else? Q-24. If you were a victim of violence or any criminal act, how much confidence would you have that government law-enforcement organizations and judicial systems would punish the guilty party? Overall, the levels of violence and crime experienced by Afghans fell slightly in 2017, by 0.8 points, to 18.5%, but intercept interviews recorded higher levels in insecure areas (31.1%) than in 2016 (26.3%). In the South West, where inaccessibility is linked to the presence of opposition forces, more reports of violence and crime in intercept interviews (37.7%) than in the standard sample (29.6%) undermines the narrative that the Taliban enforce the rule of law more effectively in the areas under their control. Figures on crime and violence from 2017 reinforce previous findings that there is a limited correlation between perceptions of security and personal experience of violence. Crime and violence occur more frequently, for example, in rural areas (21.0%) than in urban areas (11.1%), yet fear for personal safety is higher among urban respondents. Furthermore, the difference in fear for personal safety between respondents who have experienced 48 AFGHANISTAN IN 2017
59 crime and those who have not (75.3% vs. 69.9%) has narrowed in 2017, from 10.4 percentage points in 2016 and 15.7 percentage points in Crime and violence continue to be most prevalent in the South West (29.6% of respondents), followed by the East (26.6%) and the South East (25.7%) (figure 2.7). 45% 40% 35% 30% 25% 20% 15% 10% 5% 0% EXPERIENCE OF CRIME OR VIOLENCE, BY REGION / CENTRAL/KABUL EAST SOUTH EAST SOUTH WEST WEST NORTH EAST CENTRAL/HAZARAJAT NORTH WEST FIG. 2.7: Q-20. Have you or has anyone in your family suffered from violence or some criminal act in the past year? (Percent who say yes.) There are no major changes this year in the types of crimes committed: physical assault (34.6%), livestock theft (20.6%), and racketeering (19.6%) continue to predominate. Murder (10.6%) and kidnapping (10.2%) also remain prominent, as do suicide attacks (16.0%). The incidence of various crimes reported in intercept interviews generally mirrors the standard sample, though violent or criminal acts by militants (12.5%) and the ANSF (9.0%) are somewhat more frequent, while suicide attacks (7.6%) are less frequent. Despite rule-of-law programs to strengthen judicial mechanisms, which have been a development priority in Afghanistan, patterns of crime reporting and the role of informal justice have been stable over the years. In 2017, similarly to previous years, 62.5% of respondents who were victims of crime say they reported it to an authority outside the family. The agencies to which they made their reports are also substantially the same: 50.7% went to the ANP, and 18.0% turned to the ANA (figure 2.8). Informal dispute resolution involving shuras and elders (34.9%), or maliks (village headmen) and tribal leaders (22.6%), also remains popular. SECURITY 49
60 60% 50% REPORTING CRIME TO INSTITUTIONS 40% % 20% 10% % AFGHAN NATIONAL POLICE SHURA/ ELDERS TRIBAL LEADER/ MALIK AFGHAN NATIONAL ARMY DISTRICT GOVERNOR/ WOLESWAL MULLAH SAHEB PROVINCIAL AUTHORITY COURTS JUST MY FAMILY PUBLIC LOCAL MILITIA DON'T KNOW PROSECUTOR (ARBAKAI) FIG. 2.8: Q-23. (If Q-22 answer is yes. ) Who did you report the crime to? 2.3 PERCEPTIONS OF THE AFGHAN NATIONAL SECURITY FORCES KEY QUESTIONS Q-11. There are many security forces in the country. Which of these groups would you say is most responsible for providing security in your village/gozar? Q-13. I m going to read some statements to you about the Afghan National Army (ANA). Please tell me if you agree or disagree with each statement. (Read out statement, wait for response, and then ask.) Would you say strongly, or somewhat? (a) The ANA is honest and fair with the Afghan people. (b) The ANA helps improve security in Afghanistan. (c) The ANA protects civilians. Q-14. I m going to read some statements to you about the Afghan National Police (ANP). ANP officers are the ones who wear solid blue-grey colored uniforms. Please tell me if you agree or disagree with each statement. (Read out statement, wait for response, and then ask.) Would you say strongly or somewhat? (a) The ANP is honest and fair with the Afghan people. (b) The ANP helps improve security in Afghanistan. (c) The ANP is efficient at arresting those who have committed crimes. Q-15. Now, please tell me if you think that the following need foreign support to do their job properly at the moment? Do you strongly agree, somewhat agree, somewhat disagree, or strongly disagree? (a) Afghan National Army. (b) Afghan National Police. (c) Afghan Local Police. Q-12. Compared with last year, do you think the [insert item] are getting better at providing security, getting worse, or is there no difference? (a) Afghan National Army. (b) Afghan National Police. (c) Afghan Local Police. 50 AFGHANISTAN IN 2017
61 In addition to its principal role, policing crime, the ANP is viewed as the primary provider of security. In 2017, 54.6% of Afghans 1.3 percentage points more than 2016 identified the ANP as most responsible for providing security in their community (figure 2.9). PERCEPTION OF WHO PROVIDES SECURITY IN THE LOCAL AREA 60% 50% % 30% 20% % 0% FOREIGN ARMIES NATIONAL ARMY LOCAL POLICE NATIONAL POLICE ARMED OPPOSITION GROUPS FIG. 2.9: Q-11. There are many security forces in the country. Which of these groups would you say is most responsible for providing security in your village/gozar? The ANA, in contrast, has lost 1.5 percentage points since 2016, and now ranks with the Afghan Local Police (ALP) (21.0% and 20.7%, respectively). Armed opposition groups (1.8%) hardly figure in the data, except in three provinces where they were prominent in last year s Survey Zabul (54.0%), Nuristan (12.1%), and Paktika (10.0%). Again, figures differ for inaccessible areas. Intercept interviews placed the relevance of the ANP as a security provider considerably lower, at 18.6%, while the ANA was named more frequently than in the standard sample, at 29.3%. The most significant difference, however, was the 21.0% of intercept interviewees overall who said armed opposition groups (AOGs) were the principal providers of security in their communities, including 41.3% in the South West and 25.5%, all from Kunduz, in the North East. Perceptions of the ALP s security role are more uneven, with higher numbers than the ANA in some provinces (Kunar 41.7%, Faryab 45.7%), and insignificant numbers in others (figure 2.10). Logar is the province where perceptions of the ALP s security role have changed the most this year, rising from 27.7% of respondents in 2016 to 64.1% in The ALP s patchy security role also shows up when one compares how the standard sample and intercept interviews rank the ALP and AOGs. In Paktika, for example, 34.8% of the standard sample, but just 19.0% of intercept interviews, identify the ALP as their primary security provider, while just 10.0% of the standard sample, but 33.3% of intercept interviews, name AOGs as their primary security provider. The ALP thus appears to be in direct competition with AOGs. In Kunduz, the standard sample and intercept interviews do not differ substantially on the ALP (standard, 19.1%; intercept, 21.2%), but they are starkly different on the ANA (standard, 45.7%; intercept, 21.2%) and the AOGs (standard, 0.3%; intercept, 51.9%). SECURITY 51
62 WHO PROVIDES SECURITY IN THE LOCAL AREA, BY PROVINCE ZABUL KUNAR LOGAR PAKTIKA WARDAK URUZGHAN LAGHMAN BADGHIS KUNDUZ FARYAB FARAH SAR-E-PUL HELMAND KHOST DAIKUNDI JAWZJAN PARWAN NANGARHAR NURISTAN TAKHAR PAKTIA KAPISA KANDAHAR HERAT GHAZNI GHOR BALKH BADAKHSHAN SAMANGAN BAGHLAN NIMROZ KABUL BAMYAN PANJSHIR 0% 10% 20% 30% 40% 50% 60% 70% 80% 90% 100% FOREIGN ARMIES ANA ALP ANP ARMED OPPOSTION GROUP DON'T KNOW PEOPLE THEMSELVES REFUSED FIG. 2.10: Q-11. There are many security forces in the country. Which of these groups would you say is most responsible for providing security in your village/gozar? Public perceptions of the ANP, which after 2014 declined in all categories of capacity and performance assessed by the Survey, have stabilized in The proportion of Afghans who strongly agree that the ANP helps improve security has stopped falling; a slight uptick of 2.0 percentage points can be seen this year in assessments that the ANP is efficient at arresting criminals; and those strongly agreeing that the ANP is honest and fair have increased by 7.2 percentage points over 2016 (figure 2.11). 52 AFGHANISTAN IN 2017
63 PERCEPTIONS OF THE AFGHAN NATIONAL POLICE 60% 50% 40% 30% 20% % 0% HONEST AND FAIR HELPS IMPROVE SECURITY EFFICIENT AT ARRESTING CRIMINALS FIG. 2.11: Q-15. I m going to read some statements to you about the Afghan National Police (ANP). ANP officers are the ones who wear solid blue-grey colored uniforms. Please tell me if you agree or disagree with each statement. (Read out statement, wait for response, and then ask.) Would you say strongly, or somewhat? (a) ANP is honest and fair with the Afghan people. (b) ANP helps improve security in Afghanistan. (c) ANP is efficient at arresting those who have committed crimes. (Percent who respond strongly agree.) Findings for the ANA in 2017 parallel those for the ANP, showing a 5.2-point gain since 2016 for honest and fair, a 4.6-point gain for helps improve security, and a 3.4-point gain for protects civilians (figure 2.12). PERCEPTIONS OF THE AFGHAN NATIONAL ARMY 70% 60% 50% 40% % 20% 10% 0% HONEST AND FAIR HELPS IMPROVE SECURITY PROTECTS CIVILIANS FIG 2.12: Q-14. I m going to read some statements to you about the Afghan National Army (ANA). Please tell me if you agree or disagree with each statement. Would you say strongly or somewhat? (a) SECURITY 53
64 The ANA is honest and fair with the Afghan people. (b) The ANA helps improve security in Afghanistan. (c) The ANA protects civilians. (Percent who strongly agree.) At first glance, it does not appear that any distinct factors are driving the positive trend in perceptions of the ANSF. The improvements are seen in all regions and most provinces. When urban and rural responses are compared, however, the positive trend appears to be predominantly urban, while rural perceptions remain closer to This may relate to the significantly higher rate of TV viewing among urban than among rural respondents, which is associated with more positive views about the ANA and the ANP (about 10 percentage points). Whether urban or rural, respondents who report watching TV are more likely than nonviewers to strongly agree that the ANA is honest and fair (63.2% vs. 53.3%), improves security (57.2% vs. 47.8%), and protects civilians (55.6% vs. 45.2%). TV viewers are also more likely than nonviewers to say the ANP is honest and fair (46.2% vs. 40.7%), improves security (41.2% vs. 35.9%), and is efficient at arresting criminals (37.5% vs. 30.5%). Provinces with the lowest confidence in the ANA and ANP are similar to previous years, mostly high-risk areas with a long-standing AOG presence (figure 2.13). CONFIDENCE LEVELS FOR AFGHAN NATIONAL SECURITY FORCES LOWEST CONFIDENCE HIGHEST CONFIDENCE AFGHAN NATIONAL POLICE AFGHAN NATIONAL ARMY AFGHAN NATIONAL POLICE AFGHAN NATIONAL ARMY ZABUL 30% ZABUL 35% BAMYAN 97% PANJSHIR 98% HELMAND 61% WARDAK 71% PANJSHIR 95% KUNAR 98% WARDAK 67% HELMAND 74% BADAKHSHAN 94% BAGHLAN 97% FARAH 70% GHOR 77% KUNAR 92% BAMYAN 96% FIG. 2.13: Q-15. I m going to read some statements to you about the Afghan National Police (ANP). ANP officers are the ones who wear solid blue-grey colored uniforms. Please tell me if you agree or disagree with each statement. Would you say strongly or somewhat? (a) The ANP is honest and fair with the Afghan people. (b) The ANP helps improve security in Afghanistan. (c) The ANP is efficient at arresting those who have committed crimes. Q-14. I m going to read some statements to you about the Afghan National Army (ANA). Please tell me if you agree or disagree with each statement. Would you say strongly or somewhat? (a) The ANA is honest and fair with the Afghan people. (b) The ANA helps improve security in Afghanistan. (c) The ANA protects civilians. (Average of respondents who agree strongly or somewhat to the three subquestions.) Afghans acknowledge the apparent positive trend in ANA and ANP job performance. A majority (57.7%) see the ANA getting better, and 48.2% say the same of the ANP (vs. 23.2% who say the ANP is getting worse ). Respondents are more divided over the ALP: 29.6% say they are getting better, 27.7% say they are getting worse, and 32.8% say they have not changed. The ALP continues to be well regarded in the East ( getting better, 46.3%), but approval has fallen in the North East, from 51.3% getting better in 2016 to 27.5% in 2017 (figure 2.14). 54 AFGHANISTAN IN 2017
65 PERCEPTIONS OF IMPROVEMENT IN AFGHAN NATIONAL SECURITY FORCES, BY REGION REGION ANA ANP ALP % % % % % % CENTRAL/KABUL EAST SOUTH EAST SOUTH WEST WEST NORTH EAST CENTRAL/HAZARAJAT NORTH WEST OVERALL FIG 2.14: Q-12. Compared with last year, do you think the [insert item] are getting better at providing security, getting worse, or is there no difference? (a) Afghan National Army. (b) Afghan National Police. (c) Afghan Local Police. (Percent who respond getting better. ) Despite the generally improving assessments of the ANA and ANP, Afghans still believe that the ANSF relies on foreign support. Some 86.1% of Afghans strongly or somewhat agree that the ANA requires outside support, up from 85.6% in 2016, and 84.4% believe the ANP needs foreign support, a 2.9-point increase over last year. Yet, 65.5% of Afghans, 4.8 percentage points fewer than in 2016, believe that the ALP needs foreign support: despite the ambivalent assessment of the ALP s performance, the Afghan public appears to grasp its more limited function within the ANSF. 2.4 PEACE AND RECONCILIATION KEY QUESTIONS Q-53. Do you think reconciliation between the Afghan government and the Taliban is possible, or impossible? Q-54. In your opinion, what is the main reason why the Taliban are fighting against the Afghan government? (Open ended: write down first answer.) Q-55a. Thinking about the reasons why the Taliban have been fighting during the past year, in general, would you say that you have a lot of sympathy, a little sympathy, or no sympathy at all for the Taliban? Q-55b. (If answer in Q-55a is a lot ) You said that you have a lot of sympathy. Why do you say that? Q-55c. (If answer in Q-55a is a little ) You said that you have a little sympathy. Why do you say that? Q-55d. (If answer in Q-55a is no sympathy ) You said that you don t have any sympathy. Why do you say that? Q-56. In your opinion, what is the main reason why ISIS/Daesh is fighting against the Afghan government? (Open ended: write down first answer.) SECURITY 55
66 Q-57a. Thinking about the reasons why Daesh has been fighting during the past year, in general, would you say that you have a lot of sympathy, a little sympathy, or no sympathy at all for Daesh? Q-57b. (If answer in Q-57a is a lot ) You said that you have a lot of sympathy. Why do you say that? Q-57c. (If answer in Q-57a is a little ) You said that you have a little sympathy. Why do you say that? Q-57d. (If answer in Q-57a is no sympathy ) You said that you don t have any sympathy. Why do you say that? Only limited trend analysis of confidence in the peace process is possible in 2017, as questions in the Survey have changed. Instead of focusing on how reconciliation might affect security and stability, the Survey now focuses on whether negotiations with the Taliban are possible. Only half of the Afghan population (52.3%) believes in 2017 that reconciliation with the Taliban is possible. Yet, responding to a different question in 2016, 62.9% of Afghans believed that reconciliation could help stabilize the country. Apparently, it is the actors motivations, not the desirability of negotiations, that Afghans see as a barrier to ending the conflict. Afghans from the East are most likely to believe reconciliation is possible (70.2%), followed by the South West (61.1%) and the South East (55.1%). Afghans from Central/Hazarajat (37.1%) are the least confident (figure 2.15). Intercept interviews show comparable results a similar overall confidence that reconciliation is possible (54.1%), led by the same regions (East 69.5%, South West 54.8%, and South East 68.1%) suggesting that Afghans in government- and Taliban-controlled areas agree in their assessment. The views of Taliban sympathizers are another sign of the fragmentation of attitudes towards reconciliation. A majority of respondents who reported a lot of sympathy or a little sympathy for the Taliban believe reconciliation between the Taliban and the Afghan government is possible (56.9% and 57.9%, respectively), while less than half of those who have no sympathy towards the Taliban do (45.8%). 56 AFGHANISTAN IN 2017
67 FIG 2.15: Q-53. Do you think reconciliation between the Afghan government and the Taliban is possible or impossible? (Percent who respond possible. ) As already indicated by the regional disparities in public perception, reconciliation with the Taliban involves a certain potential for conflict in itself. Afghans are divided in their confidence in reconciliation, both by gender and by ethnicity. Fewer women (47.3%) than men (57.3%) believe reconciliation is possible, a pattern that holds true in most regions. But ethnic divisions are the most striking. Nationally, Pashtuns (59.6%) are more likely to have confidence in the reconciliation process than Tajiks (49.6%), Uzbeks (42.5%), or Hazaras (42.1%). This ethnic divide is replicated regionally; for example, in the North East (Pashtuns, 60.3%; average, 48.8%), the North West (Pashtuns, 57.9%; average, 47.8%), and the South East (Pashtuns, 65.1%; average, 55.1%). An exception is the West, where Pashtuns are less likely to believe in the prospects for reconciliation (38.8%) than the regional average (53.8%). Independent of their views on the prospects for reconciliation, Afghans appear to have been losing sympathy for the struggle of armed opposition groups (figure 2.16). When asked about this last year, 77.1% of Afghans professed no sympathy, 40.7 percentage points more than in Those with a lot of sympathy declined by 16.1 percentage points during the same period, to 5.5%. The question was reworded in 2017 in order to gauge perceptions of the Taliban and Daesh separately from each other and from other insurgent groups. This year, 4.8% of Afghans overall express a lot of sympathy, and 10.9% express a little sympathy for the Taliban. Among intercept interviewees, however, the proportion declaring a lot of or a little sympathy for the Taliban is higher (10.4% and 18.0%, respectively). SECURITY 57
68 SYMPATHY FOR ARMED OPPOSITION GROUPS 90% 80% 70% 60% 50% 40% 30% 20% 10% 0% A LOT OF SYMPATHY A LITTLE SYMPATHY NO SYMPATHY AT ALL FIG 2.16: x77a. Thinking about the reasons why armed opposition groups have been fighting during the past year, in general, would you say that you have a lot of sympathy, a little sympathy, or no sympathy at all for armed opposition groups? Sympathy for the Taliban is mostly concentrated in the group s traditional strongholds in the South West, with close to a third of respondents expressing a lot of sympathy (13.7%) or a little sympathy (18.6%) for the group. Provincially, 41.5% of respondents in Wardak express a little or a lot of sympathy, 46.5% in Nuristan, and 63.8% in Zabul (figure 2.17). Even incorporating intercept interviews, however, no link emerges between the deterioration of security in the North West, noted earlier, and sympathy for the Taliban in that region. Public support for the Taliban remains comparatively low (12.9%) in the North West. 58 AFGHANISTAN IN 2017
69 SYMPATHY FOR THE TALIBAN, BY PROVINCE Jawzjan Faryab Badakhshan Kunduz Balkh Samangan Sar-e-Pul Takhar Baghlan Panjshir Badghis Kapisa Laghman Kabul Bamyan Herat Nuristan Parwan Wardak Ghor Kunar Nangarhar Logar Daikundi Paktya Khost Ghazni Uruzgan Farah Paktika Zabul Helmand Nimroz Kandahar >45% 11 45% 6 10% 0 5% FIG 2.17: Q-55a. Thinking about the reasons why the Taliban have been fighting during the past year, in general, would you say that you have a lot of sympathy, a little sympathy, or no sympathy at all for the Taliban? (Percent who respond a little or a lot of sympathy.) The Afghan public has increasingly viewed the armed struggle of opposition groups as politically motivated. Similarly this year, when asked about the main reason the Taliban are fighting against the Afghan government, almost one-third of Afghans see gaining power as the Taliban s primary motivation for fighting (figure 2.18). Another 18.1% attribute the fighting to support from foreign countries, including Pakistan (10.7%). Ideological justifications, such as the presence of foreign troops (6.4%), are cited less frequently. SECURITY 59
70 REASONS TALIBAN ARE FIGHTING AGAINST GOVERNMENT 35% 30% 30 25% 20% 15% 11 10% 5% % TO GAIN POWER THEY ARE SUPPORTED BY PAKISTAN THEY ARE SUPPORTED BY FOREIGN COUNTRIES DON'T KNOW PRESENCE OF FOREIGN TROOPS CORRUPTION IN THE GOVERNMENT WANTS TO OCCUPY AFGHANISTAN FIG 2.18: Q-54. In your opinion, what is the main reason why the Taliban are fighting against the Afghan government? While the Taliban still arouse some sympathy among the population, ISIS/Daesh lacks any substantial public support. The vast majority of Afghans (91.5%) declare themselves to have no sympathy at all for the group. Of the 2.6% overall who express some sympathy for ISIS/Daesh, most are in Wardak, where 15.9% express some sympathy for ISIS/Daesh, and in the West, in the provinces of Herat and Ghor (8.8% and 6.0%, respectively) (figure 2.19). Also of interest is the presence of ISIS/Daesh sympathizers in Khost province (6.0%). According to respondents, including their few supporters, the factors driving ISIS/Daesh s involvement in Afghanistan are the desire to gain power (19.5%) and support from foreign countries (12.3%) (figure 2.20). 60 AFGHANISTAN IN 2017
71 SYMPATHY FOR ISIS/DAESH, BY PROVINCE Jawzjan Faryab Badakhshan Kunduz Balkh Samangan Sar-e-Pul Takhar Baghlan Panjshir Badghis Kapisa Laghman Kabul Bamyan Herat Nuristan Parwan Wardak Ghor Kunar Nangarhar Logar Daikundi Paktya Khost Ghazni Uruzgan Farah Paktika Zabul Helmand Nimroz Kandahar >12% 10 12% 7 9 % 4 6 % 0 3% FIG 2.19: Q-57a. Thinking about the reasons why ISIS/Daesh has been fighting during the past year, in general, would you say that you have a lot of sympathy, a little sympathy, or no sympathy at all for Daesh? (Percent who respond a little or a lot of sympathy.) SECURITY 61
72 REASONS ISIS/DAESH ARE FIGHTING GOVERNMENT 25% 20% 19 15% % 5% % TO GAIN POWER THEY ARE SUPPORTED BY FOREIGN COUNTRIES THEY ARE SUPPORTED BY PAKISTAN THEY ARE AGAINST ISLAM PRESENCE OF FOREIGN TROOPS TO KILL INNOCENT PEOPLE DON'T KNOW FIG 2.20: Q-54. In your opinion, what is the main reason why ISIS/Daesh are fighting against the Afghan government? 62 AFGHANISTAN IN 2017
73 End Notes 1 United Nations Assistance Mission in Afghanistan (UNAMA), Protection of Civilians in Armed Conflict: Midyear Report 2017 (Kabul: UNAMA, July 2017), midyear_report_2017_july_2017.pdf. 2 Bill Roggio, Taliban seizes 3 districts from Afghan government, FDD s Long War Journal (blog), July 25, 2017, longwarjournal.org/archives/2017/07/taliban-seizes-3-districts-from-afghan-government.php. 3 Insecurity affects the Survey itself, limiting, potentially drastically, its geographic reach. In fact, data on Uruzgan and Kunduz in this year s Survey consists almost exclusively of interviews conducted in central districts of the two provinces. Comparative analysis of the main Survey sample and intercept interviews, conducted to complement the dataset, has become essential for a comprehensive understanding of security trends. Intercept interviews, for instance, provide an alternative perspective on Helmand, a main focus of insurgent activities in previous years. Security in Helmand seemingly improved in 2017, but with the main Survey sample limited to provincial center Lashkar Gah and neighboring Nahr-e Saraj, the more negative views of security expressed in the intercept interviews cannot be ignored when assessing trends in the province. From general security trends to subjects such as perceptions of the ANSF, attitudes towards reconciliation, and sympathy for opposition groups, intercept interviews are increasingly important as a window into the expanding realm of inaccessible areas in Afghanistan. 4 Taimoor Shah and Mujib Mashal, Afghan Province, Squeezed by Taliban, Loses Access to Medical Care, New York Times, September 23, 2017, 5 Mujib Mashal, Afghan Security Reforms Falter, With Tough Fighting Ahead, New York Times, April 8, 2017, com&gwh=d77a716184af63c234bfb62c2b5f23d3&gwt=pay. For a more detailed discussion of challenges to securitysector assistance in Afghanistan, see Special Inspector General for Afghanistan Reconstruction (SIGAR), Reconstructing the Afghan National Defence and Security Forces: Lessons from the U.S. Experience in Afghanistan (SIGAR, September 2017), Kate Clark, More Militias? Part 1: Déjà vu double plus with the proposed Afghanistan Territorial Army (Afghanistan Analysts Network, September 2017), 7 Borhan Osman, Peace With Hekmatyar: What does it mean for battlefield and politics? (Afghanistan Analysts Network, September 2016), 8 On Taliban expansion in the North, see, for instance, Non-Pashtun Taleban of the North (4): A case study from Jawzjan (Afghanistan Analysts Network, September 2017), 4-a-case-study-from-jawzjan/. 9 See, for instance, Sune Engel Rasmussen, Devastation and war that rages on: visiting the valley hit by Moab attack, Guardian, April 17, 2017, 10 In Nangarhar, 77.3% of respondents in 2017 say that ISIS/Daesh is a threat to their local community, compared to 74.8% in This widespread opinion may be due to the MOAB bomb and the perception that the presence of foreign insurgents puts local communities at risk from armed conflict with government and international forces. 11 Pamela Constable and Sayed Salahuddin, Afghan forces withdraw from key district in embattled Helmand province, Washington Post, March 21, 2017, 12 Intercept interviews are interviews with respondents traveling to or from an insecure or inaccessible district. Respondents are intercepted at bus stops, in hospitals, and in other places of transit. These are not a random sample, and are therefore excluded from the main statistics. Instead, they are used as a point of comparison to determine the direction of bias between respondents in the main sample, who are accessible for door-to-door survey fieldwork, and respondents living in inaccessible areas. 13 ANP is honest and fair (strongly agree): urban (2016, 38.9%; 2017, 47.8%); rural (2016, 36.5%; 2017, 43.2%). ANA is honest and fair (strongly agree): urban (2016, 60.2%; 2017, 68.7%); rural (2016, 52.9%; 2017, 57.0%). SECURITY 63
74
75 3 ECONOMIC GROWTH AND EMPLOYMENT Afghanistan exemplifies what has been called the conflict trap, a predictive association between poverty and insecurity. 1 Afghanistan s conditions of insecurity threaten its economic growth, and economic stagnation or recession increases the likelihood of insecurity. Those optimistic about Afghanistan s economic growth point to a 9.4% increase in gross domestic product (GDP) between 2003 and 2012, based on World Bank estimates. Starting in 2012, however, the annual GDP growth rate dropped, from 14.4% to 2.0% in 2013, and to 1.1% in 2015, before rising to 2.2% in The drop in GDP growth rate reflects economic shocks, specifically the shrinking international military footprint in Afghanistan and a decrease in international aid, alongside a resurgence in insecurity. Industries, businesses, and security apparatuses that rely on international funds face rising uncertainty. Meanwhile, growing insecurity has discouraged both domestic and international investment by increasing the costs and risks of doing business, particularly in the mining, transportation, logistics, and security sectors. According to available estimates, the poverty rate rose from 36% in 2012 to 39% in 2014, and unemployment more than doubled in that same period, reaching 22.6%. 3 Afghanistan has one of the highest child-labor rates in the world 27%, or 2.7 million children as a result of extreme poverty and high underemployment. 4 Afghanistan has also dropped several levels on the Human Development Index, an international measure of progress on indicators such as life expectancy, education, and per capita income. 5 Facing economic hardship, coupled with insecurity and uncertainty, many Afghans have left Afghanistan to seek economic opportunities elsewhere (see chapter 9, Migration ). Notably, one sector has benefitted from Afghanistan s rising insecurity and fragile economy: opium production, which peaked in 2014 and was still higher in 2016 than in the years prior to The growth in production has caused prices for illegal opiates to fall, contributing to epidemic levels of heroin use in many Western countries. Poppy production has also recently increased across the border in Pakistan, as Pakistani drug cartels have sought to expand their business beyond smuggling. The Afghan government has, nevertheless, achieved several milestones in its economic development agenda. It reported a record improvement in revenue last year, a result of stronger tax collection efforts. 7 In 2016, Afghanistan also became the 164th member of the World Trade Organization (WTO), a move expected to foster international trade. In the face of ongoing border tensions with Pakistan, its largest trading partner, that have disrupted trade between the countries, 8 the government is working to establish alternative trading routes, developing long-term plans for a trade corridor through Iran s Chabahar Port in the Gulf of Oman, 9 and opening an air-freight corridor with India, over protests from the government of Pakistan. 10 Insecurity remains the biggest challenge for the government s infrastructure agenda. Large regional projects such as the Turkmenistan-Afghanistan-Pakistan-India (TAPI) gas pipeline and the Central Asia South Asia (CASA-1000) power project have faced setbacks and delays due to security concerns. One exception is the Selma Dam, which was successfully completed and opened in 2016, but the dam continues to be targeted by insurgents. 11 ECONOMIC GROWTH AND EMPLOYMENT 65
76 The international community reaffirmed its commitment to assisting Afghanistan at the Warsaw Summit, in July, and the Brussels Conference, in October 2016, and the World Bank forecasts a modest, medium-term improvement in Afghanistan s growth rate. Meanwhile, the Survey finds that most Afghans are concerned about insecurity and unemployment, a pattern that has remained consistent throughout the past 10 years of polling. 3.1 OVERALL PERCEPTIONS OF THE ECONOMY KEY QUESTIONS Q-1. Overall, based on your own experience, do you think things in Afghanistan today are going in the right direction, or do you think they are going in the wrong direction? Q-2. (If Q-1 answer is right direction ) What are two reasons you think that Afghanistan is going in the right direction? Q-3. (If Q-1 answer is wrong direction ) What are two reasons you think that Afghanistan is going in the wrong direction? Q-4. In your view, what is going well in your local area? (Allow up to two mentions.) Q-5. In your view, what are the biggest problems in your local area? (Allow up to two mentions.) Q-6. In your view, what are the two biggest problems facing youth in your area? By youth, I mean people between the ages of 15 and 24. Q-7. What, if anything, is the biggest problem facing women in this area today? What is the nextbiggest problem? Economic concerns continue to color Afghan attitudes about the future of the country (figure. 3.1). Among the 61.2% of Afghans who say the country is moving in the wrong direction, unemployment (27.2%) is the second-most common reason cited (after security). Other reasons for overall pessimism include the poor economy (10.9%), lack of reconstruction (4.6%), and high prices (3.9%). When Afghans are asked to shift their frame of reference from national problems to local ones, economic issues become their primary concern. This pattern holds true in all previous years of the Survey. Afghans appear to want jobs for their community and security for the country. The most commonly cited local problem is unemployment (31.0%), followed by a lack of security and services. (See chapter 1, National Mood, for further reading on lack of security and services.) Some respondents do not mention unemployment but nevertheless express general economic concerns about, for example, the poor economy (6.5%), high prices (6.0%), and poverty (3.9%). As in previous years, when asked about the biggest problems for youth, Afghans overwhelmingly cite unemployment (70.6%); and when asked about the problems facing women, unemployment is the secondmost commonly cited (22.7%). Afghans are not entirely pessimistic, however: among the 32.8% of respondents who say the country is moving in the right direction, the most common reason for optimism is reconstruction/ rebuilding (34.4%). 66 AFGHANISTAN IN 2017
77 REASON FOR WRONG DIRECTION ECONOMIC CONCERNS, BY PROBLEM AREA UNEMPLOYMENT (27%), POOR ECONOMY (11%), LACK OF RECONSTRUCTION (5%), HIGH PRICES (4%) PROBLEM IN LOCAL AREA UNEMPLOYMENT (31%), POOR ECONOMY (7%), HIGH PRICES (6%), POVERTY (4%) PROBLEM FACING YOUTH UNEMPLOYMENT (71%), POOR ECONOMY (15%) PROBLEM FACING WOMEN UNEMPLOYMENT (23%), POVERTY (8%) FIG. 3.1: Q-3. (If Q-1 answer is wrong direction ) What are two reasons you think that Afghanistan is going in the wrong direction? Q-5. In your view, what are the biggest problems in your local area? (Allow up to two mentions.) Q-6. In your view, what are the two biggest problems facing youth in your area? By youth, I mean people between the ages of 15 and 24. Q-7. What, if anything, is the biggest problem facing women in this area today? What is the next-biggest problem? 3.2 HOUSEHOLD ECONOMIC SITUATION KEY QUESTION Q-8. Compared to one year ago, would you say that the situation for your household has gotten better, remained the same, or gotten worse with respect to the following? (a) Financial situation of your household. (b) Employment opportunities. (c) Availability of products in the market. (g) Electricity supply. A battery of questions assessing changes in the household economic situation are asked each year. Importantly, while each indicator can be analyzed on its own, Survey respondents should be understood as being patterned in their responses. A positive answer on one indicator tends to predict a positive response on others, while a negative answer on one is associated with negative answers on others. In each battery, the first question tends to color the respondent s answers to subsequent questions. For this battery, the first question, about household financial situation, is therefore of greater importance for interpretation than the others. Perception-based indicators of economic health have worsened since last year (figure 3.2). One-third of respondents (33.5%) report that the financial well-being of their household has declined compared to last year, while 20.3% report improvement, and 46.0% report no change. By comparison, in 2012, almost half of respondents (49.8%) reported improvement compared to the previous year, and only 6.9% reported being worse off. Overall, the perception of a worsening financial situation was more common among urban respondents (41.2%) than among rural respondents (30.9%), a pattern consistent with previous years. Likewise, perception of a worsening financial situation was most common in the Central/Kabul region (43.9%) and the Central/Hazarajat region (40.0%), and least common among respondents from the East (24.9%) and the South East (27.9%). More than half of respondents (58.1%) report that employment opportunities have worsened for them since last year, up significantly from 2012 (28.5%), but not significantly different from 2016 (59.9%). This drop is consistent with several macroeconomic indicators. For instance, Afghanistan s agricultural, service, and industrial sectors the three largest sectors for employment recorded declining activity between 2012 and 2016, except for positive growth in the agricultural sector in Afghans in urban areas report that ECONOMIC GROWTH AND EMPLOYMENT 67
78 employment opportunities have decreased since last year at a higher rate (63.8%) than Afghans living in rural areas (56.2%). One explanation for the urban-rural gap is the rapid urbanization in Afghanistan (average annual growth rate of 4.5% between 2000 and 2010) which has outpaced the expansion of job markets and industries. Notably, the region least likely to report worsening employment opportunities is the South West (50.3%), where poppy production remains robust. The perceived availability of products in the market improved slightly: 12.3% of respondents report improvement this year, compared to 10.4% in 2016, while 36.3% report worse availability of products, compared to 41.4% in % ECONOMIC INDICATORS: WORSE COMPARED TO ONE YEAR AGO 60% 40% 20% 0% FINANCIAL WELL-BEING AVAILABILITY OF PRODUCTS EMPLOYMENT OPPORTUNITIES ELECTRICITY SUPPLY FIG. 3.2: Q-8. Compared to one year ago, would you say that the situation for your household has gotten better, remained the same, or gotten worse with respect to the following? (a) Financial situation of your household; (b) Employment opportunities; (c) Availability of products in the market; (g) Electricity supply; (Percent who respond worse. ) 3.3 EMPLOYMENT KEY QUESTIONS D-3. Do you yourself do any activity that generates money? D-4. (If D-3 answer is yes ) And what type of activity is that? The Survey does not produce official employment or unemployment rates. 13 Rather, it asks general questions about involvement in economic activities to understand how employment is associated with other responses in the questionnaire. In 2017, 45.0% of Survey respondents report involvement in an economic activity that generates income, reflecting no significant change since last year. Economic engagement is more often reported among rural 68 AFGHANISTAN IN 2017
79 Afghans (45.6%) than Afghans living in urban areas (43.2%). Whereas the rural economy is characterized by agriculture, cities are characterized by jobs in the service sector. As expected, women are significantly less likely to report being engaged in income-generating activities (10.9%) than are men (79.2%). However, women living in urban areas are more likely to generate income (12.4%) than women in rural areas (10.5%). 14 The relationship is opposite for men, where 83.6% of men living in rural areas report involvement in income-generating activities, compared to 67.5% of men living in urban areas (figure 3.3). GENERATING INCOME, BY GENDER AND URBAN VS. RURAL 100% 80% 60% % 20% % MALE FEMALE RURAL URBAN FIG. 3.3: D-3. Do you yourself do any activity that generates money? (Percent who say yes.) Regionally, respondents from the North West are most likely to report earning income (52.3%), while South West respondents are least likely (42.6%). The regional variation is more pronounced by gender, with the highest rate of women involved in income-generating activities found in the West region (16.0%) and Central/ Hazarajat (13.8%). Women in the South West (8.1%) and South East (8.3%) are least likely to report earning income. Men s involvement is highest in the North West (89.3%) and South West (88.8%), and lowest in Central/Kabul (65.1%) and the South East (76.7%). ECONOMIC GROWTH AND EMPLOYMENT 69
80 MEN EARNING INCOME Jawzjan Balkh Kunduz Takhar Badakhshan Herat Badghis Faryab Ghor Sar-e-Pul K Samangan Baghlan Panjshir Nuristan Parwan Kapisa Kunar Bamyan Laghman a b u l Wardak Nangarhar Logar Daikundi Ghazni Paktya Khost Farah Uruzgan Zabul Paktika Nimroz Helmand Kandahar >90% 81 90% 71 80% 61 70% 51 60% 0 50% FIG. 3.4: D-3. Do you yourself do any activity that generates money? (Male respondents only) 70 AFGHANISTAN IN 2017
81 WOMEN EARNING INCOME Jawzjan Balkh Kunduz Takhar Badakhshan Herat Badghis Faryab Ghor Sar-e-Pul Samangan Baghlan Panjshir Nuristan Parwan Kapisa Kunar Bamyan Laghman Kabul Wardak Nangarhar Logar Daikundi Ghazni Paktya Khost Farah Uruzgan Zabul Paktika Nimroz Helmand Kandahar 41 50% 31 40% 21 30% 11 20% 0 10% FIG. 3.5: D-3. Do you yourself do any activity that generates money? (Female respondents only) Comparing provinces, men (figure 3.4) are most likely to report earning income in Samangan (97.9%) and Helmand (97.3%), and least likely in Badghis (57.2%) and Kabul (60.5%). Women (figure 3.5) are most likely to report earning income in Nuristan (40.7%) and Uruzgan (38.4%), while there are no women in this year s sample who report earning income in Kapisa and Wardak. Among those who earn an income, farming is the most common employment (40.3%, up from 38.4% last year). Farming is, of course, more common in rural areas (49.8%) than urban areas (10.1%), and more common among men (42.4%) than women (25.2%). While accounting for the largest number of employed, farming is associated, according to the Survey, with the lowest monthly incomes AFN 8,693 (USD 127), compared to the average income of AFN 11,857 (USD 173). Among women who report earning income, teaching in a school is the most commonly cited income-generating activity. This is true not only among women earning income in urban areas (45.1%), but also among women earners living in rural areas (27.3%). Besides farming, other occupations of rural Afghans include skilled worker or artisan (11.3%), which is pursued by twice as many women (20.0%) as men (10.1%). Carpet weaving, sewing, and embroidery are examples of skilled labor by women in rural Afghanistan. In urban areas, the most common income-generating activities, especially for men, are informal sales/business (20.8%), skilled worker/artisan (14.7%), and small-business ownership (13.6%). ECONOMIC GROWTH AND EMPLOYMENT 71
82 3.4 WOMEN AND THE ECONOMY KEY QUESTIONS D-8. Do female members of the family contribute to this household s income, or not? Q-71. Some people say that women should be allowed to work outside the home, while others say that women should not be allowed to work outside of the home. What is your opinion on this? The Survey points to some positive changes among Afghans in perceptions surrounding women s rights, including rights to economic and sociopolitical opportunities. Since the beginning of the Survey, respondents have been asked their opinion of women working outside the home. This year, a majority of Afghans (72.4%) support women working outside the home (comparable to last year s 74.0%). In a pattern consistent with last year, women (80.9%) are more likely to hold this view than men (63.9%), and urban Afghans (82.1%) are more likely than rural Afghans (69.2%, figure 3.6). The Survey also reveals a link between respondents support for women working outside the home and their level of education. While 66.2% of those with a primary education (one to six years of formal schooling) support women working outside the home, this figure rises to 77.5% among those who have attended university (see chapter 8, Women in Society ). SUPPORT FOR WOMEN WORKING OUTSIDE THE HOME 100% 80% % 40% 20% 0% MALE FEMALE RURAL URBAN FIG. 3.6: Q-71. Some people say that women should be allowed to work outside the home, while others say that women should not be allowed to work outside of the home. What is your opinion on this? (Percent who say women should be allowed.) When asked if female members contribute to their household income, one-fifth of respondents (20.1%) say a woman contributes to their household income, a significant increase from 13.6% in 2009, when the question was first introduced. 72 AFGHANISTAN IN 2017
83 Regionally, Afghans who live in the Central/Hazarajat and NorthWest regions are most likely to say a woman contributes to their household income (52.6% and 25.8%, respectively), while respondents in the South West and East regions are least likely to report a woman contributes to their household income (12.0% and 13.8%, respectively). Women contribute to their family s income in rates that vary across provinces, from the highest rates of 58.5% in Nuristan and 55.4% in Daikundi, to the lowest of 2.6% in Helmand and 3.5% in Wardak (figure 3.7) (see chapter 8, Women in Society, for more information on women s contribution to household income.) HOUSEHOLDS WHERE WOMEN CONTRIBUTE TO INCOME, BY PROVINCE Jawzjan Balkh Kunduz Takhar Badakhshan Herat Badghis Faryab Ghor Sar-e-Pul Samangan Baghlan Panjshir Nuristan Parwan Kapisa Kunar Bamyan Laghman Kabul Wardak Nangarhar Logar Daikundi Ghazni Paktya Khost Farah Uruzgan Zabul Paktika Nimroz Helmand Kandahar >50% 41 50% 31 40% 21 30% 11 20% 0 10% FIG. 3.7: D-8. Do female members of the family contribute to this household s income, or not? (Percent who say yes.) 3.5 HOUSEHOLD ASSETS KEY QUESTIONS D-5. How many of the following does your household have? (a) Bicycle. (b) Motorcycle. (c) Car. (d) Television. (e) Refrigerator. (f) Washing machine. (g) Sewing machine. (h) Jeribs of land. (i) Livestock (not poultry). D-15c. How many members of this household who live here have their own mobile phone? D-15a. Do you personally use a mobile phone, or not? ECONOMIC GROWTH AND EMPLOYMENT 73
84 To measure household welfare, respondents were asked to list various household assets they may own (figure 3.8). Compared to previous years, more Afghans than ever before report owning at least one TV (66.4% in 2017 vs. 61.3% in 2016), an increase seen both in rural areas (58.1% in 2017 vs. 54.0% in 2016) and urban areas (91.4% in 2017 vs. 83.2% in 2016). On the other hand, ownership of other tools and appliances is more or less unchanged from last year. TV OWNERSHIP 100% 80% % 40% % 0% RURAL URBAN FIG. 3.8: D-5. How many of the following does your household have? (d) Television. (Percent who report owning at least one of each.) Note: Trend line uses X-1b in the merged variable list , for comparison with D-5d. When asked how many members of their household have a mobile phone, 86.6% of Afghans report owning at least one, a slight decrease from 88.8% in This figure increases among urban Afghans, to 94.6%, and decreases to 84.0% among rural Afghans. When asked about personal mobile phone ownership, 62.0% say they own a personal mobile phone, including 78.3% of men and 45.7% of women. This year, 59.1% of Afghans report having at least one jerib of land (one jerib is equal to 2,000 square meters), unchanged since 2014, when the question was first introduced. Landholding is more common among rural Afghans than urban Afghans (72.7% and 17.8%, respectively). And in a pattern consistent with previous years, over half of respondents (51.7%) report owning one to 10 jeribs of land, while only 7.4% of Afghans report owning more than 10 jeribs. 74 AFGHANISTAN IN 2017
85 HOUSEHOLD LAND OWNERSHIP RURAL URBAN TOTAL % % % 0 JERIBS JERIBS JERIBS MORE THAN 20 JERIBS REFUSED DON'T KNOW FIG. 3.9: D-5. How many of the following does your household have? (h) Jeribs of land. (One jerib = 2,000 square meters.) Agriculture including livestock-related activities continues to be the backbone of the rural Afghan economy: 72.0% of those who live in rural areas report owning livestock other than poultry, compared to 13.8% in urban areas. Regionally, Afghans who live in the South East and Central/Hazarajat regions report the highest rates of livestock ownership (86.7% and 85.2%, respectively), while respondents in Central/Kabul report the lowest (29.9%). ECONOMIC GROWTH AND EMPLOYMENT 75
86 HOUSEHOLDS OWNING LIVESTOCK, BY PROVINCE Jawzjan Balkh Kunduz Takhar Badakhshan Herat Badghis Faryab Ghor Sar-e-Pul Samangan Baghlan Panjshir Nuristan Parwan Kapisa Kunar Bamyan Laghman Kabul Wardak Nangarhar Logar Daikundi Ghazni Paktya Khost Farah Uruzgan Zabul Paktika Nimroz Helmand Kandahar >8 0% % % 21 40% 0 20% FIG. 3.10: D-5. How many of the following does your household have? (i) Livestock (not poultry). (Percent who report having at least one livestock animal.) 3.6 HOUSEHOLD INCOME KEY QUESTION D-6. For statistical purposes only, can you estimate your average monthly household income? Respondents were asked to estimate their average monthly household income. This year, Afghans report an average monthly income of AFN 11,859 (USD 173), an increase from AFN 10,947 (USD 165) in The Survey reveals an association between where respondents live and their household income, with urban respondents earning an average of AFN 15,872 (USD 232) per month, and rural respondents earning an average of AFN 10,525 (USD 154) per month. Self-reported household income varies by region. Respondents in the South West region report the highest monthly income, at AFN 17,290 (USD 252), while residents of Central/Hazarajat report the lowest, at AFN 4,840 (USD 71). Uruzgan stands out as the province with the highest average monthly household income, at AFN 32,662 (USD 477). 76 AFGHANISTAN IN 2017
87 AVERAGE HOUSEHOLD INCOME, BY REGION $301 $ $ $ $ $51 $1 CENTRAL/ KABUL EAST SOUTH EAST SOUTH WEST WEST NORTH EAST CENTRAL/ NORTH WEST HAZARAJAT FIG. 3.11: D-6. For statistical purposes only, can you estimate your average monthly household income? D-7. (Ask if refused or don t know in D-6) If you are unsure of the actual monthly amount, what s the general range? Again, this is for your whole household. 3.7 WEALTH AND HAPPINESS KEY QUESTIONS D-16. In general, in your life, would you say you are very happy, somewhat happy, not very happy, or not at all happy? D-6. For statistical purposes only, can you estimate your average monthly household income? Being able to generate money, and a higher household income, are significantly associated with happiness. Those who report generating money and those who report a higher monthly household income are significantly more likely to be happy than those who do not generate money and have a lower monthly household income. However, the association of income with happiness becomes insignificant above USD 200 (AFN 13,677) per month. ECONOMIC GROWTH AND EMPLOYMENT 77
88 INCOME AND HAPPINESS $220 $ $ $ $ $120 $100 NOT AT ALL HAPPY NOT VERY HAPPY SOMEWHAT HAPPY VERY HAPPY FIG. 3.12: D-16. In general, in your life, would you say you are very happy, somewhat happy, not very happy, or not at all happy? D-6. For statistical purposes only, can you estimate your average monthly household income? D-7. (Ask if refused or don t know in D-6) If you are unsure of the actual monthly amount, what s the general range? Again, this is for your whole household. 78 AFGHANISTAN IN 2017
89 End Notes 1 Paul Collier, The Bottom Billion: Why the Poorest Countries are Failing and What Can Be Done About It (New York: Oxford University Press, 2008). 2 GDP growth (annual %): Afghanistan, World Bank, KD.ZG?end=2016&locations=AF&start= Christina Wieser, Ismail Rahimi, and Silvia Redaelli, Afghanistan Poverty Status Update: Progress at Risk (Washington, DC: World Bank Group, 2017), 4 Central Statistics Organization (CSO), Afghanistan Living Conditions Survey : National Vulnerability and Risk Assessment (Kabul: CSO, 2016), English%20-% pdf. 5 Table 2: Trends in the Human Development Index, , United Nations Development Programme, Human Development Reports, A brief definition of the HDI and a link to a technical note discussing how it is calculated can be found at the bottom of the web page. 6 United Nations Office on Drugs and Crime (UNODC) and Afghanistan Ministry of Counter Narcotics (MCN), Afghanistan Opium Survey 2016: Cultivation and Production (UNODC and MCN, December 2016), crop-monitoring/afghanistan/afghanistan_opium_survey_2016_cultivation_production.pdf. 7 William Byrd and M. Khalid Payenda, Revenue Growth in Afghanistan Continues Strong but Future Uncertain, Peace Brief 219 (Washington, DC: United States Institute of Peace, 2017), 8 Arwin Rahi, A Counterproductive Afghan-Pakistan Border Closure, Diplomat, March 20, 2017, com/2017/03/a-counterproductive-afghan-pak-border-closure/. 9 Indian [sic], Iran and Afghanistan sign trade corridor deal, Aljazeera, May 23, 2016, indian-iran-afghanistan-sign-trade-corridor-deal html. 10 Anjana Pasricha, India and Afghanistan Open Air Freight Corridor to Bypass Pakistan, VOA News, June 21, 2017, Insurgents Kill 10 Security Forces In Attack At Salma Dam In Afghanistan, RFE/RL s Radio Free Afghanistan, June 25, 2017, 12 World Bank, Afghanistan Economic Update, April 2015 (Washington, DC: World Bank, 2015), worldbank.org/bitstream/handle/10986/21894/afghanistan0economic0update.pdf?sequence=1&isallowed=y. 13 Employment rates are typically calculated as the proportion of working-age respondents who are employed, and employed persons are defined as age 16 or older (the Survey excludes respondents under age 18), who work for an employer or are selfemployed, are not volunteers, and are not engaged in self-service such as homemaking. Unemployment rates include persons age 16+ who are not engaged in any employment, who are available for work, and who are actively seeking work. 14 The precise figure for rural women, %, has been rounded to the nearest tenth, 10.5%, in the text, but it has been rounded to the nearest whole number, 10%, in figure Estimates are based on self-reported household income and do not constitute an official household income calculation. USD estimates assume an average July 2017 exchange rate of AFN to USD See Exchange Rates, Da Afghanistan Bank, ECONOMIC GROWTH AND EMPLOYMENT 79
90
91 4 DEVELOPMENT AND SERVICE DELIVERY In Afghanistan there have been notable gains in development: expected educational attainment at birth, just 2.5 years in 2000 under the Taliban, has risen to 10.1 years in 2017 Afghanistan had one million students in 2002; today it has 8.7 million students, 39% of them females. 1 And life expectancy at birth has increased from just 45.3 years in 2000 to 60.7 years in At the same time, the capacity to deliver services is critical for government legitimacy, and for Afghan welfare. 2 Despite insecurity and political challenges, both the Afghan government and its international partners have made long-term commitments to improve public services and build critical infrastructure. Many of these projects are public-private partnerships. In the past year, the Afghan government and international donors have undertaken new partnerships to increase the availability of electricity, build roads in rural areas, support city planning in strategic urban hubs, expand private-sector opportunities for the poor, improve food security, and support the settlement of refugees and returnees. 3 A July 2017 World Bank financing package of USD million for the Afghan Ministry of Finance includes contributions from the World Bank s International Development Association, a fund for the world s poorest countries, along with funds from the Afghanistan Reconstruction Trust Fund. 4 International donors are concerned that corruption is hobbling the public sector s ability to deliver services fairly and effectively. 5 A recent report by the Independent Joint Anti-Corruption Monitoring and Evaluation Committee revealed ongoing corruption in several service sectors, including education 6 and the provision of electricity. Ordinary electrical customers, for example, are often overcharged, while others, wielding influence, are given exemptions from payment. 7 Media sources indicate that hundreds of service-delivery projects have been delayed by political interference from government officials or power brokers seeking kickbacks and patronage. 8,9 Afghanistan s complex bureaucratic and regulatory systems often create inefficiencies that can be exploited. According to the Ministry of Economy, 156 service-delivery projects in various development sectors were stopped by the government in 2016, most for reasons of insufficient paperwork. 10 Some donors have responded to cases of undue influence by withdrawing funds. 11 Widespread insecurity, infrastructure deficits, a mountainous terrain, vulnerability to natural disasters and drought due to climate change, and a growing population pose additional complications that make Afghanistan one of the world s most challenging countries for service delivery. 12 This chapter explores the Afghan public s perceptions of electricity supply, health care, and education, and their awareness of local development projects. 4.1 ELECTRICITY SUPPLY KEY QUESTION Q-8. Compared to one year ago, would you say that the situation for your household has gotten better, remained the same, or gotten worse with respect to the following? (g) Electricity supply. Despite government initiatives to expand Afghanistan s electrical grid, public perceptions of the electricity supply have not significantly changed. Just 12.2% of respondents in 2017 say their electricity supply has improved in the past 12 months, while 43.4% say it has grown worse, a percentage identical to last year. This DEVELOPMENT AND SERVICE DELIVERY 81
92 unchanging perception is at odds with real improvements in the national grid, a consistent paradox across several years of the Survey, perhaps best explained as evidence that expectations for service delivery have risen. Afghans are increasingly concerned with the dependability and cost of electrical service, rather than with just basic access to the grid. Predictably, urban respondents are more likely than rural Afghans to report improved access to electricity (19.0% vs. 9.9%). Regionally, perceptions of electricity supply differ more dramatically. Respondents living in the North West are the most likely to say the electricity supply has improved (18.2%), while those in the South East are the least likely (3.4%). Comparing provinces, respondents in Kunduz are the most likely to say their electrical service has improved (25.7%), and those in Paktia the least (0.6%). In terms of dissatisfaction, Kunar harbors the most discontent, with 64.0% saying their electricity supply has grown worse over the past 12 months (figure 4.1). Importantly, some respondents may believe that answers to Survey questions will determine whether their area receives important services. Some respondents may therefore answer strategically, based on what they believe will maximize aid in their area. Because this response strategy is equally likely throughout the country, comparisons between provinces or regions remain meaningful. PERCEPTION OF IMPROVED ELECTRICITY SUPPLY, COMPARED TO 12 MONTHS AGO, BY PROVINCE Jawzjan Balkh Kunduz Takhar Badakhshan Herat Badghis Faryab Ghor Sar-e-Pol K Samangan Baghlan Panjshir Nuristan Parwan Kapisa Kunar Bamyan Laghman a b u l Wardak Nangarhar Logar Daikundi Ghazni Paktya Khost Farah Nimroz Helmand Uruzgan Kandahar Zabul Paktika >3 0% % % % 11 15% 6 10% 0 5% FIG. 4.1: Q-8. Compared to one year ago, would you say that the situation for your household has gotten better, remained the same, or gotten worse with respect to the following? (g) Electricity supply. (Percent who respond better. ) 82 AFGHANISTAN IN 2017
93 4.2 NUTRITION AND ACCESS TO HEALTH CARE KEY QUESTION Q-8. Compared to one year ago, would you say that the situation for your household has gotten better, remained the same, or gotten worse with respect to the following? (d) Quality of food in your diet. (f) Health/well-being of your family members. QUALITY OF FOOD While Afghanistan continues to rank low among nations in measures of health, education, and income, it has risen in the United Nations Human Development Index from 171 out of 187 countries in 2015 to 169 this year. 13 The Index rating of is substantially better than the rating in Meanwhile, life expectancy at birth has increased from just 45.3 years in 2000 to 60.7 years in Many key health indicators have improved faster in Afghanistan than in most other countries with similar levels of development. Contracting with nongovernmental organizations to provide health services has contributed to improvements in the quality and coverage of health care, improvements that have shown resilience in provinces experiencing high levels of insecurity. 14 Overall progress has been impressive, especially given the serious security situation, according to a senior director for health nutrition and population at the World Bank. 15 This year, there has been a slight increase in the percentage of Afghans who say the quality of food in their diet has gotten better, from 16.1% in 2016 to 16.6% in This is significantly lower, however, than the highest rate in the Survey s history, 40.9% in 2012, a period of relatively greater economic prosperity. More respondents in rural than urban areas say the quality of food has gotten better in the last year (17.2% vs. 15.0%), and there is little difference by gender (male, 16.2%; female, 17.1%). The South West experienced the biggest increase in the perception that food quality is improving, from 13.4% last year to 24.0% in Respondents in Central/Kabul are more likely to report that food quality is getting worse (34.6%), though significantly fewer respondents in Central/Kabul say this now than in 2008 (54.0%). There are significant differences between provinces: 38.4% of respondents in Helmand, for example, say food quality has gotten better, compared to just 7.0% in Kabul. In Zabul, 48.6% say it has gotten worse, and in Kabul, 41.9% (figure 4.2). DEVELOPMENT AND SERVICE DELIVERY 83
94 PERCEPTION OF DECREASED QUALITY OF FOOD IN DIET COMPARED TO 12 MONTHS AGO, BY PROVINCE Jawzjan Kunduz Balkh Faryab Samangan Sar-e-Pul Badakhshan Takhar Baghlan Panjshir Badghis Bamyan Herat Ghor Nuristan Parwan Kapisa Kunar Laghman Kabul Wardak Nangarhar Logar Daikundi Paktya Khost Ghazni Uruzgan Farah Paktika 2016 Zabul Helmand >50% 41 50% 31 40% 21 30% 11 20% 0 10% Kandahar Nimroz Jawzjan Faryab Kunduz Balkh Samangan Sar-e-Pul Badakhshan Takhar Baghlan Panjshir Badghis Bamyan Herat Ghor Nuristan Parwan Kapisa Kunar Laghman Kabul Kabul Wardak Nangarhar Logar Daikundi Paktya Khost Ghazni Uruzgan Farah Paktika Zabul Helmand Nimroz Kandahar 2017 >50% 41 50% 31 40% 21 30% 11 20% 0 10% FIG. 4.2: Q-8. Compared to one year ago, would you say that the situation for your household has gotten better, remained the same, or gotten worse with respect to the following? (d) Quality of food in your diet. (Percent who respond worse. ) 84 AFGHANISTAN IN 2017
95 HEALTH AND WELL-BEING OF FAMILY MEMBERS Along with asking respondents about the quality of food in their diet, the Survey asks whether the health and well-being of family members has changed over the past year. Overall, the perception that family members health is getting better has risen from 18.8% in 2016 to 19.6% this year. Since 2007, however, the trend has seen overwhelmingly downward, in some areas by more than 50 percentage points. Regionally, one in four respondents in the East (25.8%) say family members health has improved in the last year, compared to just 12.5% in Central/Hazarajat. By province, 45.5% of respondents in Paktika, the leader in this measure, say family health is improving. This is in stark contrast to the 50.1% of respondents in Badghis who say family health has gotten worse. 4.3 EDUCATION KEY QUESTIONS Q-8. Compared to one year ago, would you say that the situation for your household has gotten better, remained the same, or gotten worse with respect to the following? (h) Access to schools. D-10a. How many years, if any, have you studied at an Islamic madrasa? D-10b. What is the highest level (grade) of school you have completed, not including schooling at an Islamic madrasa? (Calculate the highest level, in years.) In 2001, the Afghan public education system was undoubtedly very different for its one million, mostly male students. Enrollment has since risen dramatically, to 8.7 million students, 39% of them female, and young female students from Afghanistan are attracting notice internationally for example, in international science competitions. 16 Educational attainment among adults, however, is still low: just under half of all Afghan adults in the 2017 Survey (48.4%) report no formal schooling. This includes over one-third of men (34.3%) and nearly two-thirds (62.4%) of women (figure 4.3). Looking more closely, 15.8% of respondents say they have attended primary school, 25.8% secondary school or high school, and 7.9% university. Survey respondents overall report an average of 4.7 years of formal education. When the data is disaggregated by gender, males report higher levels of education across all levels (figure 4.3). The most significant gender gap occurs at the high school level, where male participation exceeds female participation by more than twofold (26.5% vs. 11.8%). In a positive development since 2016, the number of unschooled men and women has decreased by 3.4% and 3.9%, respectively. The national average for formal education is 4.6 years 2.9 years for women and 6.2 years for men. Rural Afghans on average receive 3.8 years of education, urban Afghans 6.9 years. DEVELOPMENT AND SERVICE DELIVERY 85
96 HIGHEST LEVEL OF EDUCATION, BY GENDER 70% 66 60% 50% 40% 30% 20% 10% % NO EDUCATION PRIMARY SCHOOL (PARTIAL OR COMPLETE) SECONDARY SCHOOL (PARTIAL OR COMPLETE) HIGH SCHOOL (PARTIAL OR COMPLETE) UNIVERSITY EDUCATION (PARTIAL OR COMPLETE) MALE FEMALE FIG. 4.3: D-10b. What is the highest level (grade) of school you have completed, not including schooling at an Islamic madrasa? Among Afghanistan s regions, the highest concentration of respondents who have received a university education, 14.4%, is in Central/Kabul. This compares to just 2.5% in the South West (figure 4.4). UNIVERSITY EDUCATION, BY REGION 16% 14% 14 12% 10% 8% 6% 4% % 0% CENTRAL/ KABUL EAST SOUTH EAST SOUTH WEST WEST NORTH EAST CENTRAL/ HAZARAJAT NORTH WEST FIG. 4.4: D-10b. What is the highest level (grade) of school you have completed, not including schooling at an Islamic madrasa? (Percent who report at least 13 years of education.) In addition to formal education, which includes government, and some private, schools, many Afghans receive informal educations at madrasas, religious educational institutions. This year, 45.4% of respondents say they spent at least one year studying at a madrasa (up from 45.1% in 2016), and 24.3% of them say they spent two to three years (figure 4.5). As in previous Surveys, there is a positive association between number of years in a madrasa and sympathy for the Taliban AFGHANISTAN IN 2017
97 YEARS STUDIED IN ISLAMIC MADRASA 60% 55 50% 40% 30% 20% 16 10% % NONE 1 YEAR 2 YEARS 3 YEARS 4 YEARS 5 YEARS MORE THAN 5 YEARS FIG. 4.5: D-10a. How many years, if any, have you studied at an Islamic madrasa? While there are no differences across the rural-urban divide, there is a significant gender gap: 56.2% of males, but just 34.7% of women, say they have received at least one year of madrasa education. Also of note, the ratio of madrasa education to formal education decreases with the age of the cohort. Among major ethnic groups, 43.0% of Hazaras, 43.8% of Tajiks, 45.9% of Pashtuns, and 57.4% of Uzbeks say they received at least one year of madrasa schooling. The lowest regional rate of madrasa education is in Central/Hazarajat (26.9%), and the highest in the North East (58.1%) (figure 4.6). YEARS STUDIED IN ISLAMIC MADRASA, BY REGION 80% 70% 60% 50% 40% 30% 20% 10% 0% CENTRAL/ KABUL EAST SOUTH EAST SOUTH WEST WEST NORTH EAST CENTRAL/ HAZARAJAT NONE 1 2 YEARS 3 4 YEARS MORE THAN 4 YEARS NORTH WEST FIG. 4.6: D-9. How many years, if any, have you studied at an Islamic madrasa? DEVELOPMENT AND SERVICE DELIVERY 87
98 In terms of access to schools, 22.2% of Afghans in 2017 say it has gotten better, as did 22.5% last year. Improvement is noted more among urban (27.7%) than rural respondents (20.4%), perhaps due to the effect of increasing insecurity in rural areas on school closures. The most significant differences, however, can be noted regionally. Respondents in the North East, for example, are the most likely to say that access to schools is improving (28.8%), while a third of respondents in the South West region say access to schools has worsened (33.8%). More pronounced differences can be seen in the East, where more than half of respondents in Kunar (52.4%), the most in the region, say access to schools has improved, while nearly two-thirds of respondents in Zabul (62.6%) report that access to schools has deteriorated, the worst in the region. The declining state of education may reflect the high volatility and insecurity of Zabul: of the 226 general-education schools in the province, 162 are currently closed due to security threats. 18 Overall, a majority of Afghans (82.3%) support equal opportunities for girls in education. Support is particularly high for women to pursue madrasa studies (94.3%), primary education (87.5%), and high school (84.5%). Fewer Afghans support women seeking a university education in another province (47.2%), but support is strong for university education in a woman s home province (73.3%). Only 36.5% of respondents support women studying abroad on a scholarship. Urban, female, and more-educated respondents are more likely to support education for women at all levels. (See chapter 8, Women in Society. ) 4.4 AWARENESS OF DEVELOPMENT PROJECTS KEY QUESTION Q-9. I am going to read a list of projects that may or may not have been implemented in your area. Please tell me if there has been this type of project in your area in the last 12 months. (a) Reconstruction/building of roads or bridges. (b) New government school opening. (c) New private school opening. (d) New private university. (e) Drinking-water project (e.g., new wells, hand pumps, tank system, reservoir). (f) Irrigation project. (g) Government-supplied electricity. (h) Health care (primary health center, regular visits of doctors, etc.). (i) Reconciliation with antigovernment elements. (j) Programs in agriculture. (k) New factories opened. (l) Building new mosques. While the 2016 Survey found an increase in public awareness in every category of development project, increases this year are small. In the last 12 months, public awareness of the following projects increased: new private schools (16.1%, up 1.4 percentage points), irrigation projects (17.2%, up 0.3 percentage points), health-care projects (22.4%, up 1.1 percentage points), agricultural programs (20.3%, up 0.5 percentage points), and new factories opening (5.2% up 0.3 percentage points). As in 2016, the highest rates of awareness this year are of projects to build or repair roads and bridges (33.9%, down 0.4 points), new mosques (29.9%, down 0.9 points), and drinking-water projects (24.5%, down 1.9 points). The biggest increase in awareness, of new private schools opening, is just 1.4 percentage points, from 14.7% to 16.1%. Overall, there is little change in awareness of development and infrastructure projects in 2017, particularly when compared to six years ago, when international and military aid expenditure was at its peak (figure 4.7). 88 AFGHANISTAN IN 2017
99 AWARENESS OF DEVELOPMENT PROJECTS IN LOCAL AREAS 100% 80% 60% 40% 20% 0% RECONSTRUCTION/BUILDING OF ROADS OR BRIDGES NEW GOVERNMENT SCHOOL OPENING NEW PRIVATE SCHOOL OPENING NEW PRIVATE UNIVERSITY DRINKING-WATER PROJECT IRRIGATION PROJECT GOVERNMENT-SUPPLIED ELECTRICITY HEALTH-CARE PROJECT RECONCILIATION WITH ANTIGOVERNMENT ELEMENTS AGRICULTURAL PROGRAM NEW FACTORY NEW MOSQUE FIG. 4.7: Q-9. I am going to read a list of projects that may or may not have been implemented in your area. Please tell me if there has been this type of project in your area in the last 12 months. (a) Reconstruction/building of roads or bridges. (b) New government school opening. (c) New private school opening. (d) New private university. (e) Drinking-water project (e.g., new wells, hand pumps, tank system, reservoir). (f) Irrigation project. (g) Government-supplied electricity. (h) Health care (primary health center, regular visits of doctors, etc.). (i) Reconciliation with antigovernment elements. (j) Programs in agriculture. (k) New factories opened. (l) Building new mosques. (Percent who say yes in each category.) AWARENESS OF ELECTRICITY PROJECTS Afghanistan s use of electricity is among the lowest in the world, at just 100 kilowatt hours per year per capita, and just 30% of the Afghan population is connected to the nation s electrical grid. In addition to various import solutions, Afghanistan is working with the public and private sectors to develop a combination of domestic fossil-fuel, hydropower, and renewable-energy projects to meet the increasing demand for energy. 19 For example, the USD 60 million Herat Electrification Project, announced in the summer of 2017, will bring electricity to households, institutions, and businesses throughout that province. 20 DEVELOPMENT AND SERVICE DELIVERY 89
100 Only 16.5% of Afghans this year say they are aware of a government project in their area in the past 12 months to provide electricity, a figure unchanged since last year (17.0%). More than twice as many urban respondents as rural respondents are aware of electricity projects in the last year (27.4% vs. 12.8%). Regionally, the level of awareness is highest in the North West (25.6%) and North East (22.8%), which border Uzbekistan, Tajikistan, and Turkmenistan, the three energy-rich Central Asian countries that export electricity to Afghanistan. In the North East, the level of awareness has increased by 4.6 percentage points since last year, while in the North West, awareness has declined by 3.6 percentage points. A fifth of respondents in Central/Kabul also report becoming aware of government electricity projects in the past year, a 4.2-point decrease since The lowest regional awareness of government electricity projects is in Central/Hazarajat (4.5%), as it was last year (3.3%). Residents of the South West report the greatest increase in awareness of government electricity projects since last year from 9.1% to 14.1%, 5.0 percentage points. Consistent with last year, the provinces with the highest levels of awareness of government electricity projects are Kunduz, in the North East (53.4%), Faryab, in the North West (41.9%), and Laghman, in the East (34.5%). The level of awareness in Kunduz is significantly higher this year (54.4%) than in 2016 (37.7%). No respondents in Zabul, Paktia, and Kunar and fewer than 2% in Khost, Panjshir, Ghazni, and Bamyan report awareness of a government electricity project in their area in the past 12 months. These provinces tend to depend on local, private, or donor-funded measures, such as small hydro dams or solar panels, for electricity. Over half of respondents in Zabul (56.0%), Uruzgan (56.0%), and Ghor (54.9%) report their electricity supply has worsened since last year. The most complaints, however, come from Kunar (64.0%) and Badghis (59.8%). AWARENESS OF HEALTH PROJECTS Consistent with efforts by the Ministry of Public Health to prioritize public health education, improve access to health care, and build the capacity of the health-care system, national awareness of health-care projects increased by 1.1 percentage points this year, to 22.4%, with greater levels of awareness in rural areas (23.6%) than urban areas (18.9%). Patterns of awareness vary significantly by region. Awareness of a local health-care project in the last year is highest in the East (37.2%), South West (33.0%), and South East (31.2%). It is lowest in the Central/Hazarajat region (12.4%) and Central/Kabul (15.2%). The variation is greater at the provincial level. The highest levels of awareness are in Paktika (69.1%) and Laghman (53.3%), while the lowest are in Jawzjan (4.1%), Zabul (4.4%), and Panjshir (5.7%). AWARENESS OF IRRIGATION AND AGRICULTURE PROJECTS Many parts of Afghanistan are plagued by drought, and water for irrigation is a necessity. The public s awareness of new irrigation projects continues to rise in 2017, from a low of 13.1% in 2015 to 17.2% this year. Awareness is particularly high in the East (31.5%) and particularly low in Central/Hazarajat (7.4%) and Central/Kabul (9.0%). Laghman (48.5%) and Helmand (37.0%) show the highest rates of awareness among the provinces. Awareness of new agricultural projects in 2017 is about the same as 2016 (20.3% and 19.8%, respectively) but higher than 2015 (16.5%). As with irrigation projects, awareness of agricultural projects is highest in the East (30.9%) and lowest in Central/Kabul (9.1%). Kunar (46.0%), Samangan (45.4%), and Laghman (45.1%) have the greatest awareness of irrigation projects among the provinces. 90 AFGHANISTAN IN 2017
101 AWARENESS OF ROADS BEING CONSTRUCTED For the past few years, the construction of roads and bridges has ranked higher in the public awareness than all other development projects in the Survey, including schools, health care, drinking water, electricity, and mosques. Like last year, at least one in three respondents in 2017 (33.9%) are aware of a project to build or repair roads or bridges in their community. Awareness of projects in this category is highest in the East (41.1%) and lowest in the West (29.6%). Among the provinces, respondents in Paktika, Logar, and Wardak report the highest levels of awareness of a road or bridge project in their local area (75.6%, 69.5%, and 59.9%, respectively). There is not much difference in the level of awareness of these projects between urban and rural respondents (36.1% and 33.2%, respectively). AWARENESS OF GOVERNMENT SERVICES, CONFIDENCE IN THE NUG, AND OPTIMISM Multivariate analysis reveals a positive association between effective public services and optimism about the direction of the country. Afghans who report improvements in their or their family s health and well-being, access to electricity and schools, and employment opportunities are more likely to be optimistic about their country (see chapter 1, National Mood ). They are also more likely to have positive views of the performance of the NUG. Similarly, awareness of local development projects such as new public schools, irrigation and drinking-water projects, and new factories is also associated with more positive views of the NUG (figure 4.8) 21 (see chapter 5, Governance ). 25% EFFECT OF LOCAL DEVELOPMENT PROJECTS ON NATIONAL MOOD: CHANGE IN OPTIMISM, BY PROJECT 20% 15% % 6 5% 0% ROADS OR BRIDGES NEW GOVERNMENT SCHOOL NEW PRIVATE SCHOOL NEW PRIVATE UNIVERSITY DRINKING WATER PROJECT IRRIGATION PROJECT GOVERNMENT- SUPPLIED ELECTRICITY HEALTH CARE RECONCILIATION AGRICULTURAL PROGRAMS NEW FACTORY NEW MOSQUES FIG. 4.8: Q-1. Overall, based on your own experience, do you think things in Afghanistan today are going in the right direction, or do you think they are going in the wrong direction? Q-9a/l. Please tell me if there has been this type of project in your area in the last 12 months. (a) Reconstruction/building of roads or bridges. (b) New government school opening. (c) New private school opening. (d) New private university. (e) Drinking-water project (e.g., new wells, hand pumps, tank system, reservoir). (f) Irrigation project. (g) Government-supplied electricity. (h) Health care (primary health center, regular visits of doctors, etc.). (i) Reconciliation with antigovernment elements. (j) Programs in agriculture. (k) New factories opened. (l) Building new mosques. (Difference, in percentage points, in the proportion of respondents who say the country is moving in the right direction, compared to those who are aware and those who are unaware of a local development project in each category. A positive number indicates an increase in optimism.) DEVELOPMENT AND SERVICE DELIVERY 91
102 End Notes 1 Afghanistan: Helping Support Growth and Stability, World Bank, June 7, 2017, results/2017/06/07/afghanistan-helping-support-growth-stability. 2 Seth Kaplan, Fragile States, Fractured Societies, chap. 3 in Fixing Fragile States: A New Paradigm for Development (London: Praeger Security International, 2008). 3 World Bank, Government of Afghanistan Signs $482.3 million New Financing, press release, July 12, 2017, worldbank.org/en/news/press-release/2017/07/12/government-of-afghanistan-signs-new-financing-package. 4 Ibid. 5 Independent Joint Anti-Corruption Monitoring and Evaluation Committee (MEC), Quarterly Report to the People of Afghanistan (MEC, August 2017), 6 Ibid. 7 Ibid. 8 Ibid. 9 Tamim Hamid, Hundreds of Development Projects Remain in Limbo, Tolo News, June 17, 2017, com/business/report-reveals-hundreds-development-projects-remain-limbo. 10 Ibid. 11 Zabihullah Jahanmal, UK Suspends Funding to NGO Project Over Alleged Interference, Tolo News, July 25, 2017, World Bank, Growth and Stability. 13 Human Development Reports: Afghanistan, United Nations Development Programme (UNDP), October 25, 2017, 14 World Bank, Strong Progress but Challenges Remain in Health Sector in Afghanistan, press release, June 1, 2017, worldbank.org/en/news/press-release/2017/06/01/strong-progress-but-challenges-remain-in-health-sector-in-afghanistan. 15 Ibid. 16 Emily Cochrane, Afghan Girls Robotic Team Wins Limelight at Competition, New York Times, July 18, 2017, nytimes.com/2017/07/18/world/asia/afghanistan-girls-robotics-visas-trump.html. 17 Nonparametric Kruskal-Wallis test (p = ), and one-way ANOVA (p = ). 18 Government of Afghanistan, Ministry of Education. GPE Program: Zabul. (n.d) --afghanistan/zabul 19 Asian Development Bank (ADB), Sector Assessment (Summary): Energy (ADB, n.d.), linked-documents/ ssa.pdf. 20 World Bank, New Financing. 21 Ordered logit regression was used to regress the views about NUG (q52a) on gender (d1), age (d2), income (d6 and d7), education (d10), urban/rural (m6b), a household condition scale (alpha= 0.75), fear for personal safety (q17), perception of ANSF scale (alpha= 0.67), employment status (d3), confidence about outcome of reconciliation between government and the Taliban (q53), perception of influence over local government s decisions (q47), experience-of-corruption scale (alpha= 0.85), awareness of development projects (battery questions q9 s). The model was weighted by population distribution of urban/ rural, province, and gender (MergeWgt10 in the dataset). The full model explained 4.7% of all variance in the perceived direction of Afghanistan (R2=.0474, p<.001). 92 AFGHANISTAN IN 2017
103
104
105 5 GOVERNANCE The political challenges that followed the formation of the National Unity Government (NUG) have continued into its third year. From what started as disagreements over the appointment of officials to exploring its original goals of the government now have serious implications for the balance of power, legitimacy of the executive and government reform. 1 More than half of Afghans surveyed (56.2%) believe the NUG is doing a good job, a 7.1-percentage-point increase over Perceptions of provincial governments showed similar improvement, and urban respondents satisfaction with municipal government also rose this year. Also, confidence in the Independent Election Commission (IEC), community development councils, and community shuras/jirgas all went up this year. Electoral reform was one of the main elements in the agreement establishing the NUG, including a commitment to establish a Special Election Reform Commission (SERC), 2 but the deadline for parliamentary and district council elections, October 15, 2016, could not be met due to the complexities of preparations at all levels. 3 The election will now be held on July 7, 2018, according to the IEC. 4 Electoral controversies have often caused political turmoil in Afghanistan, and should the same happen in the 2018 parliamentary and district council elections, there could be consequences for the 2019 presidential election. Reforming the electoral system and fixing the voter registration system will be crucial for a successful election in 2018, and perhaps for the success of the 2019 presidential contest. Political fractures and the growth of an opposition within the government will remain a major challenge for the NUG in the coming year. While in many countries the political opposition serves to hold governments accountable, an opposition within the Aghan government, with its roots in the origins of the formation of the NUG, has the potential to seriously hinder government effectiveness. Afghanistan made progress in the 2016 Corruption Perception Index (CPI), rising to 169 th out of 176 countries listed in 2016, up from 166 th out of 167 countries listed in Many efforts were made to build a capable, accountable, and responsible government, improve economic governance, and strengthen public financial management. 5 Despite the effort and commitment, 6 experts still see weaknesses in the current system, including duplication of functions, lack of independence, weak legal frameworks, inadequate budgets, limited staff capacity, and a lack of coordination. 7 In 2017, 69.8% of Afghans still perceive corruption as a major challenge in their daily lives, a significant increase from last year (61.0%). This chapter explores Afghan perceptions of corruption both at the national level and in their daily lives dispute resolution and perceptions of local justice, confidence in government institutions, and how public opinion has changed over time. GOVERNANCE 95
106 5.1 SATISFACTION WITH GOVERNMENT PERFORMANCE KEY QUESTION Q-52. Thinking of the different levels of government in Afghanistan, do you think that overall the [insert item], is doing a very good job, a somewhat good job, a somewhat bad job, or a very bad job? (a) National Unity Government. (b) Provincial government. (c) Municipal authorities (ask urban residents only). (d) District government (ask rural residents only). After a two-year decline in the Afghan public s assessment of the performance of various government institutions, including a historic decline in 2016, opinions have rebounded slightly this year (figure 5.1). More than half of Afghans surveyed (56.2%) believe the NUG is doing a good job (15.2% very good, 41.0% somewhat good ), a 7.1-point increase over 2016 (49.1%). Perceptions of provincial governments showed similar improvement, with 56.9% of Afghans judging their performance very good or somewhat good. Urban respondents satisfaction with municipal government rose this year, from a record low of 42.4% in 2016 to 47.2% in Rural respondents, on the other hand, report higher levels of satisfaction with district governments in this year (50.7% in 2016, 55.8% in 2017). Women and men report similar levels of satisfaction with the NUG (55.7% and 56.8%, respectively). Rural respondents (57.4%) are slightly more likely to express satisfaction with the NUG than are urban respondents (56.8%). Afghans in the East region (83.2%) are the most likely to say the NUG is doing a somewhat good or very good job, while Afghans in the North West are the least likely (41.1%). Pashtuns (66.4%) are more likely than Tajiks (53.3%), Hazaras (46.8%), and Uzbeks (41.1%) to say they are satisfied with the performance of the NUG. After a sharp decline to 52.9% in 2016, 56.9% of Afghans this year report satisfaction with provincial governments. Rural respondents (57.8%) are more likely than urban respondents (54.2%) to say their provincial government has done a somewhat good or very good job. The highest levels of satisfaction with provincial government are in Panjshir (77.6%), Kandahar (77.2%), Laghman (77.1%), and Nangarhar (74.0%). The lowest are in Zabul (32.6%), Ghor (40.3%), Kabul (43.8), and Faryab (43.8%). 96 AFGHANISTAN IN 2017
107 SATISFACTION WITH GOVERNMENT PERFORMANCE 90% 80% 70% 60% 50% 40% 30% 20% 10% 0% / NATIONAL UNITY GOVERNMENT MUNICIPAL AUTHORITY PROVINCIAL GOVERNMENT DISTRICT GOVERNMENT FIG. 5.1: Q-52. Thinking of the different levels of government in Afghanistan, do you think that overall the [insert item], is doing a very good job, a somewhat good job, a somewhat bad job, or a very bad job? (a) National Unity Government. (b) Provincial government. (c) Municipal authorities (ask urban residents only). (d) District government (ask rural residents only). (Percent who report somewhat good or very good. ) 5.2 CONFIDENCE IN PUBLIC INSTITUTIONS KEY QUESTIONS Q-48. In the last two years, has the member of parliament (MP) for your province ever been involved in helping to resolve a problem or issue (masala/masael) that affected you? Q-49. In your opinion, which of the following does your member of parliament care about most? (a) National issues. (b) Provincial issues. (c) District or municipal issues. (d) Ethnic issues. (e) Personal interests. Q-51. I would like to ask you about some officials, institutions, and organizations. As I read out each, please tell me how much confidence you have in them to do their jobs. Do you have a lot, some, not much, or no confidence at all? (c) The Independent Election Commission. (d) Community development councils. (e) Community shuras/jirgas. (f) Government ministers. (g) International NGOs. (h) Media such as newspapers, radio, TV. (i) National NGOs. (j) Parliament as a whole. (k) Provincial councils. (l) Religious leaders. (m) Your member of parliament. Each year, respondents are asked to rate their confidence in different governmental and nongovernmental institutions (NGOs). In several categories, nationwide confidence rates have increased in 2017, after record lows in 2016 (figure 5.2). Confidence in various levels of government had declined in recent years after NUG leaders failed to deliver on their promises. The growing disagreements and distrust among the two national leaders, as well as the structure of the NUG with no constitutional definition, diminished Afghans confidence and raise doubt that there was sufficient political will to improve the situation. 8 GOVERNANCE 97
108 In 2017, for the second consecutive year, Afghans report the highest levels of confidence in their religious leaders (67.3%), followed by the media (65.7%) and community shuras/jirgas (65.7%). They reserve their lowest levels of confidence for members of parliament (MP) (35.4%), government ministers (35.9%), and the parliament as a whole (36.8%). The most significant changes in confidence concern community development councils, which rose from a record low of 53.4% in 2016 to 57.9% in 2017, and the IEC, which also rose from a record low, 33.7%, last year to 38.1% this year. Rural respondents are more likely to express some or a lot of confidence in religious leaders (68.0%) and community shuras/jirgas (67.9%) than are urban respondents (65.0% and 59.1%, respectively). Urban respondents, as in all previous years, report higher levels of confidence in the media (72.2%) than rural respondents (63.6%). OVERALL CONFIDENCE IN OFFICIALS, INSTITUTIONS, AND ORGANIZATIONS % % % % % % % % % % % INDEPENDENT ELECTION COMMISSION COMMUNITY DEVELOPMENT COUNCILS COMMUNITY SHURAS/JIRGAS GOVERNMENT MINISTERS INTERNATIONAL NGOS MEDIA NATIONAL NGOS RELIGIOUS LEADERS PARLIAMENT PROVINCIAL COUNCILS YOUR MEMBER OF PARLIAMENT FIG. 5.2: Q-51. I would like to ask you about some officials, institutions, and organizations. As I read out each, please tell me how much confidence you have in them to do their jobs. Do you have a lot, some, not much, or no confidence at all? (c) Independent Election Commission. (d) Community development councils. (e) Community shuras/jirgas. (f) Government ministers. (g) International NGOs. (h) Media such as newspapers, radio, TV. (i) National NGOs. (j) Parliament as a whole. (k) Provincial councils. (l) Religious leaders. (m) Your member of parliament. If you don t know, it s OK, just say you have no opinion. (Percent who respond some or a lot of confidence in each.) Only a quarter of Afghans (25.2%) say their MP has done something positive for their province (resolving a problem or issue). Rural residents (28.6%) are more likely than urban residents (15.2%) to say their MP has done something positive for their province, and Pashtuns (36.2%) are more likely than Tajiks (20.1%), Uzbeks (20.4%), and Hazaras (14.3%). Provinces with the highest opinions regarding the positive role of their MPs are Laghman (61.3%), Paktika (50.7%), and Helmand (49.6%), while respondents in Kabul (5.5%), Badakhshan (6.1%), and Balkh (8.4%) have the lowest opinions in this regard. 98 AFGHANISTAN IN 2017
109 Perceptions of what MPs care about are mostly unchanged this year, with respondents saying that MPs care more about their personal and ethnic interests than the province they represent or the country as a whole. As to which issues they believe their MPs care about most, 37.0% of Afghans say personal interests, 22.8% say ethnic issues, 18.1% say provincial issues, 10.4% say national issues, and 9.4% say district or municipal issues. 5.3 CORRUPTION KEY QUESTIONS Q-41. (If respondent gave a bribe) What was the amount, or the equivalent value in cash, of the favor or gift you most recently had to pay for this service? If it was a gift or favor, please give your best estimate of its value. (Write amount or equivalent in AFN). Q-42. Please tell me whether you think corruption is a major problem, a minor problem, or no problem at all in the following areas. (a) In your daily life. (b) In Afghanistan as a whole. Each year, the Survey explores perceptions of corruption to understand how respondents view corrupt practices and whether such practices are perceived as a major problem for the country. Corruption remains a major obstacle to the rule of law in Afghanistan, with allegations that judicial decisions are biased in favor of government and parliamentary officials, and that police investigations are blocked by powerful figures. 9 Perceptions of corruption as a major problem may coexist with perceptions of corruption as acceptable, in the sense that bribery or other illicit practices may be seen as a requirement to achieve certain goals. 10 Bribery remains common across the public sector, and bribes may be directly or indirectly solicited by public officials, or offered by citizens. In 2017, like the year before, almost all Afghans believe corruption is a problem in all areas of their lives, with 83.7% saying corruption is a major problem in Afghanistan as a whole, while 13.1% say it s a minor problem. Concerns about corruption in daily life have continued to grow over the years, and have now reached a record high. This year, 69.8% of Afghans perceive corruption as a major problem in their daily life, and a further 23.0% say it is a minor problem (figure 5.3). The provinces with the highest perception of corruption as a major problem in daily life are Kabul (89.6%), Nangarhar (87.8%), Uruzgan (87.9%), and Helmand (86.9%). Urban residents (81.5%) are significantly more likely than rural residents (66.0%) to perceive everyday corruption as a major problem. Male respondents (72.0%) are slightly more likely than female respondents (68.0%) to see corruption as a major problem in their daily lives; however, female respondents (84.1%) are slightly more likely than male respondents (83.3%) to see corruption as a major problem in Afghanistan as a whole. This may be because men have more interaction with public officials than women, and therefore have more exposure to corruption in daily life. GOVERNANCE 99
110 PERCEPTION OF CORRUPTION: MAJOR PROBLEM 90% 80% 70% 60% 50% 40% 30% 20% 10% 0% IN YOUR DAILY LIFE IN AFGHANISTAN AS A WHOLE FIG. 5.3: Q-42. Please tell me whether you think corruption is a major problem, a minor problem, or no problem at all in the following areas. (a) In your daily life. (b) In Afghanistan as a whole. (Percent who report major problem. ) For the first time, the 2017 Survey asks respondents about the amount, or the equivalent cash value, of the favor or gift they most recently had to provide to obtain services. In descending order, Afghans report giving the largest bribes on average to the judiciary/courts, followed by when applying for a job, and to the provincial governor s office (figure 5.4). AVERAGE AMOUNTS OF BRIBES, BY INSTITUTION WHEN OR WHERE AVERAGE AMOUNT (AFN) APPROXIMATE VALUE (USD) JUDICIARY/COURTS 23, WHEN APPLYING FOR A JOB 11, PROVINCIAL GOVERNOR S OFFICE 9, CUSTOMS OFFICE 8, MUNICIPAL OR DISTRICT OFFICE 5, AFGHAN NATIONAL POLICE 4, AFGHAN NATIONAL ARMY 4, DA AFGHANISTAN BRESHNA SHERKAT 3, (GOVERNMENT ELECTRICAL SERVICE) ADMISSION TO SCHOOLS/UNIVERSITY 3, HOSPITALS/CLINICS 1, FIG. 5.4: Q-41. (If respondent gave a bribe) What was the amount, or the equivalent value in cash, of the favor or gift you most recently had to pay for this service? If it was a gift or favor, please give your best estimate of its value. 100 AFGHANISTAN IN 2017
111 5.4 JUSTICE AND DISPUTE RESOLUTION KEY QUESTIONS Q-28. Within the last year, have you or anyone you know been represented by a defense lawyer in a criminal case? Q-29. (If Q-28 answer is yes ) Did you or the person you know pay for those services? Q-30. Do you think a person arrested for a crime should have a right to a lawyer, even if they are guilty? Q-31. If you were ever arrested, which of these types of lawyers would you trust to fight for your rights? You can say yes to more than one. (a) A defense lawyer employed by the government. (b) A defense lawyer employed by an international organization. (c) A defense lawyer employed by a civil society organization. (d) An independent lawyer not employed by either the government or an organization. Q-32. How satisfied or dissatisfied are you with the available dispute-resolution services in your area? Are you very satisfied, somewhat satisfied, somewhat dissatisfied, or very dissatisfied? Q-33. In the past two years, have you had a dispute or a formal case that you couldn t settle with the other party and had to go to the Huquq Department or a village/neighborhood-based shura/jirga to resolve it, or not? Q-34. (If a Q-33 answer is yes ) What kind of a case or dispute was it? (Single response. If more than one case or dispute, ask for the most recent one.) Q-35. (If Q-33 answer is yes ) Were you fully satisfied, somewhat satisfied, or not satisfied with the outcome of the proceedings? Q-36. (If Q-33 answer is yes ) Where have you taken this case or dispute? (Allow more than one response.) Q-37. (If Q-36 answer is Huquq Department ) And now let s turn to the local Huquq Department. Tell me, do you strongly agree, somewhat agree, somewhat disagree, or strongly disagree with the following statements about the Huquq Department? (a) Local Huquq are fair and trusted. (b) Local Huquq follow the local norms and values of our people. (c) Local Huquq are effective at delivering justice. (d) Local Huquq resolve cases quickly and efficiently. Q-38. (If Q-36 answer is state courts ) Tell me, do you strongly agree, somewhat agree, somewhat disagree, or strongly disagree with the following statements about state courts? (a) State courts are fair and trusted. (b) State courts follow the local norms and values of our people. (c) State courts are effective at delivering justice. (d) State courts treat men and women equally. Q-39. (If Q-36 answer is shura/jirga ) And now let s turn to village/neighborhood-based shuras/ jirgas. Tell me, do you strongly agree, somewhat agree, somewhat disagree, or strongly disagree with the following statements about the village/neighborhood-based shuras/jirgas? (a) Local shuras/jirgas are fair and trusted. (b) Local shuras/jirgas follow the local norms and values of our people. (c) Local shuras/jirgas are effective at delivering justice. (d) Local shuras/ jirgas resolve cases timely and promptly. (e) There should be local women s shuras/jirgas. GOVERNANCE 101
112 For the second consecutive year, the Survey asked Afghans if a person arrested for a crime should have the right to a lawyer, regardless of whether they are guilty or not. Overall, there has been a slight increase this year in positive responses to this question, from 79.2% in 2016 to 81.4% in 2017, with the most positive responses in the East (84.6%) and the least in South West (75.8%). When asked which type of defense lawyer they would trust if they were arrested, Afghans continue to express the highest levels of confidence in defense lawyers hired by government (62.0%), followed by defense lawyers not hired by either the government or an organization (59.0%), defense lawyers hired by a civil society organization (50.3%), and defense lawyers hired by an international organization (40.1%). There is some variation by province, with Badakhshan showing the highest level of confidence in lawyers hired by government (84.0%) and Zabul reporting the lowest (25.0%). The use of legal-defense services in criminal cases around the country has been a major achievement for justicereform efforts in Afghanistan. 12 This year, however, 18.8% of Afghans report that they or someone they know has been represented by a defense lawyer in a criminal case, down slightly from 21.0% in Of those who report that they or someone they know was represented by a defense lawyer, 61.3% report paying for the lawyer s services. Despite a very slight decline in 2017, the use of national and local judicial institutions (Huquqs and local shuras/jirgas) for dispute resolution has been steady for the past few years (figure 5.5). One in five Afghans (20.4%) report that they have applied to the Huquq (rights) Department 13 or a local shura/jirga in the past two years in order to settle a dispute or a formal case. Rural respondents (23.2%) are twice as likely as urban (12.0%) to say they have used the Huquq Department or a local shura/jirga. Respondents in Helmand (51.5%), Wardak (39.2%), and Paktika (39.0%) report the highest use of these institutions, while respondents in Panjshir (4.9%), Kabul (7.2%), and Bamyan (7.0%) report the lowest use. 25% DISPUTE RESOLUTION: USE OF HUQUQS OR SHURAS/JIRGAS 20% 15% 10% % 0% FIG. 5.5: Q-33. In the past two years have you had a dispute or a formal case that you couldn t settle with the other party and had to go to the Huquq Department or a village/neighborhood-based shura/ jirga to resolve it, or not? (Percent who say yes.) 102 AFGHANISTAN IN 2017
113 Of those respondents who report using a dispute resolution service, 43.2% say they used a village/neighborhoodbased shura/jirga, 39.5% used state courts, and 21.4% used the Huquq Department. As in previous years, residents of rural areas (44.9%) are more likely to use a shura/jirga for dispute resolution than urban residents (33.4%). The Survey also asked Afghans their opinions of the institutions they used for dispute resolution. Users of shuras/jirgas are more likely than users of the state courts or the Huquq Department to say that their institution of choice is fair and trusted (81.5%), follows the norms and values of the people (77.0%), and is effective at delivering justice (74.2%) (figure 5.6). OPINIONS OF DISPUTE RESOLUTION INSTITUTIONS HUQUQ DEPARTMENT STATE COURT LOCAL SHURA/JIRGA % % % FAIR AND TRUSTED FOLLOWS NORMS OF THE PEOPLE EFFECTIVE AT DELIVERING JUSTICE FIG. 5.6: Q-33 to Q-39. And now let s turn to the [institution]. Tell me, do you strongly agree, somewhat agree, somewhat disagree, or strongly disagree with the following statements about [institution]. (a) It is fair and trusted. (b) It follows the norms and values of our people. (c) It is effective at delivering justice. (Percent who strongly agree or somewhat agree about the institution they used.) The most common types of disputes taken to dispute resolution were land disputes (46.1%), family problems (19.8%), and property disputes (11.3%) (figure 5.7). TYPES OF CASES TAKEN TO DISPUTE RESOLUTION 50% 46 45% 40% 35% 30% 25% 20% 20 15% 10% 5% % LAND DISPUTE FAMILY PROBLEM PROPERTY DISPUTE COMMERCIAL DISPUTE TRAFFIC ACCIDENT DIVORCE FIG. 5.7: Q-34. (If Q-33 answer is yes ) What kind of a case or dispute was it? (Single Response. If more than one case or dispute, ask for the most recent one.) GOVERNANCE 103
114 End Notes 1 Martine van Bijlert, Afghanistan s National Unity Government Rift (2): The problems that will not go away (Afghanistan Analysts Network, September 2016), 2 Alex Thier and Scott Worden, Political Stability in Afghanistan: A 2020 Vision and Roadmap (Washington, DC: United States Institute of Peace, July 2017), 3 Rajeshwari Krishnamurthy, Electoral Reforms in Afghanistan: Key Issues and Prospects, Fletcher Forum of World Affairs 41, no. 2 (May 2017), 4 IEC Announces Election Date: July Next Year, Tolo News, June 22, 2017, 5 Transparency International (TI), From Promises to Action: Navigating Afghanistan s Anti-Corruption Commitments, (Berlin: TI, October 2016), EN.pdf. 6 Islamic Republic of Afghanistan, Afghanistan National Peace and Development Framework (ANPDF) 2017 to 2021, (Kabul: Ministry of Economy, 2017), The ANPDF, a five-year strategic plan for achieving self-reliance, provides high-level guidance to government and other stakeholders and envisions establishment of the rule of law and the eradication of corruption, criminality, and violence. 7 Transparency International (TI), Bridging the Gaps: Enhancing the Effectiveness of Afghanistan s Anti-Corruption Agencies (Berlin: TI, March 2017), report_en.pdf. 8 Hamid M. Saboory, What Is Going Wrong With Afghanistan s National Unity Government? Diplomat, September 29, 2016, 9 Corruption in Afghanistan: What Needs to Change, Transparency International, February 16, 2016, transparency.org/news/feature/corruption_in_afghanistan_what_needs_to_change. 10 United Nations Office on Drugs and Crime (UNODC), Corruption in Afghanistan: Recent patterns and trends (Vienna: UNODC, December 2012), Afghanistan_2013.pdf. 11 Dollar equivalents represent the exchange rate of USD 1.00 to AFN on October 15, Currency Converter, Oanda, 12 Sarah Han, Legal Aid in Afghanistan: Contexts, Challenges and the Future, (Afghan Analysts Network, April 2012), According to the Afghan Ministry of Justice (MoJ), the Huquq Department has existed in Afghanistan since Its function is to provide an opportunity for citizens to resolve civil disputes before they are brought into the court system. The department settles disputes arising out of debts, properties, and family of real and legal persons pursuant to the Civil Procedure Code and the Law on the Acquisition of Rights. The MoJ also describes the Huquq Department as self-sufficient, providing substantial revenues to the treasury from fees charged in legal cases. Department of Huquq, Ministry of Justice, page/7943/7944/ AFGHANISTAN IN 2017
115
116
117 6 POLITICAL PARTICIPATION As Afghanistan s National Unity Government (NUG) enters its third year, Afghans remain skeptical about their leaders ability to improve living conditions and security in the country. They express frustration about their government s ability to create jobs, deliver services, and combat corruption. 1 In the first months of 2017, several political and militia leaders broke with President Ashraf Ghani to form their own political movement, presenting new political challenges to Ghani, who under the constitution will face a reelection campaign in Meanwhile, Afghans are preparing for parliamentary elections, which will occur in July While the 2014 presidential election was a hopeful moment for Afghanistan, Afghans in 2017 continue to express elevated levels of concern (51.5%) for their safety at the polls. Afghans also express skepticism about their elected leaders. This year, the Survey reveals that Afghans have low confidence in the ability of their members of parliament (MPs) to affect change in the country. Just over half (58.4%) of Afghans feel their MP does a somewhat good or a very good job of listening to his or her constituents and representing their needs, while fewer say their MP does a good job of making laws for the good of the country (50.5%) and monitoring the president and his staff (45.3%). The parliamentary elections will be a bellwether for the role of Afghan women in politics. Women contributed to the large voter turnout in 2014, and the perception of women in Afghan politics continues to evolve. 4 Afghanistan s Parliament has set aside 69 seats for women out of 249. In addition, an overwhelming majority of Afghans in 2017 express support for women s participation in elections (89.0%). Many Afghans say they prefer to have a male MP (43.7%), but more than a third of respondents (34.1%) say it makes no difference if their MP is a man or a woman. Just over half of Afghans (59.7%) say women should decide whom they will vote for on their own, rather than make electoral decisions with the help of a man. Another unresolved issue is the future of the NUG itself. The 2014 agreement that produced the powersharing government called for a loya jirga within two years to determine a permanent system of government for Afghanistan. Some Afghan leaders are now calling for the loya jirga to be postponed until after the 2018 parliamentary elections. 5 Such uncertainty about the roles and functions of Afghanistan s national leaders continues to undermine national efforts to improve the living conditions of Afghan citizens. This chapter examines Afghan views of the democratic process, including attitudes towards participation in a variety of political activities and the role of women in politics, during this time of continuing political change in Afghanistan. POLITICAL PARTICIPATION 107
118 6.1 EXERCISING BASIC POLITICAL FREEDOMS KEY QUESTIONS Q-45. Please tell me how you would respond to the following activities or groups. Would you respond with no fear, some fear, or a lot of fear? (a) Voting in a national/provincial election. (b) Participating in a peaceful demonstration. (c) Running for public office. Q-46. In some countries, people do not feel able to publicly criticize their government, while in other countries they feel quite free to do so in public. Thinking back to a year ago, how safe did you feel expressing your opinions about the government in public? In 2017, just over half of Afghans (51.5%) say they experience some or a lot of fear while participating in a national election, down slightly from 53.7% in 2016 (figure 6.1). Fear while voting has remained elevated across Afghanistan since 2009, with the exception of the 2014 Survey, which was conducted just months after Afghans defied threats of violence and went to vote in a presidential election. Women are slightly more likely (55.1%) than men (47.9%) to report fear while voting. Residents of urban regions (53.7%) are slightly more likely than residents of rural regions (50.8%) to report fear. Whether Afghan citizens report fear while voting varies according to where they live. Afghans are most likely to report fear if they live in the West (63.0%), South West (59.1%), or Central/Kabul (58.7%) regions, and least likely in the North East (40.3%) and Central/Hazarajat (19.2%) regions. Reports of fear decreased by more than 10 percentage points in four regions, most notably in the South West (down 19.2 points) and East (down 17.2 points), but they increased by 10.6 percentage points in the Central/Kabul region. This may be due in part to an increase in terrorist attacks in the capital city in the past year. 6 By province, residents are most likely to report fear while voting if they live in Nuristan (81.5%), Wardak (77.6%), and Zabul (75.2%) and least likely to report fear if they live in Parwan (22.7%), Bamyan (12.4%), and Panjshir (2.5%). 108 AFGHANISTAN IN 2017
119 FEAR WHILE VOTING 70% 60% 50% 40% 30% % 10% 0% FIG. 6.1: Q-45. Please tell me how you would respond to the following activities or groups. Would you respond with no fear, some fear, or a lot of fear? (a) Voting in a national/provincial election. (Percent who respond some fear or a lot of fear.) An even higher percentage of Afghans, 71.8%, say they would be afraid to participate in a peaceful demonstration. Women (77.0%) are more likely than men (66.5%) to report fear of engaging in peaceful protest. Similarly, 72.7% of all Afghans say they would feel fear while running for political office. Again, women (76.6%) are more likely to say they would be afraid to run for political office than men (68.9%). As in 2016, Afghans fear of participating in demonstrations and running for office showed little variation across geographic regions (figure 6.2). However, variations do emerge when examining fear by province. Fear of participating in a demonstration ranges from 41.1% in Kunar to 90.8% in Nuristan. Fear of running for political office shows similar variation, from 36.7% in Panjshir to 89.6% in Nuristan. POLITICAL PARTICIPATION 109
120 FEAR WHILE PARTICIPATING IN POLITICAL ACTIVITIES, BY REGION 100% 80% 60% 40% 20% % CENTRAL/ KABUL EAST SOUTH EAST SOUTH WEST WEST NORTH EAST CENTRAL/ NORTH WEST HAZARAJAT VOTING IN NATIONAL/PROVINCIAL ELECTION RUNNING FOR PUBLIC OFFICE PARTICIPATING IN A PEACEFUL DEMONSTRATION FIG. 6.2: Q-45. Please tell me how you would respond to the following activities or groups. Would you respond with no fear, some fear, or a lot of fear? (a) Voting in a national/provincial election. (b) Participating in a peaceful demonstration. (c) Running for public office. (Percent who respond some fear or a lot of fear.) The Survey also asks Afghans the extent to which they feel safe criticizing their government in public. In 2017, 54.4% of Afghans say they feel safe doing so, a rate that is virtually unchanged since the 2016 Survey. Interestingly, the survey data show only limited variation across the variables of gender, locale, ethnic group, and region. Instead, the greatest variations emerge at the provincial level. Residents of Panjshir (71.6%), Paktika (71.0%), and Daikundi (70.4%) are most likely to feel safe criticizing their government in public, while residents of Ghazni (38.8%), Faryab (33.0%), and Zabul (30.8%) are least likely to share that feeling. 6.2 ABILITY TO INFLUENCE LOCAL GOVERNMENT DECISIONS KEY QUESTION Q-47. How much influence do you think someone like you can have over local (district/provincial) government decisions a lot, some, very little, or none at all? Nearly half (49.5%) of Afghans say they have some or a lot of influence over local government decisions. This represents a notable increase since 2016, when only 43.3% said they feel they can influence local government decisions, and the first year-on-year increase since a high of 55.9% following the 2014 presidential election (figure 6.3). 110 AFGHANISTAN IN 2017
121 INFLUENCE OVER LOCAL GOVERNMENT DECISIONS 70% 60% 65 50% 40% % 20% 10% 0% FIG. 6.3: Q-47. How much influence do you think someone like you can have over local (district/ provincial) government decisions a lot, some, very little, or none at all? (Percent who respond a lot or some. ) Men (50.1%) and women (48.9%) report that they can influence local government policy at similar rates, as do residents of urban (47.2%) and rural (50.3%) areas. The Survey data also show a significant variation in response to this question among Afghanistan s major ethnic groups: 54.0% of Pashtuns, 50.7% of Uzbeks, 47.8% of Tajiks, and 40.0% of Hazaras feel they can influence local government decisions. Afghans belief that they can influence local government decisions varies notably by region, however. The sentiment is strongest in the East region (69.0%) and lowest in the South East (36.3%) and Central/Kabul (40.9%) regions. More variation emerges at the provincial level (figure 6.4). The sentiment is most common in Samangan (73.3%), Kandahar (78.9%), and Laghman (89.1%) and lowest in Zabul (30.5%), Paktia (29.2%), and Khost (19.4%). POLITICAL PARTICIPATION 111
122 PERCEPTION OF ABILITY TO INFLUENCE LOCAL GOVERNMENT DECISIONS, BY PROVINCE Jawzjan Balkh Kunduz Takhar Badakhshan Herat Badghis Faryab Ghor Sar-e-Pul Samangan Baghlan Panjshir Nuristan Parwan Kapisa Kunar Bamyan Laghman Kabul Wardak Nangarhar Logar Daikundi Ghazni Paktya Khost Farah Uruzgan Zabul Paktika Nimroz Helmand Kandahar >8 5% % % 26 45% 0 25% FIG. 6.4: Q-47. How much influence do you think someone like you can have over local (district/ provincial) government decisions a lot, some, very little, or none at all? (Percent who respond a lot or some. ) Multivariate analysis that controls for gender, age, income, and geographic differences reveals a variety of tendencies that correspond with perceptions of the ability to influence local government decisions (figure 6.5). 7 While this analysis reveals correlations, not causation, of specific variables, it produces a valuable portrait of Afghans who are more likely to believe that individual citizens can participate effectively in the political system. FACTORS ASSOCIATED WITH PERCEIVED LOCAL INFLUENCE AFGHANS WHO REPORT SOME OR A LOT OF ABILITY TO INFLUENCE LOCAL GOVERNMENT DECISIONS, ON AVERAGE, ARE: MORE LIKELY TO BE URBAN AFGHANS. MORE LIKELY TO REPORT A LOW LEVEL OF FEAR WHILE PARTICIPATING IN SOCIOPOLITICAL ACTIVITIES. MORE CONFIDENT IN PRESIDENT ASHRAF GHANI TO DO HIS JOB. MORE CONFIDENT IN GOVERNMENT INSTITUTIONS. MORE LIKELY TO REPORT SATISFACTION WITH THE WAY DEMOCRACY WORKS IN AFGHANISTAN. AFGHANS WHO REPORT VERY LITTLE OR NO ABILITY TO INFLUENCE LOCAL GOVERNMENT DECISIONS, ON AVERAGE, ARE: MORE LIKELY TO BE RURAL AFGHANS. MORE LIKELY TO REPORT A HIGH LEVEL OF FEAR WHILE PARTICIPATING IN SOCIOPOLITICAL ACTIVITIES. LESS CONFIDENT IN PRESIDENT ASHRAF GHANI TO DO HIS JOB. LESS CONFIDENT IN GOVERNMENT INSTITUTIONS. LESS LIKELY TO REPORT SATISFACTION WITH THE WAY DEMOCRACY WORKS IN AFGHANISTAN. 112 AFGHANISTAN IN 2017
123 MORE LIKELY TO FEEL A HIGH LEVEL OF SAFETY WHILE CRITICIZING GOVERNMENT IN PUBLIC. MORE LIKELY TO BE A MEMBER OF PASHTUN, TAJIK, OR UZBEK ETHNIC GROUP. MORE LIKELY TO EXPRESS HAPPINESS IN THEIR LIFE. MORE LIKELY TO FEEL A LOW LEVEL OF SAFETY WHILE CRITICIZING GOVERNMENT IN PUBLIC. LESS LIKELY TO BE A MEMBER OF PASHTUN, TAJIK, OR UZBEK ETHNIC GROUP. LESS LIKELY TO EXPRESS HAPPINESS IN THEIR LIFE. FIG. 6.5: Q-31. How much influence do you think someone like you can have over local (district/ provincial) government decisions a lot, some, very little, or none at all? (Percent who respond some or a lot. ) 6.3 POLITICS AND RELIGION KEY QUESTION Q-43. Some people say that politics and religion should be mixed. Other people say politics and religion should not mix. For example, some say religious scholars should only manage religion and should not take part in politics. Which is closer to your view? In 2017, the percentage of Afghans who say that religious leaders should be involved in politics is slightly higher, at 61.6%, than the 2016 Survey, at 57.2% (figure 6.6). And while, in the past, men have often reported greater support for mixing religion and politics than women, there was little variation between men and women in 2017 (figure 6.7). ATTITUDE TOWARDS RELIGIOUS LEADERS IN POLITICS 80% 70% 60% 50% 40% 30% 20% 10% 0% RELIGIOUS LEADERS SHOULD BE INVOLVED IN POLITICS RELIGIOUS LEADERS SHOULD NOT BE INVOLVED IN POLITICS FIG. 6.6: Q-43. Some people say that politics and religion should be mixed. Other people say politics and religion should not mix. For example, some say religious scholars should only manage religion and should not take part in politics. Which is closer to your view? POLITICAL PARTICIPATION 113
124 SUPPORT FOR RELIGIOUS LEADERS IN POLITICS, BY GENDER 100% 90% 80% 70% 60% 50% % 30% MALE FEMALE FIG. 6.7: Q-43. Some people say that politics and religion should be mixed. Other people say politics and religion should not mix. For example, some say religious scholars should only manage religion and should not take part in politics. Which is closer to your view? (Percent who say politics and religion should be mixed. ) Residents of the South West (76.6%) and East (74.7%) regions are most likely to support the involvement of religious leaders in politics, while residents of the West (53.1%) and North West (55.3%) regions are least likely to support this view. The provinces with the highest levels of support were Panjshir (97.3%), Helmand (88.1%), and Kapisa (80.2%), while the provinces with the lowest levels of support were Khost (44.5%), Herat (44.6%), and Logar (46.5%). Pashtuns (67.1%) and Uzbeks (65.2%) are more likely than Tajiks (57.9%) and Hazaras (55.5%) to support the involvement of religious leaders in politics. However, a more significant determinant of views about politics and religion appears to be urbanism: Afghans who live in rural areas (64.2%) are more likely to approve of religion mixing with politics than residents of urban areas (53.5%). 6.4 WOMEN AND POLITICS KEY QUESTIONS Q-75. Would you prefer to be represented by a man or a woman in parliament, or does it make no difference to you? Q-78. Do you think women should be allowed to vote in elections? Q-79. If women vote, do you think that they should decide for themselves whom to vote for, or should men decide for women whom they should vote for? A large majority of Afghans believe that women should be allowed to vote in elections (89.0%), a result that is virtually unchanged since the 2016 Survey (88.2%) and the 2009 Survey (83.4%), when this question was previously included in the questionnaire. Women are only slightly more likely (90.9%) than men (87.2%) to 114 AFGHANISTAN IN 2017
125 hold this view. Similarly, views about women voting vary only slightly by education level, as Afghans with a high school (92.9%) or university education (94.4%) are marginally more likely than Afghans with only a primary education (87.7%) to support women going to the polls. Support for female enfranchisement is greatest in the North East (95.4%) and North West (94.6%) regions, and lowest in the South West region (66.9%). While most Afghans believe that women should be able to vote, fewer believe that they should make electoral decisions themselves. Fewer than two in three Afghans (59.7%) say that women should decide whom they will vote for on their own, while 16.9% say men should decide for women (figure 6.8). This is the highest rate of support for independent electoral decision-making by women in 10 years, though the rate of growth has been slow during this period. Women (62.6%) are only slightly more likely than men (56.9%) to say they should make electoral decisions independently of men (figure 6.9). Afghans are more likely to support women making electoral decisions themselves if they have more education and live in urban areas. Yet, while support for women voting is consistently high across Afghanistan s regions (over 85%, with the exception of the South West), support for women making their own decisions at the polls varies considerably. Support for female decision-making is highest in the Central/Hazarajat (72.3%), Central/Kabul (69.9%), and North West (65.9%) regions. It is lowest in the South East (41.1%) and East (45.1%). WOMEN AND ELECTORAL DECISION-MAKING 80% 60% % 20% 0% WOMEN SHOULD DECIDE FOR THEMSELVES MEN SHOULD DECIDE FOR WOMEN WOMEN SHOULD DECIDE, IN CONSULTATION WITH MEN FIG. 6.8: Q-79. If women vote, do you think that women should decide whom to vote for themselves, or should men decide for women whom they should vote for? (a) Women should decide for themselves. (b) Men should decide for women. (c) Women should decide for themselves, but in consultation with men. POLITICAL PARTICIPATION 115
126 WOMEN AND ELECTORAL DECISION- MAKING, BY GENDER AND URBAN VS. RURAL 80% 70% 60% 50% 40% 30% 20% 10% 0% MALE FEMALE RURAL URBAN 16 WOMEN SHOULD DECIDE FOR THEMSELVES MEN SHOULD DECIDE FOR WOMEN WOMEN SHOULD DECIDE, IN CONSULTATION WITH MEN FIG. 6.9: Q-79. If women vote, do you think that women should decide whom to vote for themselves, or should men decide for women whom they should vote for? (a) Women should decide for themselves. (b) Men should decide for women. (c) Women should decide for themselves, but in consultation with men. Afghans are twice as likely to say they prefer to be represented by a man (43.7%) in parliament as a woman (20.6%), though more than a third of respondents (34.1%) said it makes no difference if their MP is a man or a woman. Men (63.5%) are much more likely than women (24.0%) to prefer only a male MP. There appears to be little correlation between Afghans preferences for the gender of their MP and respondents education level. Residents of rural areas (46.2%) are more likely to prefer a male MP than residents of urban areas (36.2%). Preference for a male MP is particularly high in the South West region (68.6%), while, in the other regions, preference for a male MP ranges from 27.7% (Central/Hazarajat) to 49.9% (East). 6.5 ATTITUDES TOWARDS DEMOCRACY KEY QUESTIONS Q-44. On the whole, how satisfied or dissatisfied are you with the way democracy works in Afghanistan? By democracy, we mean choosing the president and parliament by voting, rather than appointment or selection by some leaders. Are you very satisfied, somewhat satisfied, somewhat dissatisfied, or very dissatisfied? Q-49 In your opinion, which of the following does your member of parliament care about most? (a) National issues. (b) Provincial issues. (c) District issues. (d) Ethnic issues. (e) Personal interests. Q-50. Members of arliament have various responsibilities. How would you rate their performance on each of the following duties? (a) Listening to constituents and representing their needs. (b) Making laws for the good of the country. (c) Monitoring the president and his staff. 116 AFGHANISTAN IN 2017
127 In 2017, Afghans expressed lukewarm satisfaction with democracy, halting a decline in estimations of the democratic system since the 2014 Survey, the year of the bitterly contested presidential election (figure 6.10). Women (58.3%) are only slightly more likely than men (55.7%) to express a favorable opinion of democracy. 90% 80% SATISFACTION WITH DEMOCRACY 70% 60% 50% 40% 30% 20% 10% 0% FIG. 6.10: Q-44. On the whole, how satisfied or dissatisfied are you with the way democracy works in Afghanistan. By democracy, we mean choosing the president and parliament by voting, rather than appointment or selection by some leaders. (Percent who respond very or somewhat satisfied.) Residents of the East (70.6%), South West (64.4%), and Central/Hazarajat (72.0%) regions are most likely to say they are satisfied with democracy, while rates of satisfaction in other regions range from just 50.7% in the South East region to 56.3% in the North East. When examining Afghans responses by ethnic group, however, only limited variation emerges: 59.1% of Pashtuns, 55.4% of Tajiks, 54.1% of Uzbeks, and 56.8% of Hazaras say they approve of how democracy works in their country. The greatest variation emerges, instead, at the provincial level (figure 6.11). More than one third of Afghans in Kapisa (35.6%) approve of how democracy functions, while fewer than one in three Afghans in Panjshir (29.3%) and Zabul (29.3%) approve of how democracy functions. Rates of approval surpass 75% in Kandahar (76.0%), Paktika (76.4%), and Daikundi (79.7%). This suggests that Afghan s opinions of democracy may be tied more to the performance of their local governments than any other variable. POLITICAL PARTICIPATION 117
128 SATISFACTION WITH DEMOCRACY, BY PROVINCE Jawzjan Balkh Kunduz Takhar Badakhshan Herat Badghis Faryab Ghor Sar-e-Pul K Samangan Baghlan Panjshir Nuristan Parwan Kapisa Kunar Bamyan Laghman a b u l Wardak Nangarhar Logar Daikundi Ghazni Paktya Khost Farah Uruzgan Zabul Paktika Nimroz Helmand Kandahar >75% 51 75% % 0 2 5% FIG. 6.11: Q-44. On the whole, how satisfied or dissatisfied are you with the way democracy works in Afghanistan. By democracy, we mean choosing the president and Parliament by voting, rather than appointment or selection by some leaders. (Percent who respond very or somewhat satisfied.) Further analysis reveals Afghans are more likely to report satisfaction with democracy if they also report; confidence in government, confidence that guilty parties will be punished, happiness, and improving access to jobs and services (figure 6.12) AFGHANISTAN IN 2017
129 FACTORS ASSOCIATED WITH SATISFACTION WITH DEMOCRACY AFGHANS WHO REPORT BEING SATISFIED OR VERY SATISFIED WITH DEMOCRACY, ON AVERAGE, ARE: MORE LIKELY TO BE FEMALE. MORE LIKELY TO REPORT A LOW LEVEL OF FEAR WHILE PARTICIPATING IN SOCIOPOLITICAL ACTIVITIES. MORE CONFIDENT IN AFGHAN NATIONAL POLICE. MORE CONFIDENT IN GOVERNMENT INSTITUTIONS. MORE CONFIDENT THAT A GUILTY PARTY WILL BE PUNISHED. MORE LIKELY TO FEEL A HIGH LEVEL OF SAFETY WHILE CRITICIZING THE GOVERNMENT IN PUBLIC. MORE LIKELY TO EXPRESS HAPPINESS IN THEIR LIFE. MORE LIKELY TO SAY THAT A FEMALE FAMILY MEMBER IS CONTRIBUTING TO THEIR HOUSEHOLD MONTHLY INCOME. MORE LIKELY TO REPORT THEIR EMPLOYMENT OPPORTUNITIES GOT BETTER IN THE PAST YEAR. MORE LIKELY TO REPORT THEIR ELECTRICITY SUPPLY GOT BETTER IN THE PAST YEAR. MORE LIKELY TO REPORT AN OLDER IDEAL AGE FOR A WOMAN TO GET MARRIED. MORE CONFIDENT IN THE INDEPENDENT ELECTION COMMISSION. MORE LIKELY TO SAY THAT POLITICS AND RELIGION SHOULD N0T BE MIXED. AFGHANS WHO REPORT BEING DISSATISFIED OR VERY DISSATISFIED WITH DEMOCRACY, ON AVERAGE, ARE: MORE LIKELY TO BE MALE. MORE LIKELY TO REPORT A HIGH LEVEL OF FEAR WHILE PARTICIPATING IN SOCIOPOLITICAL ACTIVITIES. LESS CONFIDENT IN AFGHAN NATIONAL POLICE. LESS CONFIDENT IN GOVERNMENT INSTITUTIONS. LESS CONFIDENT THAT A GUILTY PARTY WILL BE PUNISHED. MORE LIKELY TO FEEL A LOW LEVEL OF SAFETY WHILE CRITICIZING THE GOVERNMENT IN PUBLIC. LESS LIKELY TO EXPRESS HAPPINESS IN THEIR LIFE. LESS LIKELY TO SAY THAT A FEMALE FAMILY MEMBER IS CONTRIBUTING TO THEIR HOUSEHOLD MONTHLY INCOME. MORE LIKELY TO REPORT THEIR EMPLOYMENT OPPORTUNITIES GOT WORSE IN THE PAST YEAR. MORE LIKELY TO REPORT THEIR ELECTRICITY SUPPLY GOT WORSE IN THE PAST YEAR. MORE LIKELY TO REPORT A YOUNGER IDEAL AGE FOR A WOMAN TO GET MARRIED. LESS CONFIDENT IN THE INDEPENDENT ELECTION COMMISSION. MORE LIKELY TO SAY THAT POLITICS AND RELIGION SHOULD BE MIXED. FIG. 6.12: Q-44. On the whole, how satisfied or dissatisfied are you with the way democracy works in Afghanistan. By democracy, we mean choosing the president and parliament by voting, rather than appointment or selection by some leaders. The Survey also asks Afghans specific questions about their national-level representatives, their members of parliament. Just over half (58.4%) say that their MP does a somewhat good job or a very good job of listening to his or her constituents and representing their needs, while slightly fewer say their MP does a good job of making laws for the good of the country (50.5%) and monitoring the president and his staff (45.3%). Afghans responses to these questions display little variation by gender, though residents of rural areas are slightly more likely than their counterparts in urban areas to report a favorable opinion of their MP s performance. There is a larger variation in the perception of respondents across the regions. Residents of the East are more likely overall to express a positive opinion of their MP, while residents of the Central/Kabul have the least positive opinion of their MPs across all three questions: MPs listening and representing constituent needs, making laws for the good of the country, and monitoring the president and his staff (figure 6.13). This variation disappears, however, when responses are analyzed by ethnic group. Respondents of all ethnic groups report satisfaction with their MP s representation of constituent needs at similar rates (57.5% to 59.0%). However, Pashtuns are more likely than the other three large ethnic groups to be happy with how their MP makes laws or monitors the president and his staff (49.7% compared to 45.0%, 42.8%, and 39.8% among Hazaras, Tajiks, and Uzbeks respectively). These two patterns variation by region but not by ethnic group POLITICAL PARTICIPATION 119
130 suggest that Afghans opinions of their parliamentary representatives may be influenced by their opinions of local politics. 100% PERCEPTION OF MEMBERS OF PARLIAMENT, BY REGION 80% 60% 40% % 0% CENTRAL/ KABUL EAST SOUTH EAST SOUTH WEST WEST NORTH EAST CENTRAL/ NORTH WEST HAZARAJAT LISTENING TO CONSTITUENTS AND REPRESENTING THEIR NEEDS MAKING LAWS FOR THE GOOD OF THE COUNTRY MONITORING THE PRESIDENT AND HIS STAFF FIG. 6.13: Q-50. Members of parliament have various responsibilities. How would you rate their performance on each of the following duties? (a) Listening to constituents and representing their needs. (b) Making laws for the good of the country. (c) Monitoring the president and his staff. 120 AFGHANISTAN IN 2017
131 End Notes 1 Pamela Constable, Afghan president is under siege as violence, joblessness persist, Washington Post, August 13, 2017, f85d680e-779b-11e7-8c17-533c52b2f014_story.html?utm_term=.d164e9c1d Pamela Constable, Political storm brews in Afghanistan as officials from ethnic minorities break with president, call for reforms and protests, Washington Post, July 1, 2017, ab9419ea-5e6f-11e7-aa a7d55207_story.html?utm_term=.b4d52a14f Tariq Ahmad, Afghanistan: Date Set for Parliamentary and District Council Elections, Library of Congress Global Legal Monitor, August 4, 2017, 4 Aarya Nijat and Jennifer Murtazashavili, Women s Leadership Roles in Afghanistan, USIP Special Report 380 (United States Institute of Peace, September 2015), Afghanistan.pdf. 5 International Crisis Group (ICG), Afghanistan: The Future of the National Unity Government, Asia Report no. 285 (Brussels: ICG, 2017), 6 Rod Nordland, Death Toll in Kabul Bombing Has Hit 150, Afghan President Says, New York Times, June 6, 2017, Using OLS regression, perception of how much Afghans think they have influence on local government decisions was regressed on a variety of demographic and attitudinal measures, including gender (d1), income (d6 & d7), geographic location (m6b), ethnic group (d14), fear of participating in political activities (scale), confidence in ANA (scale), confidence in ANP (scale), confidence in President Ghani (q51a), confidence in Chief Executive Officer Abdullah (q51b), confidence in government institutions (scale), access to information (scale), confidence that guilty party will be punished (q24), satisfaction with the way democracy works (q44), fear while criticizing government in public (q46), sympathy with Taliban (q55a), education (d10), female contribution to income (d8), and overall happiness in life (d24). The full model explains 20.2% of the variance in whether an Afghan expresses ability to influence local government decisions (n=8,277, R2=0.202, F (20, 8256) =150.03, p<0.0000). 8 Using OLS regression, how satisfied Afghans are with the way democracy works in Afghanistan was regressed on a set of demographic and attitudinal measures, including monthly income (d6 & d7), gender (d1), fear while participating in political activities (scale), confidence in ANP (scale), confidence in government institutions (scale), confidence that a guilty party will be punished (q24), fear while criticizing the government in public (q46), happiness in life (d16), female contributing to monthly income (d8), employment opportunities (q8b), quality of electricity supply (q8g), attitudes toward politics and religion (q43), perception of ideal marriage age for a woman (q80), and confidence in the Independent Election Commission (q51c). The full model explains 22.4% of the variance in level of satisfaction with democracy function (n=8,123, R2=0.224, F (19, 8108) =123.78, p<0.0000). POLITICAL PARTICIPATION 121
132
133 7 ACCESS TO INFORMATION AND THE MEDIA Afghans get their information from a range of sources, including radio, television, the Internet, and personal sources including family and friends, and meetings in shuras and mosques. This section looks at how Afghans use these various sources to meet their needs for current news and information. The Afghan media sector is protected by Article 34 of the Afghan Constitution, which guarantees the right to freedom of expression and states that directives related to mass media shall be regulated by law. 1 Additional laws protecting the media and freedom of expression include the Mass Media Law 2 of 2009 and the Access to Information Law, 3 signed by President Ghani in 2014, which ensures public access to government information. These legal frameworks are contested by media watchdog organizations in Afghanistan, which contend that they do too little to protect journalists and contain restrictions on press freedom. 4 Implementation of the Access to Information Law has been uneven, and journalists continue to face obstacles from government officials when seeking information. 5 The Oversight Commission on Access to Information is becoming more active, however, with trainings, publications, and conferences to raise awareness of the national strategy to implement the law. 6 Nevertheless, Afghanistan falls near the bottom of international rankings for press freedom. 7 Furthermore, while not directly related to mass media, the Cyber Crime Law, signed by President Ghani on June 20, 2017, 8 may have implications for access to information, 9 and watchdog organizations are closely monitoring the development of this law and its implementation. The telecommunications sector in Afghanistan continues to develop. Currently, 100 television and 302 FM radio stations hold active licenses in Afghanistan. 10 Oqaab, the digital TV service that began in 2016, covers most of Kabul and offers 65 channels of national and international stations. 11 Internet penetration remains modest, at 13%, but is expected to grow to 15% by Mobile phone penetration is high, at 80% (over 25 million subscribers), and is expected to reach 86% to 95% by There are currently 2 million 3G broadband subscribers. 13 Social media use is low, with 3 million users (9% penetration) as of January 2017, but it has grown 43% since January 2016, with access primarily through mobile phones (67%). 14 This year, the historical downward trajectory of radio and upward trajectory of television have intersected, with radio now second to TV as the most common source of news and information. Mobile phones, mosques, and community shuras remain common sources of information. The use of the Internet for news and information had been on an upward trend, but plateaued this year, even as access to the Internet increased. Overall, 65.7% of Afghans say they have confidence in the media (38.2% some confidence, plus 27.5% a lot of confidence). Rural residents, however, say more frequently than urban residents that they have no confidence at all (12.3%, rural vs. 8.5%, urban). Young Afghans are more likely to have a lot of confidence in the media (29.0%). There are distinct regional differences as well: 39.2% in the Central/Hazarajat region have a lot of confidence in the media, 15 for example, whereas only 18.9% in the West region do, while 18.1% in the South West have no confidence at all, compared to 6.3% in Central/Hazarajat. This chapter explores Afghans media consumption habits, preferences for sources of news and information, and the role of the media in shaping opinions on security, government, and women s rights. ACCESS TO INFORMATION AND THE MEDIA 123
134 7.1 SOURCES OF NEWS AND INFORMATION KEY QUESTIONS Q-65. Do you use any of the following to obtain news and information? (a) Radio. (b) Television. (c) Mobile phone. (d) Internet. (e) Mosque. (f) Community shuras. (g) Friends and family. Q-58. Do you listen to radio programs? Q-59. You said you listen to the radio. How many hours do you listen to it on an average day when you listen to the radio? Q-60. Do you watch television programs? Q-61. You said that you watch television. How many hours do you watch it on an average day when you watch television? D-5. How many of the following does your household have? (d) Television. D15a. Do you personally use a mobile phone or not? D-15c. How many members of this household who live here have their own mobile phone? Like last year, family and friends continue to be the most common source of information in 2017, followed by TV and radio. Radio use has declined, from 70.5% in 2016 to 62.3% in 2017, while TV use decreased slightly in that period, from 66.4% to 64.9%. Mobile phones remain a common tool for Afghans to receive information (42.1% in 2016, 43.4% in 2017). Mosques and community shuras also remain common sources of information, but this number declined slightly in 2017 compared to 2016, from 47.5% to 45.5% for mosques, and from 38.9% to 36.3% for community shuras. Reliance on family and friends for information has remained steady (80.4% in 2016, 79.8% in 2017). Surprisingly, after a strong climb since 2013, the use of the Internet as an information source has not increased in 2017, remaining at the same level, 11.6%, as in 2016 (figure 7.1). 10 0% 80% 60% 40% SOURCES OF NEWS AND INFORMATION % 0% RADIO TV MOBILE PHONE INTERNET MOSQUE SHURAS FRIENDS AND FAMILY FIG. 7.1: Q-65. Do you use any of the following to obtain news and information? (a) Radio; (b) Television; (c) Mobile phone; (d) Internet; (e) Mosque; (f) Community shuras; (g) Friends and family. 124 AFGHANISTAN IN 2017
135 RADIO When asked if they listen to the radio, 64.5% of Afghans say yes, down just slightly from 65.7% in 2016, continuing the downward trend in radio listenership since Listening to the radio is more frequent among rural residents (68.8%) than urban residents (51.3%), and is particularly popular in the East region (87.2%). More men (70.5%) than women (58.4%) report listening to the radio. Among respondents who say they listen to radio, 17.6% listen less than 30 minutes daily, 36.1% listen from 31 minutes to one hour daily, 29.2% listen between one and two hours daily, and 16.8% listen more than two hours every day. Use of the radio as a source of information is highest in the East (86.3%) and lowest in the Central/Hazarajat region (32.5%). TELEVISION Television viewership continues to rise: 66.6% of Afghans say they watch TV in 2017, compared to 64.5% in For the first time since the Survey began, more people watch TV than listen to radio, corresponding to the upward trend in TV ownership (66.4% of households report owning at least one TV in 2017, compared to 61.3% in 2016, 62.1% in 2015, and 58.3% in 2014). Television ownership is more common in urban than rural areas: 63.8% of urban residents report owning one TV, and 20.0% own two TVs. Television ownership is especially prevalent in the Central/Kabul region, where 61.5% own one TV, 15.6% own two, and 5.9% own more than two. As noted in earlier Surveys, more people in Kabul own televisions due to better supply of electricity and other infrastructure. In addition, the new digital TV system, Oqaab, launched in 2016 in Kabul, may have increased the public s desire to own a TV. Not surprisingly, television viewership is more common in urban areas (91.4%) than rural (58.4%). It is also more common among younger Afghans (69.0% for ages 18 30), and Afghans with bachelor s degrees (89.8%). Men and women report watching TV about equally (67.2% for men, 66.0% for women). Television is most popular as a source of information among respondents in the Central/ Kabul region (80.8%), and least popular in the provinces of the South West (31.8%). Among TV viewers, 5.5% say they watch less than 30 minutes daily, 22.2% watch from 31 minutes to one hour daily, 35.9% watch between one and two hours daily, and 35.8% watch over two hours. Viewers in Kabul are particularly likely to watch more than two hours of TV a day (51.6%). MOBILE PHONES Mobile phones are a popular communications tool, with 62.0% of respondents reporting they own their phone, and 68.4% reporting that two or more people in their households have mobile phones. Mobile phones tend to be owned by the young (63.0% of the age group), the educated (92.4% of respondents with bachelor s degrees), men (78.3%), and urban residents (79.3%). More men than women have their own phones (78.3% vs. 45.7%). Mobile phones are used to get news and information by 43.4% of all respondents (figure 7.1), by 52.7% of urban and 40.3% of rural respondents, and by 52.5% of male and 34.3% of female respondents (figure 7.2). The rate of mobile phone ownership is highest in the Central/Kabul (76.8%) and lowest in the South West (39.3%). INTERNET After a strong upward trend since 2013, (3.2% in 2013, 5.6% in 2014, 9.6% in 2015, 11.6% in 2016), use of the Internet as a source of news and information appears to have plateaued in 2017, unchanged at ACCESS TO INFORMATION AND THE MEDIA 125
136 11.6%. It remains a more common means to get news and information among males (18.0%) than females (5.1%), urban respondents than rural (24.8% vs. 7.2%), the young (15.3% age vs. 5.2% over 60), and the educated (50.5% of university graduates vs. 2.6% of the unschooled). Geographically, Internet users are more common in the Kabul/Central region (21.3%) and the South East (17.2%), while the Central/Hazarajat region has the lowest rate, at 2.8%. MOSQUE Mosques remain an important source of news and information for 45.5% of Afghans, trending slightly downward from 48.3% in 2015 and 47.5% in Afghans who get their news and information from mosques are more frequently rural (47.8%), male (68.3%), and older than 60 (62.3% over 60 vs. 43.6% age 18 30). The mosque is also a popular source of information for highly educated respondents, with 54.3% of those with a bachelor s degree reporting that they use a mosque for news and information, among other sources. Those who access information from mosques is highest in the North West (54.1%) and lowest in the South West (40.1%). COMMUNITY SHURA The community shura is less commonly a source of information for Afghans (36.3%) than other sources, declining in 2017 after an upward trend in previous years (36.4% in 2014, 37.4% in 2015, 38.9% in 2016). Shuras are used more by rural (39.6%) than urban (26.4%) respondents, and more men (52.9%) than women (19.7%). Older Afghans seem to favor shuras more than younger Afghans (53.4% over 60 years vs. 33.9% age 18 30). Respondents from the Central/Hazarajat region (53.6%) and the North West region (49.6%) use community shuras as a source of news and information more than other regions, while those in the South East use them the least (27.2%). FAMILY The friends-and-family category was added to the Survey in 2016, and as a source of news and information is frequently cited by respondents, with 79.8% of Afghans saying they rely on friends and family for news and information, down slightly from 80.4% in Friends and family are important information sources for nearly everyone: male and female (81.3% and 78.2%), urban and rural (81.0% and 76.2%), young and old (79.4% age and 83.4% over 60). Afghan culture emphasizes the importance of tight-knit families and groups of friends, and their importance as sources of information is not surprising. While family and friends are popular sources of information across the country, respondents in the North West cited them the most (85.8%), and respondents in the Central/Hazarajat region the least (71.7%). 126 AFGHANISTAN IN 2017
137 SOURCES OF NEWS AND INFORMATION, BY GENDER AND SETTLEMENT 100% 90% 80% 70% 60% 50% 40% 30% 20% 10% 0% RADIO TV MOBILE PHONE INTERNET MOSQUE SHURAS FRIENDS AND FAMILY RURAL URBAN MALE FEMALE FIG. 7.2: Q-65. Do you use any of the following to obtain news and information? (a) Radio; (b) Television; (c) Mobile phone; (d) The Internet; (e) Mosque; (f) Community shuras; (g) Friends and family. 7.2 ACCESS TO THE INTERNET AND USE OF SOCIAL MEDIA KEY QUESTIONS Q-63. Do people in your area have access to the Internet, either through a cable connection, a wireless/wifi connection, or cellular data (e.g., 2G or 3G)? Q-64. Do you personally have access to the Internet? D-15d. (Ask if 1 or more mobile phones in D-15c). And how many members of your household own mobile phones that can access the Internet, such as the ability to access , websites, or Facebook? Social media use is popular among Afghans and growing. 16 Social media has been used to call attention to campaigns for social change most recently, the #WhereIsMyName campaign, which used Twitter to open discussion about the traditional custom of not using a woman s given name in public. 17 This year, 41.1% of respondents overall say the Internet is available in their area, through a cable connection, a wireless connection, or 2G/3G, a slight increase from 40.0% in Internet accessibility is particularly common in Kabul (81.9%) and urban areas generally (70.2%), while rural areas remain underserved. Just 3.1% of respondents in Nuristan, for example, say their area have Internet access via any means. Internet access through smart phones is on the rise, with 15.0% of respondents in 2017 saying their household has two or more such devices, compared to 7.7% in Nationwide, respondents personal access to the Internet has also increased slightly, from 11.2% in 2016 to 13.5% this year. Personal access to the Internet, as opposed to access through a school, library, or borrowed device, is more common among men (20.2%) than women (6.7%), and is especially common among respondents with a bachelor s degree, at 53.1% (figures 7.3 ). ACCESS TO INFORMATION AND THE MEDIA 127
138 PERSONAL ACCESS TO THE INTERNET BACHELOR'S DEGREE 53 NO SCHOOLING 4 FEMALE 7 MALE 20 URBAN 27 RURAL 9 0% 10% 20% 30% 40% 50% 60% 70% FIG. 7.3: Q-64. Do you personally have access to the Internet? (Percent who say yes.) The use of the Internet as a source of news and information trended strongly upwards from 2013 through 2016, so the plateau observed in the 2017 Survey (11.6%) is worth noting (figure 7.1), especially in light of the continued growth of general availability of the Internet and personal access. Are respondents using the Internet less in general, even though more have access to it, or are they using it less to obtain news and information specifically? Additional questions that may provide deeper insight into the use of this information source in the next Survey might include how long and what activities they engage in while online. 7.3 ROLE OF THE MEDIA IN PUBLIC OPINION AND BEHAVIOR KEY QUESTIONS Q-65. Do you use any of the following to obtain news and information? (a) Radio. (b) Television. (c) Mobile phone. (d) Internet. (e) Mosque. (f) Community shuras. (g) Friends and family. Q-17. How often do you fear for your own personal safety or security or for that of your family these days? Would you say you always, often, sometimes, rarely, or never fear for you and your family s safety? Q-19. In your view, does ISIS/Daesh currently pose a threat to the security of your district? Q-55a. Thinking about the reasons why the Taliban have been fighting during the past year, in general, would you say that you have a lot of sympathy, a little sympathy, or no sympathy at all for the Taliban? Q-57a. Thinking about the reasons why Daesh has been fighting during the past year, in general, would you say that you have a lot of sympathy, a little sympathy, or no sympathy at all for Daesh? Q-44. On the whole, how satisfied or dissatisfied are you with the way democracy works in Afghanistan? By democracy, we mean choosing the president and Parliament by voting, rather than appointment or selection by some leaders. 128 AFGHANISTAN IN 2017
139 Q-52. Thinking of the different levels of government in Afghanistan, do you think that, overall, the [insert item] is doing a very good job, a somewhat good job, a somewhat bad job, or a very bad job? (a) National Unity Government. (b) Provincial government. Q-53. Do you think reconciliation between the Afghan government and the Taliban is possible, or impossible? Q-82a. Tell me, if given the opportunity, would you leave Afghanistan and live somewhere else, or not? Q-68. Tell me, do you strongly agree, somewhat agree, somewhat disagree, or strongly disagree with the following statements? (a) The practice of baad is acceptable. (b) The practice of baddal is acceptable. Q-69. Some people say that women should have the same opportunities as men in education. Do you agree or disagree with this opinion? Q-71. Some people say that women should be allowed to work outside the home, while others say that women should not be allowed to work outside of the home. What is your opinion? Q-76. In your view, which one of these women is dressed most appropriately for public places? Just point to one picture. Q-77. Do you think that political leadership positions should be mostly for men or mostly for women, or do you think that both men and women should have equal representation in the political leadership? Q-78. Do you think women should be allowed to vote in elections? The media can be a powerful tool for changing public opinion and behavior. This section examines the relationships between sources of news and information and Afghans perspectives on security, democracy and government, and women s rights. Television and the Internet are given particular attention due to their demonstrated importance as sources of news and information. SECURITY How violence is presented and discussed in different media may have an effect on people s perceptions. For example, viewing graphic reports of violent attacks by armed, antigovernment groups on televised newscasts may make them appear to be more frequent, closer, and more violent than hearing about them on the radio. People who watch TV for news and information say slightly more frequently that they fear for their own personal safety always or often (38.3%) than consumers of other sources of news, such as radio (37.3%). Regression analysis to control for other demographic factors shows that television viewers are significantly more likely to report fearing for their personal safety. On the other hand, multivariate regression shows people who use the Internet for news and information are less likely to report that they feel fear when participating in sociopolitical activities. A great number of people who listen to radio for news and information believe that ISIS/Daesh poses a threat to the security of their district (42.6%), whereas fewer people who use the Internet as a news source do (37.3%). In addition, 18.2% of radio listeners express some level of sympathy for the Taliban, and 2.9% have some level of sympathy for ISIS/Daesh, while TV viewers and Internet users tend to report having no sympathy ACCESS TO INFORMATION AND THE MEDIA 129
140 at all for the Taliban (84.1% and 82.2%, respectively) or ISIS/Daesh (93.4% and 92.1%, respectively). These correlations between choice of news source and opinions about the Taliban or ISIS/Daesh may be more indicative of the geographic locations of the respondents, as Internet and television users are more likely to be in Kabul, which is relatively safer, while radio listeners are more likely to be in the East and South East regions, where the Taliban are active and ISIS/Daesh is known to have gained a foothold. DEMOCRACY AND GOVERNMENT The concept and activities of a democratic society are still relatively new to Afghanistan, and Afghans are still coming to grips with what these mean in their own lives. The results of the 2014 presidential election and the formation of the National Unity Government have raised questions about democracy in Afghanistan. The media has closely followed the formation and subsequent activities of the NUG, so a brief look at how media consumption intersects with perceptions of democracy and government may shed light on the role media may play in shaping those perceptions. 18 When considering overall satisfaction with democracy (i.e., the popular election of representative government), Afghans who receive news and information from the Internet are most likely to say they are very satisfied or very dissatisfied with democracy 16.7% in both cases, more than any other news source. Satisfaction with the NUG is highest among those who listen to radio for news, 17.4% of whom say it is doing a very good job, while dissatisfaction is highest among Internet users, 21.1% of whom say the NUG is doing a very bad job. The same pattern holds for provincial governments: 14.7% of radio listeners say their provincial government is doing a very good job, while 21.1% of Internet users surveyed say their provincial government is doing a very bad job. Internet users are more likely than respondents who rely on other sources for news to believe that reconciliation with the Taliban is possible (58.4%). The highest percentage of Afghans who believe that reconciliation is impossible is among television viewers (43.1%). Internet users are slightly more inclined to say they would leave Afghanistan if given the opportunity (42.9%) than TV viewers (42.1%) or radio listeners (40.2%). It appears that Internet users are more critical of their government at the national and provincial levels, which may be related to the higher use of the Internet among the younger and better educated segments of the Afghan population. It is interesting, on the other hand, that more users of the Internet than users of other media believe reconciliation is possible, as Internet users tend to have no sympathy for the Taliban (82.2%) or ISIS/ Daesh (92.1%). 130 AFGHANISTAN IN 2017
141 WOMEN S RIGHTS Several questions in the Survey asked for respondents opinions about issues of women s rights, such as access to education, work, and participation in government. Afghans who get their news and information from the Internet or TV tend to express more liberal views of women s issues than those who rely, for example, on the radio or the mosque. The cultural practices of baad and baddal are generally disfavored by most respondents (figure 7.4), but Internet users are most likely to disapprove of these two practices (91.2% and 78.5%, respectively), followed by those who get their news and information from TV (89.2% and 72.7%, respectively). (See chapter 8, Women in Society. ) More than half of Internet users (51.4%) and nearly half of television viewers (46.9%) strongly agree that women should have equal opportunity to seek education. More than three-quarters of Internet users (77.7%) and television viewers (78.8%) agree that women should be allowed to work outside the home (figure 7.5). PERCEPTIONS OF BAAD AND BADDAL, BY MEDIA TYPE 100% 90% 80% 70% 60% 50% 40% 30% 20% 10% 0% RADIO TV MOBILE PHONE INTERNET MOSQUE SHURAS FRIENDS AND FAMILY 70 BAAD IS ACCEPTABLE (DISAGREE/STRONGLY DISAGREE) BADDAL IS ACCEPTABLE (DISAGREE/STRONGLY DISAGREE) FIG. 7.4: Q-65. Do you use any of the following to obtain news and information? (a) Radio; (b) Television; (c) Mobile phone; (d) Internet; (e) Mosque; (f) Community shuras; (g) Friends and family. Q-68. Tell me, do you strongly agree, somewhat agree, somewhat disagree, or strongly disagree with the following statements? (a) The practice of baad is acceptable. (b) The practice of baddal is acceptable. ACCESS TO INFORMATION AND THE MEDIA 131
142 PERCEPTIONS OF WOMEN'S RIGHTS, BY MEDIA TYPE 100% 80% % 40% % 0% RADIO TV MOBILE PHONE INTERNET MOSQUE SHURAS FRIENDS AND FAMILY WOMEN AND MEN SHOULD HAVE THE SAME OPPORTUNITIES FOR EDUCATION (STRONGLY AGREE) WOMEN SHOULD BE ALLOWED TO WORK OUTSIDE THE HOME FIG. 7.5: Q-65. Do you use any of the following to obtain news and information? (a) Radio; (b) Television; (c) Mobile phone; (d) Internet; (e) Mosque; (f) Community shuras; (g) Friends and family. Q-69. Some people say that women should have the same opportunities as men in education. Do you agree or disagree with this opinion? Q-71. Some people say that women should be allowed to work outside the home, while others say that women should not be allowed to work outside of the home. What is your opinion? Users of these media also hold more liberal views on women in the political sphere: 90.5% of Internet users and 93.5% of TV viewers believe women should be allowed to vote, for example, and 49.3% of Internet users and 48.7% of TV viewers say positions of political leadership should be filled by both men and women (figure 7.6). 132 AFGHANISTAN IN 2017
143 PERCEPTIONS OF WOMEN IN POLITICAL SPHERE, BY MEDIA TYPE 100% 90% 80% 70% 60% 50% 40% 30% 20% 10% 0% RADIO TV MOBILE PHONE INTERNET MOSQUE SHURAS FRIENDS AND FAMILY POLITICAL LEADERSHIP POSITIONS SHOULD BE FOR WOMEN AND MEN EQUALLY WOMEN SHOULD BE ALLOWED TO VOTE FIG. 7.6: Q-65. Do you use any of the following to obtain news and information? (a) Radio; (b) Television; (c) Mobile phone; (d) Internet; (e) Mosque; (f) Community shuras; (g) Friends and family. Q-77. Do you think that political leadership positions should be mostly for men or mostly for women, or do you think that both men and women should have equal representation in the political leadership? Q-78. Do you think women should be allowed to vote in elections? Finally, while respondents in general prefer more conservative dress for women in public, Internet users and TV viewers express tolerance for more revealing head coverings for women: when presented with the illustrations in figure 7.7, 23.1% of Internet users chose image 4 and 11.2% chose image 5, while 20.4% of television viewers chose image 4 and 8.4% chose image 5 (figure 7.7). ACCESS TO INFORMATION AND THE MEDIA 133
144 APPROPRIATE DRESS FOR WOMEN IN PUBLIC, BY MEDIA TYPE 40% 35% 30% 25% 20% 15% 10% 5% 0% RADIO TV MOBILE PHONE INTERNET MOSQUE SHURAS FRIENDS AND FAMILY IMAGE 1 IMAGE 2 IMAGE 3 IMAGE 4 IMAGE 5 IMAGE 6 FIG. 7.7: Q-65. Do you use any of the following to obtain news and information? (a) Radio; (b) Television; (c) Mobile phone; (d) Internet; (e) Mosque; (f) Community shuras; (g) Friends and family. Q-76. In your view, which of these women is dressed most appropriately for public places? Just point to one picture. Overall, it appears that Afghans who use the Internet or TV for news and information have a more liberal perspective on women s rights, 19 are more critical of government, and are less sympathetic to extremism, but it is impossible to establish causation between these variables. Because television and the Internet are the communication channels most favored by young, urban, educated Afghans, they are effective channels to reach this population, while other channels are better for reaching other population segments of Afghan society. Do younger, educated, urban Afghans hold these views because television and the Internet expose them to more liberal ideas, or do they already hold these views due to their youth, education, or other exposures, making them more inclined to seek news and information via TV or the Internet? 134 AFGHANISTAN IN 2017
145 End Notes 1 Constitution of Afghanistan, January 3, 2004, English-language website of the Supreme Court of Afghanistan, supremecourt.gov.af/content/media/documents/constitution2004_english pdf. 2 Mass Media Law 2009, UNESCO, Law% pdf. 3 Access to Information Law 2014, Freedominfo.org, December 9, 2014, The text of the law in English is available as a Word document link in the webpage. 4 Ann Proctor, Afghanistan s Fourth Estate: Independent Media, Peace Brief 189 (United States Institute of Peace, August 2015), 5 Sayed Niyam Shinwaray, Afghans journey to make access to information a reality, Pajhwok Afghan News, August 27, 2017, 6 Oversight Commission on Access to Information, 7 Reporters Without Borders ranks Afghanistan 120th in its 2017 World Press Freedom Index, and Freedom House gives Afghanistan a status of not free in its 2017 Freedom in the World report. Afghanistan, Reporters Without Borders, Freedom in the World 2017: Afghanistan, Freedom House, report/freedom-world/2017/afghanistan. 8 Tariq Ahmad, Afghanistan: Cyber Crime Code Signed into Law, Global Legal Monitor, August 16, 2017, gov/law/foreign-news/article/afghanistan-cyber-crime-code-signed-into-law/. For drafts of the Cyber Crime Law in English and Dari, see Afghanistan Cyber Crime Law Drafted Version, NITPAA, 9 NAI, Part of the national cyber security strategy of Afghanistan (NCSA) and Afghan Panel Code interdict the freedom of speech, NAI blog, July 4, 2017, 10 Correspondence with Mr. Mohammad Azizi, chair of the Afghan Telecommunications Regulatory Agency, September 11, Channel List, Oqaab, 12 Phil Harpur, Afghanistan Telecoms, Mobile and Broadband Statistics and Analyses (BuddeComm, May 22, 2017), Ibid. 14 HootSuite and We Are Social, Digital in 2017: Southern Asia, LinkedIn SlideShare report, January 26, 2017, slideshare.net/wearesocialsg/digital-in-2017-southern-asia. 15 This rate of confidence is interesting because the rates of use of media such as radio and television in this region are not very high. For example, radio use in this region was the lowest of all the regions, at 32.5% of respondents; Internet use was also the lowest, at just 2.8%; and television use was the third-lowest, at 57.6%. Respondents in the Central/Hazarajat region prefer to get their news and information from community shuras (53.6%, the highest rate of all the regions). 16 HootSuite and We Are Social, Digital in Mujib Mashal, Their Identities Denied, Afghan Women Ask, Where Is My Name? New York Times, July 30, 2017, The relationship between media use and satisfaction with government is a prominent topic in communications research. For example: Hilde Coffé, Citizens media use and the accuracy of their perceptions of electoral integrity, International Political Science Review 38, no. 3 (2017): Regression analysis was conducted on the scale for women s rights, consisting of 14 questions in the 2017 Survey (alpha = 0.86), controlling for number of hours of TV watched and demographic questions. Results indicated that more hours of TV viewed correlated significantly with support for women s rights. A separate regressions analysis controlled for the use of the Internet as a source of news and information, and demographic questions. Results showed a positive correlation between the use of the Internet as a news source and support for women s rights. ACCESS TO INFORMATION AND THE MEDIA 135
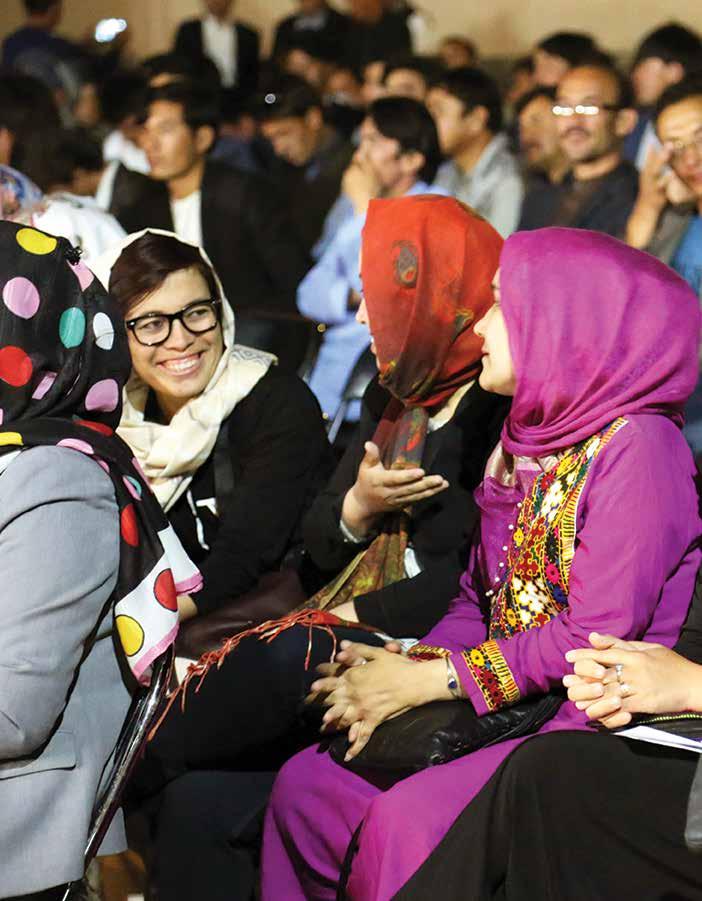
146
147 8 WOMEN IN SOCIETY There is a robust relationship between the strength of democracy, gender equality, and security. 1 This relationship is implicit in the National Unity Government (NUG) efforts to strengthen the rights of Afghanistan s women, most notably through the National Action Plan on UNSCR 1325 Women, Peace, and Security (NAP 1325), launched in July The NAP 1325 has a far-reaching agenda to increase the political participation of women in Afghanistan, protect them from violence, and provide economic resources to women affected by conflict. 2 Since the ousting of the Taliban in 2001, and the adoption of the Afghan constitution in 2004, many gains have been made in public attitudes towards women s role in politics and leadership. More than 78,000 women have been appointed to government positions since 2001, and over 8,000 women currently hold government offices.. Initiatives to empower Afghan women and promote peace continue in Conferences have promoted the important role of women in securing peace, 3 programs have been launched to improve women s employment opportunities and access to government services, 4 and grassroots efforts have been made by women to achieve a more secure Afghanistan. 5 The government continues to collaborate with aid agencies to help Afghan women increase their economic power, reduce poverty, and positively influence workplace policies. 6, 7 Women are also becoming more visible in the Afghan media. Zan TV, a network run exclusively by Afghan women, was launched in May of this year. 8 Gellara, Afghanistan s first magazine for women, was launched in the same month. 9,10 A social media campaign encouraging men to refer to their wives by name, rather than by their family position (i.e., wife ) is also gaining momentum. 11 Yet Afghan women and girls still face systemic challenges. The implementation of NAP 1325 has been slow: women are still underrepresented in peace processes, 12 government institutions, and the workplace. 13 Afghanistan is one of the most dangerous countries in the world for women, 14 but the 2009 Law on the Elimination of Violence Against Women (EVAW) remains largely unenforced, 15 and a high tolerance for child marriage still exists. 16 This year, the Survey reveals mixed findings for Afghanistan s women. For example, the level of support for the cultural practices of baad and baddal continues to decline, and support for women in leadership positions apart from the office of president has increased marginally since last year. Consistent with Survey findings in 2016, however, lack of education and illiteracy remain significant problems for women in Afghanistan. They are the most frequently cited issues for women among all respondents, irrespective of gender, age, or ethnicity and across the rural/urban divide. In 2006, a record 91.5% of respondents agreed that men and women should have equal access to educational opportunities. In 2015 that figure had dropped to 78.2%. A slight rebound, to 80.7% in 2016 and 82.3% in 2017, reflects a positive but slow-growing trend. The results of the Survey this year highlight the critical link between education and gender equality, and reaffirm that educational opportunities are a key priority for girls and women in Afghanistan. WOMEN IN SOCIETY 137
148 This chapter examines Afghan attitudes on a range of issues that disproportionately affect women. These include access to justice, certain cultural practices, the equal right to political participation, educational opportunities, and economic advancement as well as women s perceptions of safety and security. 8.1 WOMEN S ACCESS TO JUSTICE KEY QUESTIONS Q-33. In the past two years, have you had a dispute or a formal case that you couldn t settle with the other party and had to go to the Huquq Department or village/neighborhood-based shura/jirga to resolve it, or not? Q-34. (If Q-33 answer is yes ) What kind of a case or dispute was it? (Single response. If more than one case or dispute, ask for the most recent one.) (a) Dispute over land. (b) Other property dispute, not land. (c) Commercial dispute. (d) Divorce. (e) Family problems. (f) Traffic accident. Q-36. (If Q-33 answer is yes ) Where have you taken this case or dispute? Q-66. In your area, is there an organization, institution, or authority where women can go to have their problem(s) resolved? Q-67a. (If Q-66 answer yes ) What organization, institution, or authority is that? Q-67b. (If Q-66 answer is yes ) Have you ever contacted this or another organization, institution, or authority that helps solve women s problems in your area? The Survey asks Afghans (see Governance chapter for all data) whether in the past two years they have experienced a dispute or formal case that they were unable to settle with the other party, and if so, where did they seek resolution of that dispute/formal case. Of those respondents who had such an experience, somewhat more men than women say they took a case to a village shura/jirga (45.2% vs. 41.2%), but marginally more women than men turned to state courts (40.4% vs. 38.5%) and the Huquq Department (25.1% vs. 21.7%). Not surprisingly, when the dispute involves family problems, more than half of women (53.4 %) say they turn to the village/neighborhood-based shura/jirga (figure 8.1). This is significant in light of research showing that shuras/jirgas not only transform attitudes on women s rights, but also contribute to lower levels of domestic violence AFGHANISTAN IN 2017
149 TYPE OF DISPUTE, BY LOCATION: WOMEN 60% 50% 40% 30% 20% % 0% DISPUTE OVER LAND OTHER PROPERTY DISPUTE, NOT LAND COMMERCIAL DISPUTE DIVORCE FAMILY PROBLEMS TRAFFIC ACCIDENT HUQUQ DEPARTMENT STATE COURT VILLAGE SHURA/JIRGA FIG. 8.1: Q-33. In the past two years, have you had a dispute or a formal case that you couldn t settle with the other party and had to go to the Huquq Department or village/neighborhood-based shura/ jirga to resolve it, or not? Q-34. (If Q-33 answer is yes) What kind of a case or dispute was it? (Single response. If more than one case or dispute, ask for the most recent one.) In 2014, 19.2% of Afghans said they were aware of an organization, institution, or authority where women can go to have their problem(s) resolved. This year, 23.2% of respondents say they know of such a place, a figure almost identical to last year (23.8%). Among respondents who are aware of an organization, institution, or authority specifically for the resolution of women s problems, 55.7% identify the Directorate of Women s Affairs (DoWA), up from 51.1% in 2016, while 9.2% name the Afghanistan Independent Human Rights Commission (AIHRC), and 7.1% mention the district governor s office. Slightly more rural than urban respondents say they are aware of an organization, institution, or authority where women can go to have their problem(s) resolved (23.8% vs. 21.3%), with almost identical proportions of rural and urban respondents identifying the DoWA (55.7% and 55.5%, respectively). Rural Afghans are slightly more likely than urban respondents to identify the AIHRC (9.5% vs. 8.1%) and women s shuras (3.9% vs. 2.5%) as agencies for women s dispute resolution. Slightly more urban respondents report an awareness of local councils (4.7%) than rural respondents (3.4%). Of respondents who are aware of organizations where women can have their problems resolved, 37.5% say they have contacted one of them. Slightly more men than women say they have contacted one of them (38.8% vs. 36.4%). This type of contact is reported significantly more frequently by rural than by urban respondents (40.4% vs. 27.7%). This reflects a decline from 2016, when 43.6% of rural and 33.1% urban respondents said they had contacted one of these organizations. Slightly more women than men say they are aware of these kinds of organizations (23.8% vs. 22.5%); however, significantly more women than men (62.3% vs. 48.6%) are aware of the DoWA. This difference may reflect WOMEN IN SOCIETY 139
150 the significant international support that has been provided to publicize the DoWA among women as an institutional option for dispute resolution. Men and women cite the AIHRC in relatively equal proportions (9.1% men, 9.3% women). Twice as many men (9.8%) as women (4.7%) identify the district governor s office as a place women can go to resolve their problems. And slightly more men (38.8%) than women (36.4%) say they have contacted one of these organizations. Among the provinces, respondents in Panjshir, Ghor, and Uruzgan are the most likely to indicate they are aware of an organization, institution, or authority where women can go to have their problems resolved (90.8%, 53.2%, and 48.8%, respectively). This compares to just 5.9% of respondents in Zabul, 1.8% of respondents in Nuristan, and 0.7% of respondents in Bamyan. The very large difference between Panjshir, in Central/ Kabul, and Bamyan, in Central/Hazarajat, mirrors trends in education levels: respondents in Panjshir are more educated than respondents in Bamyan CUSTOMS AND CULTURAL PRACTICES KEY QUESTIONS Q-68. Tell me, do you strongly agree, somewhat agree, somewhat disagree, or strongly disagree with the following statements? (a) The practice of baad is acceptable. (b) The practice of baddal is acceptable. (c) A daughter is entitled to part of her deceased father s inheritance (miras). Q-76. In your view, which one of these women is dressed most appropriately for public places? Just point to one picture. Q-80. What do you think is the best age for a woman to get married? Q-81. What do you think is the best age for a man to get married? As in previous years, this year s Survey asks respondents about their perceptions of three cultural practices related to women: baad, baddal, and miras. Baad is the traditional practice of giving away a daughter to another party as a penalty or payment to settle a debt or resolve a dispute, grievance, or conflict between families. Baddal refers to the exchange of daughters in marriage between families. This is often, but not always, a form of forced marriage, and may have economic implications (e.g., there is generally no bride price involved). 19, AFGHANISTAN IN 2017
151 ACCEPTABILITY OF BAAD AND BADDAL 40% 35% 30% 25% 20% 15% 10% 5% 0% BAAD IS ACCEPTABLE BADDAL IS ACCEPTABLE FIG. 8.2: Q-68. Tell me, do you strongly agree, somewhat agree, somewhat disagree, or strongly disagree with the following statements? (a) The practice of baad is acceptable. (b) The practice of Baddal is acceptable. (Percent who strongly or somewhat agree with each.) Overall support among Afghans for the practices of baad and baddal continues to decline (figure 8.2). Only 12.0% of Afghan respondents in this year s Survey agree ( strongly or somewhat ) that baad is acceptable, compared to 18.0% who agreed with the practice in Disagreement with the practice has correspondingly increased. This year, 70.4% of respondents express strong disagreement with the idea that baad is an acceptable practice, compared to 65.4% of respondents in Similarly, 17.4% of respondents this year disagree somewhat with the practice of baad, compared to 16.2% last year. Levels of disagreement ( strongly or somewhat ) with the practice of baad are higher in urban than rural areas (93.1% vs. 86.0%), but men and women disagree equally with the practice (87.8%). While there is little variation among ethnic groups in terms of their disagreement with the practice of baad (Hazara, 88.3%; Tajik, 88.1%; Pashtun, 87.5%; and Uzbek, 86.6%), there are regional variations. A very high proportion of respondents in the Central/Kabul region disagree with the practice (94.6%), compared to 74.6% in the West. Strong disagreement with the practice of baad generally increases with higher levels of formal education. 21 With regard to baddal, 29.1% of Afghans in this year s Survey agree (strongly or somewhat) that this practice is acceptable. This reflects a marginal decrease from the 31.8% of respondents who agreed with this tradition in 2016 (figure 8.2). Not surprisingly, women are more likely to disagree with the practice than men (72.4% vs. 68.7%), and urban Afghans are more likely to disagree with the practice than rural (80.1% vs. 67.3%). While over half of Afghans disagree with the practice of baddal (70.5%), disagreement is highest in the Central/Kabul region (81.6%), and lowest in the West (56.9%). As with attitudes towards baad, disagreement with baddal varies little along ethnic lines. Relatively similar proportions of Pashtuns (71.6%), Tajiks (70.9%), Hazaras (68.3%), and Uzbeks (65.0%) disagree with the practice. Data indicates that over time, overall disagreeing with the practice (strongly or somewhat) increases with higher levels of education. WOMEN IN SOCIETY 141
152 The majority of Afghans, 89.9%, agree strongly or somewhat that a daughter is entitled to an inheritance (miras), and there is little difference between the proportions of men and women who hold this opinion (90.3% vs. 89.6%). Similarly, urban and rural Afghans differ only slightly in their agreement with the practice (91.2% and 89.5%, respectively). There are regional differences, with support for miras at its lowest in the South East (83.3%) and highest in North East (96.0%). Uzbeks most frequently indicate agreement with the practice (94.4%), compared to Tajiks (91.1%), Pashtuns (89.6%), and Hazaras (83.2%). Young women (18 30 years of age) who reside in urban areas are more likely to agree with women s entitlement to miras (72.8%) than young women living in rural areas (64.9%). Differences between urban and rural attitudes are often positively correlated with levels of education. For instance, in 2017, more than twice the number of women in urban areas have a high school degree than in rural areas (22.3% vs. 8.9%). PERCEPTIONS OF APPROPRIATE DRESS IN PUBLIC In conservative societies, women s outward appearance, particularly their compliance or noncompliance with traditional or religious norms of dress requiring such garments as the hijab, chador, and burqa, can have significant political or social ramifications. Since 2014, the Survey has tracked perceptions of appropriate dress for women in public places. Respondents are shown six images of women wearing different garments and asked to select the woman they think is most appropriately dressed for a public place (figure 8.3). Overall, 32.7% of respondents, nearly a third, selected the image of a woman wearing a burqa (image 1), 28.5% selected the niqab (image 2), 16.4% selected the first hijab (image 4), and 14.7% selected the chador, or headscarf (image 3). Fewer Afghans (6.8%) pointed to the loose hijab (image 5), and fewer than 0.6% selected the image of a woman with no headwear (image 6). As indicated in figure 8.3, there are some notable differences between the attitudes of men and women towards women s dress in public. The most significant difference is between the responses of men and women to image 1, the burqa, which men are significantly more likely than women (37.8% vs. 27.5%) to identify as the most appropriate form of dress for women in public. A larger number of women than men (19.9% vs. 13.0%) chose the hijab in image AFGHANISTAN IN 2017

153 APPROPRIATE DRESS FOR WOMEN IN PUBLIC: PERCEPTIONS OF MEN VS. WOMEN 40% 35% 30% 25% 20% 15% 10% 5% 0% IMAGE 1 IMAGE 2 IMAGE 3 IMAGE 4 IMAGE 5 IMAGE 6 MALE FEMALE FIG. 8.3: Q-76. In your view, which one of these women is dressed most appropriately for public places? Just point to one picture. Differences between rural and urban respondents are more pronounced. Significantly more rural than urban respondents prefer the more conservative image 1 (36.7% vs. 20.5%). Roughly twice as many urban as rural Afghans preferred image 4 (25.3% vs. 13.5%) and image 5 (12.4% vs. 5.0%). PERCEPTION OF APPROPRIATE DRESS FOR WOMEN IN PUBLIC, BY LEVEL OF EDUCATION IMAGE 1 IMAGE 2 IMAGE 3 IMAGE 4 IMAGE 5 IMAGE 6 % % % % % % NEVER WENT TO SCHOOL PRIMARY SCHOOL COMPLETE SECONDARY SCHOOL COMPLETE HIGH SCHOOL COMPLETE UNIVERSITY EDUCATION COMPLETE FIG. 8.4: Q-76. In your view, which one of these women is dressed most appropriately for public places? Just point to one picture. D-10. What is the highest level (grade) of school you have completed, not including schooling in Islamic madrasa? (Calculate the highest level into years.) WOMEN IN SOCIETY 143
154 As in previous years, preference for the more conservative style (image 1) decreases with rising education levels: 34.2% of unschooled respondents prefer image 1, compared to 21.7% of those with some university education. Level of education is less strongly associated with image 2: similar proportions of respondents with differing levels of education choose this style of dress as appropriate for women in public (figure 8.4). APPROPRIATE DRESS FOR WOMEN IN PUBLIC, BY ETHNICITY 60% 50% 50 40% 30% 20% 10% 0% IMAGE 1 IMAGE 2 IMAGE 3 IMAGE 4 IMAGE 5 IMAGE 6 PASHTUN TAJIK UZBEK HAZARA 0 FIG. 8.5: Q-76. In your view, which one of these women is dressed most appropriately for public places? Just point to one picture. (Percent who choose each image.) As in previous Surveys, attitudes towards dress, a reflection of ethnic traditions and values, vary according to ethnicity (figure 8.5). Of Afghanistan s predominant ethnic groups, a majority of Pashtun and Uzbek respondents prefer the ultraconservative burqa depicted in image 1 (50.2% and 35.9%, respectively). Tajiks most often prefer the niqab in image 2 (32.6%), and Hazaras prefer the hijab in image 4 (34.8%). IDEAL AGE FOR A WOMAN TO MARRY Pursuant to the Afghan Civil Code (1977), the legal age for marriage in Afghanistan is 16 years for females and 18 years for males. Girls can also be married at age 15 with the permission of their guardian or the courts. 22 Recently there has been a push to end child marriage, with the United Nations Sustainable Development Goals calling for an end to the practice globally by Yet, a third of Afghan girls still marry before they are 18 years of age. 23 Since 2014, the Survey has asked respondents what is the best age for a woman to get married, and what is the best age for a man to get married. As in previous years, respondents believe the ideal age for a woman to marry is younger than the ideal age for a man (figure 8.6). 144 AFGHANISTAN IN 2017
155 Overall, almost a third of respondents (32.2%) report that the best age for a woman to marry is 18 years, and just over a quarter (25.1%) say the best age is 20. Reflecting social tolerance for very young brides, slightly more respondents say 16 is the best age for a woman to marry (8.6%) than say 19 (7.9%). Furthermore, 3.8% of respondents say the best age for women to get married is below the age of 16, even though this is prohibited by Afghan law. The view that women are best married young is more prevalent in rural than urban areas (4.4% vs. 2.0%). Both men and women say 18 and 20 are ideal ages for women to marry, but 18 is suggested by more males than females (35.3% vs. 29.1%), while 20 is suggested by more females than males (28.0% vs. 22.2%). The ideal age for marriage is considered to be somewhat higher for men. Twenty years old is the choice of 21.8% of respondents, and 25 years old is the choice of 20.6%, as the best age for men to marry. Urban respondents are less likely to pick 20 than 25 as the best age for a man to marry (19.1% vs. 27.8%), while rural respondents are more likely to pick 20 than 25 (22.7% vs. 18.2%). 35% 30% 25% 20% 15% 10% 5% IDEAL AGE FOR MARRIAGE 0% IDEAL AGE FOR A WOMAN IDEAL AGE FOR A MAN FIG. 8.6: Q-80. What do you think is the best age for a woman to get married? Q-81. What do you think is the best age for a man to get married? (Percent who cite each age.) WOMEN IN SOCIETY 145
156 35% IDEAL AGE FOR A WOMAN TO MARRY 30% 25% 20% 15% 10% 5% 0% FIG. 8.7: Q-80. What do you think is the best age for a woman to get married? Since 2014, the percentage of respondents who say 16 is the best age for a woman to get married has increased at the same time that support for marriage at age 20 has decreased (figure 8.7). When asked to identify the biggest problems facing women in Afghanistan, 36.4% of respondents in this year s Survey cite education/illiteracy. There are strong links between education and child marriage, with some reports suggesting that girls with no education are three times more likely to marry by the time they are 18 than girls who have a secondary or higher education. 24 The practice of women marrying young affects their access to education, because they drop out of school to prepare for marriage or pregnancy. Education equips girls to recognize when they want to marry, and it develops skills for self-reliance POLITICAL PARTICIPATION KEY QUESTIONS Q-74. And thinking about women in leadership positions, please tell me, do you agree or disagree that it is acceptable for women to have access to these leadership roles? (a) Member of a community development council. (b) Governor of a province. (c) CEO of a large company. (d) Minister or cabinet member. (e) Running for president of Afghanistan. Q-75. Would you prefer to be represented by a man or a woman in the National Parliament? Q-77. Do you think that political leadership positions should be mostly for men or mostly for women, or do you think that both men and women should have equal representation in the political leadership? Q-78. Do you think women should be allowed to vote in the elections? Q-79. If women vote, do you think that women should decide who to vote for themselves, or should men decide for women who they should vote for? 146 AFGHANISTAN IN 2017
157 Article 22 of the Afghan constitution forbids discrimination between citizens and enshrines equal rights for men and women. 26 Since 2001, significant gains have been made with regard to the participation of Afghan women in public life; however, women still face a number of barriers in this respect. The Survey explores Afghan attitudes to the political participation of women by first asking respondents whether they agree or disagree that women should have access to certain leadership roles. Overall, Afghans express support for women s access to leadership positions, although there is some variation according to the particular role. There is a high level of agreement (69.7%) that women should be able to join a community development council, but there is less agreement regarding corporate or government roles. That said, more than half of respondents still say that a woman should be able to become a CEO of a private company (54.6%), a provincial governor (55.4%), and a cabinet member (56.0%). There is less support (48.2%) for a woman s candidacy for president (figure 8.8). STRONG OPINIONS ON WOMEN IN LEADERSHIP POSITIONS % 30% 25% 20% 15% 10% 5% 0% MEMBER OF A COMMUNITY DEVELOPMENT COUNCIL GOVERNOR OF A PROVINCE STRONGLY AGREE CEO OF A LARGE COMPANY STRONGLY DISAGREE MINISTER OR CABINET MEMBER CANDIDATE FOR PRESIDENT OF AFGHANISTAN FIG. 8.8: Q-74. Do you agree or disagree that it is acceptable for women to have access to these leadership roles? (a) Member of a community development council. (b) Governor of a province. (c) CEO of a large company. (d) Minister or cabinet member. (e) Running for president of Afghanistan. (Percent who strongly agree and disagree.) In all cases, support for women in leadership positions is significantly stronger in urban areas than rural areas, ranging from 12.6 to almost 16.9 percentage points difference, depending on the position in question. The most marked difference is in support for a female minister or cabinet member (urban support, 68.6%; rural support, 51.8%). Perhaps unsurprisingly, female respondents consistently support women in all leadership positions to a substantially greater degree than male respondents. Looking regionally, male and female respondents in the Central/Hazarajat region have the highest levels of agreement that women should have access to all the leadership positions mentioned. Perhaps reflecting more conservative values, men and women in the South West have the lowest levels of agreement. This pattern is consistent with findings in WOMEN IN SOCIETY 147
158 In 2015, the NUG appointed two women to the position of governor, in the provinces of Daikundi and Ghor. Consistent with regional findings, respondents in Daikundi report the second-highest level of strong agreement that a female governor is acceptable (51.6%, second only to the 65.3% of respondents in Bamyan). In Ghor, however, where the female governor was removed from her position after a number of death threats, 27 only 15.3% of respondents strongly agree that it is acceptable for a woman to hold such a position. Over time, support for women in all leadership positions has declined. For example, the level of agreement with a woman running for president has fallen slightly, from 52.4% in 2015 to 48.2% in When asked whether they would prefer to be represented by a man or a woman in the National Parliament, more than twice as many respondents say they would prefer to be represented by a man than by a woman (43.7% and 20.6%, respectively). Just over a third of respondents (34.1%) say it makes no difference. Both rural and urban respondents are more likely to prefer male than female representation in parliament (figure 8.9). A preference for female representation is slightly more common among rural than urban respondents (21.7% vs. 17.3%), but urban respondents are significantly more likely than rural to say gender makes no difference to this leadership position (44.6% vs. 30.7%). The relative lack of concern about gender and political leadership among urban Afghans may be attributable to the higher levels of education in urban areas. PREFERRED GENDER FOR MEMBER OF PARLIAMENT, RURAL VS. URBAN 50% 45% 40% 35% 30% 25% 20% 15% 10% 5% 0% MALE FEMALE NO DIFFERENCE RURAL URBAN FIG. 8.9: Q-75. Would you prefer to be represented by a man or a woman in the National Parliament? Men display a strong preference for male representation (63.5%) compared to female representation (5.4%). The opposite is true for female respondents; however, the difference is much less marked, with 35.7% of women preferring female representation and 24.0% preferring male representation. While a higher proportion of Pashtuns than other ethnic groups indicate a preference for male representation (53.8%), Hazaras are the most likely to report a preference for a female candidate (28.8%). 148 AFGHANISTAN IN 2017
159 Strong agreement that women should have access to leadership positions declined from 2015 to 2016, but there is a slight rebound this year in support for women in leadership positions, with the exception of the office of the president, which continues to decline, from 22.4% in 2016 to 20.7% in STRONG SUPPORT FOR WOMEN IN LEADERSHIP POSITIONS, BY YEAR 40% 35% 30% 25% 20% 15% 10% 5% 0% MEMBER OF A COMMUNITY DEVELOPMENT COUNCIL GOVERNOR OF A PROVINCE CEO OF A LARGE COMPANY MINISTER OR CABINET MEMBER CANDIDATE FOR PRESIDENT OF AFGHANISTN FIG. 8.10: Q-74. Do you agree or disagree that it is acceptable for women to have access to these leadership roles? (a) Member of a community development council. (b) Governor of a province. (c) CEO of a large company. (d) Minister or cabinet member. (e) Running for president of Afghanistan. (Percent who strongly agree.) As stated in the introduction of this chapter, since the ousting of the Taliban in 2001, and the adoption of the Afghan constitution in 2004, several gains have been made in public attitudes towards women s role in politics and leadership. More than 78,000 women have been appointed to government positions since 2001, and over 8,000 women currently hold government offices. There is criticism, however, that these gains are merely symbolic and have very little real impact. 28 Further, these gains have been accompanied by a number of setbacks, including some reports of hostility and violence towards female politicians. 29 Afghans continue to be divided in their attitudes towards women in political leadership positions. Respondents were asked whether they think political leadership positions should be mostly for men or mostly for women, or whether men and women should be equally represented. This year s Survey shows a slight decrease since 2016 in the view that political leadership positions should be mostly for men, from 44.5% to 43.8%. At the same time, there has been a slight increase in the proportion of respondents who think that political leadership should be equally for men and women, from 42.3% in 2016 to 43.4% this year. Despite these results, however, the overall trend since 2006 has been a rising preference for male leadership and a declining preference for leadership by men and women equally (figure 8.11). Almost twice as many male as female respondents believe leadership positions should be for men (59.0% vs. 28.6%). Conversely, more than twice as many female as male respondents believe that political positions should be mostly for females (16.8% women vs. 7.3% men). More females (53.7%) than males (33.1%) say they believe in equality for men and women in leadership positions. WOMEN IN SOCIETY 149
160 PERCEPTION OF POLITICAL LEADERSHIP POSITIONS 60% 50% % 30% % 10% 0% MOSTLY FOR MEN EQUALLY FOR MEN AND WOMEN FIG. 8.11: Q-77. Do you think that political leadership positions should be mostly for men or mostly for women, or do you think that both men and women should have equal representation in the political leadership? There are significant differences in the attitudes of urban and rural Afghans towards gender equality in political leadership. In urban areas, 55.2% of respondents say that men and women should have equal representation in political leadership, compared to 39.4% in rural areas. There is also a slightly narrowing urban/rural gap in the view that leadership should only be for men: 34.8% of urban and 47.7% of rural respondents held this view in 2016 a 12.9 percentage point gap compared to 34.9% and 46.8%, respectively, in 2017 an 11.9 percentage point gap. Afghans who report watching more television are more likely to report that men and women should have equal representation in political leadership. For example, 54.5% of Afghans who watch more than two hours of television daily say that political leadership should be equally available to both men and women, compared to 39.7% of Afghans who watch less than 30 minutes a day. In addition to assessing Afghans views of women in politics, the Survey asks Afghans whether women should be allowed to vote. The percentage of respondents who believe women should be allowed to vote has grown from 84.1% in 2008 to 89.0% in 2017 (figure 8.12). At the same time, the belief that women should vote independently of the influence of men has remained almost unchanged, from 57.6% in 2008 to 59.7% in Slightly more females (90.9%) than males (87.2%) support the proposition that women should be allowed to vote. 150 AFGHANISTAN IN 2017
161 SUPPORT FOR WOMEN VOTING 100% 90% 80% 70% % 50% 40% 30% FIG. 8.12: Q-78. Do you think women should be allowed to vote in the elections? (Percent who say yes.) There are significant regional differences in support for a woman s right to vote, from 95.4% in the North East to 66.9% in the South West. Nearly all respondents in Panjshir (99.4%), Baghlan (98.6%), Bamyan (98.4%), Jawzjan (97.7%), and Samangan (97.4%) support a woman s right to vote. The least support is found in Zabul (31.8%), Wardak (61.8%), and Kandahar (63.5%). The Survey also asks respondents whether women should decide who to vote for themselves, or whether men should make this decision for them. The number of respondents who think women should decide who to vote for themselves has increased from 56.8% in 2016 to 59.7% in This increase may be attributable to the social desirability bias, where respondents answer in a manner that will be viewed favorably by others. Among the remainder of respondents, 22.4% say men should be consulted, while 16.9% say that men should decide for women. There is a significant difference between urban and rural respondents, with a higher percentage of urban than rural Afghans saying that women should decide who to vote for by themselves (71.2% vs. 56.0%). Despite a slight rebound after 2015, the gap between male and female respondents has narrowed since 2008, with 62.6% of females saying a woman should decide for herself, compared to 56.9% of males. WOMEN IN SOCIETY 151
162 SUPPORT FOR WOMEN'S INDEPENDENCE IN VOTING, BY GENDER 70% 60% % 40% % 20% 10% 0% MALE FEMALE FIG. 8.13: Q-79. If women vote, do you think that women should decide who to vote for themselves, or should men decide for women who they should vote for? (Percent who say that women should decide for themselves.) Consistent with preferences for a male or female representative in the National Parliament, respondents in the Central/Hazarajat region are the most supportive of women voting independently of men (72.3%), followed by Central/Kabul (69.9%), and the North West (65.9%). This compares to 41.1% of respondents in the South West and 45.1% in the East. Tajiks, Hazaras, and Uzbeks (67.2%, 66.0%, and 64.1%, respectively) are significantly more likely to support women making voting decisions themselves than are Pashtuns (48.3%). 8.4 EDUCATION KEY QUESTIONS Q-69. Some people say that women should have the same opportunities as men in education. Do you agree or disagree with this opinion? Strongly or somewhat? Q-70. And for each of the following levels of education, do you agree or disagree with the opinion that men and women should have equal opportunities for education? Is that strongly or somewhat? (a) Islamic madrasa education. (b) Primary school. (c) High school. (d) University in your province. (e) Studying in another province. (f) Studying abroad on scholarship. Lack of educational opportunities remains a significant challenge for Afghan women. The Survey asks respondents whether they agree or disagree with the opinion that women should have the same opportunities as men in education. In 2006, a record 91.5% of respondents expressed agreement with this opinion. In 2017, that agreement has fallen to 82.3% (figure 8.14). Despite a renewed upward trend since 2015, there is some concern that the recent rise in conflict will negatively affect women s access to education. 30 Deteriorating security conditions bring fear for personal safety, fear of traveling, and increased restrictions on the movement of young women AFGHANISTAN IN 2017
163 SUPPORT FOR GENDER EQUALITY IN ACCESS TO EDUCATION 95% 90% 85% 80% 75% 70% % 60% 55% 50% FIG. 8.14: Q-69. Some people say that women should have the same opportunities as men in education. Do you agree or disagree with this opinion? (Percent who agree strongly or somewhat. ) A higher proportion of Afghans living in urban areas (56.6%) than rural areas (35.4%) strongly agree with equal access to education, perhaps because urban areas are, arguably, more secure. Women (47.8%) are more likely than men (33.6%) to strongly agree with equal access to education. Regionally, 60.1% of respondents in the Central/Hazarajat region and 56.9% of respondents in Central/Kabul region strongly agree with equal access to education for women. This compares to 21.2% of respondents in the South West. Looking across ethnic groups, 53.2% of Hazaras, 44.8% of Tajiks, 34.6% of Pashtuns, and 32.6% of Uzbeks strongly agree that women should have the same access to educational opportunities as men. In the provinces, respondents in Bamyan (72.9%) and Kabul (64.9%) have the highest rates of strong agreement with equal educational opportunities for men and women, whereas more than half of respondents in Zabul (52.8%) strongly disagree with women s equal access to education (figure 8.15). This strong opposition may be attributable to the increasing volatility and insecurity of the province. Although there have been some developments in education facilities, 162 of the province s 226 schools have been closed due to security threats and cultural barriers. 32 WOMEN IN SOCIETY 153
164 SUPPORT FOR GENDER EQUALITY IN ACCESS TO EDUCATION, BY PROVINCE Jawzjan Balkh Kunduz Takhar Badakhshan Herat Badghis Faryab Ghor Sar-e-Pul K Samangan Baghlan Panjshir Nuristan Parwan Kapisa Kunar Bamyan Laghman a b u l Wardak Nangarhar Logar Daikundi Ghazni Paktya Khost Farah Uruzgan Zabul Paktika Nimroz Helmand Kandahar >60% % % 0 2 0% FIG. 8.15: Q-69. Some people say that women should have the same opportunities as men in education. Do you agree or disagree with this opinion? (Percent who strongly agree.) The Survey asks respondents about their level of agreement with women s access to specific levels of education, including Islamic madrasa education, primary school, high school, studying at a university in one s province, studying in another province, and studying abroad on scholarship. Consistent with previous years, respondents are more likely to agree that women should have access to the earlier years of education, such as primary school and high school, than to higher educational opportunities, including studying abroad. Compared to 2016, support for women s access to education has increased, albeit very slightly, across all levels of education (figure 8.16). 154 AFGHANISTAN IN 2017
165 SUPPORT FOR GENDER EQUALITY IN ACCESS TO EDUCATION, OVER TIME 100% 90% 80% 70% 60% 50% 40% 30% 20% ISLAMIC MADRASA EDUCATION PRIMARY SCHOOL HIGH SCHOOL UNIVERSITY IN YOUR PROVINCE STUDY IN ANOTHER PROVINCE STUDY ABROAD ON SCHOLARSHIP FIG. 8.16: Q-70. And for each of the following levels of education, do you agree or disagree with the opinion that men and women should have equal opportunities for education? Is that strongly or somewhat? (a) Islamic madrasa education. (b) Primary school. (c) High school. (d) University in your province. (e) Studying in another province. (f) Studying abroad on scholarship. (Percent who agree strongly or somewhat. ) Support for women s equal access to Islamic madrasa education increased slightly this year, from 93.6% in 2016 to 94.3% who agree ( strongly or somewhat ) that women should have access to madrasa education. Significantly more urban than rural respondents (80.4% vs. 70.6%) and more females than males (74.6% vs. 71.5%) agree with this view. Looking at the responses of those who strongly agree that girls should have equal access to primary education, there are slight differences between males (62.2%) and females (64.1%). Significant gender differences begin to emerge with regard to high school education, with 61.5% of females and 54.7% of males strongly agreeing that women should have such access. The gap persists for university education in one s own province (49.3% female vs. 38.4% male), a university education in another province (24.2% female vs. 16.7% male), and studying abroad (21.3% female vs. 12.5% male). Regionally, the strongest support for women s equal access to a madrasa can be found among respondents in Central/Kabul (84.7%) and the North East (82.7%). Across all regions, there is significant support for women s equal access to educational opportunities at the madrasa level; however, this support gradually declines with each level of higher education (figure 8.17). WOMEN IN SOCIETY 155
166 90% 80% 70% 60% 50% 40% 30% 20% 10% 0% CENTRAL/ KABUL SUPPORT FOR GENDER EQUALITY IN ACCESS TO EDUCATION, BY REGION EAST SOUTH EAST SOUTH WEST WEST NORTH EAST CENTRAL/ HAZARAJAT NORTH WEST ISLAMIC MADRASA EDUCATION PRIMARY SCHOOL HIGH SCHOOL UNIVERSITY IN YOUR PROVINCE STUDY IN ANOTHER PROVINCE STUDY ABROAD ON SCHOLARSHIP FIG. 8.17: Q-70. And for each of the following levels of education, do you agree or disagree with the opinion that men and women should have equal opportunities for education? (a) Islamic madrasa education. (b) Primary school. (c) High school. (d) University in your province. (e) Studying in another province. (f) Studying abroad on scholarship. (Percent who strongly agree.) Urban educated Afghans express higher levels of agreement than rural educated Afghans that women should have access to education at all levels. For example, 65.1% of rural respondents with a high school diploma support women s equal opportunity for education, compared to 76.5% of urban respondents with the same level of education. 8.5 ECONOMIC OPPORTUNITIES KEY QUESTIONS Q-71. Some people say that women should be allowed to work outside the home, while others say that women should not be allowed to work outside of the home. What is your opinion on this? Q-72. (If Q-71 answer is women should not be allowed to work outside the home ) Why do you say that women should not be allowed to work outside the home? Q-73. For each of these places, do you agree or disagree that it is acceptable for women to work in this place? (a) Government office. (b) Nongovernmental organization. (c) Hospital or clinic. (d) Female-only school. (e) Coed school. (f) Army/police. (g) A private company outside the home (factory, shop, business) with female employees only. (h) A private company outside the home (factory, shop, business) where male and female employees work in the same room. D-8. Do female members of the family contribute to this household s income, or not? While one of the key issues supported by the NUG is women s economic empowerment and advancement, the workplace can be a place where Afghan women experience resistance to their presence and, at times, harassment and violence AFGHANISTAN IN 2017
167 Since 2006, the Survey has asked Afghans whether women should be allowed to work outside the home. In 2006, 70.9% of respondents agreed that women should be allowed to work outside the home. This percentage dropped to a record low of 62.5% in 2011, then gradually rose again to 74.0% in This year, the figure declined marginally to 72.4% of Afghans who agree women should be allowed to work outside the home (figure 8.18). Interestingly, the growing acceptance of women working corresponds with a declining economy since 2012, rising poverty, and growing unemployment. 80% SUPPORT FOR WOMEN WORKING OUTSIDE THE HOME 75% 70% 65% 60% % 50% FIG. 8.18: Q-71. Some people say that women should be allowed to work outside the home, while others say that women should not be allowed to work outside of the home. What is your opinion on this? (Percent who agree that women should be allowed to work. ) Significantly higher proportions of urban than rural Afghans report that women should be allowed to work outside the home (82.1% and 69.2%, respectively). Similarly, a substantially higher percentage of women than men agree with this view (80.9% and 63.9%, respectively). The highest level of support for women working outside the home is found in the Central/Hazarajat region, where 90.7% of respondents say women should be allowed to work outside the home. This compares to just over half of respondents who live in the South West region (52.8%), the lowest level of agreement with this view regionally. Among the largest ethnic groups, 82.5% of Hazara respondents support women s right to work outside the home, compared to 77.2% of Uzbek respondents, 75.5% of Tajiks, and 63.4% of Pashtuns. Provincially, the highest level of agreement with the idea that women should be allowed to work outside the home is found in Bamyan (92.8%), Jawzjan (89.6%), Daikundi (88.9%), Balkh (87.7%), and Kabul (85.1%). The strongest disagreement with the view that women should be allowed to work outside the home is found among respondents who live in Zabul (73.5%) and Wardak (60.3%). Lack of support for women working outside the home may be attributable to insecurity. The province of Zabul, for example, is regarded as one of the most volatile and insecure provinces in Afghanistan, 34 and there has been an increase in reports of violence against women in the province. 35 A poor economy and a lack of employment opportunities may increase support for women working outside the home. For example, in Wardak, where disapproval of women working outside the home is high, 35.6% of WOMEN IN SOCIETY 157
168 respondents say household employment opportunities have gotten worse since last year, compared to 64.7% in Bamyan, which may explain why residents in this province are more supportive of women s employment. Further efforts by communities to challenge dominant attitudes and encourage women s empowerment in areas such as Daikundi also contribute to women working outside the home. 36 The Survey asks respondents who say women should not be allowed to work outside the home (25.7% of all respondents) to give their reasons for that view (figure 8.19). As in previous years, the two most frequently cited reasons are uncertain conditions (24.1%) and that it is against Islamic law (19.3%). These two reasons were also the most frequently cited in 2016, although in the opposite order, 24.1% of respondents citing Islamic law and 16.7% mentioning uncertain conditions. There are no noteworthy differences between the reasons provided by urban and rural respondents, but nearly twice as many men as women (23.1% vs. 11.5%) believe women working outside the home is against Islamic law. Perhaps unexpectedly, 8.7% of female respondents suggest that women should not work alongside men, compared to 1.2% of male respondents. It is unclear whether this reflects a moral view or a more practical concern with discrimination, workplace resistance, or some fear of violence should women work outside the home. REASONS WOMEN SHOULD NOT BE ALLOWED TO WORK OUTSIDE THE HOME % UNCERTAIN CONDITIONS 24 IT S AGAINST ISLAMIC LAW 19 THEY ARE NOT NEEDED OUTSIDE THE HOME 12 BAD SECURITY 12 THE FAMILY DOESN'T ALLOW IT 9 DON'T KNOW 6 IT PREVENTS MORAL CORRUPTION 4 WOMEN SHOULD NOT WORK ALONGSIDE MEN 4 IT S CONSIDERED A SHAME 2 THEY DON'T RESPECT THE HIJAB 2 THEY NEED TO HELP WITH KIDS 2 THEY DON'T HAVE THE RIGHT 1 THE GOVERNMENT NEVER SUPPORTS THEM 1 LACK OF EXPERIENCE 1 CRIMINALS WILL CREATE PROBLEMS FOR THEM 1 FIG. 8.19: Q-72. (If Q-71 answer is women should not be allowed to work outside the home ) Why do you say that women should not be allowed to work outside the home? Respondents were also asked whether they think it is acceptable for women to work in certain types of employment positions (figure 8.20). Support for women working in a female-only school (85.8%) and in hospitals or clinics (84.4%) remains unchanged since 2016 (85.9% and 84.4%, respectively). Women s presence in these roles is confirmed by data from the Ministry of Foreign Affairs showing that, in 2017, women comprise 20.6% of all health-sector employees and 33% of teachers in Afghanistan. 37 There is significantly less support for women working in the security field, with 36.0% of respondents supporting women s presence in 158 AFGHANISTAN IN 2017
169 the army/police force. There is even less support for women working in a private company that employs both men and women (35.9%). ACCEPTABLE PLACES OF EMPLOYMENT FOR WOMEN 10 0% 90% 80% 70% 60% 50% 40% 30% 20% 10% 0% FEMALE-ONLY SCHOOL HOSPITAL OR CLINIC GOVERNMENT OFFICE COED SCHOOL PRIVATE COMPANY (FEMALE ONLY) NGO ARMY/ POLICE PRIVATE COMPANY (COED) AGREE DISAGREE FIG. 8.20: Q-73. For each of these places, do you agree or disagree that it is acceptable for women to work in this place? (a) Government office. (b) Nongovernmental organization. (c) Hospital or clinic. (d) Female-only school. (e) Coed school. (f) Army/police. (g) A private company outside the home (factory, shop, business) with female employees only. (h) A private company outside the home (factory, shop, business) where male and female employees work in the same room. (Percent who agree strongly or somewhat, or disagree strongly or somewhat. ) Women and urban respondents are much more likely than men and rural respondents to say women should be allowed to work in any occupation. For example, a substantial 91.4% of urban respondents support women working in a hospital or clinic, compared to 82.1% of rural Afghans. The most prominent gender difference relates to the acceptability of employment with a nongovernmental organization (NGO). Here, 54.3% of women believe this is an acceptable occupation for women, compared to 39.0% of men. Similarly, 75.9% of female respondents express the view that working in a government office is acceptable for women, compared to 61.0% of male respondents. Regionally, respondents in Central/Hazarajat showed the highest levels of agreement with women working across all occupations except hospitals/clinics and female-only schools, which respondents in the North East region found slightly more acceptable (91.8% and 93.0% respectively). The Survey asks respondents if female members of the family contribute to the household income. Although there has been a slight decrease in support for women s work outside the home, from 74.0% in 2016 to 72.4% in 2017, women s contribution to household income has increased slightly, from 19.1% to 20.1%, over the same period (figure 8.21). Women s contribution to income has decreased in rural areas, from 24.7% in 2014 to 20.8% in 2017, and increased in urban areas, from 14.9% in 2014 to 17.9% in Regionally, 52.6% of respondents in Central/Hazarajat report that women contribute to the household income. This compares to only 12.0% of respondents in the South West. The proportion of households where women contribute to the family income varies by province, from 58.5% in Nuristan, to 55.4% in Daikundi, 49.6% in Bamyan, 3.5% in Wardak, and 2.6% in Helmand. WOMEN IN SOCIETY 159
170 WOMEN S CONTRIBUTION TO HOUSEHOLD INCOME 25% % 15% % 5% 0% FIG. 8.21: D-8. Do female members of the family contribute to this household s income, or not? (Percent who say yes.) 8.6 GENERAL FACTORS ASSOCIATED WITH SUPPORT FOR WOMEN S RIGHTS This chapter highlights several important factors that indicate support among Afghans for the rights of girls and women. Not surprisingly, women report higher levels of support for women s rights than men, and there is a positive correlation between levels of education and a propensity to support women s rights. There is also an association between Afghans in urban areas, who also tend to be more educated, and have higher levels of support for women s rights. Figure 8.22 highlights robust associations with other factors. There is no claim, however, that these associations are causal and can therefore, in and of themselves, explain attitudes towards women s rights in Afghanistan. FACTORS ASSOCIATED WITH SUPPORT FOR WOMEN S RIGHTS AFGHANS WHO SUPPORT WOMEN S RIGHTS, ON AVERAGE, ARE: MORE LIKELY TO BE WOMEN. MORE LIKELY TO BE EDUCATED. MORE LIKELY TO LIVE IN URBAN AREAS. MORE LIKELY TO FEEL SAFE PARTICIPATING IN SOCIOPOLITICAL ACTIVITIES. MORE LIKELY TO USE RADIO, TV, PHONE, OR THE INTERNET AS A SOURCE OF INFORMATION. MORE LIKELY TO DESIRE LEAVING AFGHANISTAN. MORE LIKELY TO REPORT THAT POLITICS AND RELIGION SHOULD NOT BE MIXED. LESS SYMPATHETIC TO THE TALIBAN. AFGHANS WHO DO NOT SUPPORT WOMEN S RIGHTS, ON AVERAGE, ARE: MORE LIKELY TO BE MEN. LESS LIKELY TO BE EDUCATED. MORE LIKELY TO LIVE IN RURAL AREAS. LESS LIKELY TO FEEL SAFE PARTICIPATING IN SOCIOPOLITICAL ACTIVITIES. LESS LIKELY TO USE RADIO, TV, PHONE, OR THE INTERNET AS A SOURCE OF INFORMATION. LESS LIKELY TO DESIRE LEAVING AFGHANISTAN. MORE LIKELY TO REPORT THAT POLITICS AND RELIGION SHOULD BE MIXED. MORE SYMPATHETIC TO THE TALIBAN. FIG. 8.22: Factors associated with support for women s rights, using OLS regression analysis on an 11-item scale for women s rights AFGHANISTAN IN 2017
171 Significantly more women (17.1%) than men (9.8%) always experience fear for their personal safety, and more women report that they or a family member have experienced violence or crime in the past year (19.4% of women, compared to 17.7% of men). Women are less likely than men, however, to report crimes or violence outside of their family (59.6% of women, compared to 65.6% of men). The most common types of incidents reported include physical attacks or beatings (women, 31.2%; men, 38.9%), stolen livestock (women, 23.8%; men, 22.0%), and suicide attacks (women, 19.7%; men, 10.6%). Interestingly, 27.3% of women say they or a family member have experienced violence or a criminal act, but they don t know exactly what type of act it was (figure 8.23) (see National Mood and Security chapters for more information). EXPERIENCES OF VIOLENCE AND/OR CRIME, BY GENDER MALE FEMALE TOTAL % % % PHYSICAL ATTACK OR BEATING DON'T KNOW LIVESTOCK STOLEN RACKETEERING/EXTORTION PICK-POCKETING SUICIDE ATTACKS BURGLARY/LOOTING MURDER KIDNAPPING MOTOR VEHICLE THEFT/PROPERTY TAKEN FROM VEHICLE OR PARTS OF VEHICLE MILITANTS/INSURGENT ACTIONS SMUGGLING POLICE ACTIONS ACTIONS BY FOREIGN FORCES (NIGHT RAIDS, DRONE ATTACKS, ETC.) SEXUAL VIOLENCE ARMY ACTIONS REFUSED <0.5 <0.5 <0.5 FIGHTING BETWEEN TALIBAN AND GOVERNMENT FORCES <0.5 <0.5 <0.5 ETHNIC CONFLICT <0.5 <0.5 <0.5 FIG. 8.23: Q-20. Have you or has anyone in your family suffered from violence or some criminal act in the past year? Q-21. (If Q-20 answer is yes ) If it is okay to ask, what kinds of violence or crimes did you or someone in your family experience in the past year? The Survey also asks Afghans to identify the two biggest problems facing women in their area (figure 8.24). According to women, their most significant challenges, in ranked order, are education (38.0%), domestic violence (22.4%), unemployment (22.2%), lack of rights (20.8%), and forced marriage (14.5%). Perhaps due to social desirability bias, one in four female respondents (20.3%) could not articulate their most significant problem. WOMEN IN SOCIETY 161
172 BIGGEST PROBLEMS FACING WOMEN, BY GENDER 40% 35% % 25% 20% 15% 10% % 0% EDUCATION UNEMPLOYMENT DON'T KNOW LACK OF RIGHTS DOMESTIC VIOLENCE FORCED MARRIAGE/ DOWRY POVERTY HEALTH CARE MALE FEMALE FIG. 8.24: Q-7. What, if anything, is the biggest problem facing women in this area today? What is the next-biggest problem? 162 AFGHANISTAN IN 2017
173 End Notes 1 Ted Piccone, Democracy, gender equality, and security (Washington, DC: Brookings Institution, 2017), edu/wp-content/uploads/2017/08/fp_ _democracy_gender_security.pdf. 2 Ministry of Foreign Affairs (MOFA), Directorate of Human Rights and International Women s Affairs, Afghanistan s National Action Plan on UNSCR 1325 Women, Peace, and Security (MoF, July 2015), 3 Hundreds of Women Gather for Peace Conference in Eastern Afghanistan, United Nations Assistance Mission to Afghanistan (UNAMA), August 21, 2017, 4 UN Supports Women s Empowerment Initiative in Afghanistan s North, United Nations Assistance Mission to Afghanistan (UNAMA), August 21, 2017, 5 Khan Wali Salarzai, Elderly Kunar women to beseech Taliban to reconcile, Pajhwok Afghan News, August 8, 2017, Promote: Women in the Economy, USAID, October 2016, Women%20in%20the%20Economy%20%28WIE%29.pdf. 7 Helping Afghan Women Improve their Economic Status, World Bank, October 3, 2017, news/feature/2017/10/03/village-women-benefit-from-programs-to-improve-their-economic-and-social-status. 8 Grace Banks, Inside Zan TV: Afghanistan s first all-female station, Guardian, August 7, 2017, com/lifeandstyle/2017/aug/07/inside-zan-tv-afghanistans-first-all-female-station. 9 Baber Khan Sahel, Afghanistan s first women s magazine talks about taboo topics, EFE-EPA, May 25, 2017, efe.com/efe/english/life/afghanistan-s-first-women-magazine-talks-about-taboo-topics/ Mujib Mashal, Afghan Magazine, a Sisterhood of Ideas, Hopes to Counter Men s Sway, New York Times, May 21, 2017, html. 11 Where is my name? : Afghan women want husbands to call them by their own names in public, Journal.ie, Aug. 26, 2017, 12 Heather Barr, Women Excluded Again from Afghanistan s Peace Talks, Human Rights Watch, June 6, 2017, hrw.org/news/2017/06/06/women-excluded-again-afghanistans-peace-talks. 13 Women s Day 2017: Women in the Changing World of Work: Planet by 2030, United Nations Assistance Mission to Afghanistan (UNAMA), March 8, 2017, 14 Sayed Masood Sadat, What Factors Drive Child Marriage in Afghanistan? In Asia blog, March 22, 2017, asiafoundation.org/2017/03/22/factors-drive-child-marriage-afghanistan/. 15 Barr, Women Excluded Again. 16 Heather Barr, Will Afghanistan Follow Through on Promise to End Child Marriage? Human Rights Watch, April 20, Matt Waldman, Community Peacebuilding in Afghanistan: The Case for a National Strategy (Oxford: Oxfam International, 2008), 18, 18 For instance, 61.6% of respondents in Bamyan report having no formal education, compared to just 39.1% of respondents in Panjshir. 19 The Asia Foundation, Afghanistan in 2016: A Survey of the Afghan People (San Francisco: The Asia Foundation, 2016), asiafoundation.org/where-we-work/afghanistan/survey/. 20 For more information on baddal, please refer to United Nations Assistance Mission in Afghanistan (UNAMA), Harmful Traditional Practices and Implementation of the Law on Elimination of Violence Against Women in Afghanistan (Kabul: UNAMA, 2010), With the exception of a slight drop from respondents with no formal schooling (66.9%) to those with one to four years of formal schooling (between 60.6% and 66.1%), strong disagreement increases with higher levels of education. WOMEN IN SOCIETY 163
174 22 The draft Family Law that is currently under consideration in the National Assembly proposes to change the legal age of marriage for both males and females to 18 years of age. 23 Barr, Will Afghanistan Follow Through? 24 Malika Khanna, Child Marriage in Afghanistan, The Blog, The Borgen Project, November 2, 2016: org/child-marriage-in-afghanistan/. 25 Ibid. 26 Islamic Republic of Afghanistan, Progress Report on Women s Status and Empowerment and National Action Plan (NAP 1325) (Kabul: Islamic Republic of Afghanistan, 2016), Women_Rights pdf. 27 Human Rights Watch (HRW), Afghanistan: Events of 2016, in World Report 2017: Events of 2016 (HRW, 2017), 65 71, 28 Mina Habib, Afghan Women Complain Over Symbolic Roles, Global Voices, June 8, 2017, afghan-women-complain-over-symbolic-roles. 29 Salima Ahmadi, Reality Check: No justice for women in Ghor province (Afghanistan Analysts Network, December 4, 2016), 30 AAN Team, What to Watch? Key issues to follow in Afghanistan in 2017 (Afghanistan Analysts Network, January 27, 2017), 31 See, for example, HRW, Afghanistan: Events of Zabul, Islamic Republic of Afghanistan, Ministry of Education (MoE), afghanistan/zabul. 33 Gunmen kill five female airport workers in Afghanistan, Al Jazeera, December 17, 2016, news/2016/12/gunmen-kill-female-airport-workers-afghanistan html. 34 Zabul, MoE. 35 Ahmadi, Reality Check. 36 The motivation for more women in journalism, Pajhwok Afghan News, September 11, 2017, en/2017/09/11/motivation-more-women-journalism. 37 Islamic Republic of Afghanistan, Progress Report on Women s Status. 38 Using OLS regression, the level of support for women s rights (scale) was regressed on a variety of demographic and attitudinal measures, including gender (d1), education (d10), income (d6 & d7), geographic location (m6b), fear while participating in political activities (scale), access to information (scale), perceptions of religious leaders and politics (q43), confidence in the ANA (scale), sympathy for the Taliban (q55a), and desire to migrate (q82a). The full model explains 21.5% of the variance in perception of whether an Afghan supports women s rights or not (n=7,825, R2=0.215, F(11,7813)=194.51, p<0.0000). 164 AFGHANISTAN IN 2017
175
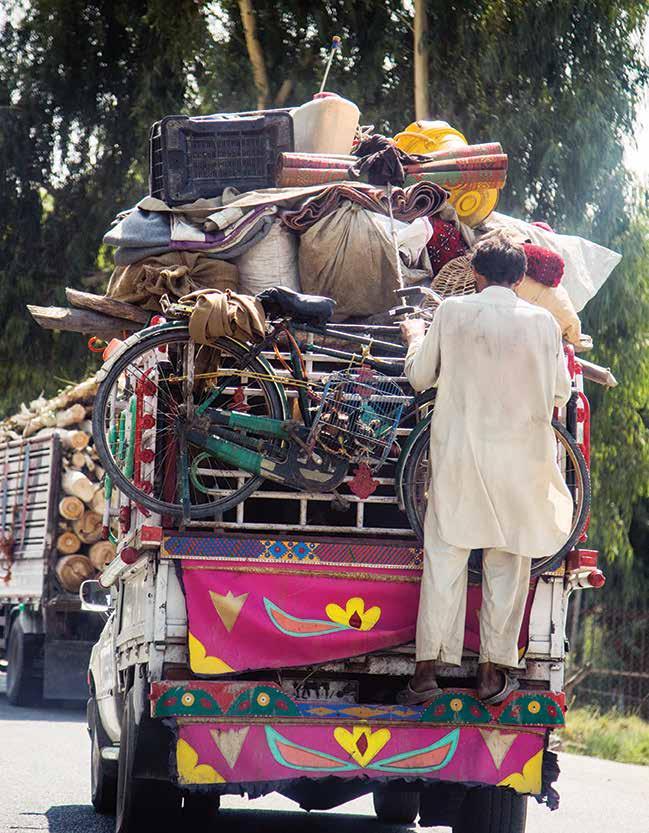
176
177 9 MIGRATION Last year, the Survey reported a significant decrease in Afghans willingness to leave their country from 39.9% of respondents in 2015 to 29.6% in This trend reversal was attributed to a change in the nature of pull factors, principally Afghan sensitivity to more restrictive reception policies in destination countries. From late 2015 to early 2016, significant numbers of Afghans left their country to travel to Europe in the hope of seeking a resettlement outcome, enabled by the opening of travel routes to the European Union border (i.e., the Balkan corridor). 1 This influx was eventually met with a tightening of borders and campaigns designed to deter Afghans from leaving home. 2 Much has happened since the last Survey. Escalating ethnic and religious tensions, increasing concern over power-sharing arrangements, and the distraction of the next presidential election have generated what is considered to be a stable crisis 3 in the Afghan government. The security situation over the past year has also deteriorated the Taliban, ISIS/Daesh, and its Afghan-Pakistani Daesh affiliate, the Islamic State Khorasan Province (ISKP), have intensified their attacks and expanded their reach. 4 This has resulted in mounting civilian casualties 5 and heightened perceptions of risk within communities. 6 With regard to migration, the International Organization for Migration (IOM) reports that the number of Afghans traveling to Europe has returned to pre-2015 numbers. 7 At the same time, the number of Afghans on the move within Afghanistan has also increased. According to the United Nations Office for the Coordination of Humanitarian Affairs (UNOCHA), the rise in internal conflict in Afghanistan throughout 2017 has resulted in unprecedented levels of internal population displacement. 8,9 Additionally, according to Human Rights Watch (HRW), since last year, hundreds of thousands of Afghans have reportedly returned to Afghanistan either voluntarily or under threat of force from Iran and Pakistan, exacerbating the effects of this displacement. 10 Afghanistan reportedly lacks the infrastructure, security, and employment opportunities to support these additional repatriated citizens. 11 Against that backdrop, this year s Survey reports a return to earlier trends in the migration intentions of Afghans. In 2017, the overall proportion of Afghans indicating a willingness to leave Afghanistan if they have the opportunity has risen to 38.8% the second-highest level recorded in Survey history. To understand the factors driving this significant turnaround, the Survey reports again on the demographic and geographic variations in Afghans willingness to leave their country, and the reasons for this willingness. For the first time, it also explores why Afghans choose to stay in their country. The findings underscore an important point there is no single reason for Afghan migration. Such decisions are made in a complex context of socioeconomic, political, and personal factors WILLINGNESS TO MIGRATE KEY QUESTION Q-82a. Tell me, if given opportunity, would you leave Afghanistan and live somewhere else, or not? The Survey first asked Afghans in 2011 whether, if given the opportunity, they would be willing to leave Afghanistan and live somewhere else. At that time, 33.8% indicated they would do so. This proportion rose to MIGRATION 167
178 38.4% in 2012, and 39.9% in In 2016, the Survey recorded a dramatic fall in Afghans desire to migrate, to 29.6%. That trend reversal, however, has been short-lived. This year, the overall proportion of Afghans who indicate they would be willing to leave if afforded the opportunity has risen to 38.8% the second-highest level recorded to date. GEOGRAPHY AND ETHNICITY Last year, Afghans living in the North East region were the most willing to leave Afghanistan 37.1% of respondents from this region were so inclined. This year, Afghans in the Central/Hazarajat region are the most willing to leave if afforded the opportunity (45.4% of these respondents), with similar proportions in the East (44.2%), the North East (43.8%), and the South East (42.3%). Afghans living in the South West are again the least willing to leave Afghanistan (28.2% of these respondents). The pattern of year-over-year change is consistent across all regions. Notably, the proportion of respondents willing to leave Afghanistan in the East, South East, South West, North East, and Central/Hazarajat regions has surpassed the record levels observed in 2015 (figure 9.1). DESIRE TO LEAVE AFGHANISTAN, BY REGION 50% 40% % 20% % 0% CENTRAL/ KABUL EAST SOUTH EAST SOUTH WEST WEST NORTH EAST CENTRAL/ NORTH WEST HAZARAJAT FIG. 9.1: Q-82a. Tell me, if given the opportunity, would you leave Afghanistan and live somewhere else, or not? (Percent who say yes.) This year s Survey indicates that migration intentions vary widely across provinces. Last year, Baghlan, in the North East, was the only province where over half of respondents (58.6%) said they would leave if they had the opportunity. This year, in addition to Baghlan where the proportion reached 56.1% similar proportions were also observed in Ghazni and Laghman. In Ghazni, 58.8% of respondents say they would leave, compared to 37.5% in In Laghman, 58.1% of respondents say they would leave, compared to 31.4% in Last year, respondents in Nuristan, Helmand, and Zabul were the least likely to say they would leave (11.7%, 12%, and 14.9%, respectively). This year, those proportions rose to 35.6%, 27.0%, and 20.8%, respectively. Reflecting the broad, upward trend in migration intentions, this year there is no province where fewer than 20% of respondents say they would be willing to leave. This compares to last year, when there were four provinces where fewer than 20% of respondents said they would leave. 168 AFGHANISTAN IN 2017
179 In previous years, urban respondents were more willing than rural respondents to say they would leave the country if given the opportunity. This year, that pattern is still present, but it is considerably less pronounced 41.3% of Afghans in urban areas say they would leave, compared to 37.9% in rural areas. This change primarily reflects an increase in rural respondents indicating a desire to leave, from 27.8% last year to 37.9% this year (figure 9.2). DESIRE TO LEAVE AFGHANISTAN, RURAL VS. URBAN 50% 40% % 28 20% 10% 0% RURAL URBAN FIG. 9.2: Q-82a. Tell me, if given the opportunity, would you leave Afghanistan and live somewhere else, or not? (Percent who say yes.) Hazaras are again the most likely to indicate a willingness to migrate (46.7%), reflecting the long-standing antagonism toward this ethnic group in Afghanistan. The latter part of 2016 also saw a number of significant attacks on Hazara targets. 13 Tajiks and Uzbeks are the next-most willing to leave, followed by Pashtuns (39.5%, 38.1%, and 35.9% of these groups, respectively). This pattern is consistent with findings since 2015 (figure 9.3). MIGRATION 169
180 DESIRE TO LEAVE AFGHANISTAN, BY ETHNICITY 60% 50% 40% 30% % 10% 0% PASHTUN TAJIK UZBEK HAZARA FIG. 9.3: Q-82a. Tell me, if given the opportunity, would you leave Afghanistan and live somewhere else, or not? (Percent who say yes.) DEMOGRAPHIC FACTORS ASSOCIATED WITH MIGRATION This year s findings are similar to last year s with regard to demographic factors and migration intentions. Men are somewhat more likely than women to say they would leave Afghanistan if they were afforded the opportunity (41.2% vs. 36.3%). Last year s pattern was similar, albeit with lower rates (32.6% and 26.7%). This year, younger people show a greater willingness to leave, with 40.9% of 18- to 30-year-olds and 39.9% of 31- to 45-year-olds saying they would leave if they had the opportunity. This figure falls to 32.3% for Afghans years old. Last year, 19.4% of Afghans over 60 years old said they would leave the country if they had a chance. Remarkably, this year saw an increase of almost 10 percentage points for this age group, with 29.2% of those over 60 years old indicating a willingness to leave. 170 AFGHANISTAN IN 2017
181 DESIRE TO LEAVE AFGHANISTAN, BY AGE 45% 40% 35% 30% 25% 20% 15% 10% 5% 0% YEAR OLDS YEAR OLDS YEAR OLDS >60 YEAR OLDS FIG. 9.4: Q-82a. Tell me, if given the opportunity, would you leave Afghanistan and live somewhere else, or not? (Percent who say yes.) D-2. How old are you? Single Afghans are more likely to say they would leave Afghanistan (44.6% of this group) than those who are married (37.8%). Having children makes little difference in willingness to migrate. Afghans with one or two children are only marginally more likely to say they would leave (39.1%) than those with no children (35.2%) and those with three or more children (37.0%). Willingness to leave Afghanistan is somewhat higher for those who can generate an income. Of this group, 41.3% express a desire to leave, compared to 36.7% of those who cannot generate an income. Consistent with last year s findings, Afghans in white-collar occupations, such as teachers and professionals, are more willing to leave Afghanistan (43.6%) than those engaged in semiskilled or unskilled work, such as laborers (40.7%). 14 Higher levels of education are again associated with a willingness to leave Afghanistan, suggesting that fears of a brain drain are not unfounded. 15 Differences by education level are not large, however. While 40.9% of Afghans with some tertiary education indicate a willingness to leave the country, slightly more than a third of Afghans with no formal schooling, 35.6%, are also willing to leave, a notable increase over last year s 24.7% of this group, suggesting that migration intentions are spreading beyond the well-educated. MIGRATION 171
182 9.2 REASONS FOR LEAVING KEY QUESTIONS Q-83. (Ask if answered yes to Q-82a) What, if anything, could the government do to make you want to stay in Afghanistan? Q-89. Do you have a family member or close relative that lives abroad? Q-91b. (Ask if answered yes to Q-89) Have these relatives helped you financially, such as sending money? Q-92. For people living in your area, compared to last year, do you think it has become easier or harder to leave Afghanistan? People s decisions to leave their country are often understood in terms of push and pull factors. 16 According to this framework, push factors are circumstances in the domestic economic, social, political, and security environment, such as a weak economy or fear for personal safety, that motivate people to migrate. Pull factors, on the other hand, are external circumstances, such as favorable reception policies and employment opportunities that attract people to a particular destination. 17 The reasons why Afghans migrate are a complex mix of push and pull factors that influence each individual differently. 18 Last year, the Survey reported a significant decrease from the year before in the proportion of Afghans willing to migrate. While push factors such as domestic insecurity, poor governance, and unemployment undoubtedly contributed to this result, the overall decrease was attributed to a range of significant developments in the global migration context, principally the declining attractiveness of reception and resettlement policies in destination countries. The closure of the Balkan corridor in March 2016 was followed by a widely publicized hardening of reception policies in a number of European destination countries, some forcible returns of Afghans, and the growing intensity of Afghan repatriation efforts in Iran and Pakistan. This year, the context has changed again, and so, too, has the relative importance of various push and pull factors affecting Afghan migration intentions. PUSH FACTORS DOMESTIC INSECURITY This year, domestic insecurity is a major factor affecting respondents willingness to leave Afghanistan. Just over three-quarters (76.3%) of respondents who say they are willing to leave Afghanistan if given the opportunity cite insecurity as one of two reasons. 19 This is similar to last year s proportion (73.6%). Greater willingness to migrate is also associated with fears for personal safety, the experience of personal violence, and knowledge of or perceived threats from ISIS/Daesh. 20 This year, 40.5% of those who are aware of ISIS/Daesh indicate a willingness to leave, compared to 32.7% of those who have not heard of this group. This is a notable increase over last year s figures (31.5% and 21.5%). Afghans who believe this group threatens their district are also somewhat more likely to say they will leave Afghanistan than those who perceive no such threat (42.9% vs. 38.5%). While this is a marginal difference, it should be noted that no such difference in these measures was observed last year (31.3% and 31.5%, respectively). Of Afghans who always fear for their own or their family s safety, 40.3% say they would leave Afghanistan if they were given the opportunity. This compares 172 AFGHANISTAN IN 2017
183 to 34.1% of Afghans who say they never feel such fears. A similar pattern, albeit with lower proportions, was observed last year (31.6% and 26.9%, respectively). Additionally, Afghans who have experienced violence over the past 12 months are more willing to leave the country than those who have not (43.5% and 37.8%, respectively). Again, this pattern is similar to last year s findings (36.3% and 28.1%, respectively). Believing in the possibility of reconciliation between the Afghan government and the Taliban is only marginally associated with migration intentions. Of those who believe reconciliation is impossible, 40.9% say they would leave Afghanistan if they had the opportunity, compared to 38.0% of those who believe reconciliation is possible. UNEMPLOYMENT Unemployment is a particularly important factor in Afghan migration decisions. This year, it is cited as a reason for wishing to leave by 54.5% of respondents. Consistent with this, Afghans who believe employment opportunities have grown worse are more likely to express a willingness to leave than those who believe employment opportunities have improved (40.4% vs. 34.2%). In comparison, just 8.7% of Afghans who say they would leave Afghanistan cite a lack of other opportunities (e.g., for education). 21 WEAK GOVERNMENT The ability of the Afghan government to inspire confidence remains low. A quarter of respondents who are willing to leave (25.6%) cite weak governance (e.g., corruption, injustice) as a reason for doing so. 22 This year, in general, the willingness to migrate is higher among respondents with no confidence in government, at many levels, than among those with a lot of confidence (figure 9.5). DESIRE TO LEAVE AFGHANISTAN, BY LEVEL OF CONFIDENCE IN GOVERNMENT INSTITUTIONS 42% 40% 38% 36% % 32% 30% INDEPENDENT ELECTION COMMISSION PARLIAMENT PROVINCIAL COUNCIL YOUR MEMBER OF PARLIAMENT GOVERNMENT MINISTRIES A LOT OF CONFIDENCE NO CONFIDENCE AT ALL FIG. 9.5: Q-82a. Tell me, if given the opportunity, would you leave Afghanistan and live somewhere else, or not? (Percent who say yes.) Q-51. I would like to ask you about some officials, institutions, and organizations. As I read out each, please tell me how much confidence you have in them to do their jobs. Do you have a lot, some, not much, or no confidence at all? If you don t know, it s okay, just say MIGRATION 173
184 you have no opinion. (c) Independent Election Commission; (j) Parliament as a whole; (k) Provincial council; (m) Your member of Parliament; (f) Government ministers. Once again, whether the National Unity Government (NUG) is seen as doing a very good or a very bad job is also associated with the willingness to leave. Respondents who think the NUG is doing a very bad job are somewhat more likely to express a willingness to migrate than those who think the NUG is doing a very good job (41.7% vs. 35.1%). As seen last year, corruption is only mentioned infrequently as a reason respondents say they would leave. Specifically, corruption comprises just 3.5% of the aggregated weak governance figure reported above. That said, the Survey reveals a positive relationship between exposure to corruption 23 and the desire to leave. This pattern emerges in both simple correlation 24 and in multivariate analysis. 25 Specifically, respondents who have had some experience of corruption are more likely to say they would leave the country if they had the opportunity than those who have not had this type of experience. The economic circumstances of Afghan households are also associated with a desire to migrate. Afghans who say their household financial situation has gotten worse over the last 12 months are somewhat more likely to say they would leave Afghanistan (40.5%) than those who say their household situation has gotten better (35.8%). Last year, there was little difference in the willingness to migrate between respondents who did or did not believe that religion and politics should be mixed (29.5% and 30.1%, respectively). This year, that gap has widened. Among Afghans who believe that religious leaders should not be involved in politics, 43.4% indicate a desire to leave Afghanistan, compared to 36.4% of those who do not hold this view. Afghans who believe they have no influence over local government decisions are also readier to migrate than those who believe they have a lot of influence (40.2% and 34.5%, respectively). Satisfaction with the way democracy works in Afghanistan continues to have little association with migration intentions. Of Afghans who are very satisfied with the way democracy works, 38.5% say they would be willing to leave if given the chance. Of those who are very dissatisfied in this regard, a similar percentage, 38.1%, say they would be willing to leave. Likewise, the proportion of Afghans who are willing to leave is almost the same among those who feel very safe to criticize the government publicly and those who feel very unsafe to do so (38.0% and 37.8%). INFRASTRUCTURE There is a common perception that foreign-supported development in Afghanistan reduces the need and the desire of Afghans to migrate, 26 and that improving infrastructure leads to a more stable Afghanistan. 27 Recent evidence, however, suggests that these links are not straightforward. 28 The Survey s findings this year reaffirm this complexity. On the one hand, lack of infrastructure does not appear to loom large in the minds of Afghans who indicate a readiness to migrate. Only 1.2% of respondents cite lack of infrastructure 29 as a reason for leaving. Similarly, when asked what the government could do to encourage Afghans to stay in the country, only 6.4% of those 174 AFGHANISTAN IN 2017
185 with a desire to leave cite remedies relating to improved infrastructure. 30 Last year s findings indicated that the desire to leave Afghanistan varied only slightly and in a counterintuitive direction according to whether respondents had been the beneficiaries of development projects or not. Of respondents who had benefited from more than six development projects, 29.7% indicated a desire to leave. Of those exposed to fewer than six projects, this rate was marginally lower, at 27.8%. As an interesting sequel in this year s Survey, Afghans who have been the beneficiaries of more than six development projects are now even more willing to leave than those who have experienced fewer than six projects (43.3% vs. 38.5%). This may be because infrastructure is more concentrated in urban areas, where the willingness to leave Afghanistan is already higher. It may also be because infrastructure is associated with increased access to information a known factor in migration intentions. 31 And it may be that foreign infrastructure development conveys a sense of global progress, and that when this becomes salient in a community, the desire to pursue opportunities abroad increases. On the other hand, some findings in this year s Survey suggest that increased infrastructure may be associated with less willingness to migrate. Respondents were reminded of the National Solidarity Program (NSP), which was designed to improve Afghans living conditions, 32 and then were asked to comment on how successful the government has been in improving the living conditions of Afghans. Some 41.6% of respondents who think the government has done nothing to improve living conditions expressed a desire to leave, compared to 38.3% of those who think the government has done a little, and 33.0% of those who think the government has done a lot. The variety of these findings shows that the relationship between development and migration is not necessarily linear and requires further research. NATIONAL MOOD Last year, there was a small difference in respondents willingness to migrate related to whether they thought the country was moving in the right direction (27.1%) or the wrong direction (31.1%). This year, this difference has grown. Of Afghans who believe the country is moving in the right direction, 35.0% say they would leave if given the opportunity, compared to 41.4% of those who believe the country is moving in the wrong direction. The extent to which Afghans feel happy appears to have little bearing on their willingness to leave. Similar proportions of those who feel generally happy and those who feel generally unhappy say they would leave the country if they had a chance (38.4% and 40.1%, respectively). While this pattern was the same last year, the proportion of respondents who expressed a willingness to leave was substantially lower in both groups in 2016 (27.8% and 27.9% respectively). EQUAL RIGHTS FOR WOMEN As in previous years, this year s Survey finds that Afghans who support women s rights are more likely to say they would leave the country if they could than those who do not. Respondents who strongly agree with equal educational opportunities for women are more likely to say they would leave Afghanistan than those who strongly disagree (41.4% vs. 32.5%). Those who believe that women should be allowed to vote also express more willingness to migrate than those who do not (39.6% vs. 32.3%). Higher proportions of Afghans who strongly disagree with the practices of baad and baddal 33 say they would leave Afghanistan if they had the MIGRATION 175
186 chance (38.8% and 39.4%, respectively) than of those who strongly agree with these practices (31.8% and 35.9%, respectively). DEMOGRAPHIC FACTORS IN REASONS FOR LEAVING This year s findings on the willingness to migrate reveal some noteworthy demographic differences in push factors. For instance, insecurity was cited by women more frequently than by men as a reason for leaving (81.0% vs. 72.4%). On the other hand, the prospect of unemployment was cited more frequently by men than by women (60.5% vs. 47.7%). Afghans who are married cite a lack of opportunities more often than those who are single (13.6% vs. 7.3%). PULL FACTORS RELATIVES ABROAD This year, a slightly higher proportion of respondents say they have a family member or close relative living abroad than in 2016 (41.2% vs. 38.5%). Of those with family members or close relatives abroad, about onethird (34.0%) receive financial assistance from those relatives. When asked to list up to two countries where these relatives live, 45.5% of respondents list European countries, % list Iran, 21.9% list Turkey, and 12.8% list Pakistan, along with a number of other countries. Last year, having a family member or close relative abroad had a strong association with a willingness to leave Afghanistan. Afghans with relatives abroad were more than twice as likely to indicate a willingness to leave (44.1%) as those without (20.5%). This year, the strength of that association has weakened somewhat, to 46.5% and 33.4%, respectively. Relatives abroad who provide financial assistance are also more strongly associated with a willingness to leave Afghanistan than relatives abroad who do not provide financial assistance (51.4% vs. 43.8%). This association is stronger than last year s results, which were 46.4% and 43.2%, respectively. ACCESS TO MEDIA Because it offers portrayals of living standards and opportunities, the media has considerable power to influence decisions to migrate and choices of destinations. This association was clearly borne out in last year s Survey. 35 This year, access to the media is again associated with a readiness to leave Afghanistan. Among Afghans with Internet access, 43.2% indicate a willingness to migrate, compared to 36.0% without such access. Of those who use the Internet for news and information, 42.9% are willing to migrate, compared to 38.3% of those who do not. Having personal access to the Internet, as opposed to access through a library, workplace, or café, appears less important: similar proportions of Afghans with and without personal access to the Internet say they would be willing to leave (42.7% and 43.5%, respectively). Television is also associated with a greater willingness to leave Afghanistan. Of respondents who watch TV, 41.9% say they would leave if they had the opportunity, compared to 32.6% of those who do not watch TV. Likewise, 42.1% of Afghans who get their news and information from TV say they would leave the country, compared to 32.6% of those who do not. This difference in willingness to migrate is also evident, though weaker, between those who use a mobile phone for news and information and those who do not (41.8% vs. 176 AFGHANISTAN IN 2017
187 36.4%), and those who use radio for news and information and those who do not (40.2% vs. 36.4%). Like last year, there are only marginal differences (less than 1 percentage point) in willingness to leave Afghanistan between those who do, and do not, turn to mosques, shuras, or family and friends for news and information. Last year s Survey found that, as confidence in the media rose, so did readiness to migrate. 36 This year s findings partially repeat this pattern (figure 9.6). Interestingly, the desire to leave Afghanistan was highest among respondents who expressed some confidence in the media (42.2%) rather than among those who had a lot of confidence in the media (36.8%). DESIRE TO LEAVE AFGHANISTAN, BY CONFIDENCE IN THE MEDIA 44% 42% 42 40% 38% % 35 34% 32% 30% A LOT OF CONFIDENCE SOME CONFIDENCE NOT MUCH CONFIDENCE NO CONFIDENCE AT ALL FIG. 9.6: Q-82a. Tell me, if given the opportunity, would you leave Afghanistan and live somewhere else, or not? (Percent who say yes.) Q-51. I would like to ask you about some officials, institutions, and organizations. As I read out each, please tell me how much confidence you have in them to do their jobs. Do you have a lot, some, not much, or no confidence at all? If you don t know, it s okay, just say you have no opinion. (h) Media such as newspapers, radio, TV. CHANGE IN THE DIFFICULTY OF LEAVING AFGHANISTAN This year, Afghans were asked whether they believe it has become easier or harder for people in their area to leave Afghanistan. Some 71.3% of respondents believe it has become harder to leave Afghanistan, compared to 9.5% who believe it has become easier and 16.6% who say there is no difference. Afghans living in urban areas are more likely to report that it has become harder to leave than those in rural areas (79.5% and 68.6%, respectively). Compared to other regions, those living in the Central/Kabul region are most likely to report that it has become harder to leave Afghanistan over the past year (79.5% of this group). Interestingly, Afghan s views of the difficulty of leaving Afghanistan are not associated with a personal desire to leave. Of those who say it is harder to leave Afghanistan this year than last, 39.3% express a desire to leave. This compares to 38.5% of those who say it is easier to leave this year than last, and 38.9% of those who say it is neither harder nor easier. MIGRATION 177
188 9.3 PROMOTING DECISIONS TO STAY KEY QUESTIONS Q-82b. (Ask if answered no in Q-82a) Why would you stay in Afghanistan? Q-83. (Ask if answered yes in Q-82a) What, if anything, could the government do to make you want to stay in Afghanistan? For the first time, this year s Survey looked at the factors that might encourage Afghans to remain at home. Specifically, it explored what the government could do to make those who want to leave, stay in Afghanistan. The results reaffirm that security is a critical factor. Three-quarters (75.3%) of those who say they are willing to leave cite security improvements, 37 such as maintaining security, eliminating the Taliban and ISIS/Daesh, and arresting criminals, as something the government could do to make them want to stay. This was particularly evident in Kunduz, Badghis, Farah, and Ghor, where almost all respondents who want to leave refer to this factor as a reason they would stay (90.8%, 94.8%, 90.9%, and 91.6%, respectively). Participation opportunities 38 principally employment are also cited by over half of respondents who want to leave Afghanistan (59.6%) as something that would make them stay. Men cite this factor more frequently than women (62.8% vs. 56.0%), and urban Afghans cite it more frequently than rural Afghans (67.2% vs. 56.9%). Not surprisingly, concerns about employment are less often cited by Afghans who are over 60 years old (51.7%) than by younger Afghans (61.0% age 18 30, 58.7% age 31 45, and 58.7% age 46 60). Improving the economy (e.g., by lowering prices or adding jobs) is cited by 11.7% of Afghans who want to leave as a factor that would make them stay. Just 8.76% cite improved governance (e.g., eliminating corruption), 6.4% refer to improving infrastructure (e.g., building factories, reconstruction), and 3.0% refer to improving health and well-being (e.g., government assisting people, health care). REASONS FOR STAYING This year, the Survey also asked respondents who say they would not leave Afghanistan if afforded the opportunity, to elaborate on the reasons why. By far the most frequently cited reason for staying relates to Afghan identity. 39 Indeed, 82.9% of those who want to stay give reasons such as this is my country, I feel comfortable here, for the freedom of my country, and for the reconstruction of the country, and the like. By comparison, 14.3% give reasons for staying that reflect a desire to serve or improve Afghanistan by rebuilding the country, for example, or by eliminating ISIS/Daesh and the Taliban. 40 Similar proportions refer to various obstacles to leaving, such the family disallowing it (13.9%) 41 or poor prospects elsewhere of things like employment (12.4%). 42 More women than men (16.5% vs. 11.2%) refer to obstacles that might prevent them from leaving (figure 9.6) AFGHANISTAN IN 2017
189 REASONS FOR STAYING MALE FEMALE TOTAL % % % AFGHAN IDENTITY DON'T KNOW TO SERVE/IMPROVE AFGHANISTAN RESTRICTED FROM LEAVING POOR PROSPECTS ELSEWHERE REFUSED FIG. 9.7: Q-82b. (Ask if answered no in Q-82a) Why would you stay in Afghanistan? List up to two answers. 9.4 PERCEPTIONS OF RETURNEE EXPERIENCES KEY QUESTIONS Q-84. Do you know any person who has left Afghanistan in the past three years and then subsequently returned to Afghanistan? Q-85. (Ask if answered yes in Q-84) Why did this person return to Afghanistan? Q-86. (Ask if answered yes in Q-84) Which country did this person return from? Q-87. (Ask if answered yes in Q-84) Do you think this person was treated fairly by the other country? Q-88. (Ask if answered yes in Q-84) What level of difficulty, if any, do you think that this person faced after they returned to Afghanistan Since last year s Survey, Afghanistan has seen an unprecedented increase in the number of its citizens returning from Europe, Pakistan, and Iran. In October 2016, the Afghan government and the European Union agreed on a plan to facilitate the return of Afghans from Europe. 44 Between January 2016 and January 2017, over 700,000 undocumented Afghans returned or were deported from Pakistan and Iran. 45 This rate of returns is significantly higher than in previous years. 46 Many of these returnees have joined the growing ranks of internally displaced people (IDPs) in Afghanistan. 47 Rather than stimulating the economy, 48 these returnees seek work in an already tight labor market, 49 placing increased stress on the country s resources and resulting in what has been termed poverty competition. 50 To explore the relationship between the experience of returnees and a desire to migrate, the Survey this year asked if respondents know of someone who left Afghanistan and returned within the last three years. If so, respondents were asked where this person returned from and why. The difficulties returnees 51 faced upon return were also examined. Almost a quarter of respondents (24.0%) know of someone who left Afghanistan and returned within the last three years. Of these returnees, 38.2% returned from Iran, 25.9% from European 52 countries, and 10.3% from Pakistan. Over half of respondents (52.3%) say this person returned because of immigration or integration issues in their host country. 52 Specifically, respondents say that returnees were deported (36.5%), received MIGRATION 179
190 unfair treatment from their host country (8.8%), were illegal immigrants (6.0%), or were not accepted at the intended destination (less than 1%). Unemployment is the next-most frequent response, at 16.6%, and 7.1% of respondents say returnees came back to Afghanistan for reasons of patriotism. Personal reasons for returning, such as visiting family, are also cited by 14.3% of respondents. Interestingly, knowing a returnee is associated with a greater desire to leave Afghanistan than not knowing a returnee. Of those respondents who know a returnee, 44.5% indicate a willingness to leave Afghanistan, compared to 37.2% of respondents who do not know a returnee. Those who know a returnee who was treated fairly by the host country express a greater willingness to leave Afghanistan (48.4%) than those who know a returnee who was treated unfairly (42.9%). Other returnee-related factors appear to have less influence on migration intentions. Knowing a returnee is only marginally associated with Afghans perception of whether it has become easier or harder to leave Afghanistan. Of those who know a returnee, 74.5% say it is harder to leave now, compared to 70.4% of those who do not know a returnee. Similarly, the level of difficulty that returnees faced upon arriving back in Afghanistan is not clearly associated with a desire to leave Afghanistan. Respondents who know a returnee who faced no difficulty on return express a lower desire to migrate than those who know a returnee who faced some or a lot of difficulty (41.0%, compared to 47.4% and 43.0%, respectively). In summary, last year s Survey revealed a significant decrease from the previous year in the number of Afghans willing to leave the country. By any measure, 2016 was an exceptional year for pull factors. The high-profile movements of many people seeking to resettle elsewhere, the restrictive reception policies in transit and destination countries, and the substantial numbers of Afghans returning from Europe, Pakistan, and Iran are likely to have driven down the desire to leave Afghanistan that year. Given the continuing flow of returnees since then, it would have been reasonable to expect a further decline this year in the intention to migrate. This year, however, the opposite has transpired. Rather than a further reduction in migration intentions, this year s Survey finds a substantial overall increase in the number of Afghans who say they are willing to leave to the second-highest level recorded. Indeed, in some regions and provinces, the desire to leave Afghanistan has reached record levels. This overall rise has been accompanied by commensurate increases in the proportion of older Afghans, those who live in rural areas, and Afghans without formal schooling who say they would leave the country if given the chance. A large number of internally displaced Afghans are placing a significant strain on the country s resources. Already, over a third of Afghan citizens live below the poverty line. 53 Agreements to return Afghans from Europe, and rising numbers of voluntary and forced returns from Pakistan and Iran, are adding to the strain. Without economic improvements, the prospects for those who remain in Afghanistan appear bleak, 54 in a landscape where it has been reported that people smugglers are actively looking for business. 55 This year, security and employment feature strongly in migration-related reasoning. The relationship between infrastructure and migration, however, is less straightforward and is in need of further systematic examination. And knowing of someone who has returned to Afghanistan in the last three years, rather than damping the desire to migrate, is associated with an increased desire to leave. 180 AFGHANISTAN IN 2017
191 Taken together, these findings reaffirm that Afghans considering leaving their country give careful consideration to both push and pull factors. The prevailing migration milieu in Afghanistan, however, appears currently to be dominated by push factors. The sharp increase this year in Afghans willingness to leave their country likely reflects the increasing difficulties they face at home. MIGRATION 181
192 End Notes 1 Jelena Bjelica and Martine van Bijlert, Afghan Exodus: The opening and closing of the Balkan corridor (Afghanistan Analysts Network, 2016), 2 The Asia Foundation, Afghanistan in 2016: A Survey of the Afghan People (San Francisco: The Asia Foundation, 2016), asiafoundation.org/where-we-work/afghanistan/survey/. 3 AAN Team, What to watch? Key issues to follow in Afghanistan in 2017 (Afghanistan Analysts Network, 2017), afghanistan-analysts.org/what-to-watch-key-issues-to-follow-in-afghanistan-in-2017/. 4 World Bank, Afghanistan Development Update (Washington, DC: World Bank Group, 2017), worldbank.org/bitstream/handle/10986/27550/ revised-public-afg-development-update-spring final.pdf?sequence=1&isallowed=y. 5 Patricia Gossman, Kabul Bombing a Reminder of Civilian Suffering in Afghanistan, Human Rights Watch, May 31, 2017, 6 Phil Glendenning, Farhad Arian, Mark Isaacs, and Martin Reusch, The Responsibility to Protect: Afghanistan s current situation, drivers of migration and returnees experience (New South Wales: Edmund Rice Centre, July 2017), responsibility_to_protect. 7 Jelena Bjelica and Thomas Ruttig, Voluntary and forced returns to Afghanistan in 2016/17: Trends, statistics and experiences (Afghan Analysts Network, 2017), trends-statistics-and-experiences/. 8 United Nations Office for the Coordination of Humanitarian Affairs (UNOCHA), Humanitarian Needs Overview 2017: Afghanistan (UNOCHA, 2016), 9 Number Of IDPs Fleeing Conflict On The Rise, TOLO News, September 5, 2017, afghanistan/number-idps-fleeing-conflict-rise. 10 Human Rights Watch (HRW), Afghanistan, in World Report 2017: Events of 2016 (HRW, 2017), 65 71, org/world-report/2017/country-chapters/afghanistan. 11 Angeliki Dimitriadi, In Search of Asylum: Afghan Migrants in Greece, European Journal of Migration and Law 19, no. 1 (2017): Ibid. 13 Professor William Maley View on the Return of Hazaras to Afghanistan, World Hazara Council blog, December 5, 2016, 14 White collar jobs include working in the government offices, private companies, schools, and universities. The unskilled and semi-skilled include those who work in the farms, unskilled laborers, those who are employed in the informal sales, artisans, small business owners, Mullahs, and the police/military. 15 Aziz Amin Ahmadzai, Challenges and Opportunities for Afghanistan in 2017, Diplomat, December 29, 2016, thediplomat.com/2016/12/challenges-and-opportunities-for-afghanistan-in-2017/. 16 Key Migration Terms, International Organization for Migration, 17 The Asia Foundation, ASurvey of the Afghan People Dimitriadi, In Search of Asylum. 19 This figure represents the aggregation of multiple responses related to domestic insecurity, including, but not limited to: insecurity, Taliban are killing people, suicide attacks, fear from ISIS, existence of criminals, kidnappings, terrorists, and ethnic problems. 20 AAN Team, What to watch? 21 This figure represents the aggregation of multiple responses related to lack of opportunities, including: education, for children s future, illiteracy, uncertain future, and lack of freedom for women. 22 This figure represents the aggregation of multiple responses related to: bad economy, corruption, injustice, weak government, and high prices. 23 Exposure to corruption is a scale that has a Cronbach s alpha of 0.91 (strong reliability). Scale items include Q-40: Here are different organizations or situations in which people have experienced corruption. In the past 12 months, please tell me how often you had to give money, a gift, or a favor? (a) Officials in the municipality/district office. (b) Provincial governor s office. (c) Customs 182 AFGHANISTAN IN 2017
193 office. (d) Afghan National Police. (e) Afghan National Army. (f) Judiciary/courts. (g) State electric supply. (h) Hospitals/clinics. (i) When applying for a job. (j) Admissions to schools/university. 24 p-value<0.05, correlation coefficient= Probit regression was used to regress exposure to corruption and intent to leave. The full model explains 15% of variation in intent to leave, and it confirms a significant relationship between exposure to corruption and intent to leave (p-value<0.05) after controlling for attitudinal and demographic factors. 26 Seefar, Alternatives to irregular migration in Afghanistan: How aid affects choices in migration source communities (Seefar, n.d.), Migrants-1.pdf. 27 Radha Iyengar, Jacob N. Shapiro, and Stephen Hegarty, Lessons Learned from Stabilization Initiatives in Afghanistan: A Systematic Review of Existing Research (Santa Monica: Rand Corporation, June 2017), rand/pubs/working_papers/wr1100/wr1191/rand_wr1191.pdf. 28 Ibid. 29 This figure represents the aggregation of multiple responses related to: lack of clinics/hospitals, lack of shelter, lack of roads, lack of electricity, and more facilities. 30 This figure represents the aggregation of multiple responses related to: reconstruction, build factories, providing electricity, giving shelter, build dams, new facilities are provided, and cleaning the city. 31 The Asia Foundation, A Survey of the Afghan People Respondents received a prompt that read: As you may know, the government created the National Solidarity Program to improve people s living conditions. The NSP program built roads, schools, health clinics and hospitals, electricity lines, and water wells, and dug canals for irrigation. 33 Baad refers to the traditional practice of giving away a daughter to another party as a penalty or payment to settle a debt or resolve a dispute, grievance, or conflict between families. Baddal refers to the exchange of daughters in marriage between families. This is often, but not always, a form of forced marriage, and may have economic implications (e.g., there is generally no bride price involved). For more, see chapter 8, Women in Society. 34 European countries mentioned include Germany, Austria, Holland, UK, Denmark, Sweden, European countries, Ireland, Russia, France, Norway, Greece, Belgium, Switzerland, Italy, Ukraine, Finland, Bulgaria, Spain, and Czech Republic. 35 The Asia Foundation, A Survey of the Afghan People 2016, Ibid., This figure represents the aggregation of multiple responses related to: maintain security, removing the Taliban and ISIS, preventing suicide attacks, removing nationalism, prevent narcotics, disarmament, increasing the ANA, and arrest criminals. 38 This figure represents the aggregation of multiple responses related to: employment opportunities, improving education, and attention to women s rights. 39 This figure represents the aggregation of multiple responses related to: It is my country, I love my country, I feel comfortable here, for the freedom of my country, I will stay due to my lands, and this is an Islamic country. 40 This figure represents the aggregation of multiple responses including: for the reconstruction of the country, to remove ISIS and Taliban, to serve people, to develop education, to fight against corruption, to prevent suicide attacks, and to eliminate narcotics. 41 Responses include unable to leave, and restricted by family. 42 Responses include poor employment opportunities, recipient country rejecting refugees, and risk of going. 43 It should be noted that 42.5% say they do not know why they would stay. 44 European Union and the Islamic Republic of Afghanistan, Joint Way Forward on migration issues between Afghanistan and the EU, October 2, 2016, 45 International Organization for Migration (IOM), Return of Undocumented Afghans, Weekly Situation Report, 1 7 January 2017 (IOM, January 11, 2017), MIGRATION 183
194 46 International Organization for Migration (IOM), Return of Undocumented Afghans, Weekly Situation Report, August 2017, (IOM, August 30, 2017), 47 Human Rights Watch, Afghanistan. 48 World Bank, Afghanistan Development Update. 49 United Nations Office for the Coordination of Humanitarian Affairs (UNOCHA), Humanitarian Bulletin Afghanistan, no. 61 (February 1 28, 2017), 50 Rod Norland, Afghanistan itself is now taking in the most Afghan migrants, New York Times, November 4, 2016, For ease of reference, we have used the term returnee in the context of the Survey to refer to a person who has left Afghanistan and returned within a three-year period. 52 This figure represents the aggregation of responses including: Sweden, Italy, Greece, Germany, Switzerland, Norway, Austria, Europe, Holland, Belgium, Denmark, UK, France, Russia, Hungary, Ukraine. 53 Responses include deportation, unfair treatment of the host country s people, illegal migration, host country was infidel, host country did not accept migrants, deportation by host country due to request from the President, difficulty in having control over family members in the host country. 54 Poverty in Afghanistan, Asian Development Bank, 55 UNOCHA, Humanitarian Needs Overview Fayz Ghaznawi, People smugglers a dangerous Mafia network in Afghanistan, Hazara International Network blog, October 12, 2016, AFGHANISTAN IN 2017
195
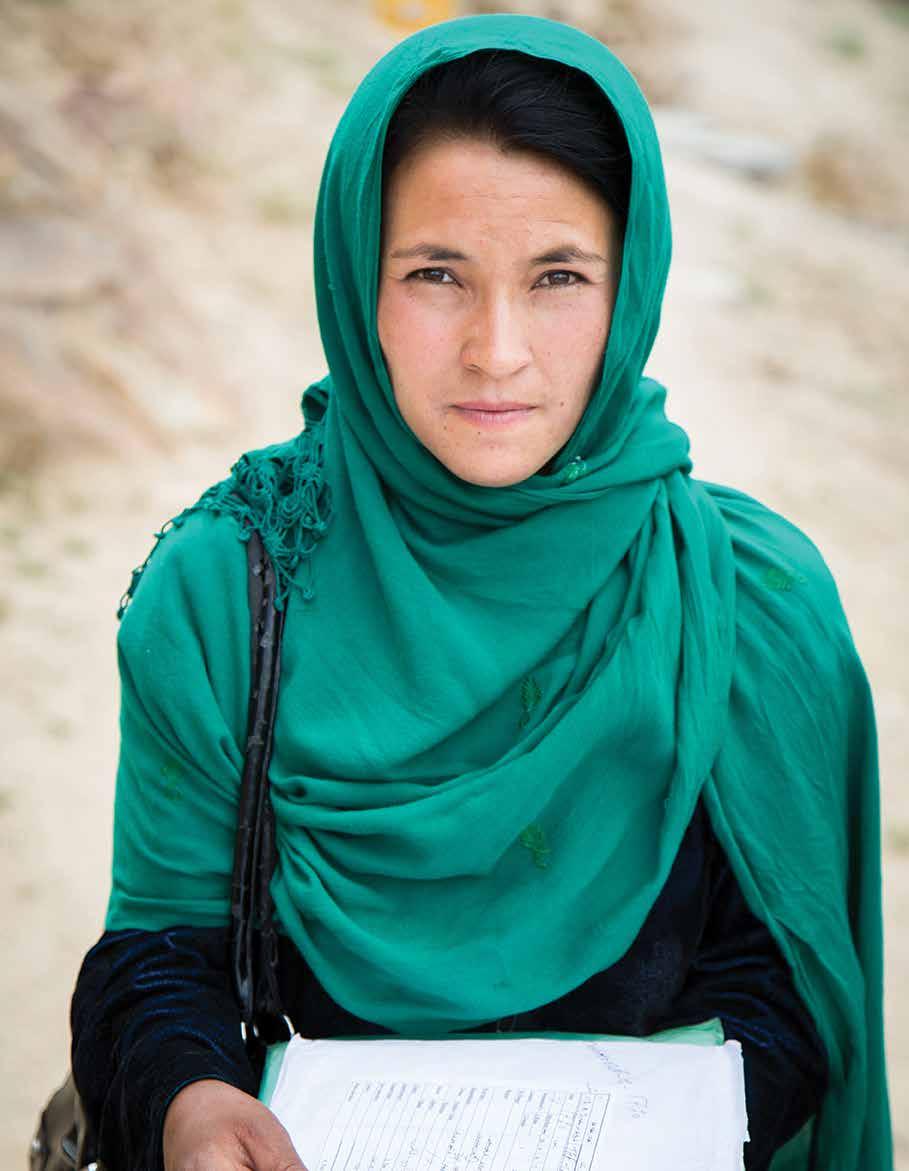
196
197 APPENDIX 1: METHODOLOGY 1 SUMMARY The Asia Foundation s annual A Survey of the Afghan People is Afghanistan s longest-running nationwide survey of the attitudes and opinions of Afghan adults. Since 2004, over 97,000 Afghan men and women have been surveyed, representing more than 400 districts in all 34 provinces. All data is public and free for immediate download at Face-to-face interviews were conducted July 5 23, 2017, across all provinces by a team of 929 interviewers (460 female, 469 male). As with the 2016 Survey, mobile devices were used to collect a portion of the interviews. Fieldwork was again led by the Afghan Center for Socio-Economic and Opinion Research (ACSOR), while third-party field verification was led by Sayara Research. Quality controls were implemented at each step of the process by both The Asia Foundation and its partners to ensure methodological consistency for longitudinal comparisons. In total, 37% of interviews were subject to some form of back-check or quality control. Highlights from the sample design, field implementation, quality control, questionnaire design, and overall field experience are summarized below: 1. A Survey of the Afghan People includes a sample of 10,012 men and women above 18 years of age residing in all 34 provinces of Afghanistan. Of these, 697 men and women in Kabul and Balkh provinces were interviewed using mobile devices loaded with Research Control Solutions (RCS) survey software, while the remaining 9,315 respondents were interviewed using paper questionnaires. 2. The main sample was stratified by province and urban/rural status using population data released by Afghanistan s estimates from the Central Statistics Office (CSO). If a selected district was not accessible for interviewing, intercept interviews were conducted with male residents of that district in nearby districts. Sampling points that were planned for interviews with women but could not be covered by female interviewers were replaced with female interviews from within the same strata (same province and urban/rural designation). 3. Each year, the overall margin of error (MoE) for the Survey is estimated on the basis of the binomial question, Overall, based on your own experience, do you think things in Afghanistan today are going in the right direction, or do you think they are going in the wrong direction? The estimated design effect is Using this estimate of a design effect, the MoE at the 95% CI with p=.5 is ±1.4% for the probability sample. 2 Importantly, this MoE takes into account the disproportionate stratification and two levels of clustering (district and sampling point). 4. Disposition outcomes for all interviews were tracked by ACSOR staff using the standard codes of the American Association for Public Opinion Research (AAPOR), which have been adapted to the Afghan context. For this sample, the Response Rate 3 is 83.58%, the Cooperation Rate 3 is 94.95%, the Refusal Rate 2 is 3.43%, and the Contact Rate 2 is 88.70%. APPENDIX 1: METHODOLOGY 187
198 5. There were some provinces where security, transportation, and other factors affected fieldwork. These factors are common in Afghanistan, and the safety of field teams is always a primary concern. 2 QUESTIONNAIRE DESIGN Questions are determined annually on the basis of inputs from the Afghan government and other stakeholders. Each year, The Asia Foundation removes questions yielding low analytical value, while preserving trend-line questions for longitudinal comparison. Proposed new questions are vetted to ensure that they meet international standards that they can, for example, be easily understood by respondents, that they are not threatening or leading, and that response scales match question wording. In total, this year s questionnaire went through nine iterations before being approved for translation. All surveys were administered in either Dari or Pashto versions. The questionnaire addresses infrastructure and development, rule of law, governance, security, corruption, elections, reconciliation, women s issues, and social issues. The questionnaire includes 21 demographic questions and 126 substantive questions. In some cases, there are batteries of questions; for these, each item within the battery is counted as a third of a question. Of the substantive questions, 27 were new and two were modified from previous waves. 3 SAMPLE DESIGN The sample was drawn using a multistage systematic sampling approach. The updated population and settlement figures provided by the CSO were used as the basis for constructing survey weights. Target population: Afghan adults in 34 provinces Target sample: 9,600 Afghan adults in 34 provinces Achieved sample: 10,012 Afghan adults in 34 provinces 3 Determining the sample followed six steps: Step 1: For the main sample, a base sample was first stratified disproportionally by province based on desired MoE and power estimates. A minimum of 200 interviews were carried out in each province. Within each province, the sample was then stratified by urban and rural population figures from the CSO estimates. Step 2: Districts were selected via probability-proportional-to-size (PPS) systematic sampling. Districts serve as the primary sampling unit (PSU). Each PSU contains two sampling points, one for male respondents and one for female respondents. This is done to allow for gender-matched interviewing, which is a cultural requirement of working in Afghanistan. Each PSU is chosen via PPS sampling within its stratum. To collect information on the perceptions of those living in insecure areas that are not accessible to the enumerators conducting random walk, intercept interviews were held with people coming out of these areas to towns, bazaars, bus depots, or hospitals in more secure areas. For the 2017 Survey, approximately 9% of the interviews (n=926) were intercept interviews. Intercept interviews were done in 75 districts across 25 provinces. These intercept interviews are identified by the variable Method1 in the data set online. 188 AFGHANISTAN IN 2017
199 Step 3: Settlements within districts were selected by simple random sampling. These serve as the secondary sampling unit (SSU). Within urban strata, we used neighborhoods (called nahias) and towns, while in rural strata we used villages. As population data for settlement sizes does not exist, a simple random selection among all known settlements was used to select locations. In this survey, six interviews were done per sampling point. The frequent fighting and instability in some provinces can cause a sampling point to be adjusted or replaced to keep interviewers out of areas with active violence. A complete list of replaced sampling points can be found online with the raw data. A total of two replicate draws were provided to the field team prior to the launch of fieldwork. In cases where the replicates were exhausted, replacements at the settlement/nahia level were selected in the field by supervisors, choosing neighboring accessible settlements as replacements whenever possible. In keeping with Afghan cultural norms, interviewing was gender specific, with female interviewers interviewing only females and males interviewing only males. However, some districts with significant insurgent activity, military operations, or lack of transportation had male-only samples under certain conditions. In cases where a sampling point designated for female interviews was only accessible for male interviewing, it was replaced with a female sampling point from within the same strata (same province and same urban/rural status). Step 4: Field managers then used maps generated from several sources to select starting points within each SSU. In rural areas, interviewers started in one of five randomly selected locations (the northern, southern, eastern, or western edges of the rural settlement, or the center). In urban areas, because it is more difficult to differentiate neighborhood borders, a random location (northern, southern, eastern, western, or center) was provided to the interviewers, and they were to start from an identifiable landmark in the vicinity, such as a school or mosque. Step 5: To bolster the randomization process, each sampling point was also randomly assigned a different house number for the random walk either the first, second, or third house encountered from the random walk. After approaching the house, the interviewer then followed a set interval to select all other households for inclusion in the sample. After reaching the first house in each sampling point, interviewers in rural areas selected every third house on the right thereafter, and in urban areas every fifth house on the right thereafter. Step 6: After selecting a household, interviewers were instructed to utilize a Kish grid to randomize the target respondent 4 within the household. Members of the household were listed with their names and their ages in descending order, and then the respondent was selected according the rules of the Kish grid. Two weights were created for the 2017 Survey, each calibrated to strata and gender targets. One weight variable, RakedWgt, includes intercept interviews, while the other, RakedWgt2, does not, and only includes the probability sample. For each of these weights, an adjustment for response rates according to AAPOR s Response Rate 3 (RR3) was performed. The base weight, also referred to as the probability-of-selection weight or design weight, is computed simply as the inverse of the probability of selection for each respondent. However, two assumptions were made in the APPENDIX 1: METHODOLOGY 189
200 sampling design that approximate the EPSEM (equal-probability-of-selection method). 1. All settlements are of equal size. Since population estimates at the settlement level are unavailable and/or unreliable, the sample design draws settlements using a simple random sample (SRS). By assuming the settlements are of equal size, the SRS condition of equal probabilities of selection holds true. 2. The random route procedure is equivalent to an SRS of households and respondents. Household enumeration is too time consuming, costly, and dangerous to be completed in Afghanistan. Random route and Kish grid procedures were used instead for respondent selection. We assumed that these procedures are equivalent to performing an SRS of households and respondents at the settlement level. 4 PROVINCIAL POPULATION Below are the population assumptions for each province as supplied by the Afghan Central Statistics Office, beside the unweighted and weighted sample distributions. Urban population centers are not disaggregated here, meaning that Kabul Province includes Kabul City, Nangarhar includes Jalalabad City, and so on. PERCENTAGE IN POPULATION PERCENTAGE IN UNWEIGHTED SAMPLE (INCLUDES INTERCEPT INTERVIEWS) PERCENTAGE IN WEIGHTED SAMPLE WITHOUT INTERCEPTS KABUL 16.1% 10.7% 16.3% KAPISA 1.6% 2.1% 1.6% PARWAN 2.4% 2.0% 2.4% WARDAK 2.2% 3.8% 2.2% LOGAR 1.4% 2.1% 1.4% GHAZNI 4.5% 2.1% 4.5% PAKTIA 2.0% 2.2% 2.0% PAKTIKA 1.6% 2.2% 1.6% KHOST 2.1% 2.1% 2.1% NANGARHAR 5.6% 5.2% 5.6% LAGHMAN 1.6% 2.2% 1.6% KUNAR 1.7% 2.1% 1.6% NURISTAN 0.5% 2.1% 0.5% BADAKHSHAN 3.5% 2.2% 3.5% TAKHAR 3.6% 2.1% 3.6% BAGHLAN 3.3% 3.4% 3.3% KUNDUZ 4.3% 4.2% 4.3% BALKH 4.9% 4.1% 4.9% SAMANGAN 1.4% 2.0% 1.4% JAWZJAN 2.0% 2.1% 2.0% SAR-E-PUL 2.1% 2.1% 2.0% FARYAB 3.7% 3.2% 3.7% BADGHIS 1.8% 2.1% 1.8% HERAT 6.9% 5.3% 6.9% FARAH 1.9% 2.1% 1.9% NIMROZ 0.6% 2.1% 0.6% HELMAND 3.4% 4.1% 3.4% KANDAHAR 4.5% 4.3% 4.5% ZABUL 1.1% 2.2% 1.1% 190 AFGHANISTAN IN 2017
201 URUZGAN 1.3% 2.1% 1.3% GHOR 2.5% 2.1% 2.5% BAMYAN 1.5% 3.1% 1.5% PANJSHIR 0.6% 1.9% 0.6% DAIKUNDI 1.7% 2.2% 1.7% TOTAL 100% 100% 100% 5 MARGIN OF ERROR Assuming a simple random sample with n=10,012 and p=.5 at the 95% CI level, the margin of error for the 2017 is 1.0%. However, when accounting for the complex design through the design-effect estimate of with p=.5 at the 95% CI level, the complex MoE is 1.4%. Design effect is a calculation that helps us account for complex sample design and weighting. To determine the design effect, several steps were taken: The sample was stratified by urban/rural status and province, with two stages of clustering: district and settlement. For purposes of design-effect estimation, only one stage of clustering is specified. Most of the additional variance is accounted for in the initial stage of clustering, resulting in a negligible increase in design effect when two stages are defined. The design effect, for reporting purposes, is estimated for a key question of interest: In your opinion, are things in our country generally going in the right direction, or the wrong direction? In an effort to provide a survey-wide design effect, a weighted-mean design effect is calculated as the average across each response category of the variable when weighted by frequency of response. In addition to this conservative 5 estimation of MoE, statistic-specific standard errors are provided using bootstrapping. Bootstrapping is a resampling method that does not rely on assumptions about the distribution of the variable of interest. These estimates are calculated with the weighted data, and can be multiplied by the square root of the design effect in order to achieve a standard error that takes the design into consideration. These estimates take the actual responses into consideration during calculation (as opposed to the conservative setting of p=.5). PROPORTION COMPLEX STANDARD ERRORS DESIGN EFFECT SRS BOOTSTRAPPED SE RIGHT DIRECTION 32.07% % % WRONG DIRECTION 62.01% % % REFUSED 0.78% % % DON'T KNOW 5.14% % % WEIGHTED MEAN APPENDIX 1: METHODOLOGY 191
202 6 INTERVIEWERS The field team s 929 interviewers are broken down by gender and province in the table below. NUMBER OF SUPERVISORS NUMBER OF FEMALE INTERVIEWERS NUMBER OF MALE INTERVIEWERS TOTAL NUMBER OF INTERVIEWERS BADAKHSHAN BADGHIS BAGHLAN BALKH BAMYAN DAIKUNDI FARAH FARYAB GHAZNI GHOR HELMAND HERAT JAWZJAN KABUL KANDAHAR KAPISA KHOST KUNAR KUNDUZ LAGHMAN LOGAR NANGARHAR NIMROZ NURISTAN PAKTIA PAKTIKA PANJSHIR PARWAN SAMANGAN SAR-E-PUL TAKHAR URUZGAN WARDAK ZABUL TOTAL SAMPLING REPLACEMENTS In surveys prior to 2014, if a sampling point was inaccessible, the replacement of this sampling point was left to the discretion of field supervisors and managers. Recognizing the need to limit systematic bias from field supervisors selecting replacement sampling points, a system was introduced in 2013 that assigns two randomly determined replacement sampling points prior to the launch of fieldwork. 192 AFGHANISTAN IN 2017
203 As before, the first draw serves as the initial list of sampling points where fieldwork is to be conducted. If the sampling point is inaccessible, field supervisors inform the central office of the reason for inaccessibility. The field supervisor then uses the first preassigned replicate, which is always a different village within the same district. If this village is also inaccessible, the process is repeated with a second preassigned replicate. If the second replicate is also inaccessible, the next selected village is left to the discretion of the field managers and supervisors. In cases where replacements at the settlement/nahia level are made in the field by supervisors, neighboring accessible settlements are chosen as replacements whenever possible. A worsening security situation, with increased activity by Taliban and ISIS/Daesh insurgents as well as criminal elements, led to a higher replacement rate in 2017 than in previous years. As of July 2017, 69% of the population lived in districts accessible to ACSOR, while 12% lived in districts accessible only to male interviewers, and 19% lived in inaccessible districts. This means that, in total, 31% of women and 19% of men were inaccessible to random-walk interviewing. Of 1,728 sampling points selected, a total of 668 villages from the main draw had to be replaced for a variety of reasons. This represents a total replacement rate of 38.7% of original sampling points. YEAR NUMBER OF SAMPLING POINTS (TOTAL) REPLACEMENT RATE BY YEAR NUMBER OF REPLACED SAMPLING POINTS REPLACEMENT RATE % % % % , % , % , % , % , % , % Of the 668 villages in the main draw that were replaced, 185 (27.7%) were replaced by villages in the second draw, 142 (21.3%) were replaced by villages in the third draw, and 341 (51.0%) were replaced by the supervisor. The primary reason for replacement was Taliban presence or other security issues. Reasons for all replacements are summarized in the table below. VILLAGE REPLACEMENTS INITIAL DRAW SECOND DRAW THIRD DRAW REASON NUMBER PERCENT NUMBER PERCENT NUMBER PERCENT SECURITY ISSUES/TALIBAN % % % ACCESSIBILITY/WEATHER % % % VILLAGE ABANDONED/COULD NOT BE FOUND % % % VILLAGE-LEVEL REFUSAL 9 1.3% 4 0.8% 0 0.0% VILLAGE IN WRONG DISTRICT 3 0.4% 0 0.0% 0 0.0% OTHER 0 0.0% 0 0.0% 1 0.3% TOTAL % % % APPENDIX 1: METHODOLOGY 193
204 Female sampling points had a higher rate of replacement, and were more likely to be replaced for security reasons: 33.1% of male sampling points were replaced (286 out of 864), compared with 44.2% of female sampling points (382 out of 864). The tables below compare the reasons for replacement for male and female sampling points in the first sample draw, followed by replacement reasons over time. REPLACED SAMPLING POINTS BY GENDER REPLACED MALE SAMPLING POINTS FIRST SAMPLE DRAW REPLACED FEMALE SAMPLING POINTS FIRST SAMPLE DRAW REASON NUMBER PERCENT NUMBER PERCENT SECURITY ISSUES/TALIBAN % % ACCESSIBILITY/WEATHER % % VILLAGE ABANDONED/COULD NOT BE FOUND % % VILLAGE-LEVEL REFUSAL 4 1.4% 5 1.3% VILLAGE IN WRONG DISTRICT 2 0.7% 1 0.3% OTHER 0 0.0% 0 0.0% TOTAL % % REASON NUMBER PERCENT NUMBER PERCENT NUMBER PERCENT NUMBER PERCENT SECURITY ISSUES/TALIBAN % % % % ACCESSIBILITY/WEATHER % % % % VILLAGE ABANDONED/COULD NOT BE FOUND % % % % VILLAGE-LEVEL REFUSAL 0 0.0% 5 2.4% 0 0.0% 7 4.2% VILLAGE IN WRONG DISTRICT 2 3.8% 0 0.0% 0 0.0% 0 0.0% OTHER 0 0.0% 1 0.5% 0 0.0% 0 0.0% TOTAL % % % % REASON NUMBER PERCENT NUMBER PERCENT NUMBER PERCENT NUMBER PERCENT SECURITY ISSUES/TALIBAN % % % % ACCESSIBILITY/WEATHER % % % % VILLAGE ABANDONED/ COULD NOT BE FOUND % % % % VILLAGE-LEVEL REFUSAL 9 2.6% % 3 0.7% 2 0.4% VILLAGE IN WRONG DISTRICT 6 1.8% 4 1.5% 0 0.0% 3 0.6% OTHER 0 0.0% 0 0.0% 0 0.0% 0 0.0% TOTAL % % % % REASON NUMBER PERCENT NUMBER PERCENT SECURITY ISSUES/TALIBAN % % ACCESSIBILITY/WEATHER % % VILLAGE ABANDONED/COULD NOT BE FOUND % % VILLAGE-LEVEL REFUSAL % 9 1.3% VILLAGE IN WRONG DISTRICT 4 0.5% 3 0.4% OTHER 4 0.5% 0 0.0% TOTAL % % 194 AFGHANISTAN IN 2017
205 8 QUALITY CONTROLS Quality controls were implemented at every stage of the process. Thirty-five ACSOR supervisors and 55 Sayara monitors (including 20 female and 22 male monitors and 13 supervisors) observed interviewer s work in the field. 6 Approximately 37% of the interviews were subject to some form of back-check. The back-checks consisted of Direct observation during the interview (620 interviews, 6%); A return visit by the supervisor to the residence where an interview took place (2,160 interviews, 22%); Back-check from the central office (47 interviews, 0.5%); or Quality control by an external validator (859 interviews, 8.6%). As in 2014, 2015, and 2016, the 2017 Survey included third-party validation. ACSOR supervisors provided the fieldwork schedule to the validation team following the training briefings. Asia Foundation personnel also participated in validation for some sampling points. Validators or The Asia Foundation personnel met with ACSOR interviewers during the field period and observed fieldwork to verify the correct administration of the survey, including the starting point, the random walk, and the use of the Kish grid to select respondents in 148 sampling points. They also conducted back-checks of selected interviews. 9 GPS COORDINATES In order to improve accuracy and verify fieldwork, interviewers used phones to collect GPS data in 1,542 out of 1,728 sampling points (89%). Interviewers also collected GPS coordinates for 487 out of 528 respondents for the Kabul RCS sample. While ACSOR was able to collect GPS coordinates in all 34 provinces, they were not able to collect GPS coordinates in all sampling points, due to fears for the security of interviewing staff. As an extra level of verification, GPS coordinates were then compared to GPS coordinates of villages provided by the CSO. For this study, the median distance from the selected villages was 0.95 km. 10 CODING AND DATA ENTRY When the questionnaires were returned to the ACSOR central office in Kabul, they were sorted, and openended questions were coded by a team of coders familiar with international standards for creating typologies for codes. During this process, the keypunching team utilized logic checks and verified any errors inadvertently committed by interviewers. As entry of questionnaires was completed, 20% of all paper questionnaires (1,932 out of 9,653) were randomly selected and given to a different team for reentry. Data results from this independent entry were then compared to the primary data set. Discrepancies and errors were identified by data coders. For all errors, questionnaires were then reviewed, and the correct data is included in the final data set. The error rate for data entry for the 2017 Survey was 0.08%, which is comparatively low and acceptable for quality-control standards. This error rate is lower than the 0.14% error rate for the 2016 Survey. Logic tests were then applied by ACSOR to mine for poor-quality data. Sample logic tests included: The equality test: compares interviews for similarities, grouped by interviewer, within sampling point, province, or any other variable. Interviews with 90% equality or higher are flagged for further investigation. APPENDIX 1: METHODOLOGY 195
206 The nonresponse test: determines the percentage of don t know answers and refusals for each interviewer s cases. Surveys where 40% or more of the questions are refused or answered with I don t know are flagged for further investigation. The duplicates test: compares cases across all interviewers and respondents to check for similarity rates. This test will flag any pair of interviews that are similar to each other. Cases that have a similarity of 95% or higher are flagged for further investigation. For the 2017 Survey, six cases were deleted for failing the equality test, 148 cases were deleted for being over 95% similar in substantive responses to another interview (i.e., failing the duplicates test), and five cases were deleted for consisting of over 40% refused or don t know responses (i.e., failing the nonresponse test). The Asia Foundation conducted an additional 40 logic tests and used reports from the third-party validators for further examination of data quality. Based on the results of these tests, a total of 140 cases were removed from the data set for failing more than two logic tests across multiple interviews. If an interviewer had at least two interviews deleted, all interviews conducted by this interviewer were then removed from the data. In total, 3.4% of all surveys were removed at some stage of the quality control process. 196 AFGHANISTAN IN 2017
207 End Notes 1 The design-effect estimate is a weighted average across individual response option design effects for this key question of interest. 2 The probability sample excludes intercept interviews from variance estimation. 3 The target n-size for this survey was 12,600. The initial data set delivered by ACSOR had an n-size of 9,615. A total of 344 interviews were removed as a result of quality control checks, which reduced the total n-size in the final data set to 9, Interviewers are not allowed to substitute an alternate member of a household for the respondent selected by the Kish grid. If the respondent refuses to participate or is not available after callbacks, the interviewer must move on to the next household according to the random route. 5 The margin of error for a binary response is maximized when the proportions are set equal to each other (p=.5) 6 One supervisor had all of his work removed as a result of quality control measures. As a result, there are 35 supervisors in the final data set. APPENDIX 1: METHODOLOGY 197
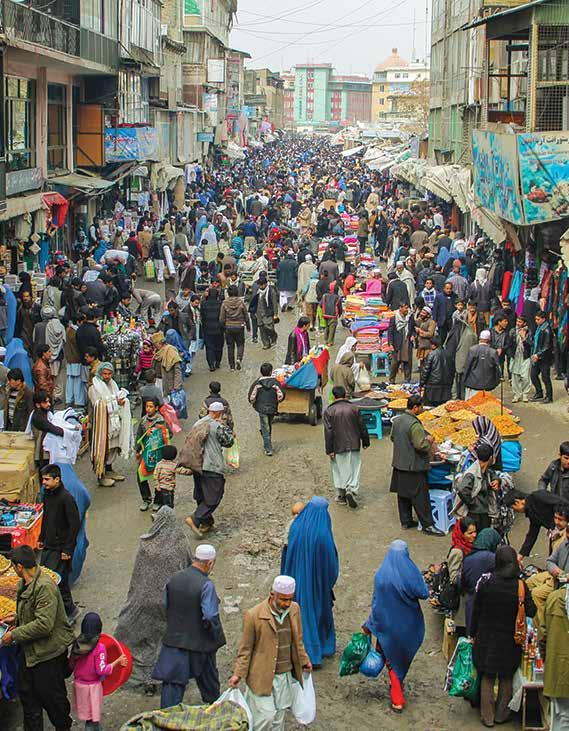
208
209 APPENDIX 2: SAMPLE DEMOGRAPHICS M-4. REGION BASE: ALL RESPONDENTS 9,086 CENTRAL/KABUL 25% EAST 9% SOUTH EAST 10% SOUTH WEST 11% WEST 13% NORTH EAST 15% CENTRAL/HAZARAJAT 3% NORTH WEST 14% M-6A. GEOGRAPHIC CODE BASE: ALL RESPONDENTS 9,086 VILLAGES 75% TOWNS 5% CITY 7% METRO (KABUL) 14% M-7. PROVINCE BASE: ALL RESPONDENTS 9,086 KABUL 16% KAPISA 2% PARWAN 2% WARDAK 2% LOGAR 1% GHAZNI 5% PAKTIA 2% PAKTIKA 2% KHOST 2% NANGARHAR 6% LAGHMAN 2% KUNAR 2% NURISTAN 1% BADAKHSHAN 3% TAKHAR 4% BAGHLAN 3% KUNDUZ 4% BALKH 5% SAMANGAN 1% JAWZJAN 2% SAR-E-PUL 2% FARYAB 4% BADGHIS 2% HERAT 7% FARAH 2% NIMROZ 1% APPENDIX 2: SAMPLE DEMOGRAPHICS 199
210 HELMAND 3% KANDAHAR 4% ZABUL 1% URUZGAN 1% GHOR 3% BAMYAN 2% PANJSHIR 1% DAIKUNDI 2% D1. GENDER BASE: ALL RESPONDENTS 9,086 MALE 50% FEMALE 50% D2. HOW OLD ARE YOU? BASE: ALL RESPONDENTS RURAL URBAN TOTAL 18 TO 24 YEARS OLD 25% 29% 26% 25 TO 34 YEARS OLD 29% 28% 29% 35 TO 44 YEARS OLD 23% 21% 23% 45 TO 54 YEARS OLD 15% 12% 15% 55 AND OLDER 8% 10% 8% D14. WHICH ETHNIC GROUP DO YOU BELONG TO? BASE: ALL RESPONDENTS 9,086 PASHTUN 37% TAJIK 37% UZBEK 9% HAZARA 11% TURKMENI 2% NURISTANI 1% AIMAK 1% ARAB 1% SADAT 1% BALOCH <0.5% PASHAYE <0.5% QEZELBASH <0.5% GUJAR <0.5% TEMORI <0.5% AFGHAN <0.5% BAYAT <0.5% KHWAJA <0.5% BARAHAWE <0.5% 200 AFGHANISTAN IN 2017
211
212
213 APPENDIX 3: INTERVIEW QUESTIONNAIRE MAIN SURVEY QUESTIONS: Q-1. Overall, based on your own experience, do you think things in Afghanistan today are going in the right direction, or do you think they are going in the wrong direction? BASE: ALL RESPONDENTS 9,086 RIGHT DIRECTION 33% WRONG DIRECTION 61% REFUSED 1% DON'T KNOW 5% Q-2. (Ask if answered 1 Right direction to Q-1) What are two reasons you think that Afghanistan is going in the right direction? Q2a. First Mention Q2b. Second Mention BASE: (RIGHT DIRECTION) PERCENT OF CASES RECONSTRUCTION/REBUILDING 34% GOOD SECURITY 24% DON'T KNOW 16% PEACE/END OF THE WAR 16% SCHOOLS FOR GIRLS HAVE OPENED 10% HAVING ACTIVE ANA AND ANP 10% ECONOMIC REVIVAL 9% GOOD GOVERNMENT 8% REDUCTION IN LEVEL OF ADMINISTRATIVE CORRUPTION 8% IMPROVEMENT IN EDUCATION SYSTEM 7% MORE ELECTRICITY SUPPLY THAN BEFORE 5% INTERNATIONAL ASSISTANCE 4% ROAD RECONSTRUCTION 4% HAVING LEGAL CONSTITUTION 3% WOMEN CAN NOW WORK 3% DEVELOPMENT OF AGRICULTURE 3% REMOVING TALIBAN 3% DEMOCRACY/ELECTIONS 2% MORE JOB OPPORTUNITIES AVAILABLE 2% REDUCTION IN POPPY CULTIVATION 2% GOOD COMMUNICATION SYSTEM 2% NATIONAL UNITY 2% CLEAN DRINKING WATER 2% IMPROVED JUSTICE 1% REFUGEES RETURN 1% WOMEN HAVE MORE FREEDOM 1% PRESIDENTIAL ELECTIONS 1% FREEDOM/FREE SPEECH 1% BETTER RELATIONS WITH FOREIGN COUNTRIES 1% GULBUDDIN HEKMATYAR HAS JOINED THE PEACE PROCESS 1% APPENDIX 3: INTERVIEW QUESTIONNAIRE 203
214 CLINICS HAVE BEEN BUILT 1% DEVELOPMENT IN HEALTH-CARE SYSTEM IN GENERAL 1% HAVING PARLIAMENT 1% DECREASE IN CRIMES 1% PREVENTION/ELIMINATION OF CRIMES 1% RESPECTING WOMEN RIGHTS 1% PREVENTION/ELIMINATION OF SUICIDE ATTACKS 1% FREE MOVEMENT/TRAVEL POSSIBLE 1% PEOPLE ARE SATISFIED WITH GOVERNMENT 1% PRESENCE OF FOREIGNERS 1% DISARMAMENT 1% RESPECTING ISLAM 1% MORE ATTENTION TO HUMAN RIGHTS 1% HAVING A LEGITIMATE PRESIDENT <0.5% MORE FACTORIES <0.5% PREVENTING INTERFERENCES OF FOREIGN COUNTRIES <0.5% FOREIGN FORCES LEAVING AFGHANISTAN <0.5% REMOVING TERRORISM <0.5% DECREASE IN ARBITRARY ATTACKS BY THE U.S. <0.5% NEW TECHNOLOGY IS AVAILABLE <0.5% LOW PRICES <0.5% LESS ASSISTANCE PROVIDED TO (INSURGENTS IN) PAKISTAN <0.5% BETTER TREATMENT OF ADDICTS <0.5% MORE WATER FOR IRRIGATION <0.5% ESTABLISHING HIGH PEACE JIRGA/SHURA <0.5% PEOPLE COOPERATE WITH GOVERNMENT <0.5% INCREASE IN NUMBER OF MADRASAS <0.5% HAVING ACTIVE AIRPORTS <0.5% MINING OF NATURAL RESOURCES <0.5% REFUSED <0.5% INDUSTRIAL PROGRAMS <0.5% DECREASE IN KIDNAPPING <0.5% NOTHING IS GOING TO RIGHT DIRECTION <0.5% BUILDING SPORTS STADIUMS <0.5% HAVING WEAPONS/WAR EQUIPMENT <0.5% ESTABLISHMENT OF UNITY GOVERNMENT <0.5% SIGNING STRATEGIC AGREEMENT <0.5% ANTI-FLOOD WALLS HAVE BEEN BUILT <0.5% TRAINING AIR FORCE <0.5% DETECTING AND DEFUSING MINES <0.5% BETTER TRANSPORTATION <0.5% NEW PRESIDENT <0.5% TRANSFER OF SECURITY RESPONSIBILITIES <0.5% ACCESS TO PRODUCTS <0.5% HEZB-E ISLAMI IS GETTING WEAKER <0.5% DECREASE NUMBER OF ACCIDENTS <0.5% FOREIGN FORCES LEAVING AFGHANISTAN <0.5% EXISTENCE/PRESENCE OF GOVERNMENT COURTS <0.5% WOMEN PARTICIPATE IN POLITICS <0.5% ARBAKIES (ARMED GROUPS SUPPORTED BY THE GOVERNMENT) <0.5% 204 AFGHANISTAN IN 2017
215 Q-3. (Ask if answered 2 Wrong direction to Q-1) What are two reasons you think that Afghanistan is going in the wrong direction? Q3a. First Mention Q3b. Second Mention BASE: WRONG DIRECTION PERCENT OF CASES INSECURITY 50% THERE IS UNEMPLOYMENT 27% CORRUPTION 17% DON'T KNOW 11% BAD ECONOMY 11% BAD GOVERNMENT 11% SUICIDE ATTACKS 8% POOR LEADERSHIP 6% PRESENCE OF TALIBAN 5% ETHNIC PROBLEMS 5% NO RECONSTRUCTION HAS HAPPENED 5% INNOCENT PEOPLE BEING KILLED 4% ADMINISTRATIVE CORRUPTION 4% INJUSTICE IN THE COUNTRY 3% HIGH PRICES 3% POOR EDUCATION SYSTEM 3% INCREASE IN CRIMES 2% INCREASE IN DRUG TRADE 2% TOO MANY FOREIGNERS ARE GETTING INVOLVED 2% NEIGHBORING COUNTRIES CAUSE PROBLEMS 2% PRESENCE OF ISIS/DAESH 2% LACK OF AID/NO DEVELOPMENT ASSISTANCE 2% WATER & POWER SUPPLY PROBLEMS 2% LACK OF IMPLEMENTATION OF THE LAW 1% PRESENCE/INTERFERENCE OF FOREIGNERS 1% LACK OF UNITY 1% THERE IS NO PROGRESS 1% UNFAIR ELECTIONS 1% PEOPLE DISILLUSIONED WITH THE GOVERNMENT 1% KIDNAPPING OF CHILDREN 1% PRESENCE OF WARLORDS 1% LACK OF COORDINATION BETWEEN ISAF/ COALITION FORCES AND ANP <0.5% MIGRATIONS <0.5% THERE IS DANGER TO ISLAM <0.5% FOREIGN AID CAUSES PROBLEMS <0.5% WOMEN'S RIGHTS <0.5% TERRORISM <0.5% HEALTH-CARE PROBLEMS <0.5% WESTERN INFLUENCE IS TOO GREAT <0.5% HIGH POLLUTION LEVELS <0.5% INTERFERENCE OF FOREIGNERS IN COUNTRY'S MILITARY MATTERS <0.5% APPENDIX 3: INTERVIEW QUESTIONNAIRE 205
216 WORK IS NOT GIVEN TO APPROPRIATE PEOPLE <0.5% DISARMAMENT DIDN'T TAKE PLACE <0.5% LACK OF MANUFACTURING FACTORIES <0.5% MAFIA IS IN POWER <0.5% TRANSPORTATION PROBLEMS <0.5% PAKISTAN'S ROCKET ATTACKS ON AFGHANISTAN <0.5% THE GOVERNMENT IS SUPPORTING TALIBAN AND AL-QAEDA <0.5% LACK OF SHELTER <0.5% LACK OF FREEDOM OF SPEECH <0.5% WEAK PARLIAMENT <0.5% PLACING BOMBS ON THE ROADS <0.5% LACK OF ATTENTION TO AGRICULTURE <0.5% SIGNING STRATEGIC AGREEMENT <0.5% LACK OF ROADS <0.5% WEAK ANA AND ANP <0.5% LACK OF FOOD FOR PEOPLE <0.5% INCREASE IN POPPY CULTIVATION <0.5% THEFT <0.5% POISONING SCHOOL CHILDREN <0.5% POLITICAL RESISTANCE <0.5% EXITING OF FOREIGNERS <0.5% FRAUD IN ELECTION <0.5% TWO-FACED POLITICS <0.5% NOTHING <0.5% COMING OF GULBUDDIN HEKMATYAR <0.5% REFUSED <0.5% LACK OF PROFESSIONAL DOCTORS <0.5% TOO MUCH LUXURY <0.5% DISRESPECTING ISLAMIC VALUES <0.5% AMERICANS BLOCKING ROADS <0.5% BONN AGREEMENT <0.5% U.S. ARBITRARY ATTACKS <0.5% KILLING ANA/ANP <0.5% LACK OF MILITARY EQUIPMENT <0.5% VIOLENCE AGAINST WOMEN <0.5% MORAL CORRUPTION <0.5% INEXPERIENCED PRESIDENT HAS BEEN ELECTED <0.5% MISUSING THE POWER <0.5% EXISTENCE OF HEZB-E ISLAMI <0.5% DRUG ADDICTS ARE INCREASING <0.5% AFGHANISTAN IS NOT INDEPENDENT <0.5% DISPUTES BETWEEN TWO CANDIDATES <0.5% IMMORAL PROGRAMS IN TV <0.5% RAPE/SEXUAL HARASSMENT <0.5% PRESENCE OF FOREIGNERS <0.5% LACK OF COMMUNICATION SYSTEM <0.5% RETAINING WALLS <0.5% COUNTRY IS MOVING TOWARDS CHAOS <0.5% LACK OF RESPECT FOR HUMAN RIGHTS <0.5% 206 AFGHANISTAN IN 2017
217 CANDIDATES PROTESTING <0.5% RELEASING TALIBAN FROM PRISON <0.5% LACK OF RESPECT FOR ISLAM <0.5% Q-4. (Ask all) In your view, what is going well in your local area? (Write down answers; allow up to two mentions) Q4a. First Mention Q4b. Second Mention BASE: ALL RESPONDENTS (9,086) PERCENT OF CASES DON'T KNOW 33% DEVELOPMENT OF EDUCATION 20% NOTHING 19% DEVELOPMENT IN AGRICULTURE/IRRIGATION/ LIVESTOCK 19% GOOD SECURITY 14% BUILDING ROADS AND BRIDGES 11% DEVELOPMENT OF COUNTRY 10% UNITY AMONG PEOPLE 7% AVAILABILITY OF DRINKING WATER 5% BUILDING WATER DAMNS 5% BUILDING CLINICS 5% AVAILABILITY OF JOBS 4% BUILDING MOSQUES 3% IMPLEMENTATION OF LAW AND ORDER 2% BETTER ECONOMY 2% TRADING AND BUSINESS IMPROVEMENT 1% PEOPLE'S SUPPORT FOR ANP 1% FIGHT AGAINST NARCOTICS 1% CLEANER ENVIRONMENT 1% FIGHTING CORRUPTION 1% AVAILABILITY OF VOCATIONAL TRAININGS 1% ESTABLISHMENT OF PEOPLE'S COUNCIL 1% REFUSED 1% FIGHTING AGAINST CRIMINALS 1% PUBLIC SERVICES 1% FIGHTING AGAINST AGE 1% HAVING STRONG ANDSF 1% WOMEN'S/HUMAN RIGHTS ARE GIVEN 1% ESTABLISHMENT/PRESENCE OF DEVELOPMENT COUNCIL <0.5% RELIGION <0.5% CREATING NATIONAL SOLIDARITY PROGRAM <0.5% CONSTRUCTING SEWERAGE SYSTEM <0.5% DEVELOPMENT IN TELECOMMUNICATION <0.5% CREATING GOVERNMENT COURTS <0.5% CULTURE AND TRADITION <0.5% AVAILABILITY OF TRANSPORTATION <0.5% ANTI-FLOOD WALLS ARE BUILT <0.5% PEACE <0.5% APPENDIX 3: INTERVIEW QUESTIONNAIRE 207
218 CONTROL ON HIGH PRICES <0.5% ESTABLISHING FACTORIES <0.5% RETURN OF REFUGEES <0.5% NO TALIBAN <0.5% ELECTIONS <0.5% DISTRICT GOVERNMENT <0.5% GOOD RELATIONS BETWEEN THE GOVERNMENT AND PEOPLE <0.5% GIVING THE RIGHT JOB TO THE RIGHT PERSON <0.5% FREEDOM OF SPEECH <0.5% STRONG GOVERNMENT <0.5% INTERNATIONAL AID <0.5% ADMINISTRATIVE REFORM <0.5% PROTECTING THE RESOURCES <0.5% PRESENCE OF CIVIL SOCIETY ORGANIZATIONS <0.5% TRAINING OF ANDSF <0.5% MEDIA <0.5% DISARMING OF PEOPLE <0.5% PROFESSIONAL DOCTORS <0.5% ISLAMIC PARTY JOINED THE PEACE PROCESS <0.5% YOUTH JOINING ANP <0.5% NEW NATIONAL ID CARDS <0.5% FIGHTING TALIBAN <0.5% TRAINING OF AIR FORCE <0.5% NO DAESH <0.5% EXISTENCE/PRESENCE OF FOREIGNERS <0.5% Q-5. (Ask all) In your view what are the biggest problems in your local area? (Write down answers; allow up to two mentions) Q5a. First Mention Q5b. Second Mention BASE: ALL RESPONDENTS (9,086) PERCENT OF CASES UNEMPLOYMENT 31% INSECURITY/ATTACKS/VIOLENCE 24% ELECTRICITY 22% DRINKING WATER 18% ROADS 14% DON'T KNOW 13% EDUCATION/SCHOOLS/LITERACY 9% HEALTH CARE/CLINICS/HOSPITALS 9% POOR ECONOMY 7% HIGH PRICES 6% CORRUPTION 5% POVERTY 4% RECONSTRUCTION/REBUILDING 3% CRIME 3% TALIBAN 3% POLLUTION 3% 208 AFGHANISTAN IN 2017
219 ETHNIC PROBLEMS 2% DRUGS SMUGGLING 2% PRESENCE OF WARLORDS 2% WATER FOR IRRIGATION 2% INJUSTICE 2% GOVERNMENT/WEAK GOVERNMENT/CENTRAL AUTHORITY 1% ADDICTION TO DRUGS 1% NO PROBLEMS 1% LACK OF (PROPER) SHELTER 1% LACK OF AGRICULTURAL TOOLS/EQUIPMENT 1% TRANSPORTATION PROBLEMS 1% INNOCENT PEOPLE BEING KILLED 1% KIDNAPPING OF CHILDREN <0.5% LACK OF FOOD <0.5% THEFT <0.5% EXISTENCE OF ISIS/DAESH <0.5% LACK OF ANA AND ANP <0.5% WOMEN'S RIGHTS <0.5% NATURAL DISASTERS <0.5% DIKES AND DRAINS AGAINST FLOOD <0.5% SUICIDE ATTACKS <0.5% ROADSIDE BOMBS <0.5% FAMILY PROBLEMS <0.5% LACK OF PROFESSIONAL DOCTORS <0.5% MUNICIPALITIES NOT DOING THEIR JOB WELL <0.5% LACK OF VOCATIONAL TRAININGS <0.5% LACK OF UNITY <0.5% LACK OF MOSQUES <0.5% INTERFERENCE OF PAKISTAN <0.5% LACK OF LAW IMPLEMENTATION <0.5% LACK OF ENTERTAINMENT OPPORTUNITIES <0.5% PRESENCE OF FOREIGNERS <0.5% MORAL CORRUPTION <0.5% LACK OF MARKETS <0.5% RETURNEES' PROBLEMS <0.5% LACK OF PROFESSIONAL TEACHERS <0.5% LACK OF FACTORIES <0.5% LACK OF COMMUNICATION SYSTEM <0.5% REFUSED <0.5% DROUGHT <0.5% PEOPLE NOT FEELING RESPONSIBLE <0.5% HIGH DOWRY <0.5% RESTRICTIONS IN RIDING MOTORBIKES <0.5% LACK OF INDUSTRIAL PROJECTS <0.5% FORCED MARRIAGES <0.5% BAAD <0.5% LACK OF MADRASAS FOR WOMEN <0.5% EXISTENCE OF TERRORISM AND AL-QAEDA <0.5% LACK OF AGRICULTURE FARMS <0.5% LACK OF FOREIGN ASSISTANCE <0.5% APPENDIX 3: INTERVIEW QUESTIONNAIRE 209
220 PRESENCE OF FOREIGN FORCES/SEARCHING HOUSES <0.5% ARMED PEOPLE/WARLORDS <0.5% LACK OF PUBLIC WELFARE <0.5% CREATING STANDARD BATHROOMS/WASHROOMS <0.5% NEGATIVE EFFECTS OF WESTERN TRADITION <0.5% GOVERNOR MISAPPROPRIATING LANDS <0.5% POLLUTION IN SOCIETY <0.5% LACK OF KINDERGARTEN <0.5% PEOPLE'S REPRESENTATIVE CANNOT SOLVE THE PROBLEMS <0.5% TOO MUCH FREEDOM <0.5% GAS <0.5% INTERFERENCE OF IRAN <0.5% LACK OF INDUSTRIAL PARKS <0.5% PERSONAL ENMITY BETWEEN PEOPLE <0.5% LACK OF MASTER PLAN FOR CONSTRUCTION <0.5% DISRESPECT FOR ISLAMIC VALUES <0.5% EXPLORATION OF MINES <0.5% INCREASE IN POPPY CULTIVATION <0.5% LACK OF FUELS <0.5% INCREASE IN POPULATION <0.5% LACK OF EQUIPMENT FOR ANDSF <0.5% ARBAKIS (ARMED GROUPS SUPPORTED BY THE GOVERNMENT) <0.5% THE WEDDING HALLS ARE CREATING DISTURBANCE <0.5% BAD/CORRUPT GOVERNOR <0.5% AOG TAKES MONEY FROM PEOPLE <0.5% MEN TEASING WOMEN ON STREETS <0.5% AERIAL BOMBING <0.5% UNEMPLOYED PEOPLE <0.5% LACK OF BAKERIES <0.5% COUNCIL DIRECTOR WORKS FOR HIS PERSONAL PROFIT <0.5% ANDSF MISTREATING PEOPLE <0.5% INTERFERENCE OF FOREIGN COUNTRIES <0.5% LACK OF HELP FOR WIDOWS <0.5% LACK OF TRADE ROUTES <0.5% SETTING SCHOOLS ON FIRE <0.5% Q-6. (Ask all) In your view, what are the two biggest problems facing youth in your area? By youth, I mean people between the ages of 15 and 24. What is the next biggest problem? Q6a. First Mention Q6b. Second Mention BASE: ALL RESPONDENTS (9,086) PERCENT OF CASES UNEMPLOYMENT 71% ILLITERACY 32% DON'T KNOW 18% BECOMING DRUG ADDICTS 17% POOR ECONOMY 15% INSECURITY 8% NO HIGHER EDUCATION OPPORTUNITIES FOR YOUTH 5% 210 AFGHANISTAN IN 2017
221 LACK OF SCHOOLS 4% COSTLY MARRIAGES 3% ABANDONING COUNTRY 2% CORRUPTION 2% LACK OF SPORT FIELDS 2% LACK OF YOUTH'S RIGHTS 1% INVOLVEMENT IN CRIMES 1% TAKING REFUGE IN IRAN 1% CAMPAIGN AMONG YOUTH FOR TALIBAN ENROLLMENT 1% TRIBAL PROBLEMS 1% HIGH COST OF LIVING 1% INJUSTICE 1% LACK OF VOCATIONAL TRAININGS 1% FAMILY PROBLEMS 1% LACK OF GOVERNMENT ASSISTANCE 1% NO PROBLEM 1% MORAL CORRUPTION 1% LACK OF PROFESSIONAL TEACHERS 1% LACK OF HEALTH CARE 1% FORCED MARRIAGES <0.5% THEY DON'T HAVE A CLEAR FUTURE <0.5% JOINING AGE DUE TO UNEMPLOYMENT <0.5% CHANGING THEIR IDEOLOGY FOR WAR <0.5% LACK OF SHELTER <0.5% YOUTH ARE INVOLVED IN SUICIDE ATTACKS <0.5% LACK OF RECONSTRUCTION <0.5% TRANSPORTATION PROBLEMS <0.5% KILLING THE YOUTH <0.5% KIDNAPPING <0.5% LACK OF ELECTRICITY <0.5% LACK OF FACTORIES <0.5% LACK OF INFORMATION/INTEREST TO ISLAM <0.5% DISTURBANCE FROM POLICE <0.5% LACK OF EDUCATIONAL MATERIAL <0.5% LACK OF DRINKING WATER <0.5% LACK OF INTERNATIONAL SCHOLARSHIPS <0.5% REFUSED <0.5% LACK OF MADRASA <0.5% SEXUAL ASSAULTS ON YOUTH <0.5% WEAK PARLIAMENT <0.5% MISUSE OF YOUTH IN POLITICS <0.5% LACK OF ATTENTION TO AGRICULTURE <0.5% PHYSIOLOGICAL AND MENTAL DISORDER <0.5% INTERFERENCE OF NEIGHBORING COUNTRIES <0.5% LACK OF ACCESS TO INTERNET <0.5% JOINING THE LOCAL COMMANDERS <0.5% LACK OF FREEDOM OF MOVEMENT <0.5% PERSONAL ENMITY <0.5% YOUTHS RECRUITED BY ISIS/DAESH <0.5% LACK OF YOUTH COUNCIL <0.5% APPENDIX 3: INTERVIEW QUESTIONNAIRE 211
222 Q-7. (Ask all) What, if anything, is the biggest problem facing women in this area today? What is the next biggest problem? Q-7a. First mention: Q-7b. Second mention: BASE: ALL RESPONDENTS (9,086) PERCENT OF CASES EDUCATION/ILLITERACY 36% LACK OF JOB OPPORTUNITIES FOR WOMEN 23% DON'T KNOW 23% LACK OF RIGHTS/WOMEN'S RIGHTS 19% DOMESTIC VIOLENCE 18% FORCED MARRIAGES/ DOWRY 12% POVERTY 8% NO HOSPITALS/CLINICS 8% LACK OF PROFESSIONAL COURSES 7% NOTHING 5% SECURITY 5% BAAD 4% GENERAL HEALTH CARE 3% LACK OF PROFESSIONAL DOCTORS 2% UNDER CONTROL OF MEN/MEN HAVE POWER 2% LACK OF SCHOOLS FOR GIRLS 2% PREGNANCY-RELATED HEALTH CARE 2% CAN'T LEAVE HOMES 1% BADDAL 1% LACK OF MARKETS FOR CRAFTS 1% INJUSTICE 1% DISTURBANCE TO WOMEN 1% LACK OF SHELTER 1% NOT GIVING PART OF THE INHERITANCE 1% LACK OF ELECTRICITY AND WATER 1% LACK OF OPPORTUNITIES FOR WOMEN <0.5% CORRUPTION <0.5% LACK OF PARKS FOR WOMEN <0.5% REFUSED <0.5% GOVERNMENT NOT PAYING ATTENTION TO WOMEN <0.5% ETHNIC PROBLEMS <0.5% DISTURBANCE CREATED BY ISIS/DAESH <0.5% LACK OF BAKERIES FOR WOMEN <0.5% NOT GIVING THE PART IN HERITAGE <0.5% LACK OF CONSTRUCTION <0.5% TRANSPORTATION PROBLEMS <0.5% FREEDOM AND DEMOCRACY <0.5% CULTURAL PROBLEMS <0.5% RAPES <0.5% LACK OF AGRICULTURE/FARMS <0.5% CRIMES <0.5% DRUG ADDICTION <0.5% RELIGIOUS EDUCTION NOT AVAILABLE <0.5% 212 AFGHANISTAN IN 2017
223 LACK OF FACTORIES <0.5% HIGH PRICES <0.5% MURDER OF LITERATE WOMEN <0.5% PROBLEMS IN GENERAL <0.5% BIAS <0.5% REPRESENTATION IN SHURA/JIRGA <0.5% LACK OF RESPECT TOWARDS WOMEN <0.5% PRESENCE OF TALIBAN <0.5% NOT ALLOWING WOMEN TO VOTE <0.5% FORCING WOMEN TO WORK <0.5% LACK OF BAKERIES IN GENERAL <0.5% DIVORCE <0.5% LACK OF SALONS FOR RELIGIOUS PRACTICES <0.5% TRANSPORTATION PROBLEMS <0.5% LACK OF COURTS FOR WOMEN <0.5% MATERNAL MORTALITY <0.5% PSYCHOLOGICAL PROBLEMS <0.5% ROADSIDE MINES <0.5% DISCRIMINATION BETWEEN BOYS AND GIRLS <0.5% SHARIA LAWS <0.5% KIDNAPPING OF WOMEN <0.5% SELLING WOMEN/GIRLS FOR MONEY <0.5% SUICIDE <0.5% NOT HAVING HIJAB <0.5% LACK OF FOOD <0.5% LACK OF FEMALE POLICE <0.5% RUNNING AWAY FROM HOME <0.5% HEALTH CHECK-UPS <0.5% LACK OF PUBLIC BATHS <0.5% LACK OF WOMEN'S PARTICIPATION IN POLITICS <0.5% LACK OF FOREIGN AID <0.5% LACK OF ORGANIZATIONS WORKING FOR WOMEN <0.5% LACK OF KINDERGARTENS <0.5% LACK OF FREEDOM OF MOVEMENT <0.5% LACK OF ATTENTIONS <0.5% SERVICES AND HEALTH Q-8. Compared to one year ago, would you say that the situation for your household has gotten better, remained the same or gotten worse with respect to the following? BASE: ALL RESPONDENTS (9,086) BETTER THE SAME WORSE REFUSED DON'T KNOW A) FINANCIAL SITUATION OF YOUR HOUSEHOLD 20% 46% 33% <0.5% <0.5% B) EMPLOYMENT OPPORTUNITIES 8% 34% 58% <0.5% <0.5% C) AVAILABILITY OF PRODUCTS IN THE MARKET 12% 51% 36% <0.5% 1% D) QUALITY OF FOOD IN YOUR DIET 17% 53% 29% <0.5% <0.5% E) PHYSICAL CONDITIONS OF YOUR HOUSE/DWELLING 15% 56% 29% <0.5% 1% F) HEALTH/WELL-BEING OF YOUR FAMILY MEMBERS 20% 51% 29% <0.5% <0.5% G) ELECTRICITY SUPPLY 12% 43% 43% <0.5% 2% H) ACCESS TO SCHOOLS 22% 53% 24% <0.5% <0.5% APPENDIX 3: INTERVIEW QUESTIONNAIRE 213
224 Q-9. I am going to read a list of projects that may or may not have been implemented in your area. Please tell me if there has been this type of project in your area in the last 12 months. BASE: ALL RESPONDENTS (9,086) YES NO REFUSED DON'T KNOW A) RECONSTRUCTION/ BUILDING OF ROADS OR BRIDGES 34% 65% <0.5% 1% B) NEW GOVERNMENT SCHOOL OPENING 18% 82% <0.5% 1% C) NEW PRIVATE SCHOOL OPENING 16% 83% <0.5% 1% D) NEW PRIVATE UNIVERSITY 9% 90% <0.5% 1% E) DRINKING WATER PROJECT (E.G., NEW WELLS, HAND PUMPS, TANK SYSTEM, RESERVOIR 25% 75% <0.5% 1% F) IRRIGATION PROJECT 17% 82% <0.5% 1% G) GOVERNMENT-SUPPLIED ELECTRICITY 16% 82% <0.5% 1% H) HEALTH-CARE (PRIMARY HEALTH CENTER, REGULAR VISITS OF DOCTORS, ETC.) 22% 77% <0.5% 1% I) RECONCILIATION WITH ANTI-GOVERNMENT ELEMENTS 8% 89% <0.5% 2% J) PROGRAMS IN AGRICULTURE 20% 79% <0.5% 1% K) NEW FACTORIES OPENED 5% 94% <0.5% 1% L) BUILDING NEW MOSQUES 30% 69% <0.5% 1% SECURITY Q-11. There are many security forces in the country. Which of these groups would you say is most responsible for providing security in your village/gozar? (Read out options, show respondent card) BASE : ALL RESPONDENTS 9,086 NATIONAL ARMY 21% LOCAL POLICE 21% NATIONAL POLICE 55% ARMED OPPOSITION GROUPS 2% FOREIGN ARMIES <0.5% REFUSED <0.5% DON'T KNOW 1% Q-12. Compared with last year, do you think the [Insert Item]are getting better at providing security getting better, getting worse, or is there no difference? BASE: ALL RESPONDENTS (9,086) GETTING BETTER GETTING WORSE NO DIFFERENCE REFUSED DON'T KNOW A) ANA 58% 18% 24% <0.5% 1% B) ANP 48% 23% 28% <0.5% 1% C) ALP 30% 28% 33% 1% 9% Q-13. Now, please tell me if you think that the following need foreign support to do their job properly at the moment? Do you strongly agree, somewhat agree, somewhat disagree, or strongly disagree? BASE: ALL RESPONDENTS (9,086) STRONGLY AGREE SOMEWHAT AGREE SOMEWHAT DISAGREE STRONGLY DISAGREE REFUSED DON'T KNOW A) AFGHAN NATIONAL ARMY 50% 36% 9% 4% <0.5% 1% B) AFGHAN NATIONAL POLICE 44% 41% 10% 4% <0.5% 1% C) AFGHAN LOCAL POLICE 33% 33% 17% 11% <0.5% 7% 214 AFGHANISTAN IN 2017
225 Q-14. I m going to read some statements to you about the Afghan National Army (ANA). Please tell me if you agree or disagree with each statement. (Read out statement, wait for response and then ask): Would you say strongly or somewhat? BASE: ALL RESPONDENTS (9,086) STRONGLY AGREE SOMEWHAT AGREE SOMEWHAT DISAGREE STRONGLY DISAGREE REFUSED DON'T KNOW A) THE ANA IS HONEST AND FAIR WITH THE AFGHAN PEOPLE 60% 33% 5% 1% <0.5% 1% B) THE ANA HELPS IMPROVE SECURITY IN AFGHANISTAN 54% 34% 10% 2% <0.5% <0.5% C) THE ANA PROTECTS CIVILIANS 52% 35% 10% 3% <0.5% <0.5% Q-15. I m going to read some statements to you about Afghan National Police (ANP). ANP officers are the ones who wear solid blue-grey colored uniforms. Please tell me if you agree or disagree with each statement. (Read out statement, wait for response and then ask): Would you say strongly or somewhat? BASE: ALL RESPONDENTS (9,086) A) ANP IS HONEST AND FAIR WITH THE AFGHAN PEOPLE B) ANP HELPS IMPROVE SECURITY IN AFGHANISTAN C) ANP IS EFFICIENT AT ARRESTING THOSE WHO HAVE COMMITTED CRIMES STRONGLY AGREE SOMEWHAT AGREE SOMEWHAT DISAGREE STRONGLY DISAGREE REFUSED DON'T KNOW 44% 41% 11% 3% <0.5% <0.5% 39% 44% 13% 3% <0.5% <0.5% 35% 41% 17% 6% <0.5% <0.5% Q-16a. Would you agree or disagree with a family member s decision to join the Afghan National Police? BASE: ALL RESPONDENTS 9,086 AGREE 72% DISAGREE 26% REFUSED 1% DON'T KNOW 1% Q-16b. (Ask if answered No or don't know to Q-16a) Why would you disagree with their decision? Q16ba. First Mention: Q16bb. Second Mention: BASE: RESPONDENTS WHO DISAGREE PERCENT OF CASES DON'T KNOW 31% THE DEATH TOLL IS HIGH 31% LACK GOOD LEADERSHP/GOVERNMENT 20% INSECURITY 17% FEAR OF TALIBAN/AL-QAEDA 15% LOW SALARY 14% THEY ARE CORRUPT 12% IT'S A HARD JOB 9% THE FAMILY DOESN'T ALLOW 6% CONDITIONS ARE NOT GOOD 5% NOT INTERESTED 4% APPENDIX 3: INTERVIEW QUESTIONNAIRE 215
226 LACK OF EQUIPMENT FOR WOMEN 4% FEAR OF ENMITY 3% LACK OF RULE OF LAW 3% ALREADY HAVE A JOB 2% SUICIDE ATTACKS 2% LACK OF COORDINATION AMONG ANDSF 2% LACK OF RESPECT TOWARDS PEOPLE 2% THEY ARE ADDICTS 2% LACK OF TRAINING 1% REFUSED 1% EXISTENCE OF FOREIGNERS 1% EXISTENCE OF ISIS/DAESH 1% NO REASON 1% THEY ARE THIEVES <0.5% THEY SHOULD CONTINUE THEIR EDUCATION <0.5% THEY ARE BRUTAL <0.5% UNCERTAIN FUTURE <0.5% THEY AREN'T PRESENT IN MY AREA <0.5% I DON'T WANT TROUBLE <0.5% DON'T NEED THE PAY <0.5% THEY ARE AGED <0.5% SCHOLARS DO NOT ALLOW <0.5% MALIK DOES NOT ALLOW <0.5% ROADSIDE BOMBS <0.5% IT'S NOT THE CUSTOM <0.5% Q-17. How often do you fear for your own personal safety or security or for that of your family these days? Would you say you always, often, sometimes, rarely, or never fear for you and your family s safety? BASE: ALL RESPONDENTS 9,086 ALWAYS 13% OFTEN 24% SOMETIMES 33% RARELY 17% NEVER 12% REFUSED <0.5% DON'T KNOW <0.5% Q-18. Have you heard of the group called ISIS/Islamic State/Daesh? BASE: ALL RESPONDENTS 9,086 YES 79% NO 20% REFUSED <0.5% DON'T KNOW <0.5% Q-19. (Ask if Yes at Q-18) In your view, does ISIS/Daesh currently pose a threat to the security of your district? BASE: HEARD ABOUT ISIS/DAESH 7,179 YES 48% 216 AFGHANISTAN IN 2017
227 NO 50% REFUSED <0.5% DON'T KNOW 2% Q-20. Have you or has anyone in your family suffered from violence or of some criminal act in the past year? BASE: ALL RESPONDENTS 9,086 YES 19% NO 81% REFUSED <0.5% DON'T KNOW <0.5% Q-21. (Ask if answered Yes in Q-20) If it is ok to ask, what kinds of violence or crimes did you or someone in your family experience in the past year? Q-21a. First Mention: Q-21b. Second Mention: BASE: EXPERIENCED VIOLENCE (1,684) PERCENT OF CASES PHYSICAL ATTACK OR BEATING 35% DON'T KNOW 26% LIVESTOCK STOLEN 21% RACKETEERING/EXTORTION 20% PICK-POCKETING 18% SUICIDE ATTACKS 16% BURGLARY/LOOTING 13% MURDER 11% KIDNAPPING 10% MOTOR VEHICLE THEFT/PROPERTY TAKEN FROM YOUR VEHICLE OR PARTS OF THE VEHICLE 7% MILITANTS/INSURGENT ACTIONS 6% SMUGGLING 5% POLICE ACTIONS 5% FOREIGN FORCES ACTIONS (NIGHT RAIDS, DRONE ATTACKS, ETC.) 3% SEXUAL VIOLENCE 2% ARMY ACTIONS 2% REFUSED <0.5% FIGHTING BETWEEN TALIBAN AND GOVERNMENT FORCES <0.5% ETHNIC CONFLICT <0.5% Q-22. (Ask if answered Yes in Q-20) Were the crimes or violent acts reported to anybody outside your family or not? BASE: EXPERIENCED VIOLENCE 1,684 YES 62% NO 35% REFUSED 0% DON'T KNOW 2% APPENDIX 3: INTERVIEW QUESTIONNAIRE 217
228 Q-23. (Ask if answered Yes in Q-22) Who did you report the crime to? Anyone else? Q-23a. First Mention: Q-23b. Second Mention: BASE: EXPERIENCED VIOLENCE (1,684) PERCENT OF CASES AFGHAN NATIONAL POLICE 51% SHURA/ELDERS 35% TRIBAL LEADER/MALIK 23% AFGHAN NATIONAL ARMY 18% DON'T KNOW 16% DISTRICT GOVERNOR/WOLESWAL 15% MULLAH SAHEB 12% PROVINCIAL AUTHORITY 9% JUST MY FAMILY 6% COURTS 4% PUBLIC PROSECUTOR 3% CENTRAL GOVERNMENT 2% LOCAL MILITIA (ARBAKAI) 2% TALIBAN 2% PRESS OR OTHER MEDIA 1% LOCAL COMMANDER OR WARLORD 1% AFGHANISTAN INDEPENDENT HUMAN RIGHTS COMMISSION <0.5% NATIONAL SECURITY FORCES <0.5% OFFICE OF UN ORGANIZATION(S) <0.5% TRAFFIC OFFICER <0.5% LOCAL PROVINCIAL RECONSTRUCTION TEAM (PRT) <0.5% Q-24. (Ask all) If you were a victim of violence or any criminal act, how much confidence would you have that the governmental law-enforcing organizations and judicial systems would punish the guilty party? BASE: ALL RESPONDENTS 9,086 A GREAT DEAL OF CONFIDENCE 10% A FAIR AMOUNT 40% NOT VERY MUCH 32% NO CONFIDENCE AT ALL 17% REFUSED <0.5% DON'T KNOW 1% JUSTICE Q-25. Please tell me how much you agree or disagree with each of these statements. BASE: ALL RESPONDENTS (9,086) A. PRISONS SHOULD EDUCATE PRISONERS B. PRISONS SHOULD DISCOURAGE PEOPLE FROM COMMITTING CRIMES STRONGLY AGREE SOMEWHAT AGREE SOMEWHAT DISAGREE STRONGLY DISAGREE REFUSED DON'T KNOW 32% 23% 10% 7% 12% 21% 29% 24% 17% 9% 8% 15% 218 AFGHANISTAN IN 2017
229 C. PRISONS SHOULD REMOVE BAD PEOPLE FROM SOCIETY AND KEEP THEM ISOLATED D. PRISONS SHOULD BE PUNISHING AND DIFFICULT, BECAUSE CRIMINALS DESERVE TO SUFFER 23% 29% 27% 19% 48% 24% 17% 24% 47% 65% 32% 39% Q-26. If someone in your community has a debt and cannot pay it, how would your community discipline them, if at all? Q-26a. First mention: Q-26b. Second mention: BASE: ALL RESPONDENTS (9,086) PERCENT OF CASES DON'T KNOW 57% FEEL SYMPATHY AND OFFER ASSISTANCE 56% DO NOTHING/TAKE NO ACTION 25% COMPLAIN TO THE GOVERNMENT 9% WON'T LEND HIM MONEY ANYMORE 8% BEAT HIM 7% THREATEN HIM 5% WILL TAKE HIS/THEIR LANDS 2% CALL HIM POOR 1% HE SHOULD GIVE HIS DAUGHTER TO SETTLE THE DEBT 1% REFUSED <0.5% Q-27. If someone in your community harasses a girl or woman, how would your community discipline them, if at all? Q-27a. First mention: Q-27b. Second mention: BASE: ALL RESPONDENTS (9,086) PERCENT OF CASES INFORM THE POLICE/GOVERNMENT 36% DON'T KNOW 34% PUNISH HIM 28% TREAT HIM BADLY 25% COMPLAIN TO THE ELDERS 19% MAKE PEACE 14% DO NOTHING/TAKE NO ACTION 11% LEAVE THE AREA 7% INFORM HIS PARENTS 4% WARN HIM 3% PREVENT SUCH ACTIONS 3% REPORT TO THE WOMEN'S RIGHTS DIRECTORATE 3% REFUSED 1% MARRY HIM TO THE GIRL <0.5% INFORM THE TALIBAN <0.5% APPENDIX 3: INTERVIEW QUESTIONNAIRE 219
230 Q-28. (Ask all) Within the last year, have you or anyone you know been represented by a defense lawyer in a criminal case? BASE : ALL RESPONDENTS 9,086 YES 19% NO 80% REFUSED <0.5% DON'T KNOW 1% Q-29. (Ask if Yes in Q-28) Did you or the person you know pay for those services? BASE : REPRESENTED BY A LAWYER YES 61% NO 37% REFUSED <0.5% DON'T KNOW 2% Q-30. Do you think a person arrested for a crime should have a right to a lawyer, even if they are guilty? BASE : ALL RESPONDENTS 9,086 YES 81% NO 16% REFUSED <0.5% DON'T KNOW 2% Q-31. If you were ever arrested, which of these types of lawyers would you trust to fight for your rights? You can say yes to more than one. BASE: ALL RESPONDENTS (9,086) YES NO REFUSED DON'T KNOW A. A DEFENSE LAWYER EMPLOYED BY THE GOVERNMENT 62% 37% <0.5% 1% B. A DEFENSE LAWYER EMPLOYED BY AN INTERNATIONAL ORGANIZATION 40% 58% <0.5% 1% C.A DEFENSE LAWYER EMPLOYED BY A CIVIL SOCIETY ORGANIZATION 50% 48% <0.5% 1% D. AN INDEPENDENT LAWYER NOT EMPLOYED BE EITHER THE GOVERNMENT OR AN ORGANIZATION 59% 39% <0.5% 2% Q-32. How satisfied or dissatisfied are you with the available dispute resolution services in your area? Are you very satisfied, somewhat satisfied, somewhat dissatisfied, very dissatisfied? BASE: ALL RESPONDENTS 9,086 VERY SATISFIED 14% SOMEWHAT SATISFIED 51% SOMEWHAT DISSATISFIED 25% VERY DISSATISFIED 8% REFUSED <0.5% DON'T KNOW 2% 220 AFGHANISTAN IN 2017
231 Q-33. In the past two years have you had a dispute or a formal case that you couldn t settle with the other party and had to go to the Huquq Department or village/neighborhood-based shura/jirga to resolve it, or not? BASE: ALL RESPONDENTS 9,086 YES 20% NO 79% REFUSED <0.5% DON'T KNOW <0.5% Q-34. (Ask if answered Yes in Q-33) What kind of a case or dispute was it? (Single Response. If more than one case or dispute, ask for the most recent one.) BASE: HAD DISPUTE OR FORMAL CASE 1,854 DISPUTE OVER LAND 46% OTHER PROPERTY DISPUTE, NOT LAND 11% COMMERCIAL DISPUTE 9% DIVORCE 4% FAMILY PROBLEMS 20% TRAFFIC ACCIDENT 8% PICK-POCKETING <0.5% ROBBERY/BURGLARY <0.5% PHYSICAL ASSAULT <0.5% MURDER <0.5% DRUG SMUGGLING <0.5% DISPUTE OVER WATER <0.5% RECONSTRUCTION PROBLEMS <0.5% GOVERNMENT SERVICES <0.5% DISPUTE OVER INHERITANCE <0.5% PHYSICAL ABUSE/BEATING <0.5% FIGHT BETWEEN DIFFERENT GROUPS <0.5% WORK DISPUTE <0.5% KIDNAPPING <0.5% NATURAL DISASTER-RELATED <0.5% OTHER <0.5% REFUSED <0.5% DON'T KNOW <0.5% Q-35. (Ask if answered Yes in Q-33) Were you fully satisfied, somewhat satisfied, or not satisfied with the outcome of the proceedings? BASE: HAD DISPUTE OR FORMAL CASE 1,854 FULLY SATISFIED 22% SOMEWHAT SATISFIED 53% NOT SATISFIED 24% REFUSED <0.5% DON'T KNOW 1% Q-36. (Ask if answered Yes in Q-33) Where have you taken this case or dispute? BASE: HAD DISPUTE OR FORMAL CASE 1,854 HUQUQ DEPARTMENT 23% APPENDIX 3: INTERVIEW QUESTIONNAIRE 221
232 STATE COURT 39% VILLAGE, NEIGHBORHOOD-BASED SHURA/ JIRGA Q-37. (Ask if 1 Huquq Department in Q-36) And now let s turn to the local Huquq Department. Tell me do you strongly agree, somewhat agree, somewhat disagree, or strongly disagree with the following statements about the Huquq Department? 43% BASE: REFERED A CASE TO HUQUQ DEPARTMENT (433) A) LOCAL HUQUQ ARE FAIR AND TRUSTED B) LOCAL HUQUQ FOLLOW THE LOCAL NORMS AND VALUES OF OUR PEOPLE C) LOCAL HUQUQ ARE EFFECTIVE AT DELIVERING JUSTICE D) LOCAL HUQUQ RESOLVE CASES QUICKLY AND EFFICIENTLY STRONGLY AGREE SOMEWHAT AGREE SOMEWHAT DISAGREE STRONGLY DISAGREE REFUSED DON'T KNOW 28% 46% 16% 8% <0.5% 2% 24% 36% 26% 11% <0.5% 2% 19% 45% 22% 12% <0.5% 2% 17% 36% 29% 17% <0.5% 2% Q-38. (Ask if 2 state courts in Q-36) Tell me, do you strongly agree, somewhat agree, somewhat disagree, or strongly disagree with the following statements about state courts? BASE : REFERED A CASE TO STATE COURT (731) A) STATE COURTS ARE FAIR AND TRUSTED B) STATE COURTS FOLLOW THE LOCAL NORMS AND VALUES OF OUR PEOPLE C) STATE COURTS ARE EFFECTIVE AT DELIVERING JUSTICE D) STATE COURTS RESOLVE CASES TIMELY AND PROMPTLY E) STATE COURTS TREAT MEN AND WOMEN EQUALLY STRONGLY AGREE AGREE SOMEWHAT DISAGREE SOMEWHAT STRONGLY DISAGREE REFUSED DON'T KNOW 23% 40% 21% 10% <0.5% 6% 19% 36% 27% 11% <0.5% 6% 16% 35% 28% 14% <0.5% 7% 13% 28% 31% 22% <0.5% 6% 17% 34% 25% 17% <0.5% 7% Q-39. (Ask if 3 shura/jirga in Q-36) And now let s turn to village/neighborhood-based jirgas/shura, Tell me do you strongly agree, somewhat agree, somewhat disagree, or strongly disagree with the following statements about the village/neighborhood-based jirgas/shuras? BASE: REFERED A CASE TO SHURA/ JIRGA (801) A) LOCAL JIRGAS/SHURAS ARE FAIR AND TRUSTED B) LOCAL JIRGAS/SHURAS FOLLOW THE LOCAL NORMS AND VALUES OF OUR PEOPLE C) LOCAL JIRGAS/SHURAS ARE EFFECTIVE AT DELIVERING JUSTICE D) LOCAL JIRGAS/SHURAS RESOLVE CASES TIMELY AND PROMPTLY E) THERE SHOULD BE LOCAL WOMEN S JIRGAS AND SHURAS STRONGLY AGREE AGREE SOMEWHAT DISAGREE SOMEWHAT STRONGLY DISAGREE REFUSED DON'T KNOW 33% 49% 10% 3% <0.5% 5% 32% 45% 15% 2% <0.5% 5% 31% 43% 17% 3% <0.5% 6% 27% 42% 19% 7% <0.5% 6% 30% 36% 18% 10% <0.5% 5% 222 AFGHANISTAN IN 2017
233 CORRUPTION Q-40. Next I am going to list several different organizations or situations in which people have said they have experienced corruption in the past. Thinking back to your interactions in the past 12 months, please tell me how often you had to give money, a gift, or perform a favor for these organizations or in these situations? Was it in all cases, in most cases, in some cases, or in no cases? If you had no contact with the organization, please tell me so. BASE: ALL RESPONDENTS (9,086) IN ALL CASES IN MOST CASES IN SOME CASES IN NO CASES REFUSED DON'T KNOW MUNICIPALITY/DISTRICT GOVERNOR'S OFFICE 2% 7% 11% 78% 1% 1% CUSTOM OFFICES 1% 5% 8% 83% 1% 1% AFGHAN NATIONAL POLICE 2% 5% 7% 83% 1% 1% AFGHAN NATIONAL ARMY 1% 5% 9% 84% 1% 1% JUDICIARY/COURTS 1% 2% 3% 92% 1% 1% NATIONAL POWER COMPANY 2% 9% 13% 73% 1% 1% WHEN APPLYING FOR A JOB 1% 4% 8% 85% 1% 1% ADMISSION TO SCHOOL/UNIVERSITY 1% 6% 12% 80% 1% 1% HOSPITALS/CLINICS 2% 7% 9% 80% 1% 1% PROVINCIAL GOVERNAOR'S OFFICE 1% 3% 6% 89% 1% 1% Q-41. (If codes 1-3 at corresponding item in Q-40) What was the amount, or the equivalent value in cash, of the favor or gift you most recently had to pay for this service? If it was a gift or favor, please give your best estimate of its value. (Write amount or equivalent in Afs) BASE: THOSE WHO PAID BRIBE AVERAGE AMOUNT PAID FOR EACH ORGANIZATION (AFN) MAXIMUM AMOUNT PAID (AFN) OFFICIALS IN THE MUNICIPALITY/DISTRICT OFFICE PROVINCIAL GOVERNOR S OFFICE CUSTOMS OFFICE AFGHAN NATIONAL POLICE AFGHAN NATIONAL ARMY JUDICIARY/COURTS STATE ELECTRIC SUPPLY HOSPITALS/CLINICS WHEN APPLYING FOR A JOB ADMISSIONS TO SCHOOLS/UNIVERSITY Q-42. Please tell me whether you think corruption is a major problem, a minor problem, or no problem at all in the following areas. BASE: ALL RESPONDENTS (9,086) MAJOR PROBLEM MINOR PROBLEM NOT A PROBLEM REFUSED DON'T KNOW A) IN YOUR DAILY LIFE 70% 23% 7% <0.5% 1% B) IN AFGHANISTAN AS A WHOLE 84% 13% 2% <0.5% 0% APPENDIX 3: INTERVIEW QUESTIONNAIRE 223
234 POLITICAL PARTICIPATION Q-43. Some people say that politics and religion should be mixed. Other people say politics and religion should not mix. For example, some say religious scholars should only manage religion, and should not take part in politics. Which is closer to your view? BASE: ALL RESPONDENTS 9,086 RELIGIOUS LEADERS SHOULD NOT BE INVOLVED IN POLITICS 62% RELIGIOUS LEADERS SHOULD BE INVOLVED IN POLITICS 36% REFUSED <0.5% DON'T KNOW 3% Q-44. On the whole, how satisfied or dissatisfied are you with the way democracy works in Afghanistan. By democracy, we mean choosing the president and parliament by voting, rather than appointment or selection by some leaders. Are you very satisfied, somewhat satisfied, somewhat dissatisfied, or very dissatisfied? BASE : ALL RESPONDENTS 9,086 VERY SATISFIED 14% SOMEWHAT SATISFIED 43% SOMEWHAT DISSATISFIED 28% VERY DISSATISFIED 14% REFUSED <0.5% DON'T KNOW 1% Q-45. Please, tell me, how you would respond to the following activities or groups. Would you respond with no fear, some fear, or a lot of fear? BASE: ALL RESPONDENTS (9,086) NO FEAR SOME FEAR A LOT OF FEAR REFUSED DON'T KNOW VOTING IN A NATIONAL/PROVINCIAL ELECTION 48% 38% 13% <0.5% <0.5% PARTICIPATING IN A PEACEFUL DEMONSTRATION 26% 40% 31% <0.5% 1% RUNNING FOR PUBLIC OFFICE 24% 43% 29% 1% 3% ENCOUNTERING ANP 56% 31% 12% <0.5% 1% ENCOUNTERING ANA 60% 28% 12% <0.5% <0.5% TRAVELING FROM ONE PART OF AFGHANISTAN TO ANOTHER PART OF THE COUNTRY 19% 45% 35% <0.5% <0.5% ENCOUNTERING INTERNATIONAL FORCES (WESTERN MILITARY ONLY) 21% 42% 36% <0.5% 1% ENCOUNTERING THE TALIBAN 7% 20% 73% <0.5% <0.5% ENCOUNTERING ISIS/DAESH 4% 14% 80% <0.5% 2% Q-46. In some countries, people do not feel able to publicly criticize their government while in other countries they feel quite free to do so in public. Thinking back to a year ago, how safe did you feel expressing your opinions about the government in public? BASE: ALL RESPONDENTS 9086 VERY SAFE 11% SOMEWHAT SAFE 44% SOMEWHAT UNSAFE 33% 224 AFGHANISTAN IN 2017
235 VERY UNSAFE 10% REFUSED <0.5% DON'T KNOW 1% Q-47. How much influence do you think someone like you can have over local (District/Provincial) government decisions a lot, some, very little, or none at all? BASE: ALL RESPONDENTS 9,086 A LOT 8% SOME 41% VERY LITTLE 25% NONE AT ALL 25% REFUSED <0.5% DON'T KNOW 1% Q-48. In the last two years, has the member of parliament (MP) for your province ever been involved in helping to resolve a problem or issue (masala/masael) that affected you? BASE: ALL RESPONDENTS 9,086 YES 25% NO 73% REFUSED <0.5% DON'T KNOW 1% Q-49. In your opinion, which of the following does your member of Parliament care about most? BASE: ALL RESPONDENTS 9,086 NATIONAL ISSUES 10% PROVINCIAL ISSUES 18% DISTRICT OR MUNICIPALITY ISSUES 9% ETHNIC ISSUES 23% PERSONAL INTERESTS 37% REFUSED <0.5% DON'T KNOW 2% Q-50. Members of the parliament have various responsibilities. How would you rate their performance on each of the following duties? Would you say they are doing a very good job, a somewhat good job, somewhat bad job, or a very bad job? BASE: ALL RESPONDENTS (9,086) A) LISTENING TO CONSTITUENTS AND REPRESENTING THEIR NEEDS B) MAKING LAWS FOR THE GOOD OF THE COUNTRY C) MONITORING THE PRESIDENT AND HIS STAFF. VERY GOOD JOB SOMEWHAT GOOD JOB SOMEWHAT BAD JOB VERY BAD JOB REFUSED DON'T KNOW 17% 41% 23% 18% <0.5% 1% 16% 35% 30% 18% <0.5% 1% 13% 32% 29% 24% <0.5% 2% GOVERNANCE Q-51. I would like to ask you about some officials, institutions and organizations. As I read out each, please tell me how much confidence you have in them to do their jobs. Do you have a lot, some, not much, or no confidence at all? If you don t know, it s ok, just say you have no opinion. APPENDIX 3: INTERVIEW QUESTIONNAIRE 225
236 BASE: ALL RESPONDENTS (9,086) A LOT OF CONFIDENCE SOME CONFIDENCE NOT MUCH CONFIDENCE NO CONFIDENCE AT ALL REFUSED A) THE PRESIDENT (ASHRAF GHANI) 25% 31% 20% 22% <0.5% 1% DON'T KNOW B) THE CEO (DR. ABDULLAH ABDULLAH) 11% 29% 29% 29% <0.5% 1% C) INDEPENDENT ELECTION COMMISSION 9% 29% 34% 26% <0.5% 1% D) COMMUNITY DEVELOPMENT COUNCILS 18% 40% 27% 14% <0.5% 1% E) COMMUNITY SHURAS/JIRGAS 26% 39% 22% 11% <0.5% 1% F) GOVERNMENT MINISTERS 7% 29% 38% 24% <0.5% 2% G) INTERNATIONAL NGOS 10% 32% 34% 21% <0.5% 2% H) MEDIA SUCH AS NEWSPAPERS, RADIO, TV 28% 38% 22% 11% <0.5% 1% I) NATIONAL NGOS 11% 38% 33% 17% <0.5% 2% J) PARLIAMENT AS A WHOLE 8% 29% 34% 27% <0.5% 1% K) PROVINCIAL COUNCILS 13% 35% 31% 19% <0.5% 1% L) RELIGIOUS LEADERS 34% 33% 19% 13% <0.5% 1% M) YOUR MEMBER OF PARLIAMENT 7% 29% 35% 28% <0.5% 1% Q-52. Thinking of the different levels of government in Afghanistan, do you think that overall the [insert item], is doing a very good job, somewhat good job, somewhat bad job, or a very bad job? BASE : ALL RESPONDENTS (9,086) VERY GOOD JOB SOMEWHAT GOOD JOB SOMEWHAT BAD JOB VERY BAD JOB REFUSED DON'T KNOW A) NATIONAL UNITY GOVERNMENT 15% 41% 23% 20% <0.5% 1% B) PROVINCIAL GOVERNMENT 14% 43% 27% 14% <0.5% 2% C) MUNICIPAL AUTHORITIES (ASK URBAN RESIDENTS ONLY) 10% 38% 28% 21% <0.5% 4% D) DISTRICT GOVERNMENT (ASK RURAL RESIDENTS ONLY) 12% 44% 26% 9% <0.5% 9% RECONCILIATION Q-53. Do you think reconciliation between the Afghan government and the Taliban is possible or impossible? BASE: ALL RESPONDENTS 9,086 POSSIBLE 52% IMPOSSIBLE 42% REFUSED <0.5% DON'T KNOW 5% Q-54. In your opinion, what is the main reason why the Taliban is fighting against the Afghan government? BASE: ALL RESPONDENTS 9,086 TO GAIN POWER 30% THEY ARE SUPPORTED BY PAKISTAN 11% THEY ARE SUPPORTED/MOTIVATED BY FOREIGNERS 7% DON'T KNOW 7% PRESENCE OF FOREIGN TROOPS 6% 226 AFGHANISTAN IN 2017
237 TOO MUCH CORRUPTION IN THE GOVERNMENT 5% WANTS TO OCCUPY AFGHANISTAN 3% TO CREATE INSECURITY 3% TO FORCE FOREIGN FORCES TO WITHDRAW 3% THEY ARE DISSATISFIED WITH THE GOVERNMENT 2% FOR MONEY 2% TO SUPPORT ISLAM 2% THEY ARE AGAINST ISLAM 2% THEY ARE AGAINST DEMOCRACY 2% KILLING INNOCENT PEOPLE 2% TO DESTROY OUR COUNTRY 1% UNEMPLOYMENT/POVERTY 1% ETHNIC PROBLEMS 1% REFUSED 1% THEY ARE BRUTAL/CRUEL 1% LACK OF ATTENTION TO THEIR DESIRES 1% ILLITERACY 1% INJUSTICE 1% MORAL CORRUPTION <0.5% TO ESTABLISH SECURITY <0.5% FIGHTING IS THEIR WAY OF LIFE <0.5% THEY ARE NOT AFGHAN <0.5% GOVERNMENT/ANSF IS WEAK TO FIGHT THEM <0.5% FOR THEIR PERSONAL BENEFIT <0.5% THERE IS NO REASON <0.5% TO SUPPORT DRUG TRAFFIC <0.5% THEY IMPLEMENT LAW <0.5% EXTRACTING AFGHANISTAN'S MINERALS <0.5% THEY ARE AGAINST POLICE FORCES <0.5% THEY HAVE BEEN DECEIVED <0.5% VIOLENCE AGAINST WOMEN <0.5% TO DEFEND THE COUNTRY <0.5% THEY ARE TRAITORS <0.5% THEY ARE AFGHANS <0.5% CREATING FEAR/TERROR <0.5% THEY ARE AGAINST THE CONSTITUTION <0.5% SUPPORT OF IRAN <0.5% MISLED BY THEIR LEADERS <0.5% THEY ARE CORRUPT <0.5% THEY ARE STUPID/BARBARIAN <0.5% THEY ARE NOT AWARE OF ISLAMIC LAWS <0.5% FREEDOM <0.5% THEIR LEADERS FORCE THEM TO FIGHT <0.5% ISIS/DAESH <0.5% THEY ARE AGAINST WOMEN WORKING <0.5% DESTROYING SCHOOLS <0.5% THEY ARE AGAINST DEVELOPMENT <0.5% SUFFERING LOSSES BECAUSE OF INTERNATIONAL FORCES <0.5% INTERFERENCE OF RUSSIA <0.5% THEY ARE EXTREMISTS <0.5% APPENDIX 3: INTERVIEW QUESTIONNAIRE 227
238 ROBBERY <0.5% AVAILABILITY OF WEAPONS <0.5% PROTECT PEOPLE FROM CRUEL GOVERNMENT <0.5% FOR REVENGE <0.5% THEY CONSIDER CURRENT GOVERNMENT NON-ISIS/DAEH <0.5% INTERFERENCE OF HEZB-E ISLAMI <0.5% THEY HAVE THE GOVERNMENT'S SUPPORT <0.5% THEY ARE SUPPORTED BY HANIFULLAH <0.5% HIGH-PROFILE ASSASSINATION <0.5% THEY GET RELEASED AFTER BEING ARRESTED <0.5% THEY ARE AGAINST SHIA <0.5% THEY ARE AGAINST ELECTIONS <0.5% Q-55a. Thinking about the reasons why the Taliban have been fighting during the past year, in general, would you say that you have a lot of sympathy, a little sympathy or no sympathy at all for the Taliban? BASE: ALL RESPONDENTS 9,086 A LOT OF SYMPATHY 5% A LITTLE SYMPATHY 11% NO SYMPATHY AT ALL 80% REFUSED 1% DON'T KNOW 3% Q-55b. (Ask if answered A lot in Q-55a) You said that you have a lot of sympathy. Why do you say that? BASE: HAVE A LOT OF SYMPATHY WITH TALIBAN 440 THEY ARE AFGHANS 39% THEY ARE MUSLIM 21% DON'T WANT PEACE AND SECURITY 5% EARN MONEY THROUGH ISLAMIC WAYS 4% KILLING INNOCENT PEOPLE 3% HAVE A LOT OF SYMPATHY NO REASON 3% THEY ARE NOT AFGHANS 2% DON'T KNOW 2% IMPLEMENT CONSTITUTIONAL LAW 2% THEY ARE OPPRESSORS 2% THEY WORK FOR FOREIGNERS 2% THEY ARE GOOD PEOPLE 1% THEY ARE INFIDELS 1% DON'T HAVE ANY SYMPATHY 1% REMOVING MORAL CORRUPTION 1% THEY ARE AGAINST THE GOVERNMENT 1% THEY ARE ROBBERS 1% THEY ARE THE ENEMY OF AFGHANISTAN 1% I VALUE MY COUNTRYMEN 1% PEOPLE WANT PEACE 1% THEY WANT TO FIGHT A HOLY WAR (JIHAD) 1% THEY BRING PEACE 1% THEY WORK FOR PAKISTAN <0.5% 228 AFGHANISTAN IN 2017
239 THEY ARE ILLITERATE <0.5% WANT TO CREATE DISUNITY <0.5% THEY ARE BAD PEOPLE <0.5% THEY FIGHT AGAINST FOREIGN FORCES <0.5% THEY ARE OUR ENEMIES <0.5% THEY ARE AGAINST WOMEN EDUCATION <0.5% THEY ARE CRIMINALS <0.5% THEY HAVE BEEN DECEIVED <0.5% BECAUSE OF UNEMPLOYMENT <0.5% ELIMINATING WAR <0.5% THEY ARE MADE TO DO SO <0.5% THEY GET THEIR RIGHTS <0.5% ELDERS SUPPORT THEM <0.5% THEY DON'T WANT DEMOCRACY <0.5% THEY BRING INJUSTICE <0.5% Q-55c. (Ask if answered A little in Q-55a) You said that you have a little sympathy. Why do you say that? BASE: HAVE A LITTLE SYMPATHY WITH TALIBAN THEY ARE AFGHANS 39% THEY ARE MUSLIM 21% DON'T KNOW 5% KILLING INNOCENT PEOPLE 5% DON'T WANT PEACE AND SECURITY 4% THEY ARE OPPRESSORS 3% THEY ARE INFIDELS 2% THEY ARE NOT AFGHANS 2% IMPLEMENT CONSTITUTIONAL LAW 2% REMOVING MORAL CORRUPTION 2% THEY WORK FOR FOREIGNERS 1% THEY ARE AGAINST THE GOVERNMENT 1% THEY WORK FOR PAKISTAN 1% THEY ARE GOOD PEOPLE 1% THEY BRING PEACE 1% EARN MONEY THROUGH ISLAMIC WAYS 1% THEY ARE THE ENEMY OF AFGHANISTAN 1% THEY ARE ILLITERATE 1% I VALUE MY COUNTRYMEN 1% HAVE A LOT OF SYMPATHY 1% THEY ARE OUR ENEMIES 1% THEY ARE CRIMINALS 1% THEY FIGHT AGAINST FOREIGN FORCES 1% THE GOVERNMENT MISTREATS THE PEOPLE <0.5% ELIMINATING WAR <0.5% BECAUSE OF UNEMPLOYMENT <0.5% THEY GET THEIR RIGHTS <0.5% PEOPLE WANT PEACE <0.5% THEY ARE BAD PEOPLE <0.5% FOR COUNTRY'S DEVELOPMENT <0.5% 990 APPENDIX 3: INTERVIEW QUESTIONNAIRE 229
240 THEY BRING INJUSTICE <0.5% THEY ARE MADE TO DO SO <0.5% THEY ARE OUR RELATIVES <0.5% DON'T HAVE ANY SYMPATHY <0.5% FOR THEIR PERSONAL REASONS <0.5% WANT TO CREATE DISUNITY <0.5% THEY DON'T HAVE ANY PARTICULAR GOAL/ PURPOSE <0.5% THEY ARE BETTER THAN ISIS/DAESH <0.5% ISLAMIC LEADERS ARE USING THEM <0.5% THEY WANT TO FIGHT A HOLY WAR (JIHAD) <0.5% THEY RESOLVE OUR DISPUTES <0.5% THEY ARE AGAINST RECONSTRUCTION <0.5% THEY ARE SLAVES OF OTHER COUNTRIES <0.5% ISIS/DAESH IS A WORLDWIDE PROBLEM <0.5% SUICIDE ATTACKS <0.5% TO DAMAGE THE ECONOMY <0.5% ELDERS SUPPORT THEM <0.5% THEY ARE AGAINST EDUCATION SYSTEM <0.5% Q-55d. (Ask if Code 3, No sympathy in Q-55a) You said that you don t have any sympathy. Why do you say that? BASE: HAVE A NO SYMPATHY WITH TALIBAN 7,273 KILLING INNOCENT PEOPLE 30% THEY ARE OPPRESSORS 21% DON'T WANT PEACE AND SECURITY 8% THEY WORK FOR PAKISTAN 7% SUICIDE ATTACKS 3% THEY ARE THE ENEMY OF AFGHANISTAN 3% THEY ARE INFIDELS 3% THEY ARE OUR ENEMIES 2% DON'T KNOW 2% THEY ARE NOT AFGHANS 2% THEY ARE AGAINST THE GOVERNMENT 2% THEY WORK FOR FOREIGNERS 1% THEY BRING PEACE 1% EARN MONEY THROUGH ISLAMIC WAYS 1% THEY ARE AGAINST EDUCATION SYSTEM 1% DON'T HAVE ANY SYMPATHY 1% THEY ARE CRIMINALS 1% THEY ARE AGAINST RECONSTRUCTION 1% THEY ARE AGAINST WOMEN'S RIGHTS 1% THEY ARE OUR RELATIVES 1% THEY BRING INJUSTICE 1% THEY ARE AGAINST WOMEN EDUCATION 1% REFUSED <0.5% THEY ARE AFGHANS <0.5% DESTROYING ROADS AN BRIDGES <0.5% THEY ARE ILLITERATE <0.5% 230 AFGHANISTAN IN 2017
241 THEY ARE BAD PEOPLE <0.5% FOR THEIR PERSONAL REASONS <0.5% THE GOVERNMENT MISTREATS THE PEOPLE <0.5% REMOVING MORAL CORRUPTION <0.5% WANT TO CREATE DISUNITY <0.5% THEY ARE ROBBERS <0.5% IMPLEMENT CONSTITUTIONAL LAW <0.5% PEOPLE WANT PEACE <0.5% THEY FIGHT AGAINST FOREIGN FORCES <0.5% THEY ARE MUSLIM <0.5% THEY ARE MADE TO DO SO <0.5% TO SUPPORT POPPY CULTIVATION <0.5% THEY GET THEIR RIGHTS <0.5% TO DAMAGE THE ECONOMY <0.5% PEOPLE DON'T LIKE THEM <0.5% ISIS/DAESH IS A WORLDWIDE PROBLEM <0.5% THEY DON'T WANT DEMOCRACY <0.5% BECAUSE OF UNEMPLOYMENT <0.5% THEY PLACE MINES <0.5% LACK OF SHELTER <0.5% THEY DON'T HAVE ANY PARTICULAR GOAL/ PURPOSE <0.5% THEY ARE SLAVES OF OTHER COUNTRIES <0.5% FOR COUNTRY'S DEVELOPMENT <0.5% THEY RESOLVE OUR DISPUTES <0.5% THEY WANT TO FIGHT A HOLY WAR (JIHAD) <0.5% ELDERS SUPPORT THEM <0.5% THEY ARE LIARS <0.5% THEY ARE PASHTUNS <0.5% THEY ARE GOOD PEOPLE <0.5% Q-56. In your opinion, what is the main reason why ISIS/Daesh is fighting against the Afghan government? BASE: ALL RESPONDENTS 9,086 TO GAIN POWER 19% DON'T KNOW 15% THEY ARE SUPPORTED/MOTIVATED BY FOREIGNERS 12% THEY ARE SUPPORTED BY PAKISTAN 6% THEY ARE AGAINST ISLAM 6% PRESENCE OF FOREIGN TROOPS/INTERNATIONAL 4% KILLING INNOCENT PEOPLE 4% WANTS TO OCCUPY AFGHANISTAN 4% TO CREATE INSECURITY 4% THEY ARE DISSATISFIED WITH THE GOVERMENT 2% TO DESTROY OUR COUNTRY 2% TOO MUCH CORRUPTION IN THE GOVERNMENT 2% FOR MONEY 2% TO FORCE FOREIGN FORCES TO WITHDRAW 2% THEY ARE AGAINST DEMOCRACY 2% ISIS/DAESH 2% APPENDIX 3: INTERVIEW QUESTIONNAIRE 231
242 TO SUPPORT ISLAM 1% ETHNIC PROBLEMS 1% THEY ARE BRUTAL/CRUEL 1% REFUSED 1% THEY ARE NOT AFGHAN 1% THEY HAVE BEEN DECEIVED 1% LACK OF ATTENTION TO THEIR DESIRES 1% FIGHTING IS THEIR WAY OF LIFE 1% TO ESTABLISH SECURITY <0.5% CREATING FEAR/TERROR <0.5% THEY ARE AGAINST POLICE FORCES <0.5% UNEMPLOYMENT/POVERTY <0.5% ILLITERACY <0.5% THEY ARE TRAITORS <0.5% THEY ARE AGAINST THE CONSTITUTION <0.5% THEY IMPLEMENT LAW <0.5% THERE IS NO REASON <0.5% INJUSTICE <0.5% TO DEFEND THE COUNTRY <0.5% MORAL CORRUPTION <0.5% EXTRACTING AFGHANISTAN'S MINERALS <0.5% FOR THEIR PERSONAL BENEFIT <0.5% THEY ARE NOT AWARE OF ISLAMIC LAWS <0.5% THEY ARE STUPID/BARBARIAN <0.5% THEY ARE CORRUPT <0.5% MISLED BY THEIR LEADERS <0.5% GOVERNMENT/ANSF IS WEAK TO FIGHT THEM <0.5% VIOLENCE AGAINST WOMEN <0.5% DESTROYING SCHOOLS <0.5% ISIS/DAESH AND TALIBAN ARE THE SAME <0.5% THEY ARE AGAINST DEVELOPMENT <0.5% THEY ARE AFGHANS <0.5% SUPPORT OF IRAN <0.5% THEIR LEADERS FORCE THEM TO FIGHT <0.5% TO SUPPORT DRUG TRAFFIC <0.5% ROBBERY <0.5% FREEDOM <0.5% THEY ARE AGAINST WOMEN WORKING <0.5% TO DESTROY TALIBAN <0.5% THEY ARE EXTREMISTS <0.5% AVAILABILITY OF WEAPONS <0.5% THEY ARE AGAINST SHIA <0.5% ISIS/DAESH IS A WORLDWIDE THREAT <0.5% FOR REVENGE <0.5% KARZAI IS SUPPORTING THEM <0.5% AMERICANS ARE TESTING THEIR WEAPONS <0.5% SUFFERING LOSSES BECAUSE OF INTERNATIONAL FORCES <0.5% INTERFERENCE OF RUSSIA <0.5% HIGH PROFILE ASSASSINATION <0.5% THEY ARE SUPPORTED BY HANIFULLAH <0.5% 232 AFGHANISTAN IN 2017
243 THEY CONSIDER CURRENT GOVERNMENT NON-ISIS/DAESH <0.5% THEY ARE SLAVES OF OTHER COUNTRIES <0.5% THEY ARE AGAINST ELECTIONS <0.5% PROTECT PEOPLE FROM CRUEL GOVERNMENT <0.5% Q-57a. Thinking about the reasons why ISIS/Daesh have been fighting during the past year, in general, would you say that you have a lot of sympathy, a little sympathy, or no sympathy at all for ISIS/Daesh? BASE: ALL RESPONDENTS 9,086 A LOT OF SYMPATHY 1% A LITTLE SYMPATHY 2% NO SYMPATHY AT ALL 92% REFUSED 2% DON'T KNOW 4% Q-57b. (Ask if answered A lot in Q-57a) You said that you have a lot of sympathy. Why do you say that? BASE: HAVE A LOT OF SYMPATHY WITH ISIS/DAESH 81 THEY ARE AFGHANS 24% KILLING INNOCENT PEOPLE 19% THEY ARE MUSLIM 17% DON'T KNOW 12% IMPLEMENT CONSTITUTIONAL LAW 5% THEY ARE OPPRESSORS 4% THEY WORK FOR FOREIGNERS 3% ELIMINATING WAR 2% EARN MONEY THROUGH ISLAMIC WAYS 2% THEY ARE OUR ENEMIES 2% THEY WANT TO FIGHT A HOLY WAR (JIHAD) 2% THEY ARE MADE TO DO SO 2% REMOVING MORAL CORRUPTION 1% DON'T WANT PEACE AND SECURITY 1% THEY ARE NOT AFGHANS 1% THEY ARE AGAINST WOMEN EDUCATION 1% THEY BRING PEACE 1% I VALUE MY COUNTRYMEN 1% Q-57c. (Ask if (Ask if answered A little in Q-57a) You said that you have a little sympathy. Why do you say that? BASE: HAVE A LITTLE OF SYMPATHY WITH ISIS/DAESH 160 THEY ARE MUSLIM 25% THEY ARE AFGHANS 16% DON'T KNOW 14% EARN MONEY THROUGH ISLAMIC WAYS 7% DON'T WANT PEACE AND SECURITY 5% THEY ARE OPPRESSORS 4% KILLING INNOCENT PEOPLE 4% THEY ARE INFIDELS 3% IMPLEMENT CONSTITUTIONAL LAW 3% THEY ARE GOOD PEOPLE 3% APPENDIX 3: INTERVIEW QUESTIONNAIRE 233
244 THEY ARE THE ENEMY OF AFGHANISTAN 2% THEY ARE NOT AFGHANS 2% THEY ARE BAD PEOPLE 1% REFUSED 1% TO DAMAGE THE ECONOMY 1% THE GOVERNMENT MISTREATS THE PEOPLE 1% HAVE A LOT OF SYMPATHY 1% THEY FIGHT AGAINST FOREIGN FORCES 1% THEY WORK FOR FOREIGNERS 1% THEY ARE OUR RELATIVES 1% THEY ARE OUR ENEMIES 1% I VALUE MY COUNTRYMEN 1% THEY ARE AGAINST WOMEN'S RIGHTS 1% FOR THEIR PERSONAL REASONS 1% THEY ARE SLAVES OF OTHER COUNTRIES 1% WANT TO CREATE DISUNITY 1% PEOPLE WANT PEACE 1% Q-57d. (Ask if answered No sympathy in Q-57a) You said that you don t have any sympathy. Why do you say that? BASE: HAVE NO OF SYMPATHY WITH ISIS/DAESH 8,315 KILLING INNOCENT PEOPLE 32% THEY ARE OPPRESSORS 19% THEY ARE INFIDELS 10% DON'T WANT PEACE AND SECURITY 4% EARN MONEY THROUGH ISLAMIC WAYS 4% THEY WORK FOR FOREIGNERS 3% DON'T KNOW 3% THEY ARE THE ENEMY OF AFGHANISTAN 3% THEY ARE NOT AFGHANS 3% THEY ARE OUR ENEMIES 3% THEY WORK FOR PAKISTAN 2% ISIS/DAESH IS A WORLDWIDE PROBLEM 2% SUICIDE ATTACKS 2% THEY BRING PEACE 1% THEY ARE AGAINST THE GOVERNMENT 1% THEY ARE CRIMINALS 1% REFUSED 1% THEY ARE AGAINST WOMEN EDUCATION 1% THEY ARE MUSLIM <0.5% THEY ARE OUR RELATIVES <0.5% THEY BRING INJUSTICE <0.5% THEY ARE AFGHANS <0.5% THEY ARE AGAINST RECONSTRUCTION <0.5% DON'T HAVE ANY SYMPATHY <0.5% THEY ARE BAD PEOPLE <0.5% IMPLEMENT CONSTITUTIONAL LAW <0.5% THEY ARE AGAINST WOMEN'S RIGHTS <0.5% THE GOVERNMENT MISTREATS THE PEOPLE <0.5% THEY ARE AGAINST EDUCATION SYSTEM <0.5% 234 AFGHANISTAN IN 2017
245 REMOVING MORAL CORRUPTION <0.5% THEY ARE ROBBERS <0.5% DESTROYING ROADS AND BRIDGES <0.5% WANT TO CREATE DISUNITY <0.5% THEY ARE GOOD PEOPLE <0.5% FOR THEIR PERSONAL REASONS <0.5% THEY ARE SLAVES OF OTHER COUNTRIES <0.5% THEY FIGHT AGAINST FOREIGN FORCES <0.5% THEY ARE MADE TO DO SO <0.5% THEY ARE ILLITERATE <0.5% PEOPLE WANT PEACE <0.5% THEY PLACE MINES <0.5% THEY ARE EXTREMIST <0.5% FOR COUNTRY'S DEVELOPMENT <0.5% THEY GET THEIR RIGHTS <0.5% TO SUPPORT POPPY CULTIVATION <0.5% THEY WORK WITH TALIBAN <0.5% ELDERS SUPPORT THEM <0.5% TO DAMAGE THE ECONOMY <0.5% BECAUSE OF UNEMPLOYMENT <0.5% ELIMINATING WAR <0.5% I VALUE MY COUNTRYMEN <0.5% THEY ARE AGAINST SHIAS <0.5% THEY RESOLVE OUR DISPUTES <0.5% THEY WANT TO FIGHT A HOLY WAR (JIHAD) <0.5% THEY DON'T WANT DEMOCRACY <0.5% HAVE A LOT OF SYMPATHY <0.5% LACK OF SHELTER <0.5% THEY ARE STEALING THE MINERALS <0.5% THEY SET MOSQUES ON FIRE <0.5% THEY STEAL THE LANDS <0.5% THEY DON'T HAVE ANY PARTICULAR GOAL/PURPOSE <0.5% PEOPLE DON'T LIKE THEM <0.5% DEFEND THE COUNTRY <0.5% ACCESS TO INFORMATION AND THE MEDIA Q-58. Do you listen to radio programs? BASE: ALL RESPONDENTS 9,086 YES 64% NO 35% REFUSED <0.5% DON'T KNOW <0.5% Q-59. (Ask if Yes in Q-58) You said you listen to the radio. How many hours do you listen to it on an average day every time when you listen to the radio? BASE: LISTENS TO READIO 5,858 LESS THAN 30 MINUTES 18% 31 MINS TO 1 HOUR 36% APPENDIX 3: INTERVIEW QUESTIONNAIRE 235
246 1 HOUR TO 2 HRS 29% MORE THAN 2 HOURS A DAY 17% REFUSED <0.5% DON'T KNOW <0.5% Q-60. Do you watch television programs? BASE: ALL RESPONDENTS 9,086 YES 67% NO 33% REFUSED <0.5% DON'T KNOW <0.5% Q-61. (Ask if Yes in Q-60) You said that you watch television. How many hours do you watch it on an average day every time when you watch television BASE: WATCHES TV 6,052 LESS THAN 30 MINUTES 6% 31 MINS TO 1 HOUR 22% 1 HOUR TO 2 HRS 36% MORE THAN 2 HOURS A DAY 36% REFUSED <0.5% DON'T KNOW 1% Q-62. (Ask if answered Yes in Q-60) Which TV show/program do you watch most often? BASE: WATCHES TV 6,052 NEWS AT 6 36% SERIALS 11% SHABAKA-E-KHANDA 5% DON'T KNOW 5% COMEDY SHOWS 3% SPORTS 3% RELIGIOUS PROGRAMS 3% BAHAR DRAMA 3% SHAB MOSIQI 2% SONGS ON DEMAND 2% BAMDAD KHOSH 2% COOKING SHOW 2% 100 SANIA 1% POLITICAL SHOWS 1% TAWDE KHABARE 1% RO DAR RO 1% QAB GOFTOGO 1% SHABKHAND 1% SHAHIN 1% FARHANG WA TAMADOM 1% HEALTH PROGRAMS 1% QEYAM DRAMA 1% EDUCATIONAL PROGRAMS 1% DE MENE DEWA 1% SOLHE ZENDAGE 1% 236 AFGHANISTAN IN 2017
247 CHENAR 1% SOCIAL SHOWS 1% ECONOMICAL PROGRAMS <0.5% DAM BA DAM <0.5% DEBATES <0.5% WOMEN'S RIGHTS PROGRAMS <0.5% FARAR AZ QAFAS <0.5% DE DARA MORCHAL <0.5% PRISON BREAK <0.5% TV PROGRAMS IN GENERAL <0.5% KHOSORAN SAMAR <0.5% FARAKHABAR <0.5% SESAME STREET <0.5% NOQTE JOSH <0.5% DABESTAN BO ALI <0.5% ARIANA DAR NIMA ROZ <0.5% MADUBALLAH <0.5% SHIRIN <0.5% MOVIES IN GENERAL <0.5% ROUND TABLES <0.5% QALBHAI SARD <0.5% GOFTEMAN <0.5% MINA <0.5% SANDARIZ AMEL <0.5% AWSHAR <0.5% LAHZA BA LAHZA <0.5% DO JASOS <0.5% ME AND YOU <0.5% DE RANA LARA <0.5% CHAI KHANA <0.5% GUL PANA <0.5% JEDA-O-AKBAR <0.5% DELNAWAZ <0.5% IMPETRATOR DONIA <0.5% DAHLIZHA <0.5% GUL SIA <0.5% BARQ-E-LOCH <0.5% KIDS SHOWS <0.5% JAHAN HAIWANAT <0.5% DOKHTAR-E-DEHATI <0.5% JOR BAKHAIR <0.5% ZABAN-E-ESHQ <0.5% DOKHTAR-E-NEQAB POSH <0.5% DARSHAL <0.5% PASOKH NOOR <0.5% RAZ RAZ PAKHLE <0.5% AFGHAN STAR <0.5% INTEKHAB BENENDA HA <0.5% VALLEY OF THE WOLVES <0.5% HAFT GANJ <0.5% APPENDIX 3: INTERVIEW QUESTIONNAIRE 237
248 SETARA HAI RANGIN <0.5% YASAMIN DRAMA <0.5% SALAAM SOBH BAKHAIR <0.5% AISHA GUL <0.5% SHARWAND PROGRAM <0.5% RAH HAQ <0.5% SHIKAST QALB <0.5% AYENE SHAHR <0.5% KHABARI AW SANDARI <0.5% ALEFBA <0.5% MILLINER <0.5% GULBANK <0.5% KELLID KOLALI <0.5% CHERAGH-E-ZINDAGI <0.5% MEHWAR <0.5% MOKHTAR DRAMA <0.5% NAZAR SHUMA <0.5% KHANDA ARA <0.5% HAI MAIDAN TAI MAIDAN <0.5% PORS PAL <0.5% KHAHARKHANDA <0.5% BANU <0.5% SALAAM SARZAMIN MAN <0.5% FASHION SHOW <0.5% KHANE MASOOD SCHOOL <0.5% RON SAHAAR <0.5% KABUL DEBATE <0.5% CAMERA AZAD <0.5% BALA DE WAKHLAM <0.5% LAHZA HA <0.5% ISHQ DEHATI <0.5% YOZARSIF <0.5% PAYAM-E-SULH <0.5% SEWICH-E-KHANDA <0.5% REF. (VOL.) <0.5% JOMONG <0.5% QALAM <0.5% NEDAY ZAN <0.5% PARWAZ <0.5% PAYAM HAQ <0.5% QEYAMAT-E-KOCHAK <0.5% KHOSOMAT <0.5% SEYA-O-SAFID <0.5% AWAZ AFGHANISTAN <0.5% KHANDA HAI GERIA DAR <0.5% PANJIRA <0.5% AMAJ <0.5% FAREHA <0.5% ARBAB-E-KOCHAK <0.5% KHOSHI HA <0.5% 238 AFGHANISTAN IN 2017
249 POL SIA <0.5% RAWISH-E-ROSHAN <0.5% AKHER KHAT <0.5% RAH HAL <0.5% HOMELAND <0.5% Q-63. Do people in your area have access to Internet, either through a cable connection, wireless/ wifi connection, or cellular data (e.g. 2G or 3G)? BASE: ALL RESPONDENTS 9,086 YES 41% NO 57% REFUSED <0.5% DON'T KNOW 2% Q-64. (Ask if Yes in Q-63) Do you personally have access to the Internet? BASE: HAVE ACCESS TO INTERNET IN THEIR AREA 3,730 YES 33% NO 67% REFUSED <0.5% DON'T KNOW <0.5% Q-65. Do you use any of the following for obtaining news and information? BASE: ALL RESPONDENTS (9,086) YES NO REFUSED DON'T KNOW A) RADIO 62% 38% <0.5% <0.5% B) TV SET 65% 35% <0.5% <0.5% C) MOBILE PHONE 43% 56% <0.5% <0.5% D) THE INTERNET 12% 88% <0.5% <0.5% E) MOSQUE 46% 54% <0.5% <0.5% F) COMMUNITY SHURAS 36% 63% <0.5% <0.5% G) FRIENDS AND FAMILY 80% 20% <0.5% <0.5% WOMEN S ISSUES Q-66. In your area is there an organization, institution, or authority, where women can go to have their problem(s) resolved? BASE: ALL RESPONDENTS 9,086 YES 23% NO 74% REFUSED <0.5% DON'T KNOW 3% Q-67A. (Ask if answered Yes in Q-66) What organization, institution, or authority is that? BASE: KNOWS AN ORGANIZATION, INSTITUTION, OR AUTHORITY 2,106 DIRECTORATE OF WOMEN AFFAIRS 56% HUMAN RIGHTS COUNCIL 9% DISTRICT OFFICE 7% LOCAL COUNCIL 4% APPENDIX 3: INTERVIEW QUESTIONNAIRE 239
250 WOMEN'S SHURA 4% DON'T KNOW 3% QAWM ELDERS 2% THE COURT 2% CHIEF OF POLICE 2% POLICE 1% NEDA-E-ZAN ORGANIZATION 1% VILLAGE SHURA/ELDERS 1% PROVINCIAL OFFICE 1% SAFE HOUSE 1% RELIGIOUS ULEMA 1% GOVERNMENT ORGANIZATIONS IN GENERAL 1% PEACE COUNCIL 1% CIVIL SOCIETY ORGANIZATION <0.5% LOCAL JIRGAS <0.5% DIRECTORATE OF SOCIAL WORKS <0.5% HAQ-O-ADALAT <0.5% PUBLIC HEALTH DIRECTORATE/CLINIC <0.5% NATIONAL SOLIDARITY PROGRAM <0.5% COMMUNITY DEVELOPMENT COUNCIL (CDC) <0.5% NONE <0.5% MUNICIPALITY <0.5% AGHA KHAN FOUNDATION <0.5% ATTORNEY GENERAL <0.5% LACK OF MASJID/MADRASA <0.5% ANA <0.5% CARE <0.5% TRUST ORGANIZATIONS <0.5% HIGHER EDUCATION <0.5% WAW <0.5% CCA <0.5% AWP <0.5% UNICEF <0.5% UNESCO <0.5% MINISTRY OF RURAL AND REHABILITATION DEVELOPMENT <0.5% ORGANIZATIONS IN GENERAL <0.5% RED CRESCENT SOCIETY <0.5% CARDF <0.5% WOMEN CAPACITY BUILDING LITERACY ORGANIZATIONS <0.5% REFUSED <0.5% WASA ORGANIZATION <0.5% 240 AFGHANISTAN IN 2017
251 Q-67B. (Ask if Yes in Q-66) Have you ever contacted this or another organization, institution, or authority that helps solve women s problems in your area? BASE: KNOWS AN ORGANIZATION, INSTITUTION, OR AUTHORITY 2,106 YES 38% NO 61% REFUSED <0.5% DON'T KNOW 2% Q-68. Tell me do you strongly agree, somewhat agree, somewhat disagree, or strongly disagree with the following statements? BASE: ALL RESPONDENTS (9,086) A) THE PRACTICE OF BAAD IS ACCEPTABLE B) THE PRACTICE OF BADDAL IS ACCEPTABLE C) A DAUGHTER IS ENTITLED TO PART OF HER DECEASED FATHER S INHERITANCE (MIRAS) STRONGLY AGREE SOMEWHAT AGREE SOMEWHAT DISAGREE STRONGLY DISAGREE REFUSED DON'T KNOW 3% 9% 17% 70% <0.5% <0.5% 8% 21% 25% 46% <0.5% <0.5% 67% 23% 5% 5% <0.5% <0.5% Q-69. Some people say that women should have the same opportunities as men in education. Do you agree or disagree with this opinion? (Wait for response and then ask) strongly or somewhat? BASE: ALL RESPONDENTS 9,086 AGREE STRONGLY 41% AGREE SOMEWHAT 42% DISAGREE SOMEWHAT 13% DISAGREE STRONGLY 4% REFUSED <0.5% DON'T KNOW <0.5% Q-70. And for each of the following levels of education, do you agree or disagree with the opinion that men and women should have equal opportunities for education? Is that strongly or somewhat? BASE: ALL RESPONDENTS (9,086) STRONGLY AGREE SOMEWHAT AGREE SOMEWHAT DISAGREE STRONGLY DISAGREE REFUSED DON'T KNOW A) ISLAMIC MADRASA EDUCATION 73% 21% 4% 1% <0.5% <0.5% B) PRIMARY SCHOOL 63% 24% 8% 4% <0.5% <0.5% C) HIGH SCHOOL 58% 26% 10% 5% <0.5% <0.5% D) UNIVERSITY IN YOUR PROVINCE 44% 29% 15% 11% <0.5% <0.5% E) STUDYING IN ANOTHER PROVINCE 20% 27% 27% 25% <0.5% <0.5% F) STUDYING ABROAD ON SCHOLARSHIP 17% 20% 25% 38% <0.5% 1% Q-71. Some people say that women should be allowed to work outside the home, while others say that women should not be allowed to work outside of the home. What is your opinion on this? BASE: ALL RESPONDENTS 9,086 WOMEN SHOULD BE ALLOWED TO WORK OUTSIDE THE HOME 72% WOMEN SHOULD NOT BE ALLOWED TO WORK OUTSIDE THE HOME 26% REFUSED 1% DON'T KNOW 1% APPENDIX 3: INTERVIEW QUESTIONNAIRE 241
252 Q-72. (Ask if answered Women should not be allowed to work outside the home in Q-71) Why do you say that women should not be allowed to work outside the home? BASE: WOMEN SHOULD NOT BE ALLOWED TO WORK 2,331 UNCERTAIN CONDITIONS 24% ITS AGAINST ISLAMIC LAW 19% THEY ARE NOT NEEDED OUTSIDE THE HOME 12% BAD SECURITY 12% THE FAMILY DOESN'T ALLOW 9% DON'T KNOW 6% IT PREVENTS MORAL CORRUPTION 4% WOMEN SHOULD NOT WORK ALONGSIDE MEN 4% ITS CONSIDERED A SHAME 2% THEY DON'T RESPECT HIJAB 2% THEY NEED TO HELP WITH KIDS 2% THEY DON'T HAVE THE RIGHT 1% THE GOVERNMENT NEVER SUPPORTS THEM 1% LACK OF EXPERIENCE 1% CRIMINALS WILL CREATE PROBLEMS FOR THEM 1% FEAR FROM TALIBAN/ISIS/DAESH <0.5% THEY ARE ILLITERATE <0.5% REF. (VOL.) <0.5% Q-73. And thinking about where women can work. For each of these places, do you agree or disagree that it is acceptable for women to work in these places? BASE: ALL RESPONDENTS (9,086) STRONGLY AGREE SOMEWHAT AGREE SOMEWHAT DISAGREE STRONGLY DISAGREE REFUSED DON'T KNOW A) GOVERNMENT OFFICES 39% 30% 15% 15% <0.5% <0.5% B) NONGOVERNMENTAL ORGANIZATIONS (NGO) 21% 26% 27% 26% <0.5% 1% C) HOSPITALS OR CLINICS 61% 23% 8% 7% <0.5% <0.5% D) FEMALE-ONLY SCHOOLS 67% 18% 8% 6% <0.5% <0.5% E) CO-ED SCHOOLS 36% 31% 17% 15% <0.5% <0.5% F) ARMY/POLICE 13% 23% 28% 35% <0.5% 1% G) A PRIVATE COMPANY OUTSIDE THE HOME (FACTORY, SHOP, BUSINESS) -- WITH FEMALE 21% 25% 24% 29% <0.5% <0.5% EMPLOYEES ONLY H) A PRIVATE COMPANY OUTSIDE THE HOME (FACTORY, SHOP, BUSINESS) -- WHERE MALE AND FEMALE EMPLOYEES WORK IN THE SAME ROOM 13% 23% 27% 37% <0.5% 1% Q-74. And thinking about women in leadership positions, please tell me, do you agree or disagree that it is acceptable for women to have access to these leadership roles? BASE: ALL RESPONDENTS (9,086) STRONGLY AGREE SOMEWHAT AGREE SOMEWHAT DISAGREE STRONGLY DISAGREE REFUSED DON'T KNOW A) MEMBER OF A COMMUNITY DEVELOPMENT COUNCIL 31% 39% 18% 12% <0.5% <0.5% B) GOVERNOR OF A PROVINCE 26% 30% 26% 18% <0.5% 1% C) CEO OF A LARGE COMPANY 24% 30% 24% 20% <0.5% 1% 242 AFGHANISTAN IN 2017
253 D) MINISTER OR CABINET MEMBER 24% 32% 23% 20% <0.5% 1% E) RUNNING FOR PRESIDENT OF AFGHANISTAN 21% 27% 24% 27% <0.5% 1% Q-75. Would you prefer to be represented by a man or a woman in the National Parliament? BASE: ALL RESPONDENTS 9,086 A MAN 44% A WOMAN 21% NO DIFFERENCE 34% REFUSED <0.5% DON'T KNOW 1% Q-76. In your view, which one of these women is dressed most appropriately for public places? BASE: ALL RESPONDENTS 9,086 WOMAN 1 33% WOMAN 2 29% WOMAN 3 15% WOMAN 4 16% WOMAN 5 7% WOMAN 6 1% REFUSED <0.5% DON'T KNOW <0.5% Q-77. Do you think that political leadership positions should be mostly for men, mostly for women, or do you think that both men and women should have equal representation in the political leadership? BASE: ALL RESPONDENTS 9,086 MOSTLY FOR MEN 44% MOSTLY FOR WOMEN 12% EQUAL FOR BOTH MEN AND WOMEN 43% LEADERSHIP SHOULD BE GIVEN TO THEM <0.5% ACCORDING TO THEIR CAPABILITY WOMEN SHOULD DO HOUSEWORK <0.5% OTHER <0.5% REFUSED <0.5% DON'T KNOW 1% Q-78. Do you think women should be allowed to vote in the elections? BASE: ALL RESPONDENTS 9,086 YES 89% NO 11% REFUSED <0.5% DON'T KNOW <0.5% Q-79. If women vote, do you think that women should decide who to vote for themselves or should men decide for women who they should vote for? BASE : ALL RESPONDENTS 9,086 WOMEN SHOULD DECIDE FOR THEMSELVES 60% MEN SHOULD ADVISE THEM 17% APPENDIX 3: INTERVIEW QUESTIONNAIRE 243
254 WOMEN SHOULD DECIDE FOR THEMSELVES 22% BUT IN CONSULTATION WITH MEN (VOL.) REFUSED <0.5% DON'T KNOW 1% Q-80. What do you think is the best age for a woman to get married? BASE : ALL RESPONDENTS 9, <0.5% 13 <0.5% 14 1% 15 3% 16 9% 17 4% 18 32% 19 8% 20 25% 21 3% 22 6% 23 2% 24 2% 25 4% 26 <0.5% 27 <0.5% 28 <0.5% 29 <0.5% 30 <0.5% 32 <0.5% 33 <0.5% 34 <0.5% 35 <0.5% 38 <0.5% REFUSED <0.5% DON'T KNOW <0.5% Q-81. What do you think is the best age for a man to get married? BASE: ALL RESPONDENTS 9, <0.5% 16 2% 17 1% 18 10% 19 4% 20 22% 21 4% 22 11% 23 5% 24 7% 25 21% 26 4% 27 2% 28 2% 244 AFGHANISTAN IN 2017
255 29 1% 30 4% 31 <0.5% 32 <0.5% 33 <0.5% 34 <0.5% 35 <0.5% 36 <0.5% 37 <0.5% 38 <0.5% 40 <0.5% 45 <0.5% REFUSED <0.5% DON'T KNOW <0.5% MIGRATION Q-82a. Tell me, if given opportunity, would you leave Afghanistan and live somewhere else, or not? BASE: ALL RESPONDENTS 9,086 YES 39% NO 56% REFUSED 1% DON'T KNOW 5% Q-82b. (Ask if answered No in Q-82a) Why would you stay in Afghanistan? Q-82b_1. First mention: Q-82b_2. Second mention: BASE: WOULD STAY IN AFGHANISTAN (5,059) PERCENT OF CASES IT IS MY COUNTRY 58% DON'T KNOW 42% I LOVE MY COUNTRY 36% FOR THE RECONSTRUCTION OF THE COUNTRY 11% I FEEL COMFORTABLE HERE 9% I DO NOT HAVE THE ABILITY TO LEAVE 8% THERE ARE NO EMPLOYMENT OPPORTUNITIES 7% MY FAMILY DOES NOT ALLOW ME 7% FOR THE FREEDOM OF THE COUNTRY 5% OTHER COUNTRIES DO NOT ACCEPT REFUGEES 3% GOING THERE IS A RISK 2% TO SERVE PEOPLE 2% THIS IS AN ISLAMIC COUNTRY 2% REFUSED 1% TO DEVELOP EDUCATION 1% I WILL STAY DUE TO MY LANDS 1% TO FIGHT AGAINST CORRUPTION <0.5% TO PREVENT SUICIDE ATTACKS <0.5% TO REMOVE ISIS/DAESH AND TALIBAN <0.5% TO ELIMINATE NARCOTICS <0.5% APPENDIX 3: INTERVIEW QUESTIONNAIRE 245
256 Q-82c. (Ask if answered Yes in Q-82a) Why would you leave Afghanistan? Q-82c_1. First mention: Q-82c_2. Second mention: BASE: WOULD LEAVE AFGHANISTAN (3,523) PERCENT OF CASES INSECURITY 72% UNEMPLOYMENT 55% DON'T KNOW 23% BAD ECONOMY 18% FOR EDUCATION 5% CORRUPTION 3% TALIBAN ARE KILLING PEOPLE 3% SUICIDE ATTACKS 3% INJUSTICE 2% UNCERTAIN FUTURE 2% WEAK GOVERNMENT 2% FOR MY CHILDREN'S BETTER FUTURE 1% ETHNIC PROBLEMS 1% FEAR FROM ISIS/DAESH 1% HIGH PRICES 1% VACATION 1% EXISTENCE OF CRIMINALS 1% LACK OF FREEDOM FOR WOMEN 1% BAD CLIMATE <0.5% FAMILY PREFERS TO LEAVE <0.5% ILLITERACY <0.5% KIDNAPPINGS <0.5% NEIGHBORING COUNTRIES INTERFERENCE <0.5% LACK OF CLINICS/HOSPITALS <0.5% LACK OF SHELTER <0.5% LACK OF ROADS <0.5% REFUSED <0.5% INSECURITY <0.5% NO REASON <0.5% WE WILL GET ADDICTED HERE <0.5% LACK OF ELECTRICITY <0.5% TERRORIST IN AFGHANISTAN <0.5% MORE FACILITIES <0.5% FOR HAJ <0.5% Q-83. (Ask if answered Yes in Q-82a) What, if anything, could the government do to make you want to stay in Afghanistan? (Write response) Q83a. First mention: Q83b. Second mention: BASE: WOULD LEAVE AFGHANISTAN (3,523) PERCENT OF CASES MAINTAIN SECURITY 72% EMPLOYMENT OPPORTUNITIES 56% 246 AFGHANISTAN IN 2017
257 DON'T KNOW 18% GOOD ECONOMY 11% REMOVING CORRUPTION 6% IMPROVING EDUCATION 5% NOTHING 4% REMOVING THE TALIBAN AND ISIS/DAESH 3% RECONSTRUCTION 3% ASSISTING PEOPLE 3% BUILD FACTORIES 3% JUSTICE 3% PREVENTING SUICIDE ATTACKS 1% REMOVING NATIONALISM 1% REMOVING FOREIGN INTERFERENCE 1% ATTENTION TO WOMEN'S RIGHTS 1% PREVENTING NARCOTICS 1% PROVIDING ELECTRICITY <0.5% IMPROVING AGRICULTURE <0.5% GIVING SHELTER <0.5% DISARMAMENT <0.5% REFUSED <0.5% PROVIDE HEALTHCARE SERVICES <0.5% INCREASING THE ANA <0.5% BUILD DAMS <0.5% LOWER THE PRICES <0.5% HOLDING TRANSPARENT ELECTIONS <0.5% NEW FACILITIES ARE PROVIDED <0.5% IMPLEMENTATION OF ISLAMIC LAWS <0.5% CLEANING THE CITY <0.5% ARREST THE CRIMINALS <0.5% GOOD RELATIONS WITH NEIGHBORING COUNTRIES <0.5% Q-84. Do you know any person who has left Afghanistan in the past three years and then subsequently returned to Afghanistan? BASE: ALL RESPONDENTS 9,086 YES 24% NO 75% REFUSED <0.5% DON'T KNOW 1% Q-85. (Ask if answered Yes in Q-84) Why did this person return to Afghanistan? BASE: KNOWS A RETURNEE 2,182 DEPORTED 37% UNEMPLOYMENT 17% TO VISIT HIS/HER FAMILY 14% UNFAIR BEHAVIOR OF THAT COUNTRY'S PEOPLE 9% PATRIOTISM 7% DON'T KNOW 6% ILLEGAL IMMIGRATION 6% BECAUSE HE PAID BACK HIS DEBT 1% SECURITY IS GOOD 1% APPENDIX 3: INTERVIEW QUESTIONNAIRE 247
258 IT WAS AN INFIDEL COUNTRY 1% SIGHTSEEING/TOURISM <0.5% CAME BACK AFTER SCHOLARSHIP <0.5% HOST COUNTRY DID NOT ACCEPT MIGRANTS <0.5% REFUSED <0.5% INTERFERENCE OF THE PRESIDENT (ASKING EUROPEAN <0.5% COUNTRIES TO RETURN MIGRANTS) CONTROLLING F AMILY ABROAD IS VERY DIFFICULT <0.5% TO GET MARRIED <0.5% Q-86. (Ask if answered Yes in Q-84) Which country did this person return from? BASE: KNOWS A RETURNEE 2,182 IRAN 38% TURKEY 16% GERMANY 16% PAKISTAN 10% DON'T KNOW 2% SWEDEN 2% SAUDI ARABIA 2% AUSTRALIA 1% GREECE 1% EUROPE 1% UK 1% AUSTRIA 1% USA 1% DUBAI (UAE) 1% FRANCE 1% INDIA 1% RUSSIA 1% CANADA 1% BELGIUM 1% NORWAY 1% HOLLAND <0.5% ITALY <0.5% TAJIKISTAN <0.5% DENMARK <0.5% SYRIA <0.5% AZERBAIJAN <0.5% UKRAINE <0.5% CHINA <0.5% SWITZERLAND <0.5% SUDAN <0.5% JAPAN <0.5% KUWAIT <0.5% REFUSED. (VOL.) <0.5% UZBEKISTAN <0.5% KAZAKHSTAN <0.5% HUNGARY <0.5% 248 AFGHANISTAN IN 2017
259 Q-87. (Ask if answered Yes in Q-84) Do you think this person was treated fairly by the other country? BASE: KNOWS A RETURNEE 2,182 YES 32% NO 61% REFUSED <0.5% DON'T KNOW 7% Q-88. (Ask if answered Yes in Q-84) What level of difficulty, if any, do you think that this person faced after they returned to Afghanistan? BASE: KNOWS A RETURNEE 2,182 A LOT OF DIFFICULTY 33% SOME DIFFICULTY 45% NO DIFFICULTY 20% DON'T KNOW 2% Q-89. Do you have a family member or close relative that lives abroad? BASE: ALL RESPONDENTS 9,086 YES 41% NO 59% REFUSED <0.5% DON'T KNOW <0.5% Q-90a. (Ask if answered Yes to Q-89) In what countries do they live? (list up to 2 countries) BASE: HAVE A FAMILY MEMBER ABROAD (3,739) PERCENT OF CASES IRAN 42% DON'T KNOW 32% GERMANY 28% TURKEY 22% PAKISTAN 13% USA 10% UK 6% SAUDI ARABIA 6% DUBAI (UAE) 4% CANADA 4% SWEDEN 4% AUSTRALIA 4% FRANCE 4% AUSTRIA 3% INDIA 2% HOLLAND 2% RUSSIA 1% TAJIKISTAN 1% DENMARK 1% EUROPEAN COUNTRIES 1% BELGIUM 1% NORWAY 1% KUWAIT 1% SWITZERLAND 1% GREECE 1% APPENDIX 3: INTERVIEW QUESTIONNAIRE 249
260 ITALY 1% UZBEKISTAN <0.5% REFUSED <0.5% QATAR <0.5% TURKMENISTAN <0.5% NO WHERE <0.5% ARABIC COUNTRIES <0.5% JAPAN <0.5% SYRIA <0.5% EGYPT <0.5% INDONESIA <0.5% SUDAN <0.5% IRELAND <0.5% CHINA <0.5% FINLAND <0.5% BULGARIA <0.5% NEW ZEALAND <0.5% UKRAINE <0.5% POLAND <0.5% CZECH REPUBLIC <0.5% SPAIN <0.5% KAZAKHSTAN <0.5% MALAYSIA <0.5% IRAQ <0.5% LEBANON <0.5% Q-91b. (Ask if answered Yes to Q-89) Have these relatives helped you financially, such as sending money? BASE: HAVE A FAMILY MEMBER ABROAD 3,739 YES 34% NO 65% REFUSED <0.5% DON'T KNOW 1% Q-92. For people living in your area, compared to last year, do you think it has become easier or harder to leave Afghanistan? BASE: ALL RESPONDENTS 9,086 EASIER 10% HARDER 71% NO DIFFERENCE (VOL.) 17% REFUSED <0.5% DON'T KNOW 2% Q-93. How successful do you think the government has been in improving the living condition of people living in your area a lot, a little, or not at all? BASE: ALL RESPONDENTS 9,086 A LOT 14% A LITTLE 49% NOT AT ALL 36% 250 AFGHANISTAN IN 2017
261 REFUSED <0.5% DON'T KNOW 1% Q-94A. (Split sample ask in Versions A and C) Now imagine that a village is destroyed by fighting between the Taliban and the Afghanistan National Defence Security Forces. How much sadness do you feel for the people of this village a lot, a little, or not at all? BASE: VERSION A AND C 4,545 A LOT 63% A LITTLE 23% NOT AT ALL 13% REFUSED <0.5% DON'T KNOW 1% Q-94B. (Split sample ask in Versions B and D) Now imagine that a village where most people feel sympathy with the Taliban is destroyed by fighting between the Taliban and the ANDSF. How much sadness do you feel for the people of this village a lot, a little, or not at all? BASE: VERSION B AND D 4,541 A LOT 49% A LITTLE 28% NOT AT ALL 21% REFUSED <0.5% DON'T KNOW 1% DEMOGRAPHICS D-3. Do you yourself do any activity that generates money? BASE: ALL RESPONDENTS 9,086 YES 45% NO 55% REFUSED <0.5% D-4. (Ask if answered Yes in D3) And what type of activity is that? BASE: HAVE AN ACTIVITY 4,091 FARMER (OWN LAND/TENANT FARMER) 33% SKILLED WORKER/ARTISAN 12% INFORMAL SALES/BUSINESS 10% SMALL BUSINESS OWNER 8% SCHOOL TEACHER 8% FARM LABORER (OTHER'S LAND) 8% LABORER, DOMESTIC, OR UNSKILLED 8% WORKER SELF-EMPLOYED PROFESSIONAL 5% GOVERNMENT OFFICE - CLERICAL WORKER 3% MILITARY/ POLICE 2% PRIVATE OFFICE - CLERICAL WORKER 2% GOVERNMENT OFFICE - EXECUTIVE/ 1% MANAGER PRIVATE OFFICE - EXECUTIVE/ MANAGER <0.5% APPENDIX 3: INTERVIEW QUESTIONNAIRE 251
262 MULLAH <0.5% UNIVERSITY TEACHER <0.5% D-5. How many of the following does your household have? ITEM BASE MEAN STD. DEV. MIN. MAX A) BICYCLE 9, B) MOTORCYCLE 9, C) CAR 9, D) TV 9, E) REFRIGERATOR 9, F) WASHING MACHINE 9, G) SEWING MACHINE 9, H) JERIBS OF LAND 9, ,000 I) LIVESTOCK (NOT POULTRY) 9, ,001 D6 and D7. For statistical purposes only, can you estimate your average monthly household income? RURAL URBAN TOTAL BASE: ALL RESPONDENTS 6,824 2,262 9,086 LESS THAN 2,000 AFS 6% 3% 5% 2,001-3,000 AFS 8% 4% 7% 3,001-5,000 AFS 19% 12% 17% 5,001-10,000 AFS 34% 34% 34% 10,001-15,000 AFS 17% 19% 18% 15,001-20,000 AFS 9% 13% 10% 20,001-25,000 AFS 3% 5% 3% 25,001-40,000 AFS 2% 6% 3% MORE THAN 40,000 AFS 1% 3% 2% REFUSED <0.5% <0.5% <0.5% DON'T KNOW 1% 1% 1% D-8. Do female members of the family contribute to this household income, or not? BASE: ALL RESPONDENTS 9,086 YES 20% NO 80% REFUSED <0.5% D-9. How many years, if any, have you studied at Islamic madrasa? BASE: ALL RESPONDENTS 9,086 0 YEAR 55% 1 YEAR 8% 2 YEARS 16% 3 YEARS 9% 4 YEARS 4% 5 YEARS 3% 6 YEARS 2% 7 YEARS 1% 8 YEARS 1% 9 YEARS <0.5% 10 YEARS 1% 252 AFGHANISTAN IN 2017
263 11 YEARS 0% 12 YEARS 1% 14 YEARS <0.5% 15 YEARS <0.5% 16 YEARS <0.5% REFUSED <0.5% D-10. What is the highest level (grade) of school you have completed, not including schooling in Islamic madrasa? (calculate the highest level into years) BASE: ALL RESPONDENTS 9,086 0 YEAR 48% 1 YEAR 1% 2 YEARS 2% 3 YEARS 3% 4 YEARS 3% 5 YEARS 3% 6 YEARS 5% 7 YEARS 2% 8 YEARS 3% 9 YEARS 2% 10 YEARS 4% 11 YEARS 3% 12 YEARS 12% 13 YEARS <0.5% 14 YEARS 4% 15 YEARS 0% 16 YEARS 3% 17 YEARS <0.5% 18 YEARS <0.5% INFORMAL SCHOOLING 2% D-11. Which languages do you speak? (Multiple response) BASE: ALL RESPONDENTS 9,086 DARI 80% PASHTO 47% UZBEKI 11% ENGLISH 5% TURKMENI 2% URDU 2% PASHAYEE 1% NURISTANI 1% ARABIC 1% BALOCHI <0.5% SHIGNEE <0.5% PAMIRI <0.5% HINDI <0.5% RUSSIAN <0.5% GERMAN <0.5% FRENCH <0.5% APPENDIX 3: INTERVIEW QUESTIONNAIRE 253
264 OTHER (SPECIFY) <0.5% REFUSED <0.5% DON'T KNOW <0.5% D-12. Are you married or single? BASE: ALL RESPONDENTS 9,086 SINGLE 18% MARRIED 80% WIDOWER/WIDOW 2% REFUSED <0.5% D-13. (Ask if answered Married or Widower in D-12) How many children do you have? BASE: MARRIED OR WIDOW 7, % 1 9% 2 19% 3 21% 4 16% 5 12% 6 8% 7 4% 8 3% 9 1% 10 1% 11 <0.5% 12 <0.5% 13 <0.5% 14 <0.5% 15 <0.5% 17 <0.5% 18 <0.5% 20 <0.5% REFUSED <0.5% D15a. Do you personally use a mobile phone or not? BASE: ALL RESPONDENTS 9,086 YES 62% NO 38% REFUSED <0.5% D-15b. How many people live here in this household? BASE: ALL RESPONDENTS 9, PEOPLE 12% 6-10 PEOPLE 52% PEOPLE 28% >15 PEOPLE 8% REFUSED <0.5% DON'T KNOW <0.5% 254 AFGHANISTAN IN 2017
265 D-15c. How many members of this household who live here have their own mobile phone? BASE: ALL RESPONDENTS 9,086 0 PERSON 13% 1 PERSON 18% 2 PEOPLE 30% 3 PEOPLE 19% 4 PEOPLE 10% 5 PEOPLE 5% 6 OR MORE THAN 6 PEOPLE 5% REFUSED <0.5% DON'T KNOW <0.5% D-15d. (Ask if answered one or more mobile phones in D-15c) And how many members of your household own mobile phones that can access the internet, such as the ability to access , websites, or Facebook? BASE: HAVE MOBILE PHONE 0 PERSON 53% 1 PERSON 22% 2 PEOPLE 12% 3 PEOPLE 4% 4 PEOPLE 1% 5 PEOPLE <0.5% 6 OR MORE THAN 6 PEOPLE 1% DON'T KNOW 8% D-16. In general in your life, would you say you are very happy, somewhat happy, not very happy or not at all happy? BASE: ALL RESPONDENTS 9,086 VERY HAPPY 32% SOMEWHAT HAPPY 45% NOT VERY HAPPY 19% NOT AT ALL HAPPY 4% D-17. (Interviewer code): Record number of people present for the interview (excluding the interviewer). Please record the number of people present from each of the three generational categories listed below. If nobody was present from a particular category, enter 0. BASE: ALL RESPONDENTS (9,086) NONE PRESENT AT LEAST ONE PRESENT A) JUNIOR (CHILDREN, YOUNG PEOPLE) 29% 71% B) ADULTS (PEERS, FRIENDS) 31% 69% C) ELDERS 36% 64% APPENDIX 3: INTERVIEW QUESTIONNAIRE 255
266 D-18. (Interviewer code): Which of the following statements do you think best describes the level of comprehension of the survey questionnaire by the respondent? BASE : ALL RESPONDENTS 9,086 RESPONDENT UNDERSTOOD ALL OF THE QUESTIONS 68% RESPONDENT UNDERSTOOD MOST OF THE QUESTIONS 28% RESPONDENT UNDERSTOOD MOST OF THE QUESTIONS BUT WITH SOME HELP 3% RESPONDENT HAD DIFFICULTY UNDERSTANDING MOST OF THE QUESTIONS, EVEN WITH HELP FROM ME D-19. (Interviewer code): Which of the following statements best describes the level of comfort or unease that the respondent had with the Survey questionnaire? <0.5% BASE: ALL RESPONDENTS 9,086 RESPONDENT WAS COMFORTABLE (AT EASE) WITH THE ENTIRE QUESTIONNAIRE 70% RESPONDENT WAS COMFORTABLE WITH MOST OF THE QUESTIONS 27% RESPONDENT WAS COMFORTABLE WITH ONLY SOME OF THE QUESTIONS 3% RESPONDENT WAS GENERALLY UNCOMFORTABLE WITH THE SURVEY <0.5% TO BE COMPLETED BY THE SUPERVISOR: D-20. Was the interview subject to quality control/back-check? BASE: ALL RESPONDENTS 9,086 YES 28% NO 72% D-21. Method of quality control/back-check BASE: ALL RESPONDENTS 9,086 DIRECT SUPERVISION DURING INTERVIEW 6% BACK-CHECK IN PERSON BY SUPERVISOR 23% BACK-CHECK FROM THE CENTRAL OFFICE 1% QUALITY CONTROLLED BY NON-ACSOR MONITOR 9% NOT APPLICABLE 61% 256 AFGHANISTAN IN 2017

267 House No. 861, Street No. 1 Sub-Street of Shirpour Project Kabul, Afghanistan
EXECUTIVE SUMMARY EXECUTIVE SUMMARY 5
 EXECUTIVE SUMMARY Afghanistan in 2017: A Survey of the Afghan People is The Asia Foundation s thirteenth annual public opinion survey in Afghanistan. The longest-running barometer of Afghan opinion, the
EXECUTIVE SUMMARY EXECUTIVE SUMMARY 1
 EXECUTIVE SUMMARY Afghanistan in 2018: A Survey of the Afghan People is The Asia Foundation s fourteenth annual public opinion survey in Afghanistan. The longest-running barometer of Afghan perception
A Survey of the Afghan People
 A Survey of the Afghan People www.asiafoundation.org AF GHANISTAN IN 20 16 House No. 861, Street No. 1, Sub-Street of Shirpour Project Kabul, Afghanistan A Survey of the Afghan People A FG H A N ISTA N
AFGHANISTAN IN Project Direction. The Asia Foundation. Editors. Zachary Warren, John Rieger, Charlotte E. Maxwell-Jones, and Nancy Kelly
 AFGHANISTAN IN 2016 A SURVEY OF THE AFGHAN PEOPLE Project Direction The Asia Foundation Editors Zachary Warren, John Rieger, Charlotte E. Maxwell-Jones, and Nancy Kelly Authors Henry Duke Burbridge, Mohammad
Just over half of respondents (52%) say Afghanistan is moving in the right direction, up from 46% in It
 say Afghanistan is moving in the right direction, up from 46% in It") A F G H A N I S TA N I N 2 0 12 Afghanistan in 2012 5 1 Executive Summary 1.1 Key Findings Just over half of respondents (52%) say Afghanistan is moving in the right direction, up from 46% in 2011. It
A F G H A N I S TA N I N 2 0 12 Afghanistan in 2012 5 1 Executive Summary 1.1 Key Findings Just over half of respondents (52%) say Afghanistan is moving in the right direction, up from 46% in 2011. It
AFGHANISTAN IN A Survey of the Afghan People
 AFGHANISTAN IN 2013 A Survey of the Afghan People AFGHANISTAN IN 2013 A Survey of the Afghan People AFGHANISTAN IN 2013 A Survey of the Afghan People Project Design and Direction The Asia Foundation Editor
AFGHANISTAN IN A Survey of the Afghan People
 AFGHANISTAN IN 6 A Survey of the Afghan People Afghanistan in 6 A Survey of the Afghan People Project Design, Direction, and Editing The Asia Foundation Report Author The Asia Foundation Technical Assistance
AFGHANISTAN IN 2008 A Survey of the Afghan People
 AFGHANISTAN IN 2008 A Survey of the Afghan People Afghanistan in 2008 A Survey of the Afghan People Project Design and Direction The Asia Foundation Report Authors Ruth Rennie Sudhindra Sharma Pawan Sen
A Survey of the Afghan People
 A Survey of the Afghan People AFGHANISTAN IN 2007 AFGHANISTAN IN 2007 AFGHANISTAN OFFICE P.O. Box 175 House No. 55, Street 1 Jawzjan Wat, Shahr-e-Naw Kabul, Afghanistan www.asiafoundation.org AFGHANISTAN
Public Opinion Trends in Afghanistan. CSIS Feb. 11, 2009 Gary Langer, Director of Polling, ABC News
 Public Opinion Trends in Afghanistan CSIS Feb. 11, 2009 Gary Langer, Director of Polling, ABC News ABC News/BBC/ARD poll in Afghanistan Fourth in a series since 2005 Field Dates: Dec. 30, 2008-Jan. 12,
CONFLICT-INDUCED INTERNAL DISPLACEMENT MONTHLY UPDATE
 CONFLICT-INDUCED INTERNAL DISPLACEMENT MONTHLY UPDATE UNHCR AFGHANISTAN DECEMBER 2013 IDPs profiled by the IDP Taskforce in December During December 2013, 6,725 persons (1,353 families) were profiled by
Police Perception Survey The Afghan Perspective
 Police Perception Survey - 2011 The Afghan Perspective Afghanistan Police Perception Survey - 2011 The Afghan Perspective Project Design & Direction UNDP- LOTFA Designed & printed by: Aina Media Field
BASELINE MOBILITY ASSESSMENT
 BASELINE MOBILITY ASSESSMENT SUMMARY RESULTS NOVEMBER DECEMBER 217 Informal IDP settlement in Robat village, Chemtal district, Balkh. IOM 217 ABOUT DTM The Displacement Tracking Matrix (DTM) is a system
Afghanistan 2004 National Elections
 VOTER EDUCATION PLANNING SURVEY: Afghanistan 2004 National Elections A REPORT BASED ON A PUBLIC OPINION POLL July 2004 VOTER EDUCATION PLANNING SURVEY: Afghanistan 2004 National Elections A REPORT BASED
UNHCR THEMATIC UPDATE
 AFGHANISTAN VOLREP AND BORDER MONITORING MONTHLY UPDATE 01 January 31 December 2014 VOLUNTARY RETURN TO AFGHANISTAN In December 2014, a total of 604 Afghan refugees voluntarily repatriated to Afghanistan.
Afghan Public Opinion Amidst Rising Violence
 Afghan Public Opinion Amidst Rising Violence -A WorldPublicOpinion.org Poll- December 14, 2006 Fielded by D3 Systems and Afghan Center for Social and Opinion Research in Kabul PRINCIPAL INVESTIGATOR STEPHEN
Police Perception Survey The Afghan Perspective
 Police Perception Survey - 2010 The Afghan Perspective Police Perception Survey - 2010 The Afghan Perspective Project Design & Direction UNDP- LOTFA Designed & printed by: Aina Media Field Work Afghan
UNHCR THEMATIC UPDATE
 AFGHANISTAN VOLREP AND BORDER MONITORING MONTHLY UPDATE 01 January 30 November 2014 VOLUNTARY RETURN TO AFGHANISTAN In November 2014, a total of 1,018 Afghan refugees voluntarily repatriated to Afghanistan.
A SURVEY OF PUBLIC PERCEPTION ON ELECTIONS AND CIVIC EDUCATION AFGHANISTAN
 A SURVEY OF PUBLIC PERCEPTION ON ELECTIONS AND CIVIC EDUCATION AFGHANISTAN KEY FINDINGS APRIL 2013 This publication was produced by Democracy International, Inc., for the United States Agency for International
Center for Strategic & Regional Studies
 Center for Strategic & Regional Studies Kabul Weekly Analysis-Issue Number 179 (October 29-November 5, 2016) Weekly Analysis is one of CSRS publications, which significantly analyses weekly economic and
Gender and ICT in Fragile States: AFGHANISTAN
 Gender and ICT in Fragile States: AFGHANISTAN Gender and Economic Empowerment: The Role of ICTs Social Development Week February 2008 Basic ICT statistics for Afghanistan One telephone mainline per 1000
AFGHANISTAN A SURVEY OF THE AFGHAN PARLIAMENT KEY FINDINGS JULY 2012
 AFGHANISTAN A SURVEY OF THE AFGHAN PARLIAMENT KEY FINDINGS Prepared under the Democracy and Governance Analytical Services Indefinite Quantity Contract, #DFD- I-00-04-00229-00 JULY 2012 Submitted to: USAID/Montenegro
Center for Strategic & Regional Studies
 Center for Strategic & Regional Studies Kabul Weekly Analysis-Issue Number 254 (May 26 2 June, 2018) Weekly Analysis is one of CSRS publications, which significantly analyses weekly economic and political
Rural Pulse 2019 RURAL PULSE RESEARCH. Rural/Urban Findings March 2019
 Rural Pulse 2019 RURAL PULSE RESEARCH Rural/Urban Findings March 2019 Contents Executive Summary 3 Project Goals and Objectives 9 Methodology 10 Demographics 12 Detailed Research Findings 18 Appendix Prepared
Profile. EQUALITY for Peace and Democracy. Promoting Culture of Coexistence, Accountability, and peace for All.
 Profile Promoting Culture of Coexistence, Accountability, and peace for All admin@epd-afg.org www.epd-afg.org April 2017 1 Strategic Areas (EPD) is an Afghan non-profit, non-governmental organization founded
UNHCR THEMATIC UPDATE
 AFGHANISTAN VOLREP AND BORDER MONITORING MONTHLY UPDATE 01 January 30 April 2015 VOLUNTARY RETURN TO AFGHANISTAN In April 2015, a total of 9,287 Afghan refugees voluntarily repatriated to Afghanistan.
FOURTH ANNUAL IDAHO PUBLIC POLICY SURVEY 2019
 FOURTH ANNUAL IDAHO PUBLIC POLICY SURVEY 2019 ABOUT THE SURVEY The Fourth Annual Idaho Public Policy Survey was conducted December 10th to January 8th and surveyed 1,004 adults currently living in the
Afghan Public Opinion Amidst Rising Violence
 Afghan Public Opinion Amidst Rising Violence Questionnaire Dates of Survey: November 13-November 24, 2006 Margin of Error: +/- 2.2 % Sample Size: 2,097 Q1. Generally speaking, do you think things in Afghanistan
BASELINE MOBILITY ASSESSMENT
 BASELINE MOBILITY ASSESSMENT SUMMARY RESULTS JANUARY MARCH 28 ABOUT DTM The Displacement Tracking Matrix (DTM) is a system that tracks and monitors displacement and population mobility. It is designed
Standard Eurobarometer 88. National report PUBLIC OPINION IN THE EUROPEAN UNION MALTA.
 PUBLIC OPINION IN THE EUROPEAN UNION MALTA http://ec.europa.eu/commfrontoffice/publicopinion This survey has been requested and co-ordinated by the European Commission, Directorate-General for Communication.
ANNUAL SURVEY REPORT: BELARUS
 ANNUAL SURVEY REPORT: BELARUS 2 nd Wave (Spring 2017) OPEN Neighbourhood Communicating for a stronger partnership: connecting with citizens across the Eastern Neighbourhood June 2017 1/44 TABLE OF CONTENTS
STUDY OF PRIVATE SECTOR PERCEPTIONS OF CORRUPTION
 STUDY OF PRIVATE SECTOR PERCEPTIONS OF CORRUPTION This sur vey is made possible by the generous suppor t of Global Af fairs Canada. The Asia Foundation and the Sant Maral Foundation have implemented the
Find out more about the global threat from terrorism, how to minimise your risk and what to do in the event of a terrorist attack.
 Afghanistan Modern Afghanistan is seen as a place of terrorism and fear, but it hasn't always been that way. Afghanistan had always been a good trade location. Due to its popular trade background, Afghanistan
Strife Erodes Afghan Optimism Five Years After the Taliban s Fall
 Strife Erodes Afghan Optimism Five Years After the Taliban s Fall Five years after the fall of the Taliban, public optimism has declined sharply across Afghanistan, pushed by a host of fresh difficulties:
ANNUAL SURVEY REPORT: ARMENIA
 ANNUAL SURVEY REPORT: ARMENIA 2 nd Wave (Spring 2017) OPEN Neighbourhood Communicating for a stronger partnership: connecting with citizens across the Eastern Neighbourhood June 2017 ANNUAL SURVEY REPORT,
OPEN NEIGHBOURHOOD. Communicating for a stronger partnership: connecting with citizens across the Southern Neighbourhood
 OPEN NEIGHBOURHOOD Communicating for a stronger partnership: connecting with citizens across the Southern Neighbourhood OPINION POLL SECOND WAVE REPORT Spring 2017 A project implemented by a consortium
How s Life in Mexico?
 How s Life in Mexico? November 2017 Relative to other OECD countries, Mexico has a mixed performance across the different well-being dimensions. At 61% in 2016, Mexico s employment rate was below the OECD
RETURN OF UNDOCUMENTED AFGHANS
 RETURN OF UNDOCUMENTED AFGHANS MONTHLY SITUATION REPORT NOVEMBER 2017 November Highlights 3,436 undocumented Afghans returned from Pakistan in the month of November 2017 55,114 undocumented Afghans returned
Photo by photographer Batsaikhan.G
 Survey on perceptions and knowledge of corruption 2017 1 2 Survey on perceptions and knowledge of corruption 2017 This survey is made possible by the generous support of Global Affairs Canada. The Asia
ANSO QUARTERLY DATA REPORT Q
 The Afghanistan NGO Safety Office ANSO QUARTERLY DATA REPORT Q.2 2009 Jan st June 30th 2009 ANSO and our donors accept no liability for the results of any activity conducted or omitted on the basis of
R Eagleton Institute of Politics Center for Public Interest Polling
 2002 SURVEY OF NEW BRUNSWICK RESIDENTS Conducted for: Conducted by: R Eagleton Institute of Politics Center for Public Interest Polling Data Collection: May 2002 02-02 EXECUTIVE SUMMARY TABLE OF CONTENTS
BASELINE MOBILITY ASSESSMENT
 BASELINE MOBILITY ASSESSMENT SUMMARY RESULTS NOVEMBER DECEMBER 217 Informal IDP settlement in Robat village, Chemtal district, Balkh. IOM 217 ABOUT DTM The Displacement Tracking Matrix (DTM) is a system
Women in the Middle East and North Africa:
 Women in the Middle East and North Africa: A Divide between Rights and Roles October 2018 Michael Robbins Princeton University and University of Michigan Kathrin Thomas Princeton University Women in the
CPAU Research and M&E Profile. Cooperation for Peace and Unity (CPAU)
") CPAU Research and M&E Profile OUR VISION: A sustainable culture of peace, and a world free of discrimination and violence of any nature, in which everyone has the right to basic needs, social justice,
CPAU Research and M&E Profile OUR VISION: A sustainable culture of peace, and a world free of discrimination and violence of any nature, in which everyone has the right to basic needs, social justice,
BASELINE MOBILITY ASSESSMENT
 BASELINE MOBILITY ASSESSMENT SUMMARY RESULTS APRIL JUNE 28 Female IDP outside her tarpoulin-roofed, mudbrick hut in Baharak district, Takhar. IOM 28 ABOUT DTM The Displacement Tracking Matrix (DTM) is
How s Life in France?
 How s Life in France? November 2017 Relative to other OECD countries, France s average performance across the different well-being dimensions is mixed. While household net adjusted disposable income stands
How s Life in Finland?
 How s Life in Finland? November 2017 In general, Finland performs well across the different well-being dimensions relative to other OECD countries. Despite levels of household net adjusted disposable income
Vancouver Police Community Policing Assessment Report Residential Survey Results NRG Research Group
 Vancouver Police Community Policing Assessment Report Residential Survey Results 2017 NRG Research Group www.nrgresearchgroup.com April 2, 2018 1 Page 2 TABLE OF CONTENTS A. EXECUTIVE SUMMARY 3 B. SURVEY
Afghan Citizen Perception Survey. Final report. Afghan Citizen Perception Survey
 Final report Afghan Citizen Perception Survey BY ASSESS, TRANSFORM & REACH CONSULTING (ATR) February, 2014 1 Contents CONTENTS... 2 EXECUTIVE SUMMARY... 3 METHODOLOGY... 8 A. SAMPLE POPULATION... 8 Selecting
Korea s average level of current well-being: Comparative strengths and weaknesses
 How s Life in Korea? November 2017 Relative to other OECD countries, Korea s average performance across the different well-being dimensions is mixed. Although income and wealth stand below the OECD average,
Refugees in Jordan and Lebanon: Life on the Margins
 Refugees in and Lebanon: Life on the Margins Findings from the Arab Barometer WAVE 4 REPORT ON SYRIAN REFUGEES August 22, 2017 Huseyin Emre Ceyhun REFUGEES IN JORDAN AND LEBANON: LIFE ON THE MARGINS Findings
ANNUAL SURVEY REPORT: REGIONAL OVERVIEW
 ANNUAL SURVEY REPORT: REGIONAL OVERVIEW 2nd Wave (Spring 2017) OPEN Neighbourhood Communicating for a stronger partnership: connecting with citizens across the Eastern Neighbourhood June 2017 TABLE OF
Craig Charney Briefing Center for National Policy Washington, DC April 3, 2008
 Afghanistan: Public Opinion Trends and Strategic Implications Craig Charney Briefing Center for National Policy Washington, DC April 3, 2008 Sources National Opinion Polls This presentation is based on
How s Life in the United Kingdom?
 How s Life in the United Kingdom? November 2017 On average, the United Kingdom performs well across a number of well-being indicators relative to other OECD countries. At 74% in 2016, the employment rate
Proposed by Afghan Development Association (ADA) Terms of Reference (TOR)
 Terms of Reference (TOR)") Terms of Reference (TOR) Research on Key Drivers of Conflict and Violence along with Capacities and Existing Initiatives for Peace in Faryab Province Proposed by Afghan Development Association (ADA) 1.
Terms of Reference (TOR) Research on Key Drivers of Conflict and Violence along with Capacities and Existing Initiatives for Peace in Faryab Province Proposed by Afghan Development Association (ADA) 1.
How s Life in Austria?
 How s Life in Austria? November 2017 Austria performs close to the OECD average in many well-being dimensions, and exceeds it in several cases. For example, in 2015, household net adjusted disposable income
Afghan People s Dialogue on Peace
 Afghan People s Dialogue on Peace People s Dialogue Group Discussion in Western Afghanistan, October 2011 Laying the Foundations for an Inclusive Peace Process December 2011 Contents I. Context: Laying
How s Life in the United States?
 How s Life in the United States? November 2017 Relative to other OECD countries, the United States performs well in terms of material living conditions: the average household net adjusted disposable income
Rural Pulse 2016 RURAL PULSE RESEARCH. Rural/Urban Findings June 2016
 Rural Pulse 2016 RURAL PULSE RESEARCH Rural/Urban Findings June 2016 Contents Executive Summary Project Goals and Objectives 9 Methodology 10 Demographics 12 Research Findings 17 Appendix Prepared by Russell
Spain s average level of current well-being: Comparative strengths and weaknesses
 How s Life in Spain? November 2017 Relative to other OECD countries, Spain s average performance across the different well-being dimensions is mixed. Despite a comparatively low average household net adjusted
Italy s average level of current well-being: Comparative strengths and weaknesses
 How s Life in Italy? November 2017 Relative to other OECD countries, Italy s average performance across the different well-being dimensions is mixed. The employment rate, about 57% in 2016, was among the
Summary. Flight with little baggage. The life situation of Dutch Somalis. Flight to the Netherlands
 Summary Flight with little baggage The life situation of Dutch Somalis S1 Flight to the Netherlands There are around 40,000 Dutch citizens of Somali origin living in the Netherlands. They have fled the
Transparency is the Key to Legitimate Afghan Parliamentary Elections
 UNITED STates institute of peace peacebrief 61 United States Institute of Peace www.usip.org Tel. 202.457.1700 Fax. 202.429.6063 October 14, 2010 Scott Worden E-mail: sworden@usip.org Phone: 202.429.3811
How s Life in Australia?
 How s Life in Australia? November 2017 In general, Australia performs well across the different well-being dimensions relative to other OECD countries. Air quality is among the best in the OECD, and average
Transitional Islamic State of Afghanistan Constitutional Commission Secretariat PRESS RELEASE 13 NOVEMBER 2003
 PRESS RELEASE 13 NOVEMBER 2003 Contact: Abdul Ghafour Liwal, Press Officer Email:ccsecretariat@yahoo.com Mobile: 070-292463 Special Category Election for Constitutional Loya Jirga (CLJ) Special category
How s Life in Ireland?
 How s Life in Ireland? November 2017 Relative to other OECD countries, Ireland s performance across the different well-being dimensions is mixed. While Ireland s average household net adjusted disposable
The Sudan Consortium African and International Civil Society Action for Sudan. Sudan Public Opinion Poll Khartoum State
 The Sudan Consortium African and International Civil Society Action for Sudan Sudan Public Opinion Poll Khartoum State April 2015 1 Table of Contents 1. Introduction... 3 1.1 Background... 3 1.2 Sample
Timor Tatoli Survey November The Support for Good Public Policy Program Timor-Leste
 Timor Tatoli Survey November 2014 The Support for Good Public Policy Program Timor-Leste Timor Tatoli Survey November 2014 INTRODUCTION In November 2014, The Asia Foundation in partnership with NGO Belun,
How s Life in New Zealand?
 How s Life in New Zealand? November 2017 On average, New Zealand performs well across the different well-being indicators and dimensions relative to other OECD countries. It has higher employment and lower
Global Corruption Barometer 2010 New Zealand Results
 Global Corruption Barometer 2010 New Zealand Results Ben Krieble TINZ Summer Intern www.transparencynz.org.nz executive@transparency.org.nz Contents Executive Summary 3 Summary of global results 4 Summary
How s Life in Denmark?
 How s Life in Denmark? November 2017 Relative to other OECD countries, Denmark generally performs very well across the different well-being dimensions. Although average household net adjusted disposable
How s Life in Canada?
 How s Life in Canada? November 2017 Canada typically performs above the OECD average level across most of the different well-indicators shown below. It falls within the top tier of OECD countries on household
Corruption Mapping in Afghanistan
 Corruption Mapping in Afghanistan Assessment of People s Understanding and Viewpoint from Corruption Survey Outcomes in 12 Provinces of Afghanistan Kabul July 2015 Corruption Mapping in Afghanistan Authors:
Japan s average level of current well-being: Comparative strengths and weaknesses
 How s Life in Japan? November 2017 Relative to other OECD countries, Japan s average performance across the different well-being dimensions is mixed. At 74%, the employment rate is well above the OECD
RESULTS FROM THE AFROBAROMETER ROUND 5 SURVEY IN SWAZILAND
 WWW.AFROBAROMETER.ORG RESULTS FROM THE AFROBAROMETER ROUND 5 SURVEY IN SWAZILAND Swaziland Round 5 Release Event 1 8 November 213 What is the Afrobarometer The Afrobarometer is an independent, nonpartisan
HUMANITARIAN ASSISTANCE PROGRAMME UPDATE
 IOM AFGHANISTAN Humanitarian Assistance Programme Update August 4 HIGHLIGHTS (July-Aug 4) Humanitarian Assistance Programme OBJECTIVE Contribute to reduce the level of vulnerability of Afghan population
How s Life in Iceland?
 How s Life in Iceland? November 2017 In general, Iceland performs well across the different well-being dimensions relative to other OECD countries. 86% of the Icelandic population aged 15-64 was in employment
Survey of Jordanian Public Opinion. National Poll #15 May 22-25, 2017
 Survey of Jordanian Public Opinion National Poll #15 May 22-25, 2017 Detailed Methodology This survey was designed, coordinated and analyzed by Middle East Marketing and Research Consultants on behalf
ANNUAL SURVEY REPORT: AZERBAIJAN
 ANNUAL SURVEY REPORT: AZERBAIJAN 2 nd Wave (Spring 2017) OPEN Neighbourhood Communicating for a stronger partnership: connecting with citizens across the Eastern Neighbourhood June 2017 TABLE OF CONTENTS
as Philadelphians voice concerns about violent crime and the overall direction of the city.
 PUBLIC OPINION POLL: MAYOR Nutter s ratings improve, but philadelphians worry about crime AND DIRECTION OF THE CITY February 14, 2012 KEY FINDINGS A new public opinion poll commissioned by The Pew Charitable
Community perceptions of migrants and immigration. D e c e m b e r
 Community perceptions of migrants and immigration D e c e m b e r 0 1 OBJECTIVES AND SUMMARY OBJECTIVES The purpose of this research is to build an evidence base and track community attitudes towards migrants
How s Life in Hungary?
 How s Life in Hungary? November 2017 Relative to other OECD countries, Hungary has a mixed performance across the different well-being dimensions. It has one of the lowest levels of household net adjusted
How s Life in the Netherlands?
 How s Life in the Netherlands? November 2017 In general, the Netherlands performs well across the OECD s headline well-being indicators relative to the other OECD countries. Household net wealth was about
Chile s average level of current well-being: Comparative strengths and weaknesses
 How s Life in Chile? November 2017 Relative to other OECD countries, Chile has a mixed performance across the different well-being dimensions. Although performing well in terms of housing affordability
An Afghan Futures Report
 An Afghan Futures Report By D3 and ACSOR-Surveys Afghan Attitudes towards Migration and Returnees Although often overshadowed by ongoing violence and corruption, the issues of migrants, refugees, and returnees
How s Life in Portugal?
 How s Life in Portugal? November 2017 Relative to other OECD countries, Portugal has a mixed performance across the different well-being dimensions. For example, it is in the bottom third of the OECD in
How s Life in Germany?
 How s Life in Germany? November 2017 Relative to other OECD countries, Germany performs well across most well-being dimensions. Household net adjusted disposable income is above the OECD average, but household
ANNUAL SURVEY REPORT: GEORGIA
 ANNUAL SURVEY REPORT: GEORGIA 2 nd Wave (Spring 2017) OPEN Neighbourhood Communicating for a stronger partnership: connecting with citizens across the Eastern Neighbourhood June 2017 TABLE OF CONTENTS
NightWatch 30 January 2011
 NightWatch 30 January 2011 Special Report: ember in Afghanistan Findings: The Taliban sustained a nationwide offensive in ember, featuring the highest number of clashes and security incidents in the largest
Attitudes towards the EU in the United Kingdom
 Flash Eurobarometer European Commission Attitudes towards the EU in the United Kingdom Analytical Report Fieldwork: January 200 Publication: May 200 Flash Eurobarometer 203 The Gallup Organization This
How s Life in the Czech Republic?
 How s Life in the Czech Republic? November 2017 Relative to other OECD countries, the Czech Republic has mixed outcomes across the different well-being dimensions. Average earnings are in the bottom tier
How s Life in Belgium?
 How s Life in Belgium? November 2017 Relative to other countries, Belgium performs above or close to the OECD average across the different wellbeing dimensions. Household net adjusted disposable income
How s Life in Switzerland?
 How s Life in Switzerland? November 2017 On average, Switzerland performs well across the OECD s headline well-being indicators relative to other OECD countries. Average household net adjusted disposable
Voluntary Repatriation to Afghanistan 2004
 Voluntary Repatriation to Afghanistan 24 UNHR Pakistan Voluntary Repatriation to Afghanistan 24 HOPES AND FEARS At the twilight of my life, I am leaving Pakistan with new hopes as I am carrying a new
Afghanistan Election Conundrum (13): New voter registry too good to be true
: New voter registry too good to be true") Afghanistan Election Conundrum (13): New voter registry too good to be true Author : Scott Worden Published: 28 August 2018 Downloaded: 6 September 2018 Download URL: https://www.afghanistan-analysts.org/wp-admin/post.php
Afghanistan Election Conundrum (13): New voter registry too good to be true Author : Scott Worden Published: 28 August 2018 Downloaded: 6 September 2018 Download URL: https://www.afghanistan-analysts.org/wp-admin/post.php
Joint Programme on Voluntary Repatriation of Afghan Refugeesand Displaced Persons. Free of Charge December 2010 RETURN
 Joint Programme on Voluntary Repatriation of Afghan Refugeesand Displaced Persons Free of Charge December 2010 Monthly Bulletin Issue: 96 RETURN Information Update Mass Information Committee Ahmad Mohammadi,
How s Life in Estonia?
 How s Life in Estonia? November 2017 Relative to other OECD countries, Estonia s average performance across the different well-being dimensions is mixed. While it falls in the bottom tier of OECD countries
Afghanistan: Leading in Hashish Production. Muhammad Ajmal Khan Karimi th June 2010
 Afghanistan: Leading in Hashish Production Muhammad Ajmal Khan Karimi 1 30 th June 2010 Released on 31 st March 2010, the first survey on cannabis cultivation conducted in Afghanistan by the United Nations
ADDENDUM TO SIGAR S JANUARY 2018 QUARTERLY REPORT TO THE UNITED STATES CONGRESS
 SIGAR JAN Special Inspector General for Afghanistan Reconstruction 30 2018 ADDENDUM TO SIGAR S JANUARY 2018 QUARTERLY REPORT TO THE UNITED STATES CONGRESS ADDENDUM FEBRUARY 2018 SECURITY TERRITORIAL AND
Kansas Policy Survey: Fall 2001 Survey Results
 Kansas Policy Survey: Fall 2001 Survey Results Prepared by Tarek Baghal with Chad J. Kniss, Donald P. Haider-Markel, and Steven Maynard-Moody September 2002 Report 267 Policy Research Institute University