Grain Subsidies and Rural-Urban Migration in China: A Case-Study in Northeast Jiangxi Province
|
|
|
- Cecil Johns
- 5 years ago
- Views:
Transcription
1 Grain Subsidies and Rural-Urban Migration in China: A Case-Study in Northeast Jiangxi Province Harmen van der Ende DEC Wageningen Wageningen University Supervised by Dr. N. Heerink
2 Grain Subsidies and Rural-Urban Migration in China: A Case-Study in Northeast Jiangxi Province 2
3 Abstract Since 2004, the Chinese government has used grain subsidies and other instruments to promote grain production in an effort to stimulate rural incomes, reduce rural-urban inequalities and remain self-sufficient in grain production. The extent to which this rural policy transition stimulates rural households to focus on agricultural production instead of migrating to cities remains unclear. This study examines the impact of China s grain subsidies and other factors on household participation in rural-urban migration in the northeast of Jiangxi province. With the use of a household-level dataset for three villages in this region from 2000, 2005 and 2010, trends and developments in these villages were described. Binary logistic regression analysis was used to examine the main factors explaining migration decisions of the surveyed households. The results indicate that grain subsidies did not significantly impact migration. Main factors explaining the variation in migration between the villages were the number of household members in the labour force and the amount of forestland, both having a significant positive impact on migration. The results also show that men are more likely to migrate than women. The amount of cultivated irrigated land has a U-shaped effect on migration, while the impact of the average age of the household s labour force follows an inverted U-shaped pattern. The current value of durables had a significant negative impact on migration. The main factors migration differed between the villages. Using these village-specific findings, this study ends with an effort to explain the observed migration trends between 2000 and 2010 from the observed trends in the main determining factors during the same period. Keywords: Grain subsidies; Migration; Household survey, China. 3
4 Preface This study is my MSc thesis for the Master International Development Studies at Wageningen University. I wrote this thesis at the chair group Development Economics under the supervision of Dr. Nico Heerink. I would like to take to opportunity to special thank Nico Heerink for his close supervision and personal involvement during the process of writing my MSc thesis. I would also like to express my gratitude towards Xiaoping Shi, Xianlei Ma, Fangping Rao and their colleagues at Nanjing Agricultural University for providing the data that was needed for this study and for their help during the analyses. During this study I was confronted with the task to apply my skills and knowledge obtained during my Master as well as to work disciplined on one subject for a relatively long period. I used surveys from 2000, 2005 and 2010 for the same three villages in this study. The questionnaires from 2000 and 2005 were to a large extent consistent, but the questionnaire from 2010 used several different formulations, which made it a major job to compare the variables of interest for my MSc thesis between 2010 and the other years. It has been a long process to finalize this study with its ups and downs, but in the end I am proud to present my results to the reader and I sincerely hope that it can be of use for future studies. Harmen van der Ende 4
5 Table of Contents Chapter 1 Introduction... 7 Chapter 2 Background and Concepts Introduction Grain subsidies and price support for agricultural producers Grain subsidies Price support policies Rural-urban migration Harris-Todaro model New Economics of Labour Migration Discussion Chapter 3 Trends and Major Developments Introduction The dataset Grain subsidies Migration and local off-farm employment Individual and household assets Human capital and characteristics of the individual Household assets Trends in rice output and household income Rice output Household income Discussion Chapter 4 Regression Results Introduction Model specification Explanatory variables Expectations Binary logistic regression Assumptions and adjustments Regression analyses Regression results for household characteristics Regression results fixed assets
6 4.4.3 Regression results fixed assets and subsidies Discussion Introduction Village-level regressions Banqiao Shangzhu Gangyan Discussion Chapter 6 Summary and Discussion Introduction Summary Discussion Limitations and recommendations Bibliography Appendices Appendix 1 Collinearity diagnostics, full sample Appendix 2 Correlation matrix, full sample
7 Chapter 1 Introduction The last decennium embarked on a transition in China s rural policy. Between 2002 and 2006, China s rural policy changed dramatically from taxing to subsidizing grain producers. This transition was driven by concerns about maintaining food security and national self-sufficiency, rural-urban incomeinequality, and the aim to modernize agriculture and China s accession into the WTO (Gale, 2013). Agricultural producers hardly received any fiscal support before Direct and indirect taxes were levied and crop prices were artificially depressed to stimulate industrialization (Meng, 2012). This led to low rural incomes, general discontent among the Chinese rural population (Bernstein & Lü, 2003) and a low agricultural competitiveness on the world market (Gale, 2013). China s agricultural policy transition increased the emphasis on agricultural producers, increasing grain subsidies, providing price support for commodities and phasing out taxation (Gale, 2013). The total value of subsidies rose from 14.5 billion yuan in 2004 to billion yuan in 2012 (Yi et al., 2015) and between 2007 and 2012, the minimum price for rice more than doubled from 200 to more than 400 dollars per metric ton of rice (Gale, 2013). Such a policy transition in a large country as China should have an impact on its society. There exists an emerging literature on China s policy transition and its effect on production, income, crop choice and input use, often using aggregate data (Meng, 2012; Gale et al., 2005; Yu & Jensen, 2009). However, the influence of subsidies on rural-urban migration remains unclear, while China has experienced an enormous flow of internal migration (Chan, 2001); the urban population in China increased with 440 million from 1979 to 2009, with about 340 million attributable to migration and reclassification (Chan, 2013). Income from grain subsidies could enable liquidity-constrained agricultural producers to migrate to urban regions, and could therefore counteract China s concerns that led to the agricultural policy transition. On the other hand, agricultural producers could also decide to use the grain subsidies for investing in their rural livelihoods, by purchasing more agricultural inputs and make agriculture-related investments and thereby decrease migration (Meng, 2012). Hence, it seems that grain subsidies could either have a positive or negative effect on migration. To my knowledge, the study by Meng (2012) is the only study that has examined the impact of grain subsidies on migration in China. Using a difference-in-difference methodology for subsidised grain producers and non-subsidised cotton producers in a region within Hubei province, Meng (2012) found that grain subsidies had a negative impact on rural-urban migration. It is not clear, however, whether these findings also hold for different institutional and agro-ecological settings within the same country, in other words; more research in other regions is needed to test the robustness of Meng s (2012) results. Social- and human capital of individuals and household assets could impact the decision to migrate as well, as the education level or the amount of irrigated land used for rice production (Shi et al., 2007). Shi et al. (2007) examined the factors driving participation in migration using data from 2000 from the Jiangxi province and Zhao (1999a) studied the mechanisms that affect individuals and households decision to migrate in Sichuan province in 1994 and This study will select variables of interest for the analysis on the basis of their findings, and analyse their impact on migration with the use of data from Jiangxi province from 2000, 2005 and
8 This study aims to increase the knowledge and understanding of the impact of China s rural policy change on the Chinese rural society by investigating the impact of the grain subsidies on migration as well as to examine the factors driving migration on the household level. It expands the available literature by focusing on Jiangxi province, a different agro-ecological region than the Hubei province, where grain production is the dominant agricultural production mode The study will be carried out at the household level in the Jiangxi province. The dataset that is used contains household survey data collected in three villages in the northeast of Jiangxi province in 2000, 2005 and It contains a broad range of data about (rural-urban) migration, grain subsidies and household assets, enabling me to examine trends in major variables between 2000 and 2010 as well as to use quantitative methods to examine the impact of grain subsidies, individual characteristics and household assets on migration. This will be done for the full sample and for each village separately in order to examine which factors impact migration in the villages and to which extent this differs between the villages. The three study-villages have different characteristics which are considered representative for the rural diversity in the northeast of Jiangxi province, a relatively poor region where rice growing is the dominant agricultural production mode (Shi et al., 2007). The following central research question has been formulated: What was the impact of grain subsidies, individual characteristics and household assets on migration in the northeast of Jiangxi province? Chapter 2 will provide an elaboration of the concepts and background of China s agricultural policy transition and migration with the use of literature. Three sub-questions will be used to answer the central research question, which will be elaborated in separate chapters. The first sub-question will examine trends in a broad range of data about grain subsidies, migration and off-farm employment, individual characteristics of the household members, household s assets and income and output data between 2000 and 2010 for the three villages. All three survey years are used for this, aiming to develop a feeling about the data and about between-village differences. With the help of the literature, the trends in the three surveyed villages can be placed in the perspective of the rural policy transition and rural-urban migration trends in China. This will be elaborated in Chapter 3 and the sub-question is formulated as follows: What were the trends in grain subsidies, migration and off-farm employment, and other major developments in household assets and output levels in the northeast of Jiangxi province between 2000 and 2010? The second sub-question will examine the impact of grain subsidies, individual characteristics of the household members and (relatively) fixed household assets on migration for the full sample with the use of binary logistic regression analysis. It will be tested whether the grain subsidies have a positive, negative or insignificant impact on rural-urban migration in 2010, using IBM SPSS Statistics. A selection of explanatory variables will be added in order to clarify the relationship between grain subsidies and migration and to examine the impact of these variables on migration individually. The selection of explanatory variables will be based on the articles by Shi et al. (2007) and Zhao (1999a). The year 2010 will be used for this since it is the most recent year and the grain subsidies were fully absent in 2000 and still relatively small in This sub-question will be elaborated in Chapter 4 and is formulated as follows: 8
9 What was the impact of grain subsidies, individual characteristics and household assets on rural-urban migration in the three surveyed villages in 2010? The third sub-question will examine the impact of grain subsidies, individual characteristics of the household members and (relatively) fixed household assets on migration for each village separately with the use of binary logistic regression analyses. The same explanatory variables as in Chapter 4 will be added and it will be examined which factors affect migration per village and to which extent this differs between the villages in The sub-question will be elaborated in Chapter 5 and is formulated as follows: What were the differences in impact of grain subsidies, individual characteristics and household assets in the three surveyed villages in 2010? The first sub-question will be answered with the use the household survey data from 2000, 2005 and Descriptive statistics will be used to examine these trends and obtain a feeling and contextual understanding of the data. The panel data are unbalanced, since the surveyed household composition differed between the years. The second sub-question will only make use of the household survey data from Binary logistic multiple regression analyses will be performed with migration as dependent categorical variable and grain subsidies, aggregated individual characteristics on the household level and household assets as explanatory variables for the full sample. By doing this, the impact of grain subsidies can be analysed while controlling for the other explanatory variables as well as to analyse the impact of each explanatory variable individually. The third sub question will also use household survey data from 2010 and perform binary logistic multiple regressions as in Chapter 4, but selecting per village. 9
10 Chapter 2 Background and Concepts 2.1 Introduction This chapter will provide background information into the agricultural policy transition and the migration trend on the national level in China. Section 2.2 will provide background information on China s agricultural policy transition, grain subsidies and price support policies. The motives of the Chinese government to implement the grain subsidies and the scope and characteristics of the grain subsidies and price support policies will be examined in this section. Section 2.3 will examine the migration trends in China and elaborate two models explaining the motives behind migration: the Harris-Todaro model and the New Economics of Labour Migration (NELM). A context about the individual and household characteristics and (relatively) fixed assets that will be used as explanatory variables in the regression analyses will be provided in Chapter Grain subsidies and price support for agricultural producers Grain subsidies In the years towards 2001, many reforms were conducted by China during negotiations to gain membership into the WTO. In order to minimize distortionary policies, the agreement set relatively low agricultural tariffs and limited agricultural support (Gale, 2013). However, concerns about rural poverty, underemployment and high taxation of agricultural producers induced a transition into subsidizing agricultural producers in the years following (Gale, 2013). Since 2004, China s rural policy changed in the direction from taxing to subsidizing agricultural producers. The direct and indirect taxes were phased out and subsidies for grain products and price supports were introduced (Gale, 2013; Meng, 2012). These transitions were introduced in order to maintain food security, national self-sufficiency, ruralurban income-inequality and to stimulate modernization. Different kinds of subsidies to grain producers were introduced in 2004 to achieve these goals; direct payments to grain producers, improved seed subsidies for improves seed varieties and agricultural machinery subsidies for purchasing machinery (Gale, 2013). Since then, new types of subsidies have been added, of which the general-input subsidy accounted for the largest share within the total subsidies. The generalinput subsidy was introduced in 2006 in order to offset rising productions costs, aiming to maintain revenues for grain producers (Gale, 2013). The total amount of subsidies has increased significantly from 2004 onwards as authorities were concerned that low revenues and market fluctuations could discourage production of grain commodities (Gale, 2013). Figure 1 illustrates the development in subsidies between 2004 and It shows that direct payments have been more or less constant between 2004 and 2012 and that the general-input subsidies have become the main component of the subsidization since The seed- and machinery subsidies have been increasing to a smaller extent between 2004 and
 and as discussed in the introduction, the total value of the subsidies rose from 14.")
11 Figure 1 Overview of the development of agricultural subsidies (Gale, 2013). In 2004, the total amount of grain subsidies accounted for 0.7% of the value of China s agricultural output, while in 2009, this percentage rose to 3.47% (Meng, 2012) and as discussed in the introduction, the total value of the subsidies rose from 14.5 billion yuan in 2004 to billion yuan in 2012 (Yi et al., 2015). Moreover, the direct payment to grain producers was $7 per acre in 2004, while in 2012 the direct payments and general input subsidies combined were between $60 and $100 per acre (Gale, 2013). Results from Huang et al. (2011) show that subsidies are received annually on the village level, by both rich and poor producers in all of China. The amount of subsidy is usually based on the amount of contracted land per household, the actual grain-sown area or the taxable grain production area for a regular year before taxation was abolished. In practice implementation of the grain subsidy policy depends on local governments (Yi et al., 2015). The grain subsidies, thus, are generally not linked to production levels. If grain subsidies are provided regardless of production levels, they may be considered as extra income, i.e. a lump sum payment. As a lump sum payment, it should stabilize the income of agricultural producers (De Gorter et al., 2008). When agricultural households are liquidityconstrained, as most Chinese rural households probably are, grain subsidies are likely to affect household s production and migration decisions through diversification strategies (Yi et al., 2015). However, as discussed in the introduction, the impact could be positive or negative. Since China joined the WTO in 2001, the protection of agriculture has become more difficult as China needed to comply with WTO rules (Meng, 2012). China s agricultural policy transition has caused concerns in the international community whether it was meeting its WTO obligations to limit marketdistorting measures (Gale, 2013; Meng, 2012). Subsidies under the green box category have no limits according to WTO rules; this box includes government investment in agriculture, its technology, infrastructure, irrigation, environmental controls and other public works (Meng, 2012). The amber box enables China to pay up to 8.5% of the value of its agricultural production. This percentage was to 3.47% in 2009, so regardless of in which category the grain subsidies fall, it was in line with WTO regulations (Meng, 2012). There are no suitable theories available about the impact of agricultural subsidies on rural-urban migration decisions. To my knowledge, the difference-in-difference study by Meng (2012) in the 11
12 Hubei province is the only study that has examined the impact of grain subsidies on migration in China, who found a negative impact. However, the effect could also be positive, depending on the institutional and agro-ecological settings of a region Price support policies Despite the dramatic increase in the amount of grain subsidies, this was outpaced by the increase in production costs on the national level in China. As Gale (2013) examined, the cash expenses grew with 214 yuan per mu for corn, wheat and long-grain rice and with 428 yuan per mu for short-grain rice between 2003 and 2011, which exceeded the increase in grain subsidy payments (Gale, 2013). The increase in these expenses was mainly due to increases in family labour costs and costs for fertilizer, mechanization and seed (Gale, 2013). As production costs outpaced the increase in grain subsidies, the Chinese government began to increase price supports to support farmers. Minimum prices for each commodity were formulated after 2008 in the context of the Price Formation Strategy (Gale, 2013). According to Gale (2013), Chinese authorities do not reveal how support prices are determined, but documents indicate that prices are set based on production costs, prices of related commodities, and general market conditions (Gale, 2013: 17). The main objective behind this strategy was an insurance that prices for commodities would not fall. Artificially rising commodity prices by the government, however, has the risk of farmers keeping their commodities as long as possible. Authorities tried to prevent this by announcing prices before planting decisions were made (Gale, 2013). Since the rice production is the dominant production mode in the northeast of Jiangxi province, price supports could have influenced the livelihoods of the agricultural producers in the three survey villages. 2.3 Rural-urban migration Since the barriers on migration from rural to urban areas have been gradually reduced in the 1970s and 1980s, China may have experienced the largest flow of internal migration in history (Hu et al., 2011). As noticed in the introduction, the urban population in China increased with 440 million from 1979 to 2009, with about 340 million attributable to migration and reclassification (Chan, 2013). The development of urban food and labour markets, the expansion of the urban and export-oriented sectors, the rural-urban income gap, rural labour surplus, land scarcity, rural market failures, exposure to agricultural fluctuations and remittances are some of the pull- and push factors that could have affected the rural-urban migration flow (Hu et al., 2011; Meng, 2012). Rural people are free to move between cities and their homes, but most of the migration is circular since rural people are often denied permanent urban residency rights and associated social benefits according to the hukou system (Hu et al., 2011). Migration in China has been regulated to prevent a rural exodus, hukou means household registration. Migration within urban or rural areas is generally permitted, however to permanently migrate between different hukous e.g. from rural to urban areas- requires approval from authorities which is usually difficult to attain for ordinary persons (Chan, 2013). Urban hukou is usually only granted to rich or well educated rural inhabitants who are related to existing urban inhabitants (Chan, 2013). The hukou system makes migration therefore mainly a temporary and has migrants separated from their families (Zhao, 1999b). Moreover, since education in the city is only tuition-free for urban residents, most migrant workers leave their families behind to come back when financial circumstances are sufficient (Zhao, 1999b). In the case of the three study 12
13 villages, most migration will therefore be circular migration which also implies considerable travel costs (Shi et al., 2007). Migration can be an income generating and -diversification strategy which can be caused by different push- and pull factors. The decision to participate in rural-urban migration activities is environmentdependent. Local institutions and household assets such as human- or social capital have an influence on the profitability and accessibility of migration (Shi et al., 2007). Migration and other types of off-farm employment appear to be positively linked with household asset levels, favouring the more affluent households in India (Jayaraman & Lanjouw, 1999). The relatively rich households would then profit most from remittances. However, migration might be important for liquidity constrained households as well, where urban incomes could enable them to invest in their rural livelihood (Shi et al. 2007). Different models to analyse (rural-urban) migration are reviewed by Taylor & Martin (2001) and both the Harris-Todaro and New Economics of Labour Migration (NELM) model seem to be relevant theories for this study. The following sections will elaborate both models Harris-Todaro model The Harris-Todaro model explains rural-urban migration by the rural-urban income gap; if a higher expected income can be obtained in urban centres, rural inhabitants will migrate to urban areas. Expected urban income is the product of expected formal and informal urban wages, but also of the probability of getting a formal job (Taylor & Martin, 2001). A high expected wage combined with a low probability of securing a formal job may result in a lower expected urban income than rural income. The Harris-Todaro model does not account for risk and uncertainty since individuals are assumed to be risk-neutral, therefore expected income maximization is the only factor involved in the decision whether or not to participate in rural-urban migratory activities (Taylor & Martin, 2001). Individuals could however anticipate on the probability of getting a job. Social networks, for example, could increase the probability of securing an urban formal job and therefore stimulate rural-urban migration. Income by means of grain subsidies increase rural income and could narrow the rural-urban income gap. Grain subsidies would then have a negative effect on rural-urban migration. However, if remittances would increase the expected rural income, it could also have a positive impact on migration. Moreover, the grain subsidies could be used to finance the initial costs of migration, for example costs of transportation, housing and finding employment New Economics of Labour Migration Where the Harris-Todaro has no place for risk and uncertainty and remittances, the New Economics of Labour Migration (NELM) has (Taylor, 1999). The NELM takes the household as starting point, assuming that households work jointly to maximize income and funds to invest in new activities and minimize risks in production and income (Meng, 2012; Taylor, 1999). It takes remittances into account in the sense that remittances loosen production and investment constraints (Taylor, 1999). The NELM stresses that migration could help overcome credit constraints, through remittances, and insurance constraints, through income-diversification (Shi et al., 2007). As a lump sum payment, grain subsidies could decrease the need for income-diversification by loosening income constraints (Meng, 2012). This theory is particularly interesting because it focuses on the factors that have an 13
14 impact on migration on the household level, taking into account several household assets and individual characteristics, which will be done in this study as well. Both theories could imply a negative and positive relation between grain subsidies and (rural-urban) migration. Taylor (1999) stresses another migration-and-remittance theory; the Dutch Disease. This extreme theory argues that lucrative rural-urban migration is a self-perpetuating process, where the exportation of labour leads to crowding out of local production of tradable goods (Taylor, 1999). The reality will lie somewhere between the NELM and the Dutch Disease theory, and with the implementation of the hukou system, the Chinese authorities have taken measures in order to reduce the potential Dutch Disease effects on local rural economies. 2.4 Discussion This section has presented the main concepts used in this study, presented some background information on grain subsidies and (rural-urban) migration in China which both have seen increasing trends in the past decades, and discussed two models for explaining migration, the Harris-Todaro model and the New Economic of Labour Migration. These models will have a minor role during the analyses, but will be referred to in the discussion. Also, the results during this study may give insights to which extent the goals behind the rural policy transition have been achieved. 14
15 Chapter 3 Trends and Major Developments 3.1 Introduction This chapter will provide information about trends and developments concerning the rural livelihoods in Banqiao, Shangzhu and Gangyan. Data from 2000, 2005 and 2010 are used to examine developments in grain subsidies, migration and off-farm employment, individual characteristics of the household members, household assets and income and output data. As the main objective of this study is to analyse the impact of grain subsidies on migration, several of the individual and household assets that will be discussed in this chapter will be used as explanatory variables in the regression analyses to control for the impact of grain subsidies. It is therefore important to clearly examine trend in these data over time and their influence in Comparisons between the survey years and -villages will be made in order to develop a feeling about the data, before starting the regression analyses. The sub-question for this chapter is formulated as follows: What were the trends in grain subsidies, migration and off-farm employment, and other major developments in household assets and output levels in the northeast of Jiangxi province between 2000 and 2010? Previous studies by Shi et al. (2007), Meng (2012) and Zhao (1999a, 1999b) studied the impact of grain subsidies or other household assets on migration. This chapter will examine trends in the assets that may impact the decision whether or not to migrate, according to those studies. The impact of these assets on migration in the three villages in the northeast of Jiangxi province will be examined in Chapter 4 and Chapter 5. This chapter will start with introducing the dataset for the three survey years and give a short introduction on the survey-villages. It will then examine trends in grain subsidies, migration and local off-farm employment on the household level and the other above mentioned household assets. 3.2 The dataset The dataset contains individual and household survey data collected in three villages in the northeast of Jiangxi province in 2000, 2005 and It contains a broad range of data about grain subsidies, migration, characteristics of individuals and household assets. The three study-villages have different characteristics which are considered representative for the rural diversity in the northeast of Jiangxi province, a relatively poor region where rice growing is the dominant agricultural production mode (Shi et al., 2007). Important difference between the villages is the quality of infrastructure, the distance to towns and the access to markets. These and geographical differences implicate differences in accessibility and profitability of migration and local off-farm employment (Kuiper at al., 2001). However, it is not clear to which extent the infrastructure and access to markets have developed since 2000, since no data about that is available. A short introduction into the villages will be given on the basis of information from Banqiao is located in a hilly area, where rice, peanuts and fruits are the main crops produced. The village is located close to markets, but the roads are bad. 15
16 Shangzhu is located in mountainous area, relatively isolated with a very bad infrastructure. Footpaths connect most hamlets and the main crops produced are rice and bamboo. Gangyan is a larger village located in a plain area. Rice and vegetables are the main crops produced, with good roads connecting the village. Especially Shangzhu and Gangyan have to deal with larger within-village differences too. Some of the hamlets are close to each other, while others are more isolated. In Shangzhu, some of the hamlets in the mountains can be qualified as remote, requiring a two hours walk from the village office. In Gangyan, hamlets on the other side of the river are more isolated (Kuiper at al., 2001). In Table 1, the sample sizes of the surveyed households per village for each year are summarized. As can be seen from the table, Gangyan accounts for slightly more than half of the observations, and Shangzhu for almost one-third. Table 1 - Sample size per village per year. Village Number of observations Share within sample (%) Number of observations Share within sample (%) Number of observations Banqiao Shangzhu Gangyan Total Share within sample (%) 3.3 Grain subsidies The main objective of this study is to analyse the impact of grain subsidies on rural-urban migration. Each survey contains data about the amount of subsidies received in yuan. The 2000 and 2005 survey distinguishes between money transfers from the village and money transfers from the government. For my study, I will define subsidies as money transfers from the government for the years 2000 and In the 2010 survey, the amount of subsidies is explicitly asked and is disaggregated by type of subsidy. I will use the total subsidies variable for the comparison with 2000 and The total and average amount of grain subsidies per household and the average amount of grain subsidies per mu of irrigated land per year and per village are given in Table 2. Note that the average grain subsidies per mu are based on the contracted irrigated land used for rice production, without the rented-in irrigated land in this table. The average grain subsidies per mu of irrigated land is added, because the amount of grain subsidies that is received by households is usually based on the contracted land, the actual grain sown area or the taxable grain production area for a regular year before taxation was abolished (Yi et al. 2015). Both the total and average amount per household of grain subsidies have been increasing between 2000 and In 2000, only four households received grain subsidies in Shangzhu, of which the total amount was 941 yuan. After the introduction of the grain subsidies in the early 2000s, the mean grain subsidies per household in the dataset almost tripled between 2005 and This is in line with the increase in grain subsidies examined by literature provided by Meng (2012) and Gale (2013). Gale (2013) found that the combined total of different types of grain subsidies grew from 7.5 yuan per mu in 2004 to 65 to 107 yuan per mu in 16
17 2012. The average grain subsidies per mu were more than 4 times higher in the three surveyed villages in 2005 as compared to the national level in In 2010, the amount of grain subsidies in the three survey villages was in line with the trends on the national level in 2012; the average grain subsidies per irrigated mu in Banqiao were 100 yuan, in Shangzhu 62.2 and in Gangyan 116. Table 2 - Grain subsidies received per village and year (yuan) Village Banqiao Total subsidies 0 11,991 37,209 Average per household Average per irrigated mu Shangzhu Total subsidies ,635 22,540 Average per household Average per irrigated mu Gangyan Total subsidies 0 32, ,811 Average per household Average per irrigated mu Total Total subsidies , ,560 Average per household Average per irrigated mu The mean amount of grain subsidies per household in Shangzhu in 2005 and 2010 was more than 60% lower as compared to households in Banqiao and Gangyan. Also, the mean grain subsidies per irrigated mu were relatively low in Shangzhu. As examined later in this chapter, rice producers in Shangzhu mainly produce one rice harvest per year, as opposed to two rice harvests in Banqiao and Gangyan and the mean irrigated land per household is also relatively low. These factors could impact the lower mean amounts of grain subsidies in Shangzhu. The trends in grain subsidies in the three villages show results that are in line with national trends. Both the increase in total amount of grain subsidies and the average grain subsidies per mu of irrigated land suggest that the amount of grain subsidies in the three villages are more or less similar to mean national subsidy levels in China. 3.4 Migration and local off-farm employment Migration and off-farm employment are ways of establishing income diversification. Following the definition used by Shi et al. (2007), migration is defined in this study as household members living outside the village during the surveyed period. The migrated people are still counted as household members because they keep close contacts with household members still living in the rural origin and often send money back (Shi et al. 2007). Moreover, because of the hukou system, migrants will still be registered in their rural origin. This definition of migration doesn t imply rural-urban migration. However, 66% of the households had a household member living outside the county, and 61% outside the province in Assuming that migrants would only leave their county for urban jobs, these percentages would indicate that the dominant mode of migration would be from rural to urban areas. Table 3 shows the percentages of households with at least one member involved in migration or other type s off-farm employment in the three years and three survey villages. 17
18 Table 3 Households participation in migration and off-farm employment. Banqiao (%) Shangzhu (%) Gangyan(%) Total (%) Migrated Agricultural employment Nonagricultural employment Selfemployment Migration is more common than engaging in local off-farm work in all three villages in all years. The migration rate has been increasing in Banqiao and Shangzhu between 2000 and 2010, but declined in Gangyan during this period. In Banqiao, this share showed the most significant increase between 2005 and 2010, while in Shangzhu this happened earlier between 2000 and For the three villages as a whole, the share increased from 66.2% in 2000 to 72.0% in The migration rate in Gangyan was already high in 2000, and it shows a decreasing trend from 76.2% in 2000 to 68.7% in People who engage in local off-farm employment still reside in the household. Local off-farm employment often occurs in the three surveyed villages and is distinguished between local agricultural employment, local non-agricultural employment and self-employment. Local agricultural employment is local off-farm agricultural work as crops harvesting or rice transplanting. Local nonagricultural work accounts for non-agriculture related local work as house building and teaching. Selfemployment includes shop-keeping, transportation and other business-related employments (Shi et al. 2007). The household with at least one member working in agricultural employment had a peak in 2005 in all villages and decreased again in A good harvest of certain grains or crops could increase temporary job opportunities in agricultural employment and could have affected this peak in Non-agricultural employment increased between 2000 and 2010 in Banqiao and Gangyan and slightly decreased in Shangzhu. The less remote location of Banqiao and Gangyan could be a factor in creating more non-agricultural employment opportunities and therefore explain the divergent trend. Self-employment shows a fluctuating pattern, and has slightly decreased between 2000 and The fluctuating trends observed in these variables suggest that people still living in the household can easily shift between different types of local off-farm opportunities. Looking at the general trends in grain subsidies and migration, it can be concluded that both grain subsidies and migration show increasing trends between 2000 and The only major exception is the declining migration rate in Gangyan during the same period. 3.5 Individual and household assets This section will elaborate developments in individual characteristics of the household members and household assets that could impact migration. Individual characteristics are concerned with human capital. Individual human capital characteristics of the household members have been aggregated to the household level since the regression analyses of the following chapters will purely use household-level data. This section will follow the example set by the study by Shi et al. (2007), who 18
19 selected individual and household characteristics that could impact migration. It will first examine the human capital characteristics of the households in section and then examine trends in household assets in section Human capital and characteristics of the individual The aggregated human capital characteristics of the household members will be examined for the household s labour force. The household s labour force contains the male and female household members between 15 and 66 years old. This does not account for people within this age group unable to work, but the dataset provides no data about this. The human capital characteristics of the household examined in this section are mean age in years, mean years of education and mean gender where 1 is male. Table 4 provides the data for these characteristics for the three survey years and survey villages. The mean age of the labour force has been increasing between 2000 and The increased life expectancy between 2000 from 2010 from to in Jiangxi (United Nations Development Program, 2005, 2013) could have influenced this. The mean education of the labour force household members has been increasing between 2000 and 2010, with a dip for Banqiao in Over the period 2000 to 2010, it increased with 33% in Banqiao, 28% in Shangzhu and 16% in Gangyan. The mean years of education for the households in the full sample has been most increasing between 2005 and 2010 by more than 17%. Predominantly younger persons are added to the labour force and the increase in mean years of education of the labour force indicates that younger generations had more possibilities for schooling. There are slightly more males than females in the labour force age category for every survey village and year. Especially in Banqiao in 2005, males were abundant. Table 4 Aggregated characteristics of labour force members per village Village Banqiao Shangzhu Gangyan Total Age (in years) Education (in years) Gender (1=male) Household assets This section will focus on trends on household-level assets. The mean labour force and the number of dependents per household, the total irrigated- dry- or forestland that is used by the household, and several assets that indicate mechanization trends will be examined. Moreover, the mean current value of durables has been calculated for each year and village to give an indication about the wealth level in the villages. Table 5 contains the average number of labour force members per household per survey village and year and shows increasing trends in the full sample between 2000 and 2010, with a dip for Banqiao and a peak for Gangyan in The increased life expectancy suggests that people in Jiangxi province will more often reach the age 67, which would in combination with younger people entering the labour force result in a larger labour force. 19
20 Table 5 Average number of labour force members in the household 1 Village Banqiao Shangzhu Gangyan Total Table 6 shows the number of dependents per households and the amount of land distinguished per land type per household. Dependents are distinguished by children between 0 to 7 years old and elderly above 67. Both the mean number of children in the households as the number of elderly have been increasing between 2000 and 2010 in the villages, indicating a higher birth rate and life expectancy. The irrigated land is divided by contracted and rented-in irrigated land. The contracted irrigated land is the contracted irrigated land used for rice production. Note that households may have contracted irrigated land, but decide to rent it out instead of using it for rice production. These households are left out of this table. The mean contracted irrigated land used for production has been increasing between 2005 and 2010 in Banqiao, while Shangzhu and Gangyan show a decreasing trend between 2000 and The rented-in irrigated land per household saw an increase in Banqiao and Gangyan between 2005 and The total cultivated irrigated land is the sum of the contracted and rentedin irrigated land used for rice production. Especially the increase in rented-in irrigated land in Banqiao and Gangyan resulted in total cultivated irrigated land levels that are more or less twice as big as in Shangzhu in Irrigated land is generally more fertile than dryland and forestland and is generally used for rice production in the survey villages. Government policies surrounding the rural policy transition could have pushed households in Banqiao and Gangyan to increase the mean irrigated land per household. However, there is only a relatively fixed limited amount of irrigated land available. Complete household could have been migrated to urban areas, despite the hukou system, for example for an informal urban job. Also, migration between rural areas is hardly restricted and the migration of complete households would explain the increase in rented-in irrigated land for the households still settled in the villages. The contracted forestland per household has been increasing between 2005 and 2010 in Shangzhu rather than the total cultivated irrigated land. The managed forestland per household has been increasing in Banqiao and Gangyan as well, but to a lesser extent. Tenure reform in forestland occurred in Jiangxi province in 2004, where much of the collectively managed forestland was distributed to individual farmers in order to prevent deforestation and degradation (Holden et al., 2011; Xu et al., 2010). Moreover, tenure reforms for forestland have been introduced in order to provide tenure security to stimulate investments and create economic growth (Holden et al., 2011), and this led increases in the amount of managed forestland in the three villages between 2005 and Dryland had a minor role in the three survey villages in each year. 1 This table leaves all the households with no members in the labour force out. 20
21 Table 6 Household resources and characteristics. Banqiao Shangzhu Gangyan Total Children 0-7 years Elderly 67+ years Contracted irrigated land (in mu) Rented-in irrigated land (in mu) Total cultivated irrigated land (in mu) Dryland (in mu) Forestland (in mu) To get insights in developments in mechanization in the three villages between 2000 and 2010, Table 7 shows the percentages of households with at least one tractor, irrigation pump or motorbike for all survey years and villages. The percentages increased for each of these assets between 2000 and 2010, especially for motorcycles. The percentage of household with a motorcycle was lower in Banqiao, perhaps since Banqiao is already located close to markets and the need for motorcycles is lower than in the other villages. The amount of irrigation pumps and tractors have been increasing in villages with most cultivated irrigated land, Banqiao and Gangyan. The absence of tractors in Shangzhu is probably due to the more mountainous geographical circumstances and other non riceproduction priorities as compared to the other two villages. Table 7 also shows the current value of production- and consumption durables. Production durables are durables related to production, for example tractors or stables. Consumption durables are for example TV s or mobile phones, durables that are not directly related to production. The current value of durables increased to a large extent between 2000 and It decreased after 2005 in Shangzhu, this peak could be caused by the high engagement in off-farm agricultural employment in In Banqiao and Gangyan, the current value of durables grew with respectively 87% and 6% between 2005 and Table 7 - Households with at least one of the farm-related assets and the mean current value of durables. Banqiao Shangzhu Gangyan Total Tractor (%) Irrigation pump (%) Motorcycle (%) Current value of durables (in yuan) 1,814 3,109 5, ,434 3,441 1,840 5,150 5,465 1,545 4,590 4,903 21
22 3.6 Trends in rice output and household income Section will elaborate the trends in household s rice output and revenue for each year and each village. Developments in the rice mean output, yield and revenue will be examined in order to give insights in development of rice production, one of the main concerns behind the rural policy transition. Section will elaborate trends in the incomes of households. During the elaboration of the output and income trends, it became clear that many values of forest, vegetable and other non-rice crop production in the 2010 dataset deviated to a very large extent from their values in 2000 and Because these values caused extremely high revenues in 2010 and since the focus of my study is on grain subsidies, the data on forest-, vegetable and other non-rice crop production for 2010 are left out of the analysis in this section. Therefore, this section will examine trends in income by comparing the net farm incomes including the rice, forest, vegetable and other non-rice crop revenues and expenditures for 2000 and 2005 and compare adjusted income with only cash and noncash rice and straw revenues and expenditures as farm incomes for 2005 and 2010 to give an impression about income developments despite not being able to use all output variables. Because of this, the trends in revenues from forestland, which may have occurred due to tenure reforms for forestland, will not be presented. Income from local off-farm employment, remittances and other sources of income will be added to the net farm income calculations in order to present the net household incomes Rice output The total cultivated irrigated land and the higher amount of grain subsidies indicate that rice production was more common in Banqiao and Gangyan than it was in Shangzhu. Table 8 shows that in Shangzhu, most households had one rice harvest per year, while in Banqiao and Gangyan, most households had two harvests per year. Note that double-season producers also may have had plots with one-season rice production, but are here accounted for as double-season rice producers. The number of households with double-season rice production has been decreasing in Shangzhu between 2000 and In 2005, more households in all villages were not producing rice as compared to 2000 and As with the peak of engagement in off-farm agricultural employment in 2005, a good harvest of certain other crops could have shifted to focus from rice production to other crops in 2005 for some households. However, most of the households produced rice in Table 8 Percentages of households rice harvest per year per village. Banqiao (%) Shangzhu (%) Gangyan (%) Total (%) No rice production Single-season rice production Double-season rice production Table 9 shows the mean rice output for each harvest and the mean total rice output in jin per village and per year. Shangzhu had always the lowest mean rice output between 2000 and The mean rice output per household has doubled in Banqiao between 2005 and 2010 and grew with more than 22
23 30% in Gangyan, while this decreased in Shangzhu in this period. The trend towards single-season rice production between 2000 and 2010 seems to have affected the lower yearly mean rice output in Shangzhu. The increase in mean rice output per household corresponds with the increased total cultivated irrigated land per household in Banqiao and Gangyan. The rice yield per mu was higher in Banqiao and Gangyan as compared to Shangzhu because of the predominance of double-season rice producers and the rice yield per mu in these villages saw an increase of around 30% between 2005 and Mechanization in the sense of an increase in number of households with a tractor or irrigation pump may have had an impact on the higher rice yields per mu in Banqiao and Gangyan. The increase in rice yield indicates that the rice output developments are in the direction of the concerns behind the rural policy transition between 2005 and Table 9 Mean household rice output and yield per cultivated irrigated mu per village per year. Banqiao Shangzhu Gangyan Total Output (jin) Early rice 3,955 3,611 8, ,915 3,644 5,580 2,291 2,617 4,407 Late rice 5,401 3,769 5, ,621 3,357 5,767 2,891 2,502 4,006 Single-season ,183 2,762 2,908 2,267 1,799 1,507 1,072 1,893 1,763 1,621 rice Mean rice 9,788 7,859 15,860 3,541 3,479 2,757 8,336 8,509 12,420 7,075 6,883 10,035 Rice yield (jin per cult. mu) 1,270 1,023 1, ,010 1, ,077 Table 10 shows the mean rice price, aggregating early-, late- and single-season rice prices per village and year. The rice prices have more than doubled between 2000 and The price support policies of the Chinese government may have affected this. As Gale (2013) examined, the minimum price of rice per metric ton almost doubled between 2007 and 2012 in order to outpace rising production costs and the increase in rice prices in the villages are in accordance with this trend. The mean cash and non-cash rice revenue is also examined in Table 10. These are the rice output times the sell price, so rice expenses are not taken into account. As could be expected from the increasing trends in rice prices and the mean rice output, the cash and non-cash rice revenues increased to a large extent in Banqiao and Gangyan. This level tripled between 2005 and 2010 in Banqiao and almost doubled in Gangyan. An increase in rice revenues can also be seen in Shangzhu, where the mean rice output decreased between 2005 and 2010, but the mean rice price increased to such an extent that rice revenue increased. Table 10 Mean rice price and cash and non-cash rice revenue per village per year Mean rice price (yuan per jin) Mean rice revenue (yuan) Banqiao Shangzhu Gangyan Total ,539 4,961 16,310 1,776 1,226 2,775 3,928 5,907 12,352 3,319 4,319 9,205 23
24 3.6.2 Household income After examining trends in rice production, this section will examine the aggregated farm- and household incomes of the households in the survey. Shi et al. (2007) made a separation between farm and household income, and their example will be followed. The farm net income is defined as the farm revenue minus the farm expenses, excluding farm-related bought or sold assets. For 2005 and 2010, grain subsidies are added to the farm net revenues, to give an indication of the share of grain subsidies in the farm incomes. Household net income is defined as all sources of revenues of households on-farm and off-farm- minus the farm expenditures, also not taking into account expensed on consumption and bought assets. Farm and household revenues are the revenues without subtracting farm expenditures. Table 11 contains the aggregated revenue, expenditures and income data for 2000 and The farm revenue exists of cash and non-cash revenues from rice, vegetables, livestock, forest and other non-rice crops. The farm expenditure consists of expenses on the production of these crops. The household revenue adds remittances, off-farm incomes and other sources of income to the farm revenue. There are some differences between the income calculations for these years. The farm expenditure of 2000 takes into account the cash and non-cash rent income, while the 2005 data only take cash income into account and leaves out the non-cash expenditure on rented land, since no data are available on this in the dataset. There are two household with negative household revenues in These negative revenues were caused by negative amounts of remittances, which were caused by household members who migrated to study and needed money. Households could get this money from savings, which are not accounted for in the analysis. The total mean farm net income grew with 32% between 2000 and 2005, mainly due to increased farm revenues in Shangzhu and Gangyan and decreased farm expenditures. This is remarkable since on the national level in China, production costs rose in the past decade (Gale, 2013). The rice cash and non-cash revenue in Shangzhu decreased between 2000 and 2005, indicating that a large share of the increase in net farm income would come from other crops. The farm revenue with subsidies is only around 2.3% higher than the farm revenue without subsidies, suggesting a minor role of the subsidies in farm net incomes in 2005, which is in line with the conclusion by Huang et al (2011). The total mean net household incomes grew with 53% between 2000 and 2005, which is more than the farm net income. This indicates that the increase in engagement in migration, with returning remittances and other local off-farm employment types as the high engagement in local agricultural off-farm employment have led to increased household revenues between 2000 and As can be seen in Table 3, the households engagement in local agricultural employment had a peak in every village in 2005 and Table 13 shows that the mean incomes per off-farm employment type increased in the full sample. Table 13 also shows that the mean amount of remittances increased in every village between 2000 and Gangyan appears to be the wealthiest village in 2000 and 2005 in terms of revenues and income. The total cultivated irrigated land and rice production were highest in Gangyan in these years and migration was most common. The mean net household income more than doubled in Shangzhu between 2000 and 2005, which seems due the increase in local off-farm employment incomes and remittances, as examined in Table 13. In Banqiao, the household revenue was more or less constant and the increase in household net income seems due to the decrease in farm expenditures. 24
25 Table 11 Aggregated household income for 2000 and 2005, full sample. Income (yuan), 2000 Mean income per village (yuan), 2000 N Min Max Mean St. Dv. Banqiao Shangzhu Gangyan Total farm revenue ,038 6,676 4,488 8,567 4,331 7,589 Total farm ,392 3,026 2,556 4,020 2,004 3,369 expenditures Total farm net ,622 3,650 3,436 4,546 2,327 4,220 income HH revenue ,675 11,778 9,339 12,694 7,435 14,229 HH net income ,055 8,709 8,953 8,710 5,464 10,820 Income (yuan), 2005 Mean income per village (yuan), 2005 Total farm revenue ,064 7,372 7,154 7,818 4,686 8,787 (excl. subsidies) Total farm revenue ,589 7,543 7,234 8,048 4,816 8,962 (incl. subsidies). Total farm ,880 2,736 3,485 2,658 1,574 3,434 expenditures Farm net income 311-6,515 43,569 4,806 5,476 5,390 3,242 5,528 (incl. subsidies) HH revenue , ,823 16,032 19,220 12,950 14,486 17,906 HH net income , ,330 13,296 18,623 10,292 12,911 14,471 Table 12 shows the aggregated data of the adjusted revenues, expenditures and incomes for 2005 and 2010 for all villages. The adjusted data leave out the revenues from forest, vegetable and other non-rice crop production and instead only takes rice and straw cash and non-cash revenues and expenditures into account for the net farm income. The mean farm revenue more than doubled between 2005 and 2010 in the full sample, which was mainly caused by higher farm revenues in Banqiao and Gangyan, which is in line with the high mean rice output as found in Table 9. The mean farm net income 2010 was 58% higher in 2010 than the mean net farm income in 2005, but did not increase to the extent as the mean farm revenues did, which is due to the increase in total farmrelated expenditures, as was expected from the literature by Gale (2013). The farm related expenditures were more than 4 times higher in 2010 as compared to The increase in farm net incomes can partly be attributed to the increase in rice prices, as examined in Table 10, which underlines the positive income impact of the price support policies. The mean household net incomes were higher than in 2005, especially in Banqiao, where it more than tripled. A dramatic increase in non-agricultural incomes and remittances (see Table 13) combined with the increased farm net incomes seem to have caused this. Gangyan encountered a large increase in household incomes between 2005 and 2010 as well, partly attributable to increased farm net incomes, as well as increases in non-agricultural and self-employment off-farm incomes. Shangzhu was poorest village in The high amount of contracted forestland in Shangzhu indicated that a relatively large share of the farm revenues in Shangzhu came from other crops than rice which are left out of these calculations. In reality, thus, the farm revenue levels between Shangzhu and the other villages could have developed less divergent between 2005 and
26 In general, incomes from local off-farm employment and remittances accounted for a large part of the increase in household net incomes between 2005 and 2010, indicating that incomediversification strategies were common in the villages. Remittances have been increasing between 2000 and 2010 in Banqiao and Shangzhu, but have been slightly decreasing between 2005 and 2010 in Gangyan in line with the migration rates. Off-farm incomes in the full sample have been generally increasing, except for income from agricultural off-farm employment. The share of grain subsidies in the adjusted farm revenues in 2010 was 4.2% as opposed to 2.7% for This suggests that subsidies have thus been increasing in the share of farm revenues, however, this share of subsidies remains minor and would have been smaller when revenues from non-rice crops would have been included in the analysis. The mean amount of subsidies per household in 2010 year was almost three times higher than in 2005, as examined in Table 2, but its share in farm revenue did not grew to such an extent since farm revenues grew dramatically. The main component in this increase in farm revenues of the three villages seems therefore not the increase in grain subsidies, but the rather the increase in rice revenues due to price support policies. Moreover, the increase in income from local off-farm employment and remittances accounted for a large part of the increase in household net incomes. Table 12 - Aggregated adjusted household income for 2000 and 2005, full sample Adjusted income (yuan), 2005 Adjusted mean income per village (yuan), 2005 N Min Max Mean St. Dv. Banqiao Shangzhu Gangyan Total farm revenue ,194 6,356 6,250 7,115 3,179 7,955 (excl. subsidies) Total farm revenue ,719 6,527 6,337 7,346 3,309 8,131 (incl. subsidies). Total farm ,290 1,464 1,657 1, ,886 expenditures Farm net income (incl ,244 33,610 5,063 5,350 5,498 2,785 6,244 subsidies HH revenue , ,837 15,016 18,549 12,247 12,979 17,074 HH net income , ,526 13,552 18,301 10,400 12,455 15,187 Adjusted income (yuan), 2010 Adjusted mean income per village (yuan), Total farm revenue ,171 12,423 14,314 20,028 3,417 15,248 (excl. subsidies) Total farm revenue ,031 12,950 14,526 20,744 3,652 15,886 (incl. subsidies). Total farm ,480 4,118 5,660 5, ,594 expenditures Farm net income (incl ,867 8,832 11,198 14,841 3,053 10,292 subsidies HH revenue ,667 28,283 28,173 38,579 16,760 31,722 HH net income 314-6, ,036 24,165 26,680 32,677 16,161 26,128 26
27 Table 13 - Mean household yearly incomes from different types of off-farm employment and remittances in yuan, full sample. Banqiao Shangzhu Gangyan Total Off-farm employment type Agricultural ,043 1, Non-agricultural 713 1,716 10, , ,228 6, ,196 6,413 Self-employment ,743 3, ,248 3, ,477 2,843 Remittances 1,315 2,281 5, ,885 3,559 2,354 5,181 4,605 1,729 3,689 4, Discussion This chapter has examined trends on the household level in subsidies, migration and off-farm employment, individual characteristics, household assets, rice output and farm and household income. Subsidies increased in each village according to national trends. Gangyan and Banqiao received more subsidies per contracted irrigated mu, which was due to the predominance of doubleseason rice harvests as opposed to single-season rice harvests in Shangzhu and more contracted irrigated land used for rice production per household. However, the share of grain subsidies in the farm revenue and net household incomes was minor. Migration is very common in all three villages: a total increasing trend between 2000 and 2010 was observed and only a small decline in Gangyan between 2005 and Developments in individual characteristics of the household member were more or less similar between the villages. Differences occurred in the engagement in the different types of off-farm employment, the type of land owned by the households, household assets, rice production and revenues and income. Cultivated irrigated land increased in Banqiao and Gangyan between 2005 and 2010 as well as the rice production, yield and revenues and the production related assets as irrigation pumps and tractors. Forestland increased as well in the context of the land tenure reforms in China. In general, Banqiao and Gangyan were the wealthiest villages in 2010 in terms of household assets and net household income. Whereas Gangyan has always been relatively wealthy since 2000, Banqiao saw the biggest increase in net household income between 2005 and Shangzhu was the least wealthy village in terms of household assets and net household income in 2000 and In Banqiao and Shangzhu, the increase in migration was accompanied with increases in household revenues, indicating a high profitability of migration. Although the mean household net household incomes increased in every village, these increases were highest in Banqiao and Gangyan. The predominance of single-season rice in Shangzhu as opposed to double-season rice in Banqiao and Gangyan caused differences in rice revenues between the villages. When including the revenues from other commodities in 2000 and 2005, Shangzhu still had the lowest net farm incomes. The increase in rice prices outpaced the increase in rice expenses. Price support policies, therefore, seem to have impacted the income levels in the villages to a larger extent than the grain subsidies and seem to have addressed the concerns behind the rural policy transition better than the grain subsidies. However, concrete levels of the support prices are not available. 27
28 Chapter 4 will use regression analysis to examine to which extent some of the described individual characteristics and human capital and (relatively) fixed household assets affect migration decisions of households in these three villages. The selection of variables of interest will be done on the basis of the studies by Shi et al. (2007) and Zhao (1999a). Chapter 5 will examine this on the individual village level and will therefore focus on the between-village differences elaborated in this chapter. 28
29 Chapter 4 Regression Results 4.1 Introduction In this chapter, the impact of grain subsidies on rural-urban migration in 2010 will be examined for the full sample with the use of binary logistic regression analysis. In the previous chapter, it occurred that the relative amount of grain subsidies in the farm net revenues was only minor and this chapter will explore whether grain subsidies had any positive or negative impact on migration in A selection of explanatory variables concerning fixed assets of the household, which have been examined in Chapter 3, will be used as explanatory variables in order to clarify the relationship between the grain subsidies and rural-urban migration rate and to examine the impact of these explanatory variables individually on migration. This selection will be based on the studies by Shi et al. (2007) and Zhao (1999a). No unequivocal hypothesis is formulated for the impact of subsidies on migration since the impact could be positive, negative or insignificant and other explanatory variables could influence this. The sub-question for this chapter has been formulated as follows: What was the impact of grain subsidies, individual characteristics and household assets on rural-urban migration in the three surveyed villages in 2010? This chapter will start with examining the explanatory variables used in the regression analyses and the adjustments that have been made as compared to the study by Shi et al. (2007). The expected impact of each explanatory variable on migration is presented after which a general introduction into binary logistic regression is provided. The first regression analyses will only contain household characteristics. The second regression will add (relatively) fixed household assets. These two regressions will provide insights in the impact of individual and household characteristics and (relatively) fixed household assets on migration. The third regression will add the subsidies to the regression with individual characteristics and (relatively) fixed household assets to examine the impact of subsidies on migration for the full sample. 4.2 Model specification This section will specify the explanatory variables included in the regression analyses as well as formulate the expected impact of each explanatory variable on migration Explanatory variables Binary logistic regression is multiple regression with a categorical dependent variable and explanatory variables that could be categorical or continuous. It helps to predict which of two categories the household is most likely to belong to given the explanatory variables (Field, 2009). The household participation in rural-urban migration is a binary variable, and a logit regression with rural-urban migration participation as dependent variable and the explanatory household level fixedasset variables will be used to run the regressions. The model is specified as follows: Y i = β 1 + β 2 S + β 3 E + u Where Y i is the rural-urban migration binary variable, β 1 the constant and S the subsidy variable. E stands for the explanatory variables that are included in the regression analysis, β 2 and β s are 29
30 unknown coefficients and u stands for the error term. The dependent variable equals one if at least one household member lived outside the natural village in 2010 and equals 0 if this was not the case. The discussed grain subsidies and other explanatory variables are push factors. However, education and gender could be proxies for pull factors too, since better urban job opportunities could pull higher educated persons and males to urban centers. No information about possible urban pullfactors is available in the dataset. A major difference with the study by Shi et al. (2007) is that the dependent migration variable in their study represented the participation of an individual in migration (Shi et al., 2007), while the dependent variable in this study represents the participation of a household in migration. In this study, all explanatory variables have been aggregated to the household level. Several of the household output and income variables elaborated in the previous chapter are not included in the regression model. These variables are likely to depend on migration decisions and to avoid reverse causality, they will not be used in the regression analysis. Instead, assets concerning mean individual and household characteristics and (relatively) fixed assets that can be used for generating production and revenue will be used, as is done by Shi et al. (2007). The current value of durables and irrigated land are wealth indicators that are included in the regression analyses. The network variable, which was included in the study by Shi et al. (2007), is left out of the regression analyses, since this explanatory variable was based on the migrated household members; the networks outside the province were the household members who migrated. Because of endogeneity-considerations, the network variable was therefore left out. Table 14 shows the descriptive statistics for the explanatory variables used in the regression analyses. The renting dummy, which was not examined in Chapter 3, tells us whether a household rents out land or not. Table 14 Descriptive statistics of explanatory variables. Explanatory variable Variable definition N Min Max Mean Std. Dv. Age Mean age of household s labour force Education Mean education of household s labour force in years Gender Mean gender of household s labour force (1=male) Labour force Number of labourers (15-66 years) in the household Children Number of children between 0 and 7 years in , the household Elderly Number of elderly persons (67+) in the household Irrigated Cultivated irrigated land (mu) Dryland Contracted dryland (mu) Forest Contracted forestland (mu) Durables Current value of production and consumption ,00 54,790 4,903 5,659 durables (yuan) Renting Whether the household rents out land (1=yes) Subsidies Total amount of grain subsidies (yuan)
31 4.2.2 Expectations The following sections will examine the expected impact of the individual and household characteristics on migration Individual characteristics Several studies have elaborated the factors that could influence the individual s or household s decision to engage in migratory activities. Zhao (1999a) conducted a study on the factors impacting rural-urban migration decisions in the Sichuan province, finding that migrants tend to be younger, male, unmarried and have above-average education rates (Zhao, 1999a). Younger individuals often don t have the responsibility to take care of a family and are therefore less constraint in their migration activities. Moreover, younger persons with less responsibilities to take care of a family could more easily face the risk of being unemployed in the city and come back to the rural origin in periods of unemployment (Zhao, 1999a), or they could use their migration-related earnings to invest in rural-origin and come back after a few years to get married (Zhao, 2002). Older individuals are more likely to be involved in local on-farm work or off-farm employment instead of migration, since they are more likely to have experiences and contacts that are relevant for local off-farm employment (Shi et al. 2007). The squared term of age is included in the regression model to account for the nonlinearities in the impact of age (Shi et al 2007: 447). The mean education of the labour force is expected to have a positive impact on migration since people with more years of education are usually more productive and are therefore expected to have more opportunities to find off-farm employment. Male workers are more likely to find off-farm employment due to the predominance of typical male jobs and the traditional role of the woman in the family (Shi et al. 2007) Household characteristics Dependents (young children or elderly) require more assistance which could withhold household members from migrating. On the other hand, a higher income might be demanded to take care of the dependents which could stimulate migration (Shi et al. 2007). It is part of China s tradition that grandparents help to raise their grandchildren (Zhao 1999b), which would suggest that a negative impact of young children on rural-urban migration is unlikely when healthy elderly still live in the rural origin, able to provide assistance. However, this strongly depends on specific household circumstances. A large labour force of the household would most likely have a positive effect on participation in migratory activities, since a household labour surplus and limited possibilities for expanding local production (Shi et al. 2007) could push household members to seek employment opportunities outside the rural origin. Of the three types of land, irrigated land is the most common in the full sample. Since irrigated land is used for rice production, more irrigated land suggests a higher amount of grain subsidies for the household. Figure 2 shows the scatter gram of total amount of subsidies and contracted irrigated land used for production per household for the full sample and shows that generally, a linear relationship between subsidies and irrigated land exists. Still 37 households with irrigated land receive no grain subsidies: 5 in Banqiao, 17 in Shangzhu and 15 in Gangyan. According to Yi et al. (2015), the policy implementation of grain subsidies highly depends on the local governments policies. The historical grain production or contracted land could be used criteria for providing subsidies. It could therefore be a local government s decision not to give grain subsidies to new grain 31

32 producers who did not have previous grain productions. Moreover, 25 households without irrigated land did receive grain subsidies: 3 in Banqiao, 9 in Shangzhu and 13 in Banqiao. Perhaps they had contracted irrigated land in the past and still receive subsidies for that. Also, 7 of the 10 households in the full sample who did not use their contracted irrigated land for production, but rented out their land, received grain subsidies. Figure 2 Scatter gram of subsidies (in yuan) and contracted irrigated land (in mu). The amount of cultivated irrigated land functions as a wealth indicator and a large area of irrigated land can reduce the financial need to engage in migratory activities. Moreover, since irrigated land needs more maintenance and is generally more fertile than dryland or forestland, this type of land is expected to have a negative impact on migration. The squared term for irrigated land is also included in the regression analyses to account for nonlinearities in the impact of irrigated land. Dryland and forest land are mainly used to non-rice produce crops and forest. Large areas of these land types are also expected to reduce the need to migrate. However, production from these types of land needs less maintenance, which would enable households to participate in migration and return to their rural origin during the harvest. Revenue from these crops and forests provides liquidity that could potentially be invested in rural-urban migration activities and could therefore have a positive impact (Shi et al., 2007). In contrast to irrigated land, it is expected that dryland and woodland can have both positive and negative impacts. The current value of durables also functions as a wealth indicator of the households in the sample and could both positively and negatively affect migration; wealthier households could more easily finance migration costs, while less-wealthy households could be more tempted to engage in ruralurban migration. If a household rents out land, the likelihood to participate in migratory activities seems higher, since the money can be used to finance migration and they do not have to maintain the out rented land. Moreover, households could claim the grain subsidies before renting out their land, increasing their cash availability. The last variables added to the equation are village dummy variables for Banqiao and Gangyan in order to control for unobserved factors that systematically differ between the villages (Shi et al., 2007). Table 15 summarizes the expected impacts of the explanatory variables, where + stands for an expected positive impact, - for an expected negative 32
33 impact. Subsidies are added to this table with a +/- sign, expecting that they could have a positive or a negative impact, as discussed. Table 15 Summary of expected impact of explanatory variables Explanatory variables Expected impact on rural-urban migration Explanatory variables Age - Dryland +/- Age squared +/- Forest +/- Education + Durables +/- Gender + Renting + Children +/- Banqiao +/- Elderly +/- Gangyan +/- Labour force + Subsidies +/- Irrigated - Expected impact on rural-urban migration 4.3 Binary logistic regression Binary logistic regression uses a baseline model, the model in which only the constant is included, and the model after including the explanatory variables. The model Chi square goodness of fit test measures the difference between the baseline model and the model after including the explanatory variables. If this level is significant it indicates that the model after including the explanatory variables model better predicts whether migration would take place than the baseline model with only the constant (Field, 2009). The Nagelkerke s R 2 N is a method to assess the goodness of fit of the model, which will be used in this study. As Field (2009) mentions, in terms of interpretation it can be seen as similar to the R 2 in linear regression in that it measures the significance of the model. R 2 N = R 2 [2(LL(baseline)) / n] CS / 1-e Binary logistic regression uses the Wald-statistic to assess the contribution of individual explanatory variables. The Wald-statistic is basically t 2 with a Chi square distribution with df=1. It tells whether the β coefficient for the explanatory variable is significantly different from zero. If the coefficient is significantly different from zero, then it can be assumed that the explanatory variable is contributing significantly to the prediction of the outcome (Field, 2009). Wald = (β/s.e. β ) 2 Important in the interpretation of the logistic regression is the value of the odds ratio EXP(β), which is the indication of the change in odds resulting from a unit change in the explanatory variable. If the value is greater than 1, it indicates that as the explanatory variable increases, the odds of the participating in rural-urban migratory activities increases and vice versa (Field, 2009). There exist different ways of performing binary logistic regression. The forced entry method is the default method where all explanatory variables are placed into the regression model in one block. When using a stepwise method, the first model includes only the constant. Explanatory variables are added on the basis of the score-statistic of the explanatory variables; the significant score statistics 33
34 are likely to affect the model. Stepwise logistic regression adds the explanatory variable with the most significant score statistic to the model, and does this for every other explanatory variable until there are no explanatory variable with significant score statistics left (Field, 2009). This method is particularly useful when no previous research exists on the hypothesis, since it gives a step-by-step assessment of the significant explanatory variables. As discussed, not much research has been done in the impact that subsidies have on rural-urban migration. However, the studies by Shi et al (2007) and Zhao (1999a) provided clear expectations for the fixed-asset explanatory variables, and since only the subsidy explanatory variable will added to the set of explanatory variables provided by Shi et al (2007), the forced entry method will be used. Moreover, after applying both entry methods, the outcomes were similar Assumptions and adjustments Binary logistic regression assumes linearity between a continuous predictor and the logit of the outcome variable, independence of errors and no multicollinearity. After testing for these assumptions by using the methods provided by Field (2009), it occurred that the linearity assumption for the children between 0-7 years had been violated. However, after running the regression with and without the children explanatory variable, the individual contribution of the explanatory variables was hardly affected. Therefore, and also to follow the example provided by Shi et al. (2007), the variable will be included in further regressions. Since the surveys were done at arbitrary moments there is no specific order in the household observations -, independence of errors is assumed. Collinearity was found between different explanatory variables in the model. Especially individual characteristic seem correlated, as well as the wealth indicators current value of durables and the contracted irrigated land. Explanatory variables should not be too much correlated, the method described by Field (2009) to check for multicollinearity was used and provided tolerance values and VIF statistics. The tolerance values showed levels above 0.5 and the VIF values were never larger than 2-except for age and age squared and irrigated land and irrigated land squared, causing no concerns for multicollinearity problems in these data. Appendices 1 and 2 contain the collinearity diagnostics and correlation matrix for the full sample Regression analyses The role of the explanatory variables examined in section 4.2 on rural-urban migration for the full sample will elaborated with the use of binary logistic regression analyses. The first regression analysis will contain the variables concerning aggregate individual characteristics and the composition of the family in order to get more insight and feeling in the impact of the explanatory variables on ruralurban migration and the interpretation of the SPSS output. This will be further elaborated in the second regression analysis which will contain all explanatory variables except for subsidies. The third regression will add the subsidy explanatory variable in order to examine the impact of subsidies on rural-urban migration when controlling for the fixed assets of the household and mean individual characteristics. 2 See appendices 1 and 2, page 57 and
35 The regression outputs will provide the coefficient β and the standard error of β as well as the odds ratio Exp(β). The Wald statistic has been left out since it can be calculated from the coefficient and its standard error as examined in section Regression results for household characteristics The explanatory variables concerning household characteristics included in the first regression model are mean age and squared age, mean education and mean gender, the labour force, the number of children, number of elderly. In addition, village dummies are included. The regression results are shown in Table 16. The Nagelkerke s R 2 is This number seems small, but micro-level analyses usually have a relatively small fit. The mean individual characteristics are not significantly contributing to this model. This is in contrast with the results by Shi et al. (2007) who found a significant negative impact of age at the 10% significance level and positive impacts of education and gender at the 1% significance level. The fact that Shi et al. (2007) measured individual characteristics at the individual level and this study aggregated individual characteristics to mean household levels may be a factor in the insignificant statistics of the individual characteristics in Table 16. Table 16 Regression output for individual characteristics and household composition. Variables in the Equation Β S.E.(β) Exp(β) Age Age squared Education Gender Labour Force 1.017*** Children -.430** Elderly.634** Banqiao Gangyan Constant ** Model Chi square *** Nagelkerke R square *** Denotes statistically significant at 1% level ** Denotes statistically significant at 5% level * Denotes statistically significant at 10% level The number of labour force members in the household has a statistically significant positive impact at the 1% level as was expected. The odds ratio is 2.8, showing that an extra labour force member in the household would increase the odds of participating in rural-urban migration with 2.8. The amount of young children in the household has a statistically significant negative impact at the 5% significance level, with an odds ratio of 0.650, indicating that the assistance that young children need, keeps other household members from migrating. The amount of elderly in the household positively affect rural-urban migration at the 5% significance level with an odds ratio of 1.885, indicating that the presence of grandparents enables household members to migrate (Shi et al., 2007; Zhao, 1999b). The regression outcomes by Shi et al. (2007) based on the data from the same three villages in the year 2000 were similar with these outcomes, finding statistically significant 35
36 positive impacts for labour force and elderly, and a statistically significant negative impact of young children Regression results fixed assets The following regression analysis will include the (relatively) fixed assets cultivated irrigated land, dryland, woodland and the current value of durables into the model. The current value of durables variable has been divided by 1000 in the regression analysis. Also, the rent-in dummy will be included. The regression outputs are examined in Table 17. Mean age squared and mean gender are individual characteristics contributing significantly to predicting migration in the model. The mean squared age has a statistically significant negative impact and mean gender has a statistically significant positive impact at the 10% significance level. The significance of mean age squared is not line with the outcomes in the study by Shi et al. (2007), who found no statistically significant impact for squared age. Mean age is not statistically significant, but has an odds ratio above 1. With the use of the coefficients (-β 1 /2β 2 ), it is suggested that mean age impacts migration positively until years, after which the likelihood to migrate decreases. Mean age and mean education are statistically insignificant as in the previous regression. Mean gender has a positive impact as expected, indicating that men are more likely to migrate than women. The number of labour force members has a positive impact at the 1% significance level which is in line with the outcomes by Shi et al. (2007) with the odds ratio increased to 2.9. Both the amount of children and elderly have no significant impact on migration in this regression analysis, contrary to the outcomes by Shi et al. (2007) and the previous regression analysis containing household characteristics. The added fixed asset explanatory variables show statistically significant impacts for cultivated irrigated land and woodland. The amount of cultivated irrigated land has a negative impact on ruralurban migration at the 5% significance level. More cultivated irrigated land, thus, reduces the need to migrate in this model, which is in line with the outcomes by Shi et al. (2007), who found a negative impact of irrigated land at the 5% significance level. Although the squared term of irrigated land is not significant, with the use of the coefficients of irrigated land and squared irrigated land, it can be calculated that from a value of mu (-β 8 /2β 9), the cultivated irrigated land starts having a positive impact. This suggests that households with more than mu of irrigated land have sufficient financial resources to finance the migration of household members. Dryland has no statistically significant impact, forestland on the other hand has a statistically significant positive impact on migration at the 10% significance level with an odds ratio of 1.016, indicating a small positive impact. Shi et al. (2007) found no significant impact of forestland on migration. However, the mean forestland per household has been increasing between 2000 and 2010 in the context of tenure reforms for forestland and it does statistically significantly impact migration in this study. The current value of durables is statistically significant at the 10% significance level with an odds ratio lower than 1, indicating that a higher current value of durables keeps households from migrating. Adding a squared term for the current value gives a negative odds ratio, indicating that the higher the value of durables, the impact will still be negative, contrary to the cultivated irrigated land. Shi et al. (2007) did not find a significant impact of the current value of durables, but these values increased to a large extent between 2000 and 2010 (Table 7). The rent-out dummy is not statistically significant, indicating that whether a household rents out land doesn t affect the decision to migrate. This is not 36
37 in line with the results by Shi et al. (2007), who found a positive impact of renting-out at the 1% significance level, while the mean amount of households renting out land was more or less similar between 2000 and 2010 (Shi et al., 2007). Table 17 - Regression results for fixed assets Variables in the Equation Β S.E.(β) Exp(β) Age Age squared -.004* Education Gender 1.962* Labour Force 1.061*** Children Elderly Irrigated -.099* Irrigated squared Dry Forest.016** Durables -.050* Renting Banqiao * Gangyan Constant * Model Chi square *** Nagelkerke R square *** Denotes statistically significant at 1% level ** Denotes statistically significant at 5% level * Denotes statistically significant at 10% level Regression results fixed assets and subsidies This third regression of this chapter is similar to the previous regression, but includes the grain subsidy variable to the regression analysis. As for the current value of durables, the grain subsidy variable has been divided by 1000 in the regression analysis. The outcomes are presented in Table 18. The results from this regression indicate that the grain subsidies do not significantly impact migration. As discussed in Chapter 3, the relative amount of the subsidies in the farm revenues is small, only around 4.2% in 2010 and doesn t seem to affect the decision to migrate for the households in the full sample. The other explanatory variables that are statistically significant are similar to the regression analysis in section The impact of subsidies on migration could be statistically significant in one of the three villages, depending on the difference in the level of subsidies and between-village differences of the explanatory variables. This will be examined per village in Chapter 5. 37
38 Table 18 - Regression results for fixed assets including subsidies Variables in the Equation Β S.E.(β) Exp(β) Age Age squared -.004* Education Gender 1.980* Labour Force 1.056*** Children Elderly Irrigated -.107** Irrigated squared Dry Forest.016** Durables -.051* Subsidies Renting Banqiao -.988* Gangyan Constant * Model Chi square *** Nagelkerke R square *** Denotes statistically significant at 1% level ** Denotes statistically significant at 5% level * Denotes statistically significant at 10% level 4.5 Discussion This section presented the explanatory variables used in the regression analyses and their expected impact on migration using the studies of Shi et al. (2007) and Zhao (1999a). It examined the impact of household characteristics and several (relatively) fixed assets on migration following the example set by the study by Shi et al. (2007). Grain subsidies were added in the last regression analysis. The main objective of this study has been to examine the impact of grain subsidies on migration. The regression results from section indicate that there is no evidence that grain subsidies impact migration. Huang et al. (2011) stated that there is no evidence that the grain subsidies affect producers decisions, and the findings in this section are in line with their statement in the case of migration. This regression results also provide no evidence to conclude that these results correspond with the negative impact of grain subsidies on migration that Meng (2012) found in his study. The regression results on 2010 data indicate a negative impact of age. However, the calculation in section suggests that this starts at the age of and that up to that age, age impacts migration positively. The statistically significant positive impact of mean gender indicates that men are more likely to migrate than women, as was expected in section Mean education and mean age had no statistically significant impact on migration in all regression analyses of this chapter. The number of children and elderly were statistically significant in the regression analysis of section 4.4.1, but not in the latter two. The number of children had a statistically significant negative impact on migration and the number of elderly a positive in the first regression analysis. These results suggest that young children need more help which keeps household members from 38
39 migrating, while healthy elderly are able to take care of the household which enables other household members to migrate. Wealth indicators as cultivated irrigated land and the current value of durables both have a statistically significant negative impact on migration, indicating that migration is more attractive for liquidity-constrained households (Shi et al. 2007). However, after mu, the impact of cultivated irrigated land becomes positive, which is in line with the findings by Jayaraman and Lanjouw (1999) in India that migration appears to be positively linked with household asset levels. Forestland has been increasing and has a statistically significant positive impact, contrary to the outcomes by Shi et al. (2007). The positive impact indicates that people with forestland often participate in (circular) migration in 2010, as was expected in section Some of the regression results from 2010 differed with the finding by Shi et al. (2007), which is attributable in developments in variables of interest between 2000 and 2010 and the household level approach of this study as compared to the individual level approach by Shi et al. (2007). This chapter examined impact of the grain subsidies and explanatory variables for the full sample, but these could differ between the villages. Chapter 5 will use village-level regression analyses to examine betweenvillage differences in the factors driving migration. 39
40 Chapter 5 - Regression Results per Village 5.1 Introduction This chapter will examine the impact of subsidies, household characteristics and (relatively) fixed household assets per village with the use of binary logistic regression analysis. Each regression analysis contains the complete set of explanatory variable examined in Chapter 4 for 2010, following the example by Shi et al. (2007). With the use of descriptive statistics and the regression results per village it will be examined which factors are driving forces behind migration per village. The subquestion to be answered in this chapter is formulated as follows: What were the differences in impact of grain subsidies, individual characteristics and household assets in the three surveyed villages in 2010? The village-level descriptive statistics and regression results for Banqiao, Shangzhu and Gangyan will be examined in section 5.2. Section 5.3 will consist of a discussion of the village level analyses where the differences between the villages will be examined. 5.2 Village-level regressions This section will provide the village-level descriptive statistics of migration and the explanatory variables as well as the regression results for Banqiao, Shangzhu and Gangyan Banqiao The number of observations used for the regression analysis in Banqiao was 52, which was relatively small as compared to the number of observations in Shangzhu and Gangyan, which were respectively 96 and 166. The descriptive statistics of the explanatory variables used in the regression analysis are presented in Table 19, which are similar to the values examined in Chapter 3. As can be seen, 81% of the households had at least one member migrated, there are relatively more children than elderly in the households and the mean labour force was per household was higher than in the other villages in 2010 (see Table 5). The mean cultivated amount of irrigated land was mu and the mean current value of durables was 5,808 yuan, which were the highest levels 2010 as compared to Shangzhu and Gangyan (see Table 6 and Table 7). The mean amount of grain subsidies per household was 716 yuan, which was also the highest as compared to Shangzhu and Gangyan (see Table 2). However, the mean grain subsidies per irrigated mu was higher in Gangyan in
41 Table 19 Descriptive statistics for Banqiao, Variable name N Min Max Mean Std. Dv Migration Age Education Gender labour force Children Elderly Irrigated Dry Forest Durables ,790 5,808 8,066 Renting Subsidies , Table 20 shows the regression results for Banqiao. Only the mean cultivated irrigated land per household had a statistically significant impact on migration, at the 10% significance level. The odds ratio of 0.56 indicates a stronger negative impact on migration than cultivated irrigated land has in the full sample. The mean amount of cultivated irrigated land per household is highest in Banqiao and this appears to be strongly negatively impacting migration. The standard error of the coefficient of total woodland is very high. In the case of woodland, this is probably due to one outlier of a household containing 190 mu of woodland, while in total only four households contain forestland in Banqiao and the other three households have no more than 4 mu each. The amount of forestland, despite the national reallocations, was minor in Banqiao. Another remarkable value is the very large odds ratio of aggregated household gender. Removing these variables from the regression analysis hardly affect the results. The coefficients of mean age and mean age squared suggest that age impacts migration positively up to years old, which is lower than in the full sample. The mean cultivated irrigated land where it starts having a positive impact is 17.1 mu. As well as in the full sample, subsidies did not have a statistically significant impact on migration in Banqiao. Moreover, except for cultivated irrigated land, none of the other explanatory which had a statistically significant impact in the full sample had such an impact on migration in Banqiao in
42 Table 20 Regression results for Banqiao, Variables in the Equation β S.E.(β) Exp(β) Age Age squared Education Gender Labour Force Children Elderly Irrigated -.581* Irrigated squared Dry Forest Durables Subsidies Renting Constant Model Chi square * Nagelkerke R square *** Denotes statistically significant at 1% level ** Denotes statistically significant at 5% level * Denotes statistically significant at 10% level Shangzhu The number of observations for Shangzhu was almost twice as large as the number of observations for Banqiao. The descriptive statistics of the explanatory variables used in the regression analysis are presented in Table 21. The migration rate is slightly lower in Shangzhu as compared to Banqiao. The mean age and education of the household are also slightly lower than in Banqiao and the mean number of children and elderly are both higher than in Banqiao. The mean number of labour force household members is slightly lower than in Banqiao. Shangzhu has a relatively low mean of the renting-out categorical variable as compared to Banqiao and Gangyan. Renting irrigated land is less common in Shangzhu in 2010, which was also illustrated in the relatively low amount of mean rented-in irrigated land in Table 7. The total amount of cultivated irrigated land was generally lower in Shangzhu as compared to the other villages as well as the current value of durables, while the mean amount of forestland was relatively high (see Table 7). This indicates that the households in Shangzhu have other production priorities than Banqiao and Gangyan. The amount of grain subsidies was also lowest in Shangzhu in 2010 as compared to the other villages, due to the lower amount of cultivated irrigated land and the predominance of single-season rice production. The regression results for Shangzhu in 2010 are examined in Table
43 Table 21 Descriptive statistics for Shangzhu, Variable name N Min Max Mean Std. Dv. Migration Age Education Gender labour force Children Elderly , Irrigated Dry Forest Durables ,719 3,441 2,274 Renting Subsidies , The regression results show that the number of household members that are counted as labour force members have a statistically significant impact on migration at the 1% significance level in Shangzhu as it was in the regressions for the full sample. The odds ratio is 5.04, which is almost twice as high as compared with the odds ratio for the full sample, which was This indicates that an extra household member in the labour force has a relatively strong positive impact in Shangzhu. The mean number of labour force members per household is slightly lower in Shangzhu than it is in Banqiao and Gangyan and Shangzhu would relatively more benefit from an extra labour force member in the household in terms of the opportunity to participate in migration. The number of children in the household has a significant negative impact at the 10% significance level in Shangzhu, as it was in the regression results for household characteristics in Chapter 4. However, the odds ratio is more or less 1.5 times lower in this regression analysis. This indicates that the amount of children in the household has a relatively strong negative impact on migration in Shangzhu. The relatively high number of elderly in the households in Shangzhu was expected to reduce the negative impact of young children, since elderly could take care of them. However, this was not the case according to the regression results in Shangzhu. As with the regression output for Banqiao, subsidies do not significantly impact migration in Shangzhu in Moreover, most of the explanatory variables that had a statistically significant impact on migration in the full sample, don t have this impact in Shangzhu. The values of the coefficients suggest that age has a positive impact on migration up to 32.6 years, which is relatively low as compared to the full sample and Banqiao. For cultivated irrigated land, the coefficients suggest a positive impact from 8.1 mu. However, none of these explanatory variables have a statistically significant impact and these values are only indications. Since the amount of forestland has been relatively high in Shangzhu and this had a statistically significant impact on migration in the full sample, a similar impact would have been expected in Shangzhu as well, but this was not the case according to the regression results. 43
44 Table 22 - Regression results for Shangzhu, Variables in the Equation Β S.E. Exp(β) Age Age squared Education Gender labour force 1.618*** Children -.871* Elderly Irrigated Irrigated squared Dry Forest Durables Subsidies Renting Constant Model Chi square *** Nagelkerke R square *** Denotes statistically significant at 1% level ** Denotes statistically significant at 5% level * Denotes statistically significant at 10% level Gangyan Gangyan contains the largest number of observations. Since the number of households with at least one member living outside the village has been decreasing in Gangyan between 2000 and 2010, it is interesting to look at the factors impacting the migration rate in order to distinguish the possible factors impacting this decline. Table 23 shows the descriptive statistics for Gangyan in Table 23 - Descriptive statistics Gangyan, Variable name N Min Max Mean Std. Dv. Migration Age Education Gender labour force Children Elderly Irrigated Dry Forest Durables ,650 5,465 5,988 Renting Subsidies ,
45 The migration rate in general was lower than in Banqiao or Shangzhu (see Table 3). The mean age of the households was highest and the mean education lowest in Gangyan as compared to the other villages in 2010 (see Table 6). The mean cultivated irrigated land per household and current value of durables in 2010 were slightly lower than in Banqiao, but were respectively twice as large and 59% higher than in Shangzhu. Forestland occurs more than in Banqiao, but was only 30% of the mean forestland per household as compared to Shangzhu in 2010, renting-out land occurred more than in Shangzhu, but less than in Banqiao. The mean grain subsidies per household were slightly lower than in Banqiao, but were the largest per mu of irrigated land (see Table 2) in Table 24 shows the regression results for Gangyan in Both mean age, mean squared age have a statistically significant impact on migration at the 5% significance level. Mean gender is statistically significant at the 10% significance level with a negative impact, as it was in the full sample. Mean age has a positive impact and mean age squared a negative impact, the mean age up to which age impacts migration positively is 42.2, which is the highest in all villages. The number of labour force members is statistically significant at the 1% significance with a positive impact and an odds ratio of 2.6, which is a similar to the regression results from the full sample. The mean cultivated irrigated land per household, however, does not have a statistically significant impact on migration. The coefficients suggest that the mean cultivated irrigated land has a negative impact until mu, after which it becomes positive. This amount is more than twice as high as the mean cultivated irrigated land per household and is relatively high as compared to the other villages. A negative impact of cultivated irrigated land would therefore been expected, but this was not the case in Gangyan. Table 24 - Regression output fixed assets and subsidies for Gangyan, Variables in the Equation β S.E. Exp(β) Age.760** Age squared -.009** Education Gender 2.913* labour force.940*** Children Elderly Irrigated Irrigated squared Dry Forest Durables -.106** Subsidies Renting Constant ** Model Chi square *** Nagelkerke R square *** Denotes statistically significant at 1% level ** Denotes statistically significant at 5% level * Denotes statistically significant at 10% level 45
46 The amount of forestland per household has no statistically significantly impact on migration in Gangyan, contrary to the full sample regression results. Forestland is more common in Gangyan than it is in Banqiao, but less as compared to Shangzhu. The current value of durables has a statistically significant negative impact on migration at the 5% significance level as it has in the full sample, but has an odds ratio closer to 0 in Gangyan, indicating a relatively strong negative impact. Also in Gangyan, grain subsidies do not significantly impact migration in Discussion The village-level regression results show that the factors explaining variation in migration within the villages differ per village. In general, similar factors driving migration as in the full sample have been found in the village-level regressions. However, each village had its own selection of statistically significant explanatory variables. The only exception was that forestland, which had a statistically significant positive impact in the full sample, explaining variation in migration between the villages, had no such impact in each of the villages. The main objective of this study was to examine the impact of subsidies on migration. As for the regression results for the full sample, the village-level regression results indicate that there is no evidence that subsidies impact migration in each of the villages. Banqiao had the largest increase in the migration rate between 2000 and 2010, with 81% of the households having at least one member involved in migration in Only the cultivated irrigated land, which was highest in Banqiao in 2010, had a statistically significant negative impact on migration at the 10% significance level. The migration rate in Shangzhu was slightly lower than in Banqiao, with 73% of the household engaged in migration in In Shangzhu, the number of children in the household had a statistically significant negative impact and the number of labour force household members had a statistically significant positive impact. The coefficients of mean age and mean age squared, although they are not statistically significant, suggest that people in Shangzhu migrate at a younger age as compared to the other villages, indicating that migrants from Shangzhu aim to migrate at a young age and come back to the village to start a family and the regression results suggest that children keep people from migrating at a later age. The migration rate in Gangyan in 2000 was already relatively high and this rate decreased slightly between 2000 and 2010 to 71%. In Gangyan, different mean individual were statistically significant: mean age, mean age squared were both statistically significant with respectively a positive and negative impact. Mean gender had a statistically significant positive impact, indicating that men are more likely to migrate than women, as it was in the full sample. The mean number of labour force household members had a statistically significant positive impact as in Shangzhu, but with an odds ratio closer to one. That migration is attractive for liquidity-constrained households is illustrated by the statistically negative impact of the current value of durables. The age up to which it has a positive impact on migration is relatively high in Gangyan. This indicates that people were likely to migrate up to a higher age which indicates that the amount of children in the household didn t affect migration to a large extent in Gangyan, which was indeed statistically insignificant. Moreover, the relatively high number of elderly suggests that the theory by Zhao (1999b) that it is part of China s tradition that grandparents help raise their grandchildren could apply on the case of Gangyan. However, this explanatory variable was not statistically significant. 46
47 The factors driving migration and the trends in migration differ between the villages. Chapter 6 will provide a summary and discussion using the data from all chapters. It aims to give a comprehensive elaboration about the trends over time in the main factors driving migration in each of the three villages and to which extent the trends in migration can be explained from the trends in the driving factors and the rural policy transition. It will furthermore reflect on the migration theories examined in Chapter 2, in order to place the developments in the three villages in the context of existing migration models. 47
48 Chapter 6 Summary and Discussion 6.1 Introduction This chapter will provide a section with a summary of the findings of this study, a section with a discussion and a section about the limitations, policy recommendations and recommendations for further research. In the summary, the trends in the variables of interest and regression results for the three villages will be summarized. The discussion aims to answer the central research question formulated in the introduction by elaborating the differences in the village-level trends and the different factors driving migration on the village level and the full sample. The last section of this chapter will provide an oversight of the limitations of the study as well as policy-recommendations and recommendations for further research in this field. 6.2 Summary This section will present a summary of the trends in grain subsidies, migration and other variables of interest examined in Chapter 3 as well as a summary about the results of the regression analyses from Chapter 4 and Chapter 5 Grain subsidies and migration showed increasing trends between 2000 and 2010, with the declining migration rate in Gangyan as exception. The grain subsidies have been increasing in the three villages according to trends on the national level (Gale, 2013). The contracted irrigated land per household and the number of rice harvests per year appear to be the main indicators of the amount of subsidies that the households receive in the villages in northeast of Jiangxi province. This was reflected in the grain subsidies received per household, where Banqiao and Gangyan have predominantly two rice harvests per year and more contracted irrigated land, which led to higher grain subsidy levels as compared to Shangzhu. Migration was very common in the three villages. In 2010, 72% of the households in the full sample had at least one member living outside the village and this percentage has been increasing between 2000 and Both Banqiao and Shangzhu saw large increases in the migration rate between 2000 and 2010, but the migration rate decreased in Gangyan from 76% in 2000 to 69% in Migration was more common than engaging in local off-farm employment in all villages in all years, but the engagement in non-agricultural off-farm employment has been increasing to a large extent, especially in Gangyan and to a lesser extent in Banqiao. Shangzhu and to a lesser extent Banqiao and Gangyan saw a peak in local off-farm agricultural employment in 2005, but this decreased towards Trends in individual characteristics of the households labour force show that mean education and age have been increasing in all villages between 2000 and The mean number of labour force members per household in the full sample grew between 2000 and 2010 while the men-women ratio remained constant. In general, the mean individual characteristics encountered similar trends between the villages. Differences between the villages mainly occurred in the household assets and, output and income data. The mean rented-in irrigated land per household increased in Banqiao and Gangyan between 2005 and 2010 which led to higher mean cultivated irrigated land per household and higher rice outputs in these villages, especially in Banqiao. The increase in mean cultivated irrigated land per household 48
49 between 2005 and 2010 was reflected in the mean rice output in jin per household. This doubled in Banqiao between 2005 and 2010 and grew with more than 30% in Gangyan, while this decreased in Shangzhu during this period, due to a trend towards single-season rice production. The rice yields per cultivated mu increased in Banqiao and Gangyan between 2000 and The increased number of tractors and irrigation pumps may have impacted this. Rice prices more than doubled between 2000 and 2010, probably due to China s national price support policies (Gale, 2013), and rice revenues increased in every village, moreover: it tripled in Banqiao and doubled in Gangyan. Rice production expenditures increased between 2005 and 2010, but were outpaced by the increase in rice revenues, leading to higher incomes for rice production between 2000 and Forestland increased in every village, in accordance with the tenure reforms for forestland that occurred since Developments in the output, revenues and expenditures from forestland in 2010 have not been examined because of deviating values of the data in that year. The current value of durables had relatively high values in Banqiao and Gangyan in 2010 as compared to Shangzhu, indicating that Banqiao and Gangyan were relatively wealthier than Shangzhu. The data also indicate that Banqiao and Gangyan had higher mean net household incomes as compared to Shangzhu. However, only rice and straw revenues and expenditures were included in the farm income calculations in Shangzhu saw a high increase in forestland as compared to the other villages, and the farm revenues would relatively be higher in reality in Shangzhu than it was in the calculations in Chapter 3. Household net incomes grew in all villages between 2005 and 2010 due to an increase in local off-farm employment incomes and remittances. Engagement in different types of local off-farm employment and differences in the amounts of remittances illustrate that ways of generating household incomes differ between the villages. The full sample regression analysis saw statistically significant positive impacts of gender, the number of household members in the labour force age category and forestland on migration. Statistically significant negative impacts were found for age squared, total cultivated irrigated land and current value of durables on migration. These factors impacting migration were also statistically significant in the village regressions, explaining the variation in migration within the villages, but the results differed between the village regressions. Forestland was the only variable that was only statistically significant in the full sample regression analysis, explaining variation in migration between villages, but not within villages. Grain subsidies were statistically insignificant factors in explaining migration in the full sample as well as the village-level regressions. In Banqiao, only total cultivated irrigated land had a statistically significant negative impact on migration. In Shangzhu, the number of children in the household had a statistically negative impact, while the number of labour force members in the household had a statistically positive impact on migration. Only in Gangyan, individual characteristics were found to be significant. Age had a statistically significant positive impact, while age squared had a negative impact, indicating that age has a positive impact on migration for younger persons and a negative impact for older persons. The regression results show that men are more likely to migrate than women in Gangyan and that the number of labour force household members had a statistically significant positive impact on migration, while this was negative for the current value of durables in Gangyan. After summarizing the trends and presenting the regression results found in the analyses of this study concerning the variables of interest, the following section will discuss the driving forces behind 49
50 impacts migration in the three villages in the northeast of the Jiangxi province, linking them to the trends observed between 2000 and Discussion This section will provide a discussion about the main developments in migration and grain subsidies over time, the trends over time in the main factors driving migration in each of the three villages and to which extent the trends in migration can be explained from the trends in the driving factors and the rural policy transition. This section, therefore, aims to answer the central research question that was formulated in the introduction with the use of the results of this study. The central research question was: What was the impact of grain subsidies, individual characteristics and household assets on migration in the northeast of Jiangxi province? In Banqiao, the migration rate increased between 2005 and 2010 from 58% to 81% of the households having at least one member living outside the village. Between 2000 and 2005, the migration rate was more or less similar in Banqiao. The mean cultivated irrigated land per household was the only statistically significant factor on migration in the regression for Banqiao, having a negative impact. Results from Chapter 3 show that the mean cultivated irrigated land per household was more or less the same between 2000 and 2005, but increased with 52% between 2005 and 2010, mainly due to an increase in rented-in irrigated land, and therefore shows similar increases as the migration rate between 2000 and The statistically negative impact of cultivated irrigated land is inconsistent with the increase in migration in Banqiao. The moving away of complete households from the region could explain the increase in cultivated irrigated land. Despite the hukou system, migration between rural areas is hardly constrained and some families may look for informal employment in urban areas. The recent increase in cultivated irrigated land for the households in Banqiao could increase their rice revenue and be an incentive to remain in the village and therefore negatively impact migration. The rice revenues have increased dramatically in Banqiao (see Table 9). Expected rural income has therefore increased which, in the context of the Harris-Todaro model and the New Economics of Labour Migration, has a negative impact on migration. The migration rate in Shangzhu increased between 2000 and 2005 from 57% to 70% and only slightly increased between in the following years to 73% in As opposed to Banqiao, which saw an increase in the migration rate between 2005 and 2010, this occurred earlier for Shangzhu. The number of children in the household and the number of household members in the labour force age category had a statistically significant impact on migration, with respectively a negative and positive impact. The number of labour force members in the household grew with 10% in Shangzhu between 2000 and 2005, and grew with 2% between 2005 and The odds ratio for the labour force was twice as high as compared to the full sample regression results, indicating a strong positive impact on migration. The trends in migration and the number of labour force household members appear to be similar between 2000 and 2010, and the regression analysis for Shangzhu indicates that the number of labour force members in the household is a main driving factor behind migration. The number of children per household has more or less doubled between 2000 and 2005 and again between 2005 and 2010 in Shangzhu, having a statistically negative impact on migration. The regression results for Shangzhu show that people migrate at a relatively young age, which suggests that migrants from Shangzhu aim to migrate at a young age in order to come back to the village to start a family. 50
51 Gangyan was the only village where migration has been decreasing between 2000 and 2005 as well as between 2005 and The migration rate decreased from 76% in 2000 to 69% in The number of household members in the labour force and the mean age and gender were the main factors driving migration with a statistically significant positive impact. The current value of durables and the mean age squared had a significant negative impact. Shi et al. (2007) found no statistically significant impact for the current value of durables in their study on the factors driving migration in northeast of Jiangxi province in However, the current value of durables almost tripled between 2000 and 2010 in Gangyan and the regression results indicate that this increase was a main factor in the decreasing migration rate. Another development that was not included in the regression analyses was the increase in engagement in local off-farm non-agricultural employment in Gangyan. This rate increased from 29% in 2005 to 46% in 2010 (see Table 3), and the yearly income for the households involved were almost six times as high in 2010 as compared to 2005 (see Table 13) and were higher than remittances. Perhaps an increase in non-agricultural job opportunities, as the arrival of new companies in Gangyan, decreased the need to migrate. The number of household members in the labour force had a statistically positive impact on migration in The number of labour force household members increased with 8% between 2000 and 2005, but decreased with 5% between 2005 and 2010, which could explain the lower migration rate in 2010 according to the regression results. The regression results for Gangyan indicated that men are more likely to migrate than women, the mean gender in Gangyan has been constant between 2000 and The mean age of the labour force members in the household has been increasing from 35 to 41 years old in Gangyan between 2000 and 2010 and has a positive impact on migration up to 42.2 years, after which the likelihood to migrate decreases. The discussion so far has examined the main developments in migration, the trends over time in the main factors driving migration, and to which extent the migration can be explained from the trends in the driving factors in each of the three villages. The variation in migration within the villages is explained by factors that differ between the villages. The following part of the discussion will focus on the impact of subsidies, the factors that explain the variation in migration between the villages and will also discuss factors that were not included in the regression analyses as the income effect of migration. The main objective of this study has been to examine the impact of the grain subsidies on migration. As presented in Chapter 3, grain subsidies have been increasing in the northeast of Jiangxi province according to developments on the national level between 2005 and However, the share of subsidies in the farm revenues and moreover the net household incomes was very small and the conclusion from the regression analyses is that subsidies are statistically insignificant factors in impacting migration in each of the villages and the full sample. No evidence has been found to assess whether subsidies have a positive or negative impact on migration. The outcomes from this study are therefore in line with the conclusion by Huang et al. (2011) that there is no evidence that subsidies are affecting producers decisions, at least not in the case for migration decisions in the three villages in the northeast of Jiangxi province. This regression results also provide no evidence to conclude that the results from this study correspond with the negative impact of grain subsidies on migration that Meng (2012) found in his study. The forest land tenure system has changed in Jiangxi since 2004: forestland was distributed to the households in order to create economic growth and prevent degradation (Holden et al., 2011). 51
52 Forestland tripled per household in the full sample and has a statistically significant positive impact on migration in the regression results for the full sample, but had no such effect in the three villagelevel regressions. This indicates that forestland explains a large extent of the variation in migration between the villages, but not within the villages. Forestland requires less maintenance than irrigated land, which could enable households to migrate, explaining the positive impact. The full sample regression analysis found statistically significant negative impacts of the mean cultivated irrigated land and the current value of durables in 2010, which are both used as wealth indicators in the regression analyses. The negative impact of these explanatory variables indicates that migration is attractive for liquidity-constrained households in terms of profitability, as was expected on the basis of the literature provided by Shi et al. (2007). This is also in line with the expectations based on the Harris-Todaro Model, where low expected rural incomes can push households to migrate, and the New Economics of Labour Migration model, where households act jointly to maximize income and minimize risk. In the case of cultivated irrigated land, the impact on migration becomes positive after a certain amount of mu, which differs per village. More revenue from cultivated irrigated land would decrease accessibility constraints and enable household to invest in migration, in line with the findings by Jayaraman and Lanjouw (1999) in India that migration appears to be positively linked with household asset levels in India. The increase in migration rate in Shangzhu between 2000 and 2005, and in Banqiao between 2005 and 2010, were accompanied with increases in household revenues and net incomes. Gangyan has had the highest household net incomes in 2000 and 2005, and had already high migration rates at the beginning of the century. This suggests that migration is a strategy that generally increases household incomes and wealth in the northeast of Jiangxi. Especially in Banqiao, which had the lowest household net income (Table 11) and current value of durables (Table 7) in 2005, but the highest values of these variables in In Shangzhu, similar trends have been observed. In 2000, the current value of durables as well as the net household incomes in Shangzhu were the lowest of the villages, but the current value of durables quadrupled and the household net incomes more than doubled between 2000 and These developments underline the profitability of migration in the northeast of Jiangxi province. As migration and engagement in local off-farm employment have increased the household revenues between 2000 and 2010, the increase in rice prices has led to dramatic increases in rice revenues in all villages. The mean prices for rice more than doubled in each of the villages and outpaced production costs, which is attributable to China s price support policies. According to the results from this study, the price support policies had a major impact on the farm revenues rather than grain subsidies, which had a minor impact. The concerns behind China s rural policy transition seem therefore better addressed by the price support policies than the grain subsidies. Modernization has occurred in terms of more tractors and irrigation pumps in Banqiao and Gangyan. The increase in farm revenue could have enabled households to invest in assets to modernize production, which would underline the price support policies as a ways of addressing the concerns behind the rural policy transition. The increase in rice yield in Banqiao and Gangyan, combined with the increased presence of production-related assets, suggest that developments in the northeast of Jiangxi province, at least for Banqiao and Gangyan, are in the direction of the policy goals of the Chinese government behind the rural policy transition. 52
53 The results of this study suggest that people in the northeast of Jiangxi province base their choice to migrate on their wealth in terms of household assets, household composition and individual characteristics. According to the Harris-Todaro theory, the prospect of relatively high urban wages would positively impact migration. The expected urban wage will have an impact the decision whether or not to migrate, moreover since the data indicate that migration is generally accompanied with higher household revenues due to remittances, underlining the profitability of migration. However, it seems that the households in the northeast of Jiangxi base their choice to migrate not solely on the basis of financial wealth, but also on characteristics of the household and its members and assets. This underlines the New Economics of Labour Migration model that households act jointly to maximize their incomes and minimize risks (Meng, 2012; Taylor, 1999). 6.3 Limitations and recommendations The discussion examined that migration is based the (expected) wealth levels, household composition and individual characteristics. As mentioned in the discussion, infrastructure, agroecological circumstances and access to markets may be factors that impact migration as well. Indications about these contextual factors could hardly be made with the use of the 2010 survey and were solely based on the village selection report by Kuijper et al. (2001), while these would probably have developed in the past decade. The panel data have been unbalanced between the three surveys since different households were included in the surveys in the different years, which could be due to the moving away of complete households. There was no information about this available, and information about these developments could have explained why rented-in irrigated land increased to the extent it did. The fact that this study was based on secondary data, therefore, appeared to be a limitation for this study in the sense that more contextual information about the villages could have been presented if the villages were visited. Also, some minor inconsistencies between the surveys in the different years led to some inconsistencies in the examination of variables of interest as examined in Chapter 3. A general indication about the trends in the incomes could still be made, but it would have been interesting to provide a more comprehensive view of income developments also including farm revenues from other products than rice. Therefore, conclusions about producers with other dominant production modes than rice were hard to make. This limitation was not the case for the data concerned with individual characteristics, household assets and rice output, as clear comparisons between the years and villages could be made. More detailed information about contextual circumstances in the villages could have enabled me to illustrate the factors impacting migration better and I would recommend further research to better examine this. This study provides no evidence that subsidies impact migration, however, subsidies could have had an impact on producers decision concerning the production. Rice production has increased in Banqiao and Gangyan, as well as the mechanization in the sense of production-related assets. It would therefore be interesting to study whether subsidies had an impact on these developments. As mentioned in the introduction, there exists an emerging literature about China s policy transition and its effect on production, income, crop choice and input use (Meng, 2012; Gale et al., 2005; Yu & Jensen, 2009), but a study in the northeast of Jiangxi with the data from 2010 could be an interesting case for further research. As for policy recommendations, production and mechanization rates have been increasing in the northeast of Jiangxi province and rural trends in this province are in the direction of the policy goals behind the rural policy transition, at least for rice producers in Banqiao and Gangyan. However, 53
54 migration and non-agricultural off-farm employment rates and incomes have been increasing since the 2000, indicating that non-production related activities are also very common. These developments, however, seem to have increased rural wealth. Per per capita urban disposable incomes were still more than three times as high as compared to per capita rural disposable incomes in 2010, but this ratio decreased slightly towards Despite this, mechanization, production and wealth seem to have increased in the northeast of Jiangxi province between 2000 and The rural policy transition, predominantly the price support policies to outpace production costs, seems to have been a stimulating factor in this, but other local factors have impacted this as well. Looking at northeast of Jiangxi province and the results of this study, a continuation of the current policy could be recommended since both rice output as well as household incomes have been increasing between 2000 and Source: China National Bureau of Statistics, various years. 54
55 Bibliography Chan, K.W. (2001). Recent Migration in China: Patterns, Trends and Policies. Asian Perspectives 25, Chan, K. W. (2013). China: Internal Migration. In: Ness, I., Bellwood P., (eds). The Encyclopedia of Global Human Migration. Wiley-Blackwell, Oxford United Nations Development Program (2005). China Human Development Report 2005: Towards Human Development with Equity. Beijing. United Nations Development Program (2013). China National Human Development Report 2013: Sustainable and Liveable Cities: Toward Ecological Urbanisation. Beijing. De Gorter, H., Just, D.R. and Kropp, J.D. (2008). Cross-Subsidization Due to Infra-Marginal Support in Agriculture: a General Theory and Empirical Evidence. American Journal of Agricultural Economics 90(1), Bernstein, T. P., & Lü, X. (2003). Taxation without Representation in Contemporary Rural China (Vol. 37). Cambridge University Press. Field, A. P. (2009). Discovering Statistics Using SPSS: and Sex and Drugs and Rock 'n' Roll (third edition). London: Sage Publications. Gale, F., Lohmar, B., & Tuan, F. (2005). China's New Farm Subsidies. Technical report, United States Department of Agriculture, WRS Gale, F. (2013). Growth and Evolution in China s Agricultural Support Policies. United States Department of Agriculture, Economic Research Report Number Holden, S. T., Xu, J. and Jiang, X. (2011). Collective Versus Individual Property: Tenure Security and Forest Tenure Reforms in China. Centre for Land Tenure Studies Working Paper No. 04/11. Centre for Land Tenure Studies, Norwegian University of Life Sciences, As. Hu, F., Xu, Z., Chen, Y. (2011). Circular Migration or Permanent Stay? Evidence from China s Rural- Urban Migration. China Economic Review, 22, Huang, J., Wang, X., Zhi, H., Huang, Z., Rozelle, S. (2011) Subsidies and Distortions in China s Agriculture: Evidence From Producer-Level Data. Australian Journal of Agricultural and Resource Economics 55, Jayaraman, R., Lanjouw, P. (1999). The Evolution of Poverty and Inequality in Indian Villages. World Bank Research Observer 14(1), Kuiper, M., Heerink, N., Tan, S., Ren, Q., & Shi, X. (2001). Report of Village Selection for the Three Village Survey. Department of Development Economics, Wageningen University. The Netherlands. 55
56 Meng, L. (2012). Can Grain Subsidies Impede Rural-Urban Migration in Hinterland China? Evidence from Held Surveys. China Economic Review 23, National Bureau of Statistics (NBS) (various years) China Statistical Yearbook. Beijing: NBS. Shi, X., Heerink, N., Qu, F. (2007). Choices Between Different Off-Farm Employment Sub-Categories: an Empirical Analysis for Jiangxi Province, China. China Economic Review 18, Taylor, J.E. & Martin, P.L. (2001). Human Capital: Migration and Rural Population Change. In: G. Rausser & B. Gardner (eds.), Handbook of Agricultural Economics. Elsevier Science, New York Taylor, J.E. (1999). The New Economics of Labour Migration and the Role of Remittances in the Migration Process. International Migration, 37 (1), Xu, J., White, A., & Lele, U. (2010). China s Forest Tenure Reforms. Rights & Resources Initiative, Washington, DC. Yi, F., Sun, D., Zhou, Y. (2015). Grain Subsidy, Liquidity Constraints and Food Security Impact of the Grain Subsidy Program on the Grain-Sown Areas in China. Food Policy, 50, Yu, W., & Jensen, H. G. (2009). China's Agricultural Policy Transition: Impacts of Recent Reforms and Future Scenarios. Journal of Agricultural Economics, 61(1), Zhao, Y. (1999a). Leaving the Countryside: Rural-To-Urban Migration Decisions in China. The American Economic Review, 89(2), Zhao, Y. (1999b). Labor Migration and Earnings Differences: The Case of Rural China. Economic Development and Cultural Change, 47(4), Zhao, Y. (2002). Causes and Consequences of Return Migration: Recent Evidence from China. Journal of Comparative Economics, 30 (2),
57 Appendices Appendix 1 Collinearity diagnostics, full sample Model Unstandardized Coefficients Standardized Coefficients t Sig. Collinearity Statistics B Std. Error Beta Tolerance VIF (Constant) Age Age squared Education Gender Labour force Children Elderly Irrigated Irrigated squared Dry Forest Durables Subsidies Renting Banqiao Gangyan a. Dependent Variable: Migration Appendix 2 Correlation matrix, full sample 57
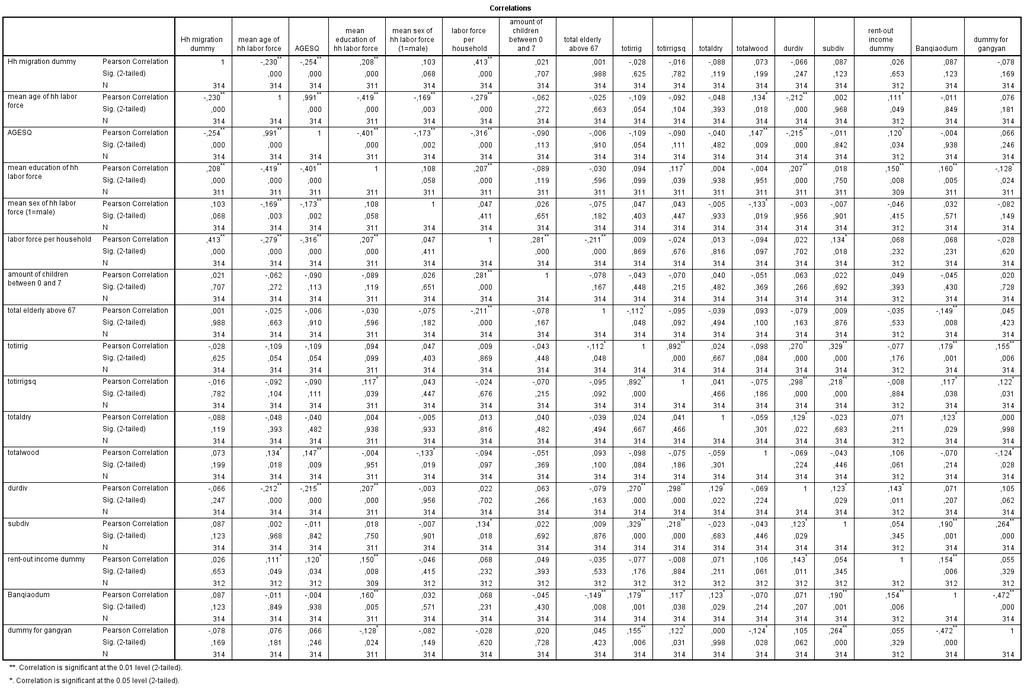
58 58
Impact of land tenure security on rural-urban migration in Southern China: Evidence from Jiangxi Province
 Impact of land tenure security on rural-urban migration in Southern China: Evidence from Jiangxi Province Author: Yu Song Student No: 870509785080 Course code: DEC-80433 Supervisor: Nico Heerink Date:
Openness and Poverty Reduction in the Long and Short Run. Mark R. Rosenzweig. Harvard University. October 2003
 Openness and Poverty Reduction in the Long and Short Run Mark R. Rosenzweig Harvard University October 2003 Prepared for the Conference on The Future of Globalization Yale University. October 10-11, 2003
Access to agricultural land, youth migration and livelihoods in Tanzania
 Access to agricultural land, youth migration and livelihoods in Tanzania Ntengua Mdoe (SUA), Milu Muyanga (MSU), T.S. Jayne (MSU) and Isaac Minde (MSU/iAGRI) Presentation at the Third AAP Conference to
DR CAFTA and Migration in Central America
 DR CAFTA and Migration in Central America Susan M. Richter University of California, Davis and Merced June 25 th, 2009 6/25/2009 1 Central American Free Trade )Agreement (CAFTA Series of Free Trade Agreements
11. Demographic Transition in Rural China:
 11. Demographic Transition in Rural China: A field survey of five provinces Funing Zhong and Jing Xiang Introduction Rural urban migration and labour mobility are major drivers of China s recent economic
Rural Labor Force Emigration on the Impact. and Effect of Macro-Economy in China
 Rural Labor Force Emigration on the Impact and Effect of Macro-Economy in China Laiyun Sheng Department of Rural Socio-Economic Survey, National Bureau of Statistics of China China has a large amount of
How migrants choose their destination in Burkina Faso? A place-utility approach
 How migrants choose their destination in Burkina Faso? A place-utility approach Prof. Sabine Henry Geography department, FUNDP, Belgium Prof. Richard Bilsborrow Carolina Population Center, Univ. of North
Pulled or pushed out? Causes and consequences of youth migration from densely populated areas of rural Kenya
 Pulled or pushed out? Causes and consequences of youth migration from densely populated areas of rural Kenya Milu Muyanga, Dennis Otieno & T. S. Jayne Presentation at the Tegemeo Conference 2017 on Transforming
Executive summary. Strong records of economic growth in the Asia-Pacific region have benefited many workers.
 Executive summary Strong records of economic growth in the Asia-Pacific region have benefited many workers. In many ways, these are exciting times for Asia and the Pacific as a region. Dynamic growth and
Global Employment Trends for Women
 December 12 Global Employment Trends for Women Executive summary International Labour Organization Geneva Global Employment Trends for Women 2012 Executive summary 1 Executive summary An analysis of five
Roles of children and elderly in migration decision of adults: case from rural China
 Roles of children and elderly in migration decision of adults: case from rural China Extended abstract: Urbanization has been taking place in many of today s developing countries, with surging rural-urban
Rural and Urban Migrants in India:
 Rural and Urban Migrants in India: 1983-2008 Viktoria Hnatkovska and Amartya Lahiri July 2014 Abstract This paper characterizes the gross and net migration flows between rural and urban areas in India
This document relates to item 4.5 of the provisional agenda
 This document relates to item 4.5 of the provisional agenda Sixth Session of the Conference of the Parties to the WHO Framework Convention on Tobacco Control, 13-18 October 2014, Moscow FCA Policy Briefing
Rural and Urban Migrants in India:
 Rural and Urban Migrants in India: 1983 2008 Viktoria Hnatkovska and Amartya Lahiri This paper characterizes the gross and net migration flows between rural and urban areas in India during the period 1983
EXTENDED FAMILY INFLUENCE ON INDIVIDUAL MIGRATION DECISION IN RURAL CHINA
 EXTENDED FAMILY INFLUENCE ON INDIVIDUAL MIGRATION DECISION IN RURAL CHINA Hao DONG, Yu XIE Princeton University INTRODUCTION This study aims to understand whether and how extended family members influence
Land Use, Job Accessibility and Commuting Efficiency under the Hukou System in Urban China: A Case Study in Guangzhou
 Land Use, Job Accessibility and Commuting Efficiency under the Hukou System in Urban China: A Case Study in Guangzhou ( 论文概要 ) LIU Yi Hong Kong Baptist University I Introduction To investigate the job-housing
Overview The Dualistic System Urbanization Rural-Urban Migration Consequences of Urban-Rural Divide Conclusions
 Overview The Dualistic System Urbanization Rural-Urban Migration Consequences of Urban-Rural Divide Conclusions Even for a developing economy, difference between urban/rural society very pronounced Administrative
Rising inequality in China
 Page 1 of 6 Date:03/01/2006 URL: http://www.thehindubusinessline.com/2006/01/03/stories/2006010300981100.htm Rising inequality in China C. P. Chandrasekhar Jayati Ghosh Spectacular economic growth in China
International Remittances and Brain Drain in Ghana
 Journal of Economics and Political Economy www.kspjournals.org Volume 3 June 2016 Issue 2 International Remittances and Brain Drain in Ghana By Isaac DADSON aa & Ryuta RAY KATO ab Abstract. This paper
Migration and Poverty Alleviation in China
 Migration and Poverty Alleviation in China WANG Dewen and CAI Fang Institute of Population and Labour Economics, CASS Jianguomennei Dajie No.5, Beijing, China, 100732 Email Address: wangdw@cass.org.cn;
How does international trade affect household welfare?
 BEYZA URAL MARCHAND University of Alberta, Canada How does international trade affect household welfare? Households can benefit from international trade as it lowers the prices of consumer goods Keywords:
Lecture 22: Causes of Urbanization
 Slide 1 Lecture 22: Causes of Urbanization CAUSES OF GROWTH OF URBAN POPULATION Urbanization, being a process of population concentration, is caused by all those factors which change the distribution of
GENDER FACTS AND FIGURES URBAN NORTH WEST SOMALIA JUNE 2011
 GENDER FACTS AND FIGURES URBAN NORTH WEST SOMALIA JUNE 2011 Overview In November-December 2010, FSNAU and partners successfully piloted food security urban survey in five towns of the North West of Somalia
Labour Market Reform, Rural Migration and Income Inequality in China -- A Dynamic General Equilibrium Analysis
 Labour Market Reform, Rural Migration and Income Inequality in China -- A Dynamic General Equilibrium Analysis Yinhua Mai And Xiujian Peng Centre of Policy Studies Monash University Australia April 2011
Trade, Growth and Poverty in the context of Lao PDR
 Trade, Growth and Poverty in the context of Lao PDR Dr. Yan Wang Senior Economist The World Bank Ywang2@worldbank.Org Prepared for the joint workshop on Lao PDR: Trade and The Integrated Framework Vientiane
5. Destination Consumption
 5. Destination Consumption Enabling migrants propensity to consume Meiyan Wang and Cai Fang Introduction The 2014 Central Economic Working Conference emphasised that China s economy has a new normal, characterised
China s Rural-urban Migration and Its Impact on Economic Development
 China s Rural-urban Migration and Its Impact on Economic Development by Yuzhe Zhang (6958722) Major Paper presented to the Department of Economics of the University of Ottawa in partial fulfillment of
Globalization and its Impact on Poverty in Pakistan. Sohail J. Malik Ph.D. Islamabad May 10, 2006
 Globalization and its Impact on Poverty in Pakistan Sohail J. Malik Ph.D. Islamabad May 10, 2006 The globalization phenomenon Globalization is multidimensional and impacts all aspects of life economic
GLOBALISATION AND WAGE INEQUALITIES,
 GLOBALISATION AND WAGE INEQUALITIES, 1870 1970 IDS WORKING PAPER 73 Edward Anderson SUMMARY This paper studies the impact of globalisation on wage inequality in eight now-developed countries during the
The Efficiency of Tourism Impact on People's Livelihood: A Theoretical Framework Zhen Su 1,a and Qiuying Li 1,b
 2017 2nd International Conference on Humanities Science, Management and Education Technology (HSMET 2017) ISBN: 978-1-60595-494-3 The Efficiency of Tourism Impact on People's Livelihood: A Theoretical
LABOR MARKET DISTORTIONS, RURAL-URBAN INEQUALITY AND THE OPENING OF CHINA S ECONOMY *
 LABOR MARKET DISTORTIONS, RURAL-URBAN INEQUALITY AND THE OPENING OF CHINA S ECONOMY * Fan ZHAI ** Asian Development Bank Thomas HERTEL Center for Global Trade Analysis, Purdue University Abstract This
Analysis of the Sources and Uses of Remittance by Rural Households for Agricultural Purposes in Enugu State, Nigeria
 IOSR Journal of Agriculture and Veterinary Science (IOSR-JAVS) e-issn: 2319-2380, p-issn: 2319-2372. Volume 9, Issue 2 Ver. I (Feb. 2016), PP 84-88 www.iosrjournals.org Analysis of the Sources and Uses
Birth Control Policy and Housing Markets: The Case of China. By Chenxi Zhang (UO )
") Birth Control Policy and Housing Markets: The Case of China By Chenxi Zhang (UO008312836) Department of Economics of the University of Ottawa In partial fulfillment of the requirements of the M.A. Degree
Birth Control Policy and Housing Markets: The Case of China By Chenxi Zhang (UO008312836) Department of Economics of the University of Ottawa In partial fulfillment of the requirements of the M.A. Degree
China s Rural-Urban Migration: Structure and Gender Attributes of the Floating Rural Labor Force
 Finnish Yearbook of Population Research 42 (2006), pp. 65 92 65 China s Rural-Urban Migration: Structure and Gender Attributes of the Floating Rural Labor Force GUIFEN LUO, Ph.D. Associate Professor School
Employment of Return Migrants and Rural Industrialization in China. -A Case Studay in Hunan Province
 1 Employment of Return Migrants and Rural Industrialization in China -A Case Studay in Hunan Province Xi Zhao a and Beatrice Knerr b a University of Kassel, Dept. of Development Economics, Migration and
There is a seemingly widespread view that inequality should not be a concern
 Chapter 11 Economic Growth and Poverty Reduction: Do Poor Countries Need to Worry about Inequality? Martin Ravallion There is a seemingly widespread view that inequality should not be a concern in countries
Household Inequality and Remittances in Rural Thailand: A Lifecycle Perspective
 Household Inequality and Remittances in Rural Thailand: A Lifecycle Perspective Richard Disney*, Andy McKay + & C. Rashaad Shabab + *Institute of Fiscal Studies, University of Sussex and University College,
Can Grain Subsidy Impede Rural-Urban Migration in Hinterland China? Evidence from Field Surveys. Lei Meng. September 29, 2010
 Can Grain Subsidy Impede Rural-Urban Migration in Hinterland China? Evidence from Field Surveys Lei Meng September 29, 2010 Abstract: In this paper I examine the impact of a newly instituted grain subsidy
1996~ % %
 * 1996 2006 10 2008 2007 2007 2008 2006 1.14 2007 * 41 2009 6 1996 2006 10 1996 2006 1996~2006 1996~2006 6.89 7.64 0.75 5.61 4.79 0.82 2006 5.31 6.09 1 2006 5.38 5.31 0.07 4.85 4.79 0.07 0.78 6.16 6.09
Call for Research Proposals to Assess the Economic Impact of Refugees on host and/or regional economies
 Call for Research Proposals to Assess the Economic Impact of Refugees on host and/or regional economies Background: There is very limited work to date on the economic impact of refugees on host and/or
Migration, Employment, and Food Security in Central Asia: the case of Uzbekistan
 Migration, Employment, and Food Security in Central Asia: the case of Uzbekistan Bakhrom Mirkasimov (Westminster International University in Tashkent) BACKGROUND: CENTRAL ASIA All four countries experienced
Report on Progress of Economic and Social Rights in China
 Report on Progress of Economic and Social Rights in China By China Economic and Social Council (Aug. 28, 2008) The China Economic and Social Council (hereinafter referred to as CESC), as the national service
Labour Migration and Network Effects in Moldova
 DEPARTMENT OF ECONOMICS Uppsala University Master Thesis (D-uppsats) Author: Lisa Andersson Supervisor: Henry Ohlsson Spring 2008 Labour Migration and Network Effects in Moldova Abstract This study investigates
CHAPTER SEVEN. Conclusion and Recommendations
 CHAPTER SEVEN Conclusion and Recommendations This research has presented the impacts of rural-urban migration on income and poverty of rural households taking the case study done in Shebedino district,
Executive Summary. Overview --Fresh Market Tomatoes in California and Baja
 Executive Summary Overview --Fresh Market Tomatoes in California and Baja This case study focuses on fresh tomato production in the Stockton, Merced, Fresno, San Diego, and San Quentin areas. California
Globalisation and Open Markets
 Wolfgang LEHMACHER Globalisation and Open Markets July 2009 What is Globalisation? Globalisation is a process of increasing global integration, which has had a large number of positive effects for nations
Inequality and Poverty in Rural China
 Western University Scholarship@Western Centre for Human Capital and Productivity. CHCP Working Papers Economics Working Papers Archive 2011 Inequality and Poverty in Rural China Chuliang Luo Terry Sicular
Determinants of Rural-Urban Migration in Konkan Region of Maharashtra
 Agricultural Economics Research Review Vol. 24 (Conference Number) 2011 pp 503-509 Determinants of Rural-Urban Migration in Konkan Region of Maharashtra V.A. Thorat*, J.S. Dhekale, H.K. Patil and S.N.
Internal and International Migration and Development: Research and Policy Perspectives
 2 Internal and International Migration and Development: Research and Policy Perspectives Josh DeWind Director, Migration Program, Social Science Research Council Jennifer Holdaway Associate Director, Migration
International Journal of Pure and Applied Sciences and Technology
 Int. J. Pure Appl. Sci. Technol., 14(2) (2013), pp. 31-38 International Journal of Pure and Applied Sciences and Technology ISSN 2229-6107 Available online at www.ijopaasat.in Research Paper Assessment
Youth labour market overview
 1 Youth labour market overview With 1.35 billion people, China has the largest population in the world and a total working age population of 937 million. For historical and political reasons, full employment
Additional Information and Data Regarding FAPRI s Analysis of the House & Senate Farm Bills
 Additional Information and Data Regarding FAPRI s Analysis of the House & Senate Farm Bills FAPRI Policy Working Paper #02-02 March 2002 Prepared by the Food and Agricultural Policy Research Institute
Poverty profile and social protection strategy for the mountainous regions of Western Nepal
 October 2014 Karnali Employment Programme Technical Assistance Poverty profile and social protection strategy for the mountainous regions of Western Nepal Policy Note Introduction This policy note presents
Volume 36, Issue 1. Impact of remittances on poverty: an analysis of data from a set of developing countries
 Volume 6, Issue 1 Impact of remittances on poverty: an analysis of data from a set of developing countries Basanta K Pradhan Institute of Economic Growth, Delhi Malvika Mahesh Institute of Economic Growth,
Migration and Urban Transition in India: Implications for Development
 Migration and Urban Transition in India: Implications for Development Ram B. Bhagat Professor and Head Department of Migration and Urban Studies International Institute for Population Sciences, Mumbai,
Asian Development Bank Institute. ADBI Working Paper Series HUMAN CAPITAL AND URBANIZATION IN THE PEOPLE S REPUBLIC OF CHINA.
 ADBI Working Paper Series HUMAN CAPITAL AND URBANIZATION IN THE PEOPLE S REPUBLIC OF CHINA Chunbing Xing No. 603 October 2016 Asian Development Bank Institute Chunbing Xing is a professor at Beijing Normal
Labor Market Distortions, Rural-Urban Inequality, and the Opening of People s Republic of China s Economy
 ERD Working Paper No. 59 Labor Market Distortions, Rural-Urban Inequality, and the Opening of People s Republic of China s Economy THOMAS HERTEL AND FAN ZHAI November 2004 Thomas Hertel is Founding Director
Dimensions of rural urban migration
 CHAPTER-6 Dimensions of rural urban migration In the preceding chapter, trends in various streams of migration have been discussed. This chapter examines the various socio-economic and demographic aspects
Dynamics of Indigenous and Non-Indigenous Labour Markets
 1 AUSTRALIAN JOURNAL OF LABOUR ECONOMICS VOLUME 20 NUMBER 1 2017 Dynamics of Indigenous and Non-Indigenous Labour Markets Boyd Hunter, (Centre for Aboriginal Economic Policy Research,) The Australian National
Changing Times, Changing Enrollments: How Recent Demographic Trends are Affecting Enrollments in Portland Public Schools
 Portland State University PDXScholar School District Enrollment Forecast Reports Population Research Center 7-1-2000 Changing Times, Changing Enrollments: How Recent Demographic Trends are Affecting Enrollments
The Poor in the Indian Labour Force in the 1990s. Working Paper No. 128
 CDE September, 2004 The Poor in the Indian Labour Force in the 1990s K. SUNDARAM Email: sundaram@econdse.org SURESH D. TENDULKAR Email: suresh@econdse.org Delhi School of Economics Working Paper No. 128
ABHINAV NATIONAL MONTHLY REFEREED JOURNAL OF REASEARCH IN COMMERCE & MANAGEMENT MGNREGA AND RURAL-URBAN MIGRATION IN INDIA
 MGNREGA AND RURAL-URBAN MIGRATION IN INDIA Pallav Das Lecturer in Economics, Patuck-Gala College of Commerce and Management, Mumbai, India Email: Pallav_das@yahoo.com ABSTRACT The MGNREGA is the flagship
EVER since China began its economic reforms in 1978, rural-to-urban migration
 The Developing Economies, XLIII-2 (June 2005): 285 312 MIGRATION, LABOR MARKET FLEXIBILITY, AND WAGE DETERMINATION IN CHINA: A REVIEW ZHONG ZHAO First version received April 2004; final version accepted
DRIVERS OF DEMOGRAPHIC CHANGE AND HOW THEY AFFECT THE PROVISION OF EDUCATION
 DRIVERS OF DEMOGRAPHIC CHANGE AND HOW THEY AFFECT THE PROVISION OF EDUCATION This paper provides an overview of the different demographic drivers that determine population trends. It explains how the demographic
The Role of Migration and Income Diversification in Protecting Households from Food Insecurity in Southwest Ethiopia
 The Role of Migration and Income Diversification in Protecting Households from Food Insecurity in Southwest Ethiopia David P. Lindstrom Population Studies and Training Center, Brown University Craig Hadley
Variations in Village Migration Profiles in Rural China:An Analysis. Based on the Second National Agricultural Census Data
 Variations in Village Migration Profiles in Rural China:An Analysis Based on the Second National Agricultural Census Data This paper published in Asian and Pacific Migration Journal, Vol. 24, No.2, 2015
Household Vulnerability and Population Mobility in Southwestern Ethiopia
 Household Vulnerability and Population Mobility in Southwestern Ethiopia David P. Lindstrom Heather F. Randell Population Studies and Training Center & Department of Sociology, Brown University David_Lindstrom@brown.edu
Poverty Profile. Executive Summary. Kingdom of Thailand
 Poverty Profile Executive Summary Kingdom of Thailand February 2001 Japan Bank for International Cooperation Chapter 1 Poverty in Thailand 1-1 Poverty Line The definition of poverty and methods for calculating
Rural-Urban Poverty and Inequality in Thailand
 1 Rural-Urban Poverty and Inequality in Thailand Summary Note 1 The issues of poverty and inequality across regions as well as between urban and rural areas in Thailand are results of imbalanced development.
Inequality in China: Rural poverty persists as urban wealth
 Inequality in China: Rural poverty persists as urban wealth balloons 29 June 2011 Last updated at 22:36 GMT By Dr Damian Tobin School of Oriental and African Studies The rapid growth of China's economy
REGIONAL MIGRATION IN SUB- SAHARAN AFRICA
 REGIONAL MIGRATION IN SUB- SAHARAN AFRICA Guy Blaise NKAMLEU International Institute of Tropical Agriculture g.nkamleu@cgiar.org WorldBank Workshop on Job Creation in Africa, Eschborn-Germany, Nov 27-28,
Consequences of Out-Migration for Land Use in Rural Ecuador
 Consequences of Out-Migration for Land Use in Rural Ecuador EXTENDED ABSTRACT FOR PAA 2011 Clark Gray 1 and Richard Bilsborrow 2 1 Duke University 2 University of North Carolina at Chapel Hill In many
EFFECTS OF LABOR OUT-MIGRATION ON INCOME GROWTH AND INEQUALITY IN RURAL CHINA*
 DEVELOPMENT AND SOCIETY Volume 28 Number 1, June 1999, pp. 93~114 EFFECTS OF LABOR OUT-MIGRATION ON INCOME GROWTH AND INEQUALITY IN RURAL CHINA* LI SHI The Institute of Economics Chinese Academy of Social
THE ROLE OF LABOR MIGRATION FROM RURAL AREAS OVER THE SUSTAINABLE AGRICULTURE DEVELOPMENT IN THE REPUBLIC OF MOLDOVA
 THE ROLE OF LABOR MIGRATION FROM RURAL AREAS OVER THE SUSTAINABLE AGRICULTURE DEVELOPMENT IN THE REPUBLIC OF MOLDOVA Prof. Dr. A. Stratan, Dr. A. Ignat National Institute for Economic Research, Chisinau,
Trends in inequality worldwide (Gini coefficients)
") Section 2 Impact of trade on income inequality As described above, it has been theoretically and empirically proved that the progress of globalization as represented by trade brings benefits in the form
Section 2 Impact of trade on income inequality As described above, it has been theoretically and empirically proved that the progress of globalization as represented by trade brings benefits in the form
UNR Joint Economics Working Paper Series Working Paper No Urban Poor in China: A Case Study of Changsha
 UNR Joint Economics Working Paper Series Working Paper No. 07-009 Urban Poor in China: A Case Study of Changsha Erqian Zhu and Shunfeng Song Department of Economics /0030 University of Nevada, Reno Reno,
Labor Migration in the Kyrgyz Republic and Its Social and Economic Consequences
 Network of Asia-Pacific Schools and Institutes of Public Administration and Governance (NAPSIPAG) Annual Conference 200 Beijing, PRC, -7 December 200 Theme: The Role of Public Administration in Building
DOES POST-MIGRATION EDUCATION IMPROVE LABOUR MARKET PERFORMANCE?: Finding from Four Cities in Indonesia i
 DOES POST-MIGRATION EDUCATION IMPROVE LABOUR MARKET PERFORMANCE?: Finding from Four Cities in Indonesia i Devanto S. Pratomo Faculty of Economics and Business Brawijaya University Introduction The labour
The impacts of minimum wage policy in china
 The impacts of minimum wage policy in china Mixed results for women, youth and migrants Li Shi and Carl Lin With support from: The chapter is submitted by guest contributors. Carl Lin is the Assistant
An Analysis of Rural to Urban Labour Migration in India with Special Reference to Scheduled Castes and Schedules Tribes
 International Journal of Interdisciplinary and Multidisciplinary Studies (IJIMS), 2015, Vol 2, No.10,53-58. 53 Available online at http://www.ijims.com ISSN: 2348 0343 An Analysis of Rural to Urban Labour
8AMBER WAVES VOLUME 2 ISSUE 3
 8AMBER WAVES VOLUME 2 ISSUE 3 F E A T U R E William Kandel, USDA/ERS ECONOMIC RESEARCH SERVICE/USDA Rural s Employment and Residential Trends William Kandel wkandel@ers.usda.gov Constance Newman cnewman@ers.usda.gov
No. 1. THE ROLE OF INTERNATIONAL MIGRATION IN MAINTAINING HUNGARY S POPULATION SIZE BETWEEN WORKING PAPERS ON POPULATION, FAMILY AND WELFARE
 NKI Central Statistical Office Demographic Research Institute H 1119 Budapest Andor utca 47 49. Telefon: (36 1) 229 8413 Fax: (36 1) 229 8552 www.demografia.hu WORKING PAPERS ON POPULATION, FAMILY AND
Remittance and Household Expenditures in Kenya
 Remittance and Household Expenditures in Kenya Christine Nanjala Simiyu KCA University, Nairobi, Kenya. Email: csimiyu@kca.ac.ke Abstract Remittances constitute an important source of income for majority
Mining Toolkit. In-Migration
 Tool Child Rights and Mining Toolkit Children are the most vulnerable stakeholders regarding mining impacts, including the effects of project-related in-migration. As dependents of migrant mine workers,
The wage gap between the public and the private sector among. Canadian-born and immigrant workers
 The wage gap between the public and the private sector among Canadian-born and immigrant workers By Kaiyu Zheng (Student No. 8169992) Major paper presented to the Department of Economics of the University
Reaping the Dividends of Reforms on Hukou System. Du Yang
 Reaping the Dividends of Reforms on Hukou System Du Yang In this presentation. Hukou System and Labor Mobily Migration, Productivy, and Economic Growth Data and Methodology Gains of Comprehensive Reforms
DETERMINANTS OF INTERNAL MIGRATION IN PAKISTAN
 The Journal of Commerce Vol.5, No.3 pp.32-42 DETERMINANTS OF INTERNAL MIGRATION IN PAKISTAN Nisar Ahmad *, Ayesha Akram! and Haroon Hussain # Abstract The migration is a dynamic process and it effects
HUMAN RESOURCES MIGRATION FROM RURAL TO URBAN WORK SPHERES
 HUMAN RESOURCES MIGRATION FROM RURAL TO URBAN WORK SPHERES * Abstract 1. Human Migration is a universal phenomenon. 2. Migration is the movement of people from one locality to another and nowadays people
II. Roma Poverty and Welfare in Serbia and Montenegro
 II. Poverty and Welfare in Serbia and Montenegro 10. Poverty has many dimensions including income poverty and non-income poverty, with non-income poverty affecting for example an individual s education,
Is Economic Development Good for Gender Equality? Income Growth and Poverty
 Is Economic Development Good for Gender Equality? February 25 and 27, 2003 Income Growth and Poverty Evidence from many countries shows that while economic growth has not eliminated poverty, the share
Nominal and Effective Rates of Protection by Industry in Pakistan: A Tariff Based Analysis
 NUST JOURNAL OF SOCIAL SCIENCES AND HUMANITIES Vol.3 No.1 (January-June 2017) pp.1-45 Nominal and Effective Rates of Protection by Industry in Pakistan: A Tariff Based Analysis Abstract: Nadeem Ul Haque
Assessment of Demographic & Community Data Updates & Revisions
 Assessment of Demographic & Community Data Updates & Revisions Scott Langen, Director of Operations McNair Business Development Inc. P: 306-790-1894 F: 306-789-7630 E: slangen@mcnair.ca October 30, 2013
Problems Involved in Improving the Quality of Life in Albania in the Years
 Problems Involved in Improving the Quality of Life in Albania in the Years 2000-2012 Doi:10.5901/mjss.2013.v4n10p312 Abstract Dr. Enriko Ceko There are some major issues to be clarified about the quality
MARIS NETWORK. Migration, Agriculture and Resilience: Initiative for Sustainability
 MARIS NETWORK Migration, Agriculture and Resilience: Initiative for Sustainability MARIS is a network of researchers and practitioners with a common interest in putting migration at the forefront of the
Changing Gender Relations and Agricultural Labour Migration: Reconsidering The Link
 Changing Gender Relations and Agricultural Labour Migration: Reconsidering The Link 4th International Seminar on Migrations, Agriculture and Food Sustainability: Dynamics, Challenges and Perspectives in
Rural migrants in Morogoro city
 Rural migrants in Morogoro city Looking for maisha, a better life Jorieke Irene Kloek Rural migrants in Morogoro city Looking for maisha, a better life Jorieke Irene Kloek June 2011 Master Thesis International
Lessons of China s Economic Growth: Comment. These are three very fine papers. I say that not as an academic
 Lessons of China s Economic Growth: Comment Martin Feldstein These are three very fine papers. I say that not as an academic specialist on the Chinese economy but as someone who first visited China in
Internal Migration to the Gauteng Province
 Internal Migration to the Gauteng Province DPRU Policy Brief Series Development Policy Research Unit University of Cape Town Upper Campus February 2005 ISBN 1-920055-06-1 Copyright University of Cape Town
ECON 436: International Trade TRADE ESSAY FINAL DRAFT
 ECON 436: International Trade TRADE ESSAY FINAL DRAFT Question How have the recent developments within the Doha Development Agenda affect the multilateral trade negotiations amongst advance and developing
Accessing Home. Refugee Returns to Towns and Cities: Experiences from Côte d Ivoire and Rwanda. Church World Service, New York
 Accessing Home Refugee Returns to Towns and Cities: Experiences from Côte d Ivoire and Rwanda Church World Service, New York December 2016 Contents Executive Summary... 2 Policy Context for Urban Returns...