Labor Migration and Employment in Post- Apartheid Rural South Africa
|
|
|
- Ashlie Booth
- 6 years ago
- Views:
Transcription

1 University of Colorado, Boulder CU Scholar Sociology Graduate Theses & Dissertations Sociology Summer Labor Migration and Employment in Post- Apartheid Rural South Africa Casey Lanier Blalock University of Colorado Boulder, Follow this and additional works at: Part of the Demography, Population, and Ecology Commons Recommended Citation Blalock, Casey Lanier, "Labor Migration and Employment in Post-Apartheid Rural South Africa" (2014). Sociology Graduate Theses & Dissertations This Thesis is brought to you for free and open access by Sociology at CU Scholar. It has been accepted for inclusion in Sociology Graduate Theses & Dissertations by an authorized administrator of CU Scholar. For more information, please contact
2 LABOR MIGRATION AND EMPLOYMENT IN POST-APARTHEID RURAL SOUTH AFRICA by CASEY LANIER BLALOCK B.A., Rhodes College, 2003 M.A., University of Memphis, 2006 A thesis submitted to the Faculty of the Graduate School of the University of Colorado in partial fulfillment of the requirement for the degree of Doctor of Philosophy Department of Sociology 2014
3 This thesis titled Labor Migration and Employment in Post-Apartheid Rural South Africa and written by Casey Lanier Blalock has been approved for the Department of Sociology Jane Menken Co-chair of Committee Jason Boardman Co-chair of Committee May 8, 2014 The final copy of this thesis has been examined by the signatories, and we find that both the content and the form meet acceptable presentation standards of scholarly work in the above mentioned discipline.
4 Casey Lanier Blalock (Ph.D. Sociology) Labor Migration and Employment in Post-Apartheid Rural South Africa Thesis directed by Distinguished Professor Jane Menken and Associate Professor Jason Boardman South Africa formally began its transition into a neoliberal, democratic country in 1994 with its first elections. Although Black Africans gained equal access to public services and the freedom to relocate to formerly restricted areas, massive unemployment throughout South Africa during the post-apartheid era has prevented the majority of Black Africans from overcoming apartheid-era poverty. This dissertation aims to document the economic activity of a population in the former homeland of Gazankulu. Understanding the economic activities in former homelands is tricky. The labor migrant system under apartheid has continued into the post-apartheid era. Through labor migration, the economic activities of these populations occur outside the former homelands. The definitive source of employment and labor force data in South Africa is the Quarterly Labour Force Survey, formerly the Labour Force Survey. This survey uses a de facto population in which individuals are enumerated only if they have been recently present in the sampled households. This distorts our understanding of rural unemployment because it captures the economic activities only of those who do not engage in labor migration. This study uses data collected by the Agincourt Health and Demographic Surveillance Study (AHDSS) to evaluate the employment activities of the population within the AHDSS study site. As these data include a broadly defined, de jure household, this dissertation speaks to the employment of both labor migrants and non-migrants. The iii
5 analyses presented in this dissertation reveal the limitations of survey data that use de facto populations in contexts where labor migration is high. iv
6 ACKNOWLEDGEMENTS I d like to thank all of the people who have offered their love, support, and guidance throughout my graduate career. Foremost, I d like to thank my family for being so awesome. All of my life s accomplishments, including this dissertation, wouldn t have been possible without my family. They have nurtured my curiosity, accepted my limitations, and freely given their unconditional praise. For that, I thank them. I also want to thank my Colorado family. I met wonderful people and lifelong friends while in graduate school. For fear of overlooking someone in my haste to submit the dissertation, I will forgo listing them individually. We have shared many wonderful memories, and I am looking forwarding to creating more! I would like to thank Jason Boardman and Jane Menken, who served as co-chairs on my committee. Jason hired me as a research assistant (RA) during my first year at CU. He was my first exposure to demographic research. In addition to including me in his own research, Jason was a central component to my graduate school experience. He is always available to offer mentorship and guidance, and I learned much from Jason informally through our frequent meetings in his office. I thank him generally for his dedication to the students of sociology and specifically for the time he spent helping me grow as a demographer and as a person. Jane Menken served as the other committee co-chair, and like Jason, I have worked with Jane on many of her own projects. Jane opened doors that I didn t know existed, and she played a central role in shaping my interest in international research. She provided opportunities for me and others to travel to South Africa and join in existing v
7 collaborations with the scholars at the University of Witwatersrand and the Agincourt Health and Demographic Surveillance System. My dissertation would not have been possible without Jane s guidance and pragmatism, and I thank her for all of her contributions. I am also grateful to my other committee members. Jill Williams reviewed countless drafts of my work and provided a sounding board for various ideas on a nearly monthly basis during the last few years. Randall Kuhn helped me fashion a dissertation by pushing me to consider new ideas and take different perspectives. Fernando Riosmena gave invaluable feedback on the broader labor migration literature and the overall framing of the thesis. I want to thank all of my committee for their patience and instruction throughout the dissertation-writing process. I would like to thank all the students, staff, and faculty members at the Institute of Behavioral Science (IBS) and the University of Colorado Population Center. These institutes offered tangible support in completing my degree, such as office space, printing and technology services, and travel funding to various conferences. Moreover, the people working at IBS are a great group of individuals. They provided a fertile environment for learning and collaboration, and all of the research tips, statistical tidbits, and programming tricks that I learned from the folks at IBS have certainly helped me complete the dissertation and have made me a better scholar and researcher. I d like to thank my colleagues at the Agincourt Health and Demographic Surveillance System who provided data and insight into the running of a demographic surveillance study. vi
8 As an RA, I benefited from the financial support of several institutions. I have worked under training fellowship funding from the William and Flora Hewlett Foundation, and under research grants sponsored by the National Institutes of Health, the Eunice Kennedy Shriver National Institute of Child Health and Human Development, and the Office of Population Affairs, Department of Health and Human Services. vii
9 CONTENTS CHAPTER 1. INTRODUCTION... 1 Contributions... 3 Chapter Outlines... 4 CHAPTER 2. LITERATURE REVIEW... 8 Historical Context of Apartheid... 8 Economic Change and Unemployment in South Africa Circular Labor Migration and African Households CHAPTER 3. METHODS AND DATA Agincourt Study Site Migration Measures Labour Force Status Module Data Limitations CHAPTER 4. AGINCOURT AT WORK: THE PROFESSIONS AND ECONOMIC SECTORS OF WORKERS IN Introduction Chapter Methods Geography of the Employed Agincourt Labor Force Employment in Agincourt Discussion viii
10 CHAPTER 5. RESIDENCY AND DIFFERENCES IN THE LABOR MARKET RATES OF AGINCOURT The Nature of Residency Requirements Chapter Methods AHDSS Labor Migration Rates AHDSS Labor Force Rates Discussion CHAPTER 6. LABOR MIGRATION IN A VOLATILE LABOR ECONOMY Introduction Chapter Methods Results Discussion CHAPTER 7. FEMALE LABOR MIGRATION AND HOUSEHOLD COMPOSITION Introduction Chapter Methods Results Discussion CHAPTER 8. DISCUSSION Key Findings ix
11 Future Directions CHAPTER 9. REFERENCES APPENDIX 1. THE AGINCOURT HEALTH AND DEMOGRAPHIC SURVEILLANCE SYSTEM: CENSUS DEFINITIONS, SURVEY INSTRUMENTS, AND VARIABLE RECODES Agincourt DHSS definitions School Enrollment Labour Force Status Module Educational Attainment Elderly Pension Measures APPENDIX 2. ADDITIONAL TABLES AND FIGURES x
12 TABLES Table 4.1. Row percentages of employed individuals who are local workers, commuters, and labor migrants, by age category Table 4.2. Percent and average months spent outside of the household of employed individuals, by location of employment Table 4.3. Sectoral distribution of employed, by labor migrant status Table 4.4. Distribution of professions among employed non-migrant workers in Agincourt Table 4.5. The percent working informally and the average months spent outside of the household among employed men and women, by work location and profession 54 Table 6.1. Labor migrant status at a one year follow-up for labor migrants and nonmigrant, by educational attainment, gender, and age Table 6.2. Logistic regression models of continuing labor migration among 20 to 49 year olds from 2000 to Table 6.3. Logistic regression models of beginning labor migration among 20 to 49 year olds from 2000 to Table 6.4. Logistic regression models of economic activity among non-migrants in 2000, 2004, and Table 7.1. Means and percentages of model covariates, by labor migrant status Table 7.2. Coefficients (standard errors) of logistic regression models predictive of labor migration among women aged 20 to 49 in 2000, 2004, and Table 7.3. Coefficients (standard errors) of logistic regression models predictive of labor migration among women aged 20 to 49 in 2000, 2004, and xi
13 Table 7.4. Average fitted probabilities of female labor migration Table 7.5. Uniqueness of variance Table A1.1. Median years of education (percent of individuals with education higher than the median), by age, sex, and year Table A2.1. Labor migration rates per 1000, by sex and age group Table A2.2. Employment rates of Agincourt HDSS in 2000, by de facto - de jure population Table A2.3. Employment rates of Agincourt HDSS in 2004, by de facto - de jure population Table A2.4. Employment rates of Agincourt HDSS in 2008, by de facto - de jure population Table A2.5. Employment rates of Agincourt HDSS in 2000, by educational attainment Table A2.6. Employment rates of Agincourt HDSS in 2004, by educational attainment Table A2.7. Employment rates of Agincourt HDSS in 2008, by educational attainment Table A2.8. Percent of Agincourt HDSS workers working in taxed employment, as employees, and on a permanent basis, by profession and employment location 172 Table A2.9. Annual unemployment rates and employment to population ratios, by sex and age group Table A2.10. Unemployed labor migrants per 1000 labor migrants, by year xii
14 Table A2.11. Coefficients (standard errors) of logistic regression models predictive of labor migration among women aged 20 to 49 in 2000, 2004, and xiii
15 FIGURES Figure 2.1. Percent of district municipalities born in another province Figure 3.1. Map of the Agincourt HDSS Figure 3.2. Select maps of South Africa, highlighting the Agincourt HDSS study site Figure 4.1. Public service facilities in the Agincourt HDSS study site Figure 5.1. Labor migration rates in Figure 5.2. The number of recent in-migrants and employed Black Africans per 1000, by age and gender Figure 5.3. Labor force participation rates in Figure 5.4. N and percent economically active and enrolled in school in Figure 5.5. Reasons for economic inactivity in Figure 5.6. Unemployment rates in Figure 5.7. Unemployment rates in 2008, by labor migrant status Figure 5.8. Employment rates in Figure 6.1. Urban and rural unemployment rates, 2000 to Figure 6.2. National unemployment rates, 2000 to Figure 6.3. Labor migrants per 1000 of the population, by year Figure 6.4. Male unemployment rates per 1000, by year and labor migrant status Figure 6.5. Female unemployment rates per 1000, by year and labor migrant status Figure 6.6. Average fitted probabilities of continued labor migration among labor migrants, by age and educational attainment Figure 6.7. Average fitted probabilities of continued labor migration among labor migrants, by age and educational attainment xiv
16 Figure 6.8. Labor Migration, unemployment, and employment rates, Figure 6.9. Average fitted probabilities of continued labor migration among labor migrants, by employment rates and unemployment rates Figure Average fitted probabilities of beginning labor migration among non-labor migrants, by employment rates and unemployment rates Figure Employment status, by sex, age group, and year Figure Difference in the average fitted probabilities of employment status between high and low levels of educational attainment Figure Difference in the average fitted probability of employment status among non-labor migrants between those with a high and low propensity for labor migration Figure 7.1. Mean fitted probabilities of female labor migration, by household composition of women aged 50 and older Figure 7.2. Mean fitted probabilities of female labor migration, by household composition of men aged 50 and older Figure A1.1. Percent enrolled in school in Agincourt, by year Figure A1.2. AHDSS Labour Force Status Module: Response options for reasons not working Figure A1.3. AHDSS Labour Force Status Module: Response options for the questions used to designate informal employment Figure A1.4. Recoding procedures for work locations Figure A1.5. Recoding procedures for employment sector Figure A1.6. Recoding procedures for occupation xv
17 Figure A1.7. Percentage of age-eligible women receiving the pension Figure A1.8. Percentage of age-eligible men receiving the pension Figure A2.1. Distribution of fitted labor migrant probabilities in 2000, 2004, and 2008 for women aged 20-49, by 5-year age group Figure A2.2. Distribution of fitted labor migrant probabilities in 2000, 2004, and 2008 for men aged 20-49, by 5-year age group xvi
18 CHAPTER 1. INTRODUCTION This dissertation explores contemporary labor migration and employment in a former homeland through the lens of apartheid-era policies. Under apartheid, a vast labor migration system linked the rural homelands to the industrial and economic centers of the country. Following South Africa s official transition to democracy, the legacy of apartheid s coercive settlement policies is still observed in the former homelands. However, the understanding of post-apartheid labor migration and rural unemployment is polarized. On the one hand, the persistence of the labor migrant system undermines the assumption that rural populations will eventually resettle their families to their places of employment. On the other hand, unemployment within the former homelands is treated as a problem of local economic development. This dissertation addresses the intersection of labor migration and rural unemployment to show that rural unemployment in contemporary South Africa is linked to the labor migrant system and to the ability of individuals in the former homelands to find work in other parts of the country. The contribution of labor migration to employment in the former homelands is hidden by the de facto nature of national data sources. As national employment data impose residency requirements, the employment of labor migrants goes unrecognized in the official statistics of the areas encompassing the former homelands. This dissertation uses data collected by the Agincourt Health and Demographic Surveillance System (AHDSS) 1 in a rural area of Bushbuckridge and 1 AHDSS is used throughout the dissertation to refer to the study organization and refer to the research instruments that collect the data. Agincourt, study site, and Agincourt Demographic Surveillance Site (DSS) are used interchangeably to refer to the geographic area of the study site or its people. 1
19 shows that the magnitude of unemployment in the area is related to the labor migrant system. These data are ideal for the exploration of employment in the former homelands because they employ a broad, de jure definition of the population. In this area, roughly three-quarters of employed men and nearly half of employed women spend six months or more away from their homes in Bushbuckridge, and many of these individuals and their economic activities would be overlooked by national labor force surveys. South Africa s unemployment rate has been high and volatile since Due to an erosion of unskilled jobs and a casualization of many occupations, job insecurity has been a postapartheid reality faced by many in the former homelands. Where apartheid coerced the labor migrant system, job insecurity and a weak labor market have necessitated the continuation of labor migration. This dissertation shows that national economic downturns and rising national unemployment are associated with a concurrent reduction in labor migration from Agincourt, suggesting that rural unemployment is partially determined by the inability of labor migrants to find jobs. The displacement of the unemployed to rural areas through the labor migrant system is a reflection of South Africa s apartheid past. This dissertation discusses the recent changes in the labor migrant system and suggests that labor migration maintains its relevance in post-apartheid South Africa as a household strategy for dealing with job insecurity and a volatile labor market. Several theoretical perspectives understand individual labor migration and economic activities as household-level processes. Through its evaluation of employment and labor migration in South Africa, this dissertation argues that the theoretical concept of a household is often out of sync with the operational definition of households used in surveys. Social research is often inattentive to the operational definitions of households, yet these definitions have implications for the creation of household compositional characteristics, such as headship, 2
20 dependency ratios, or even size, as well as the effective population in which research can be generalized. CONTRIBUTIONS This dissertation provides a comprehensive account of the economic activities of a population in a former South African homeland. Such accounts are currently unavailable in the employment literature of South Africa. One contribution of this dissertation is that it summarizes anecdotal descriptions and highly specific case studies into a comprehensive picture of the economic activities of a population in a former homeland. In presenting the case that labor migration contributes substantially to the employment of rural populations in the former homelands, this dissertation shows that increases in national unemployment rates stunt labor migration rates in the Agincourt study site. This is consistent with what would have been expected under apartheid. Instead of a weak national labor market increasing labor migration through those who are unemployed seeking employment elsewhere, a weak national labor market induces potential labor migrants to remain in the former homelands. This raises issues with assessments of regional disparities in employment and unemployment rates as labor migrants without jobs continue to follow the apartheid pattern of returning to their former homelands. Finally, this dissertation makes a further contribution to a diverse group of literatures by questioning the use of surveys based on de facto populations. While this dissertation focuses specifically on labor migration and employment, it forces the question of who should and should not be included on household rosters in demographic surveys. Our understanding of many demographic outcomes in developing countries is often informed by household composition. The prevention of over-counting often dictates that surveys use both de facto populations and 3
21 residency requirements, yet de facto populations exclude those who are away earning resources for the household. CHAPTER OUTLINES CHAPTER 2 Chapter 2 describes the context for understanding labor migration and employment in contemporary South Africa. This chapter begins with a discussion of apartheid and the nature of racial segregation in the homeland system. The restrictions to mobility and the impediments placed on the development of human capital among Black Africans created spatial imbalances in employment and economic development. Because it maintained an unskilled Black population and allowed few opportunities for advancement or educational attainment, apartheid undercut the ability of Black Africans to freely participate in the post-apartheid economy. The chapter follows with a discussion of changes in formal and informal employment in South Africa after These changes have resulted in considerable job insecurity among those fortunate enough to have work and considerable unemployment among Black Africans. The employment insecurity characteristic of unskilled and low-skilled jobs is an important backdrop for understanding the challenges facing those in the former homelands. This chapter concludes with a discussion of households in southern Africa. Despite the revocation of policies preventing permanent resettlement, labor migration in contemporary South Africa is likely due to income and employment insecurities faced by households in the former homelands. Labor migration may serve as a mechanism for households to cope with the challenges of South Africa s labor economy. 4
22 CHAPTER 3 Chapter 3 discusses the primary source of data used in the dissertation. This dissertation uses demographic surveillance data collected by the AHDSS in the Bushbuckridge municipality in northeast South Africa. The data are appropriate for an evaluation of employment in the former homelands due to the de jure nature of the study s population and its ability to monitor labor migrants as they work throughout the region. The chapter discusses the specific survey instruments used in the dissertation and offers a discussion on the general limitations of the AHDSS data and the characteristics that may be unique to Agincourt relative to other former homelands. CHAPTER 4 Chapter 4 provides a descriptive assessment of the employment characteristics of the Agincourt population in In short, this chapter answers the question, Where do they go and what do they do? Because many in Agincourt work as labor migrants, the chapter is divided into two sections: The first section addresses the geographic characteristics of employment and the economic sectors in which the Agincourt population is employed, and the second section addresses the employment of those who work within the study site. There are no comprehensive overviews of work within the rural areas of the former homelands, and this latter section attempts to identify the primary occupations and sources of employment among those who do not travel to work elsewhere. CHAPTER 5 Chapter 5 demonstrates the de facto and de jure labor force rates for Agincourt in The chapter discusses the differences between a de facto and a de jure population and argues that 5
23 a de jure population better reflects Agincourt s economic activity and the population s ability to find work. National surveys, particularly those used to monitor the labor market, impose residency requirements and enumerate the de facto population. As such, labor force rates calculated for migrant-sending areas will be skewed to suggest greater unemployment among the population as employed labor migrants are likely to be absent during the survey. CHAPTER 6 Chapter 6 addresses fluctuations in labor migration from Agincourt over time. The chapter presents models predicting the continuation of labor migration from one year to the next and separate models predicting non-migrants entry into labor migration. This chapter seeks to establish that labor migration from Agincourt is conditioned on fluctuations in national unemployment and employment rates. While rural unemployment rates are typically higher than rates in urban areas, this chapter suggests that rural unemployment rates are linked to urban unemployment rates through the circular movement of employed and unemployed labor migrants. Increases in the urban unemployment rate may contribute to unemployment in rural areas, or, conversely, rising unemployment in rural areas may spill over into urban areas. After presenting the analysis strategy and results, the chapter discusses the potential for regional differences in labor force rates to be misinterpreted due to the mobility of employed labor migrants away from origin areas and the return of unemployed labor migrants to origin areas. The nature in which regional unemployment rates are distorted by labor migration will be dependent on the economic activities of returned labor migrants. The chapter identifies individuals in Agincourt who are likely to be labor migrants and evaluates differences in nonmigrant employment based on individual propensities for labor migration. 6
24 CHAPTER 7 Chapter 7 presents models of labor migration among women as an example of the substantive implications of de facto versus de jure definitions of households. The post-apartheid era has witnessed a growth in female labor migration, and researchers are seeking to identify the determinants and contexts of female labor migration. In much demographic research, household composition figures prominently as an explanatory variable in statistical models. The male composition of households and the presence of elderly pensioners have been used to understand the employment and migrant decisions of women in South Africa. This chapter evaluates the claims of both sets of hypotheses using the AHDSS data. CHAPTER 8 Chapter 8 summarizes the main findings of the dissertation and discusses areas of potential future research. 7
25 CHAPTER 2. LITERATURE REVIEW HISTORICAL CONTEXT OF APARTHEID Throughout South Africa s modern history, labor migration has supplied the industrial needs for cheap labor. Black migrant labor was first recruited during the late 1880s for work in the gold and diamond mines (Cordell, Gregory, and Piché 1996; Maloka 1997). During the mid- 20 th century, a boom in South African manufacturing increased demand for cheap labor. Data on circular labor migration under apartheid is limited, making statements of the exact magnitude of labor migration difficult. Despite this limitation, evidence suggests that a considerable portion of the Black African population was labor migrants. Crude estimates show that the rate of 15- to 64-year-old male migration grew 3.1 percent per year between 1936 and 1970, reaching a total of 34 percent in 1970 (Nattrass 1976), and some areas saw nearly half of working-aged males migrating to the mines (Murray 2008). Although labor migrants were present in the economic centers since the late 19 th century, much of the Black African population continued to live in the countryside. Economic activities among those living in rural locations were largely rooted in subsistence agriculture. Through the expansion of privately (and generally White) owned farms, population density in the rural areas began to increase, eroding the agricultural base of the subsistence economy. As the non-migrant rural populations were less supported by traditional rural livelihoods, many migrated to urban areas, swelling the urban Black population (Maylam 1990). The urbanization of Black Africans from the 1920s through the 1940s threatened urban White populations, and in 1948, the National Party came to power in South Africa and responded to this urbanization by enacting its policy of separate development (Lipton 1972). Apartheid 8
26 served as a political and legal basis for balancing the desire of Whites to maintain racial segregation while assuring that White industries maintained access to Black labor. The two key policies pertinent to addressing these competing goals were the establishment and formalization of Black and White areas and the accompanying restrictions placed on the mobility and settlement of Blacks 2. The restrictions on settlement, commonly referred to as the pass laws, were paramount to assuring that only employed Blacks were allowed within designated White areas. As the name pass laws suggests, Black Africans were required to carry documentation, or passes, proving their employment status while travelling within White designated areas. Apartheid never achieved the complete exclusion of Black Africans from White areas, and arguably, apartheid policies never aimed for a complete segregation of racial groups. Rather, apartheid sought to remove the segments of the Black African population that were superfluous to the White economy (Baldwin 1975). In other words, those who were unemployed and the families of labor migrants were forced to remain in the homelands and townships. One estimate suggests that between 1916 and 1984, some 17.7 million Blacks were arrested, prosecuted, and relocated from White areas under the pass laws (Savage 1986). The pass laws provided the legal basis for the exclusion of Blacks, and the formation of the Black homelands, or Bantustans, provided the ideological justification for segregation. The platform of separate development held that the diverse racial and ethnic groups in South Africa should maintain sovereignty over their own economic development, cultural preservation, 2 The freedoms of all non-white racial groups were limited by the apartheid regime (Swanson 1968). Although this dissertation focuses singularly on the Black African population, the failure to reference other non-white populations is not intended to diminish the magnitude of apartheid s impact the livelihoods and well-being of other groups in South Africa. 9
27 provision of social services, and taxation. The ethnic groups were cast as nations, and the homelands were consolidated to provide independent territories for the various groups. The engineering of the homelands entailed the consolidation and relocation of a substantial number of Blacks Africans who formerly lived and owned property in newly zoned White areas. By 1980, an estimated 6.3 million Black Africans had been forced to move, with another 7.7 million slated for relocation (Rogers 1980). The forced relocation and consolidation exacerbated the existing population pressures in rural areas, further eroded the potential for livelihoods based on subsistence agriculture, and undermined the ability of most Black households to partake of traditional livelihoods. In fact, the relocations resulted in the average family having minimal land access beyond their residential plot and created a large landless population in the homelands (Smith 2003). The apartheid regime was aware of the immediate and long-term hurdles preventing full independence among the homelands. In 1954, the Tomlinson Report made recommendations for the creation of sustainable homelands and called for investments in the rural agricultural economy (Tomlinson 1955). However, most recommendations were not followed (Legassick 1974), and the limited resources that were directed toward the homelands were used for the relocation of households, the consolidation of homelands, and the provision of the trappings of independence, such as municipal buildings and airports (Rogers 1980). The creation of the homelands established decentralized local authorities who were presented as independent governments. Despite the supposed independence of these governments, officials within the national government acted as the de facto administrators of the homelands (Rogers 1980). Where the development of the homeland system served apartheid s grand spatial policy, urban areas themselves were delineated into racially segregated areas, and 10
28 Black Africans were forced to live in townships. The apartheid government did little to expand infrastructure or improve the agricultural or economic base of Black areas. In fact, apartheid policies hindered the economic development of the homelands. Economic growth and development were stunted by policies granting White-owned businesses preference, a lack of basic infrastructure in and geographic isolation of the homelands, and impediments to education and training among Black Africans (Rodrik 2008). Without opportunities to create independent and sustainable livelihoods within the homelands and with pass law restrictions preventing the relocation of unemployed workers and dependent family members to more favorable areas, circular labor migration and the participation of labor migrants in wage labor for White-owned businesses were the primary means for income and survival in many of the former homelands. An analysis of the labor force using the 1970 census shows that African male labor migrants made up roughly 28 percent of the total male workforce in the formal economy of White areas, and labor migrants constituted 59 percent of the Black African male workforce in these areas (Nattrass 1976), with the other 41 percent residing permanently in urban townships. By creating a set of densely populated, impoverished homelands and preventing the relocation of Black Africans, apartheid solidified a system of circular labor migration wherein the working, mostly male, population would spend months or years at a time away from their families while working in the mines and on the plantations of South Africa (Crush and Tshitereke, Clarence 2001; Maloka 1997). This pattern of split families and distant employment underlies apartheid s legacy of segregation and inequality. 11
29 ECONOMIC CHANGE AND UNEMPLOYMENT IN SOUTH AFRICA Apartheid ensured a supply of Black unskilled labor. Where pass laws and poor development of the homelands enabled racial segregation while allowing Black Africans to travel temporarily for work, apartheid also ensured that Black Africans would remain unskilled by limiting their workplace advancement and denying them educational opportunities (Terreblanche 2002). By crippling the development of human capital among Black Africans throughout South Africa s economic development, those in the former homelands have been disadvantaged by the economic changes that have occurred post-apartheid. Black Africans have been the most burdened by post-apartheid unemployment. According to conservative estimates in 2007, 27.6 percent of Black Africans were unemployed, relative to 4.4 percent of Whites (StatsSA 2008c). A central feature of the apartheid agenda was the delineation and separation of racial groups. Due to the sequestration of many Black Africans into homelands, persistent racial inequality is interrelated with the spatial inequalities imposed by apartheid. Understanding the labor force of the former homelands is a necessary step in accessing the full legacy of apartheid and persistent racial inequalities in South Africa. The labor force and access to employment are the primary determinants of economic inequality in South Africa (Bhorat et al. 2001; Burger and Woolard 2005; Woolard and Klasen 2005). As is the case in studies of the labor force, studies of well-being and poverty have not been attentive to the historical roots of the dependency of the homelands on the larger national economy. A primary motivation behind apartheid policies was to make cheap labor available to the mining and agricultural sectors. Apartheid achieved this goal by limiting the educational attainment and workplace advancement of Black Africans and eroding their ability to maintain livelihoods outside the White economy. During the course of apartheid, its policies grew out of 12
30 sync with the South African economy, which began to liberalize in the 1980s. After establishing itself in office, the African National Conference (ANC) solidified South Africa s path to a liberal, globalized economy by making the private sector a cornerstone of its economic development policies (Lewis 2001). Throughout this process, South Africa s economy reoriented to capital-intensive exports and labor-intensive imports (Edwards 2001). This change is associated with the loss of unskilled employment opportunities and has led some to question whether democracy has improved the lives of those who were disenfranchised by apartheid (Seidman 1999). The loss of unskilled employment opportunities has been particularly disastrous to Black Africans. As they gained the ability to freely participate in the economy, demand for unskilled labor declined, leading to the skills imbalance characteristic of the first two decades of democracy (Bhorat et al. 2001; Edwards 2001; Kraak 2008a). The number of workers employed in the mining and agricultural sectors has declined (StatsSA 2010) due in part to the adoption of capital-intensive modes of production (Altman 2006; Banerjee et al. 2008). Ironically, postapartheid labor regulations may have increased the incentives for businesses to fill unskilled jobs with foreign labor (Barrientos and Kritzinger 2004; Bezuidenhout and Fakier 2006; Johnston 2007; Pons-Vignon and Anseeuw 2009), as immigrants lack the protections afforded to South Africans. Both the mining and agricultural sectors have increased their use of immigrant labor (Crush and Tshitereke, Clarence 2001; Johnston 2007). Thus, the two industries that have traditionally employed the bulk of unskilled labor are decreasingly providing employment opportunities for Black Africans. Where unskilled employment within the formal sector has declined, employment within the informal sector has increased in the post-apartheid era. Through several mechanisms, 13
31 apartheid policies stunted the growth of Black-owned businesses (Heintz and Posel 2008; Rodrik 2008). Improvements to rural infrastructure and the removal of discriminatory restrictions on Black businesses have likely increased since Although estimation of informal employment is imprecise, official estimates for 2008 indicate that 41 percent of employed women and 32 percent of employed men worked in the informal sector (StatsSA 2008d). Officially, over a third of the labor force is employed informally, but many have suggested that national surveys fail to capture many informal economic activities and that published figures based on these surveys underestimate the magnitude of informal employment (Grant 2010; Heintz and Posel 2008). Muller and Esselar (2004) even argued that the majority of growth in employment during the late 1990s and early 2000s was due to growth in the informal economy. Where unregulated employment via the informal sector has likely increased in the postapartheid era, shifts in the nature of unskilled and semi-skilled jobs within the formal sector have also occurred. Unskilled jobs have come to be more tenuous and afford fewer economic securities (Bodibe 2006), and as such, several scholars of the South African labor market have advocated broader consideration of the nature of employment beyond the formal/informal distinction. These individuals often consider the employment characteristics typical of a standard employment relationship (SER) 3 (Theron 2003; Webster and Von Holdt 2005), which, in addition to working under regulated conditions (i.e., formal employment), also entails a direct 3 Informal employment is typically assessed based on the nature of employers and their regulation by government authorities and labor legislation. Guidelines established by the 17 th International Conference of Labour Statisticians dictate that the intent of measuring informal employment is to identify those who lack job security and the typical benefits of the formal sector, such as minimum wages, fringe benefits, due process in employee termination, or standards in work place safety (Hussmanns 2004). Unregulated businesses may afford employees all of these benefits, while the employees of regulated businesses may be denied these securities in reality. As such, the nature of the employment relationship, rather than the characteristics of the employer, are subject of much research into informal employment. 14
32 relationship to an employer rather than contract work or self-employment, and grants long-term job security, unlike temporary and contract situations. Formal businesses in South Africa have begun outsourcing many secondary functions, such as janitorial, maintenance, and other support services. Moreover, some industries that rely on manual labor, such as the timber industry, have begun satisfying the majority of their labor needs through labor brokers. This outsourcing generally reduces wages, decreases job security, and weakens the protection of labor regulations (Barrientos and Kritzinger 2004; Bezuidenhout and Fakier 2006; Johnston 2007; Muller and Esselar 2004; Pons-Vignon and Anseeuw 2009). Where South Africa has seen a trend toward outsourcing many unskilled jobs, these jobs have also become more tenuous. As an indication of the insecurity within the South African labor force, a national survey of firms in 2001 showed an average rate of employee turnover of 10 to 20 percent over a threemonth period (StatsSA 2001). Others have used individual panel data to assess transitions between unemployment and employment within the formal and informal sectors. This work showed that, between 2001 and 2004, roughly 54 percent of individuals shifted among unemployment, informal employment, and formal employment (Valodia et al. 2006). Note that, due to the lack of data, this study does not capture changing jobs, and as such, is an underestimate of the true employment turnover over that three-year period. Regardless, these findings point to the turbulence within the South African labor force, much of which involves exit from and entry into the informal economy. CIRCULAR LABOR MIGRATION AND AFRICAN HOUSEHOLDS Local economic development in the former homelands and the types of jobs and employment offered in these areas are important factors of apartheid s legacy; labor migration is 15
33 another facet to its legacy. Under apartheid, resettlement restrictions combined with economic necessity compelled circular migration between the homelands and urban areas. After the repeal of the pass laws, there was an apparent assumption that circular labor migration would be replaced by permanent resettlement of families in the former homelands as they migrated to more developed areas (Posel and Casale 2003; Williams et al. 2008). Despite a wave of emigration from the former homelands immediately following apartheid (Reed 2012), this assumption has been proven false by the continuation of labor migration. Circular labor migration in South Africa continues at its pre-apartheid levels (Collinson, Tollman, and Kahn 2007; Posel and Casale 2003), and there is some evidence that labor migration has even increased (Collinson et al. 2007; Reed 2012). As under apartheid, Black Africans constitute the bulk (over 90 percent) of labor migrants, and during the 1990s, 22 percent of Black households had at least one migrant, with 85 percent of them receiving cash transfers or remittances (Posel and Casale 2003). Data from the 2009 General Household Survey indicate that 15 percent of rural households depend solely on labor migrant remittances, and 56 percent of households depend on a combination of grants and/or remittances (Alemu 2011). Figure 2.1 shows the percentage of municipal populations who were born in another province. Although this figure does not adequately distinguish permanent resettlement from circular labor migration, it demonstrates the magnitude of interprovincial movements and mobility within South Africa. More than 30 percent of the population in Gauteng, the capitol and South Africa s economic hub, was born in other provinces. 16
, prepared by United Nations Office for the Coordination of Humanitarian Affairs (OCHA 2009) Gauteng and")

34 Figure 2.1. Percent of district municipalities born in another province Source: 2001 Census (StatsSA 2003), prepared by United Nations Office for the Coordination of Humanitarian Affairs (OCHA 2009) Gauteng and the surrounding areas of the Highveld were key destinations during the colonial period due to the concentration of gold mines. In fact, Gauteng and specifically Johannesburg were established and grew because of the mining industry. Although the area s economy is no longer dominated by mining, labor migrants continue to be part of the labor force of the nation s capital. Labor migrants in Gauteng are almost entirely African (98.8 percent); 9 out of 10 of them are from rural areas, and roughly 45 percent are from rural Limpopo (Oosthuizen and Naidoo 2005). Circular labor migration in modern South Africa can be understood as a household strategy for managing risk and insecurity. The migration and sustainable livelihoods literatures both identify labor migration as one means of diversifying household income streams in order to safeguard against the loss of specific incomes (Bebbington 1999; Bryceson 2002a; Ellis 2000; 17
35 Lucas and Stark 1985; Massey and Espinosa 1997; de Sherbinin et al. 2008; Stark and Lucas 1988). From this perspective, households are defined by their sharing of resources and joint investment in the continuation and survival of the household. This perspective is not limited to sustainable livelihoods research. Perspectives on the determinants of labor migration understand individual migratory behavior as a response to the needs and limitations of migrants origin households. The labor migration of household members may provide households with a degree insurance and resilience against economic shocks, such as crop failures. Labor migration can also serve as a means for origin households to accumulate capital (Lucas and Stark 1985, 1985; Massey and Espinosa 1997; Stark and Lucas 1988). Finally, the concept of a household as a socially bounded group has been used to understand the structural links between rural and urban areas. These rural-urban links are often described as the dual system in which individuals span the urban areas where they work and earn incomes and the rural areas where families are maintained (Morawczynski 2008). Under this system, a social household may exist in multiple locations and need not reside in a single dwelling. Although the theoretical construction of a household allows for the dispersion of household members across physical dwellings and even great distances, the operational definition of a household used in most surveys and population censuses restricts households to those household members who are co-resident. This is often achieved by applying a residency requirement at enumeration. A socially defined household, where people are nominated as household members by proxy and are not necessarily required to be present in the household, is often termed the de jure population, while those household members who are or have recently been in the household at enumeration are considered the de facto population. Household 18
36 definitions and the periods over which residency is required vary across surveys, so the operational distinction of a de jure and de facto population differs across data sources. The phrases are best used heuristically to distinguish between the social household, de jure, and the physical household, de facto. Where surveys err toward defining a de facto population, they become out of sync with the socially defined household. This disjuncture makes the interpretation of households, household characteristics, and populations particularly difficult in locations with complex household structures and considerable circular labor migration, such as South Africa. A de facto population (i.e., co-resident households) overlooks labor migrants and fails to represent many families. Previous work has shown that families in Botswana are fluid such that they may adapt to challenges and hardships, and these families are not necessarily co-resident (Townsend 1997). In the context of HIV/AIDS, maintaining fluid households and living arrangements allows for the care of orphaned children (Young and Ansell 2003). Where families are often identified based on residence, work in South Africa has shown that the co-residence of fathers is not predictive of paternal financial support for children (Madhavan, Townsend, and Garey 2008). Thus, co-residence is not an absolute indicator of the allocation of resources within families. Using a co-resident, de facto interpretation of households, scholars have shown interhousehold transfers to be important mechanisms for providing insurance and support (Cox and Fafchamps 2008). Remittance flows from urban to rural areas are one form of transfer, and in certain contexts, transfers of food and rurally produced goods from rural to urban areas have also been observed (Frayne 2004, 2005). Through the transfer of goods and the fluid movement of labor migrants, we see strong ties between urban migrants and rural households both in South 19
37 Africa (Smith and Hebinck 2007) and elsewhere in southern Africa (Cliggett 2005; Gugler 2002; Potts 2000). The point here is that the operational and theoretical presentation of a household is ambiguous and difficult to reconcile across surveys and research. Clearly though, resources and remittances flow between co-resident groups of people. If circular labor migrants remit incomes from s destination household and leave children and spouses in a rural, origin household, one must question whether ties simply remain strong between the two households or whether a household spans different dwellings. While the former is the implied interpretation based on common survey designs that rely on residential requirements and capture de facto populations, the latter is more consistent with the theoretical understanding of the fluidity of households and labor migration in South Africa and other developing countries. Due to the de facto nature of national employment data in South Africa, the existing literature fails to represent the employment and unemployment problems facing the former homelands due to continued circular labor migration. Because a sizable portion of the working population of the former homelands is lost to other areas in the eyes of national data, this dissertation uses a de jure population to examine how those in the former homelands fare in finding employment two decades after the official end of apartheid. This dissertation is the first to address employment and unemployment in a former homeland that is inclusive of labor migrants. 20
38 CHAPTER 3. METHODS AND DATA The University of Witwatersrand established the Agincourt Health and Demographic Surveillance System (AHDSS) in 1992 to monitor the extension of health care services into the former homelands. The AHDSS located its surveillance system in the Eastern Lowveld in a portion of the former Gazankulu homeland. At the commencement of the AHDSS, the study site was located in the Bushbuckridge area of the Limpopo province 4. In addition to providing key information on health in a former homeland, the AHDSS has expanded its scope of data collection to assess other facets of socioeconomic well-being in the area. The data afford the rare opportunity to compare the employment characteristics of nonmigrants and labor migrants because the same employment data are collected for both groups. Comparable data is collected for labor migrants due to the de jure nature of the AHDSS census. The AHDSS uses a broad de jure definition of a household that is unique to data sources in South Africa 5. The AHDSS offers the following description of a household: A group of people who reside and eat together, plus the linked temporary migrants who would eat with them on return. This is a de jure household definition because it is more closely related to links of responsibility within the household, as opposed to a de facto household definition which more closely matches the co-residential household, as used in the national census. One implication of the Agincourt definition in data collection is that when a field 4 The majority of Bushbuckridge was zoned in the Limpopo province until 2008, when many administrative boundaries were redrawn and Bushbuckridge became part of the Mpumalanga province. 5 The Africa Centre Demographic Information System was established in 2000 and is similar to the AHDSS in that it records a de jure population and enumerates non-resident household members and labor migrants (Tanser et al. 2008). 21
39 worker encounters a permanent out-migrant this person becomes removed from the household resident list, whereas a temporary migrant is retained on the household list. (Agincourt HDSS 2013b). AGINCOURT STUDY SITE The study site originally comprised 19 villages. Since 1992, the AHDSS has conducted annual censuses of major vital demographic events, and its coverage has expanded over time to include 25 villages in the region. In 2008, the area covered roughly 400 square kilometers and included about 84,000 people (Kahn et al. 2007). Culturally, the study site is Shangaan and has a large population (approximately 30 percent) of Mozambicans. Under apartheid, the Shangaan population was heavily recruited by the mining industry, and agricultural betterment programs 6 were enacted in Bushbuckridge during the late 1950s, making labor migration the primary source of employment for the area (Niehaus, Mohlala, and Shokane 2001). Labor migration is high within the study site. Between 1999 and 2003, roughly percent of men and percent of women were labor migrants; the area has seen a rise in the labor migration of women, adolescents, and young adults since the AHDSS began the census (Collinson et al. 2007). 6 Agricultural betterment programs involved the relocation of households to small plots of residential land. This was justified as a way to provide sufficient land for agricultural production. In reality, the betterment programs created an effectively landless majority population (Smith 2003). 22
40 Figure 3.1. Map of the Agincourt HDSS Source: Agincourt HDSSS (2014) The perpetuation of labor migration into the post-apartheid period is potentially related to the study site s geography. The area is located in northeastern South Africa, within traveling distance of commercial farms, tourist destinations, mines, industries, and retail centers, so the study site may be advantaged relative to other homelands in its access to employment opportunities. Kruger National Park forms the western border of the AHDSS study site, and private game reserves are numerous throughout the region. The tourism sector has grown 23
41 considerably since the end of apartheid, and the Agincourt study site is situated in the heart of one of South Africa s major tourist destinations. The AHDSS is roughly two hours north of Nelspruit, a major city along the Maputo Development Corridor, South Africa s flagship regional development project. Finally, Johannesburg, the largest economic center in the country, is roughly six hours away. MIGRATION MEASURES The AHDSS employs a unique and valuable method for distinguishing the circular labor migration that was characteristic of the apartheid era from permanent relocations that are marked by a discrete, permanent resettlement. The censuses, conducted annually between August and October, record all key demographic events. Movements into and out of the study site or between households within the study site are recorded as migration events or permanent migrations. The AHDSS also collects annual residency status data that indicate whether individuals are engaged in circular labor migration. PERMANENT MIGRATION EVENTS Permanent migrations are identified by the household respondent, and a permanent migrant is someone who moves with a permanent intention of staying or leaving. The AHDSS characterizes a permanent migration as a discrete migration event, and this is akin to the typical measurement of migration in demographic surveys (Agincourt HDSS 2013b). The AHDSS data indicate that permanent movements are primarily village-to-village moves, which constitute 72 percent of all permanent migrations. Migrations between secondary urban and major metropolitan areas make up only about 12 percent of migrations, and movements between nearby towns account for another 11 percent. Permanent moves are more common among youth who leave their natal households to begin their own families, and as such, 24
42 the primary motivations for permanent moves are family-related. Immediately following apartheid and during the beginning of AHDSS data collection, annual net migration rates in Agincourt were largely negative through the early 2000s. These rates indicate that the study area lost population to out-migration, and these out-migrations were potentially motivated by the search for employment or to gain access to services (Collinson et al. 2007). Net migration rates rebalanced during the mid-2000s such that the population lost to migration out of the study site was balanced by migrations into the study site (Agincourt HDSS 2012). This suggests that resettlement out of Agincourt did occur following apartheid, but the initial wave of resettlement has largely tapered off. CIRCULAR LABOR MIGRATION Whereas permanent resettlement from the area has tapered off, the AHDSS data have revealed a continuation, and in some cases an escalation, of circular labor migration. The AHDSS measures circular labor migrations as an annual status, and the movements of circular labor migrants are not recorded as discrete events. Through this measurement, circular labor migration is best conceptualized as an activity or behavior. The AHDSS measures circular labor migration in two steps. Household respondents report on the number of months that household members spend within the households during the 12 months prior to enumeration. Whenever the household member spends six or more months away from the household, enumerators inquire into the reason for the household member s absence. When the members are away for the purposes of work or to look for work, the enumerators code the household members as labor migrants. No data are collected on the dates of movements for these individuals, and labor migrants are not required to be present in the household at enumeration. Rather, individuals appear in the 25
43 household based on the household respondents consideration of the individual as a household member. Thus, an individual who spends the majority of his or her time working elsewhere will be considered a labor migrant if the household respondent considers him or her to be a household member. Due to the lack of a residency requirement, households in the AHDSS data should be considered a broadly defined de jure or socially defined household. LABOUR FORCE STATUS MODULE In the late 1990s, the AHDSS expanded its focus from demographic surveillance to include data collection on socioeconomic characteristics. During this period, additional social surveys, or modules, were introduced to supplement the core census data in order to provide greater insight into the social and economic characteristics of individuals and households. In addition to the core census data, this dissertation uses much of the information collected in the Labour Force Status Module (LFSM). The LFSM was collected in 2000, 2004, and 2008 during the annual census. The module collected data on the economic activities and employment of all individuals aged 15 and older. Because temporary migrants are considered members of Agincourt households, comparable information was collected for labor migrants and non-labor migrants. Whenever members are not available to be surveyed directly, their information is collected through proxy. While reportingby-proxy entails some limitations, the AHDSS have comparable employment measures for labor migrants and non-migrants. Unlike most other surveys in South Africa, the AHDSS data allow for an examination of the employment of a rural population that is inclusive of labor migrants. LABOR FORCE STATUS For this dissertation, the LFSM was used to identify the labor force status of surveyed individuals. Throughout this dissertation, labor force status identifies individuals participation 26
44 in the labor force and their employment status, and it includes three categories: 1) economically inactive, or those who do not participate in the labor force, 2) those who are unemployed and would like to work, and 3) those who are working or employed. The survey includes the primary question, Are you currently working? The AHDSS defines work in such a way as to capture all types of economic activity at the time of enumeration, using the following definition: Work is an activity that brings resources into the household from outside the household. Subsistence farming and home domestic work are therefore excluded from the work category, because they do not bring resources into the household from outside. Work can therefore be seen roughly as work for pay, although this must include all forms of informal selling and home-based production. Selling is definitely a type of work (code 18). Informal work includes the popular activities of making or growing food or other objects of value, also buying and selling goods for profit. (Agincourt HDSS 2013a) The identification of those who are working or employed is straightforward given the nature of the LFSM; those who indicated that they are working are considered employed. Distinguishing those who are economically inactive from those who are unemployed is more difficult as neither group is engaged in work. Recent job search behavior is a common manner for distinguishing the two groups, where those who have recently looked for work are considered unemployed and those who have not are considered economically inactive. This strategy for identifying the unemployed and economically inactive segments of the population has been criticized by many (Burns, Godlonton, and Keswell 2010; Kingdon and Knight 2006) because it does not include among the unemployed those discouraged workers who give up on the job search. 27
45 Although the discouraged-worker question is important in the South African context, the AHDSS does not collect information on individuals job search behavior, and the data lack the necessary information to distinguish those who actively look for employment from those who would like to work but are passively awaiting opportunities to present themselves. Because job search information is unavailable, the criteria used to distinguish the economically inactive from the unemployed in this dissertation differ from those used by Statistics South Africa and by other researchers using national employment data. The fundamental difference in methodology will underlie any differences noted between the employment figures presented in this dissertation and employment figures reported from other sources. Rather than job search activity, the AHDSS field workers inquire why individuals do not work. Those reasons for not working are coded into discrete categories that are used to distinguish between the economically inactive and the unemployed. The full list of categories is listed in Appendix 1, Figure A1.2. This dissertation considers those who are not working because they are between occasional work, between contracts, or looking for work to be unemployed. Those who cite disability, domestic duties, school, home domestic work, subsistence farming, or other are considered to be economically inactive. In addition, not looking for work is a response option. Since this response neither implies a desire to work nor suggests an individual participates in activities outside the labor force, it is a difficult category to assign. It may be interpreted literally as meaning the individual did not actively seek a job or it can be interpreted loosely to infer that an individual is not interested in working outside the household. This dissertation has taken a conservative approach by classifying those who indicated that they are not looking for work to be economically inactive rather than unemployed. If these individuals are discouraged workers, as a literal 28
46 interpretation would suggest, they will be classified as economically inactive and lead to an underestimation of unemployment among the Agincourt population. The treatment of these individuals as economically inactive versus unemployed will be of more consequence to female rates than male rates. 7 This distinction is important for rates but does not alter the substantive conclusions of the dissertation. Employment rates are insensitive to the treatment of this category, and they are used in conjunction with unemployment rates. The labor force status measure can be used to identify the labor force. Those who are unemployed or employed participate in the labor force and constitute the Agincourt labor force, while those who are economically inactive do not. The labor force and labor force status measures are used primarily in Chapters 5 and 6. Chapter 4 focuses exclusively on the employment characteristics of those who are working, and Chapter 7 focuses on the labor migration status of women, irrespective of labor force status. FORMAL EMPLOYMENT CHARACTERISTICS For those who are employed, the AHDSS asks three questions about the nature of the employment: whether the employment is taxed and/or the firm pays a corporate tax, the period of employment ( permanent, seasonal, or temporary ), and the employment relationship ( selfemployed, employee, employer, family business, or cooperative ). I combine these 7 I have explored whether individuals who are not looking for work should be considered as discouraged, and thus unemployed, or as economically inactive. Due to the infrequency of this category among men, labor force rates among men are similar in magnitude regardless of whether those not looking for work are considered unemployed or economically inactive. Women, on the other hand, have begun using this category to describe their non-employment. In 2000, this category was relatively uncommon among women. By 2008, the category of not looking for work had become more prevalent among women, while those who did not work because of domestic responsibilities had fallen. I cannot determine whether the burden of domestic responsibilities has fallen since 2000 or normative changes surrounding female employment are changing such that their behavior is becoming defined in relationship to employment (i.e., not looking for work ) rather than domestic responsibilities. Given the escalation of the HIV epidemic and high levels of poverty in the area, one may doubt that domestic responsibilities have declined. 29
47 three measures to form a composite indicator of formal employment that is guided by the standard employment relationship (SER). The SER is characterized as employment situations that are permanent, that involve a direct relationship with an employer, that are dictated by an employment contract, and that entail labor protections (Webster and Von Holdt 2005). Given the growth of casual and outsourced employment in South Africa, a designation of formal/informal based on the SER is more appropriate than the alternative definition that is based solely on the regulation and oversight of the business because the SER better reflects actual working conditions. I use the three employment characteristics identified by the AHDSS to create a binary indicator of formal employment. Those who have formal employment are employees for businesses that are regulated, as determined through the taxation measure, and have an indefinite, permanent period of employment. Anyone who lacks any one of these three characteristics is designated as an informal worker. Informal workers may be self-employed, work sporadically as day laborers or on short-term contracts, or work for an untaxed and unregulated business. A description of the original AHDSS measures is presented in Appendix 1, Figure A1.3 EMPLOYMENT LOCATION The AHDSS collects information on the location of employment. This information is collected as a location category as well as a text description of the location. This location information was cleaned and condensed into categories of locations that are prominent among the Agincourt population. The location information is used exclusively in Chapter 4 to describe employment for the Agincourt population, and these data are described in more detail there. The original location category and a description of cleaning and recoding the text locations into the location measures used in this dissertation are presented in Appendix 1, Figure A
48 EMPLOYMENT SECTOR AND OCCUPATION The AHDSS collects information related to the occupation and economic sector of employed individuals. This employment information was condensed into sector and occupational codes and is used in Chapter 4 to present the type of work in which the Agincourt population engages. These data are described in more detail in Chapter 4. In Appendix 1, the original AHDSS sector and occupation codes are presented in Figure A1.5, and the consolidation of occupations from the original 32-category into a 17-category measure is listed in Figure A1.6. EDUCATION Educational attainment is measured for everyone in the AHDSS in 1992, 1997, 2002, and In addition, the educational attainment of new household members is collected whenever individuals join a household. As part of a data cleaning and reconciliation project 8, all records of educational attainment were recoded into approximate years of education. Values of educational attainment were linearly interpolated for the years between data points where no education measure was available. Years that followed the last observed educational attainment measure were given the value of the last observed educational attainment. Because educational opportunities expanded considerably after apartheid, educational attainment is higher among younger cohorts. I deal with the collinearity of education and age throughout the dissertation through the use of a binary indicator of high educational attainment and, where appropriate, its interaction with age. Individuals are considered to have high educational attainment when they have achieved more years of schooling than the median 8 The AHDSS and others embarked on an extensive effort to reconcile individual residential histories and discrepant individual information from 2009 to The details of this process are available upon request. 31
49 number of years of their same-sexed, five-year age group. The median educational attainment by age and sex appear in Appendix 1, Table A1.1. DATA LIMITATIONS LABOR MIGRATION This dissertation capitalizes on the fact that comparable employment information has been collected for migrants and non-migrants. As labor migrants are often away during enumeration, their data are collected by proxy, which may be less reliable and more prone to error. Employment information for labor migrants could potentially be less accurate than the employment information of non-migrants due to less frequent communication among household members. Specifically, the proxies in Agincourt may be less likely to know when labor migrants lose, quit, or change jobs. Moreover, the validity of the labor migration measures cannot be assumed. Labor migrants are conceptualized as those who are socially rooted to families and households in Agincourt. Labor migrants are determined by the household and its consideration, and we do not know whether such labor migrants would agree that they are part of the Agincourt household. A comparison of surveys collected during the 1990s showed that labor migration is lower when measured at the destination household than at the origin household (Posel and Casale 2003), suggesting that labor migrants may be more likely to consider themselves permanent migrants according to the AHDSS definitions. Labor migrants have been defined by the AHDSS as those who are away for 6 months or more during the previous 12 months, irrespective of singular migration spells or destination. Researchers have suggested that women often travel to more proximate locations for shorter 32
50 periods of time (Williams et al. 2008), and, as such, these authors argue that the AHDSS definition may underestimate the labor migration of women. THE LABOR FORCE STATUS MODULE The LFSM is a useful resource for developing a comprehensive picture of employment among a population in a former homeland. It is comprehensive in the sense that the information is collected through a census, includes labor migrants in addition to the full-time resident population, and captures all types of employment rather than focusing on specific sectors and industries. Although these data can be very useful and informative, the survey instrument limits the level of detail to which the dissertation can address employment. The LFSM does not include some information that is common to other labor force surveys. For example, it does not collect data on wages or incomes or the numbers of hours worked. As such, the data cannot be used to distinguish those who are underemployed or working at the margins. The LFSM does not ask information about the length of employment and does not capture previous employment information for the unemployed. This prevents the data from speaking to employment turnover or identify economic sectors where turnover is the highest. The occupational categories used in the LFSM do not match standard national or international classifications of employments and sectors. This makes distributional comparisons to other sources unfeasible. Moreover, the categories are relatively broad and present challenges to assessing the occupations of Agincourt workers. These problems are discussed more thoroughly in Chapter 4. Outside of the three characteristics used to define informal employment, no other information exists to assess the quality of employment. The data lack information related to the intensity of work, such as hours worked per week, and cannot speak to underemployment. 33
51 Moreover, employment is captured at a single point in time, between August and October. With considerable contractual, seasonal, and temporary employment in South Africa, employment may be elevated due to greater demand for seasonal workers, and employment figures presented here may not adequately represent employment during other seasons. GEOGRAPHY AND SCOPE This dissertation explores the labor migration and employment characteristics of a single area in a former homeland, the rural municipality of Bushbuckridge. The larger Bushbuckridge area contains more-urbanized small towns in addition to other rural communities that were formerly part of the Lebowa homeland. As such, the results cannot be generalized to all other homelands and possibly not even to the larger Bushbuckridge area. Figure 3.2 presents a collection of maps prepared by various sources (Accomodation Advisor 2013; CIESIN and CIAT 2005; StatsSA 2014a, 2014c; UNESCO n.d.); the approximate area of the AHDSS is circled in the maps. These maps give an overview of the homeland system under apartheid and how the areas differ on select characteristics. The map in the top left shows the range of areas covered by the former homelands. The top center map shows population densities in South Africa. The former homelands, despite their rural nature, were densely populated. The homelands in northeastern South Africa may enjoy a relative advantage in the post-apartheid era due to their proximity to Kruger National Park and other private game reserves that are concentrated nearby. The Agincourt study site actually borders Kruger National Park, and as I will show in Chapter 4, many in Agincourt are employed by the tourism sector in the surrounding game parks. In this sense, employment may be greater in Agincourt due to its proximity to tourist destinations. 34

52 Figure 3.2. Select maps of South Africa, highlighting the Agincourt HDSS study site Source: Maps have been graphically altered from original sources. Full citations appear in the References. The Former Homelands (UNESCO n.d.), Population Density (CIESIN and CIAT 2005), Game Parks and National Reserves (Accomodation Advisor 2013), Percent Unemployed (StatsSA 2014c), and Percent Agricultural Households (StatsSA 2014a) The figure in the bottom left depicts unemployment rates 9 by municipality, and Bushbuckridge is circled. The unemployment rate of Bushbuckridge is among the highest in the categories depicted, and in general, unemployment rates are higher in the municipalities located 9 The error in the legend of this map is due to an error in the original source (StatsSA 2014c). Those districts with the darkest shades have unemployment levels greater than 40 percent and those in the second category range from 35.7 to 39.9 percent, according to the tabular data available from the same source. 35
53 in the northeastern portions of the country. Based on the 2011 census, the unemployment rate of Bushbuckridge was 52 percent. The figure in the bottom right shows the percentage of agricultural households. These are households that participate in some form of agricultural activity, which does not necessarily imply subsistence agriculture. Around 40 percent of households in Bushbuckridge participate in some form of agricultural activity. Participation in agriculture appears to be lower in Bushbuckridge than areas of other homelands, particular those to the south in the Eastern Cape and KwaZulu-Natal. 36
54 CHAPTER 4. AGINCOURT AT WORK: THE PROFESSIONS AND ECONOMIC SECTORS OF WORKERS IN 2008 The existing literature of employment within the former homelands of South Africa is limited. First, no studies effectively determine how much of the labor force finds employment through labor migration. While few would argue that labor migration is no longer important in contemporary South Africa, the extent to which populations of the former homelands find employment as labor migrants remains a mystery. Second, our understanding of non-migrant work is limited to case studies of particular enterprises or specific industries. We currently lack a comprehensive overview of the type of work being done in the former homelands. This chapter capitalizes on the de jure nature of the AHDSS data to address the nature of both migrant and non-migrant employment in Agincourt. This chapter answers the question, Where do they go and what do they do? INTRODUCTION The lack of employment opportunities within the former homelands is likely to be a key contributor to persistent poverty in these areas. However, little research has documented the type of work that occurs within these areas. Some studies have suggested that the majority of employment in rural areas is informal, self-employment, or employment within the public sector (Fryer and Vencatachellum 2005; Hajdu 2005). That the majority of economic activities in the former homelands appear to be informal is supported by a host of research on particular industries and economic activities. The use of natural resources in economic activities has been well documented in rural areas. Businesses 37
55 have been established around the trade of plants and fruits for consumption and medicine (Botha, Witkowski, and Shackleton 2004; Dovie, Shackleton, and Witkowski 2007; Shackleton et al. 2000), and in other cases, natural resources are processed for commodities that are typically sold within local communities (Paumgarten and Shackleton 2009; Shackleton and Campbell 2007; Shackleton and Shackleton 2004; Shackleton and Steenkamp 2004; Shackleton 1993; Shackleton et al. 2002). In addition, a fair amount of literature has lauded the potential of tourism to create employment in rural areas and spur economic development. The ability of tourism to increase employment will depend on location and the proximity of rural communities to cultural and natural attractions. Small businesses have grown in areas where tourists are brought into direct contact with rural communities (Hill, Nel, and Trotter 2006). Jobs have also been created in construction by the expansion of the tourist infrastructure, but these jobs are generally temporary, and the number of more lucrative, permanent employment positions within the national parks and game reserves is modest (Ashley and Roe 2002). Tourism may indirectly provide opportunities to engage in local production and the selling of goods for tourists, but few of these informal enterprises grow into established, profitable businesses. This type of work within tourism is often described as survivalist with considerable churning (Rivett-Carnac 2008). A few studies have tried to quantify the impact of the tourist industry on employment within rural communities. A survey of four communities in the Western Cape has shown that the percent of business that owes their existence to tourism ranged between a high of 33 percent in one community to a low of 3 percent in another, with the two middle communities reporting 25 and 24 percent (Saayman and Saayman 2010). In a random sample of households along the 38
56 western border of Kruger National Park, 20 percent had a member who had benefited from the park (Anthony 2007). While the tourism sector does not provide employment to all, it does present opportunities to some. The first section of this chapter addresses the economic sectors and areas where the Agincourt population works. Although simple in its presentation, this chapter shows that our understanding of the labor migrant system is too often overshadowed by the original features of South Africa s labor migrant system. Specifically, male labor migrants were first recruited for work in mines and, to lesser extents, for work on plantations and in factories. Employment opportunities within the mining, agriculture, and manufacturing sectors have declined in recent decades. This chapter addresses whether labor migrants continue to be employed primarily by these industries. The second section of this chapter identifies the primary professions of those working within Agincourt. Many studies have suggested that employment within rural areas is makeshift, informal work (Hajdu 2005), and while research examining specific industries, such as broom making (Shackleton and Campbell 2007) or trade in traditional medicine (Botha et al. 2004), help contextualize the various informal activities of the former homelands, no studies provide a comprehensive account of the work done in the former homelands. This chapter uses the AHDSS data to provide such an overview of employment within the area in CHAPTER METHODS This chapter uses information on labor migrant status and data collected in 2008 by the Labour Force Status Module (LFSM). The chapter is descriptive and presents the distribution of employment sectors and occupations and work locations for employed men and women aged in Agincourt in
57 FORMALITY OF EMPLOYMENT This chapter also presents comparisons of the percentage of workers in formal work situations. This measure has been described more thoroughly in Chapter 3. Formal employment has been defined in this dissertation as work done for indefinite periods of time as an employee for an employer that is regulated (i.e., taxed). Formal work does not include any small business owners, self-employed individuals, or those who are engaged in work as something other than an employee. The creation of this measure was informed by consideration of the standard employment relationship (Webster and Von Holdt 2005). WORK LOCATION The labor migrant status measure is a crude indicator of the location of employment; those who work as labor migrants are likely to work well away from Agincourt. In addition, LFSM data contain two pieces of information for employed individuals that provide a direct assessment of the geographic reach of the Agincourt labor force. The first variable collected is a nine-item location category. In addition to the location category, the enumerators recorded the location name as a text field. These text fields have been cleaned for misspellings and typographical errors. I have used the combination of location category and cleaned location text to create a locally relevant list of work locations. By considering both location measures, inaccuracies in the reporting of locations should be reduced while allowing for the identification of key employment areas for the Agincourt population. The nine-item location categories and a description of the recoding of locations are documented in Appendix 1, Figure A1.4. Many tables presented in this chapter use a three-category location that combines location and migrant status. The first category represents those individuals who work locally. These are non-migrants who work within the boundaries of the Agincourt study site and are termed local 40
58 workers. In addition to local workers, non-migrants may find employment outside the study site but close enough to maintain full-time residence in Agincourt. These individuals, termed commuters, are defined as individuals who do not meet the AHDSS definition of labor migrant but who work outside the boundaries of the study site. The final category consists of labor migrants, or those spending six or more months away from Agincourt for the purposes of work. EMPLOYMENT SECTOR AND OCCUPATION The AHDSS collects employment sector and occupation data in two variables. The enumerators inquire about the type of work being done by employed individuals, and based on these responses, they select an employment sector from an 11-item list and a work category from a 31-item list. Based on these two sources of information, data were cleaned and consolidated into a 9-category employment sector and a 17-category occupational classification. The recoded employment sector is inclusive of all work done by the Agincourt population, while the recoded occupation measure reflects only the type of work that is feasibly performed within the AHDSS. For example, professions in mining and the game parks appear as Other because these jobs are not performed within Agincourt. The original 11-category sector and 31-category work variables and the description for consolidating employment sector are presented in Appendix 1, Figure A1.5. The consolidation of sector and work category into occupational categories is presented in Appendix 1, Figure A1.6. GEOGRAPHY OF THE EMPLOYED AGINCOURT LABOR FORCE The Agincourt population, much like the populations of many former homelands, works in various locales outside their home communities. De facto populations miss the full scale of labor migration and its contribution to the employment of the labor force of the former homelands, making unemployment in the former homelands the more salient feature. Table
59 shows the percentages of employed men and women in Agincourt who work locally, as commuters, and as labor migrants. Table 4.1. Row percentages of employed individuals who are local workers, commuters, and labor migrants, by age category Non-Migrant Agincourt Commuter Migrant N Employed Male , , , , , Total ,000 Female , , , , Total ,654 The majority of employed men work as labor migrants, with roughly 74 percent of all employed men spending six or more months away from their home in the study site. Labor migration among men is prevalent regardless of age. The youngest category of employed men, year-olds, do participate in labor migration at notable rates (44 percent), but this group has considerably lower employment: only 157 are employed. Labor migration accounts for 68 percent of employment among the year-old age group. For all older age groups, the percentage of the employed male population who are labor migrants is above 70 percent, with a 42
60 peak of 79 percent among the year-olds. Roughly three out of every four employed men in Agincourt are labor migrants. Labor migration accounts for less employment among women, of whom 54 percent work as non-migrants. Although labor migration does not account for the majority of employment among women, 45 percent of employed women are labor migrants. The apartheid trend of a male-dominated labor migration system has persisted into the post-apartheid era, but by 2008, labor migration has become a path to earning an income for almost half of women. In fact, the majority of women aged are labor migrants. As with men, the youngest age group of employed women sees the lowest percentage of labor migrants. Where men exhibit an age pattern suggestive of a lifelong career of labor migration 10, this may or may not be the case for women. Labor migration rates decline across older age groups of women. This may indicate a life-course trajectory of greater labor migration among younger women who eventually find employment or work informally closer to home as they age and acquire more domestic responsibilities. However, this trend is also consistent with cohort differences that may be expected due to better education among younger cohorts of women. These younger female cohorts may aspire to develop careers and modern lifestyles (Sennott Winchester 2013) as a consequence of or in relation to declining marriage rates (Hosegood, McGrath, and Moultrie 2009), increases in education (Lam 1999), or falling fertility (Garenne et al. 2007). Table 4.1 also reveals the importance of commuter employment. Overall, 14 percent of employed men and 20 percent of employed women are commuters, or individuals who work 10 The age pattern of labor migration among all men and among only employed men is remarkably stable between 2000 and Due to the history of male labor migration, the trend here would seem to reflect age or life-course differences rather than period of cohort differences. For males, the age curve of labor migration matches that of labor force participation. 43
61 outside the Agincourt study site but did not spend a total of six or more months away from Agincourt during the previous year. The term commuter is used as a heuristic for discussing those who are not employed within Agincourt but who fail to meet the AHDSS definition of labor migrant. Multiple types of workers may be commuters. Commuters may be individuals who spend the bulk of their non-work time in Agincourt but travel daily to the surrounding areas for work. Chain restaurants and retail stores moved into some of the smaller towns in the years following apartheid. Moreover, several game parks and tourist hotspots are within a daily commutable distance. In addition to daily commuters, this category may also include individuals who produce and manufacture goods in Agincourt but travel periodically for short periods to sells goods in larger markets, such as Gauteng. These individuals will fail to meet the six-month definition of a labor migrant, but their work straddles Agincourt and other economic centers. Many short-term, seasonal labor migrants may be reflected in the commuter category if these individuals were working during the time of the survey. Finally, some of these commuters may be miscoded due to different temporal references of the labor migration status and employment status variables 11. Table 4.2 shows the percentage of the commuter and labor migrant population that works in the various locations surrounding the study site and elsewhere in the nearby provinces. In addition, the average numbers of months spent outside the household are included as a reference. 11 There is a degree of error associated with combining an annual labor migration status and a current employment status. Those who have recently begun labor migration may have an annual non-migrant status although they work far away. Likewise, recently returned labor migrants may be designated as labor migrants although they work within Agincourt or the surrounding area. The former scenario will lead to individuals being erroneously coded as commuters, while the latter scenario will lead to misclassifying non-migrants as labor migrants. Table 4.2 indicates that small percentages of labor migrants work within Agincourt or the local Bushbuckridge area. These individuals are likely returned labor migrants. Those working farther away as commuters, such as in Gauteng, will include new labor migrants in addition to those who travel for work for shorter periods. 44
62 Unfortunately, the distribution of these months throughout the year cannot be determined from the data. Table 4.2. Percent and average months spent outside of the household of employed individuals, by location of employment Male Female Commuter Labor Migrant Commuter Labor Migrant (N=1,549) (N=8,111) (N=1,286) (N=3,033) % Mths % Mths % Mths % Mths Total DSS Surrounding Areas Bushbuckridge Mkhuhlu Thulamahashe Other Bushbuckridge Kiepersol White River Hazyview Game Reserves Limpopo Hoedspruit Lisbon Phalaborwa Other Limpop Mpumalanga Nelspruit Middleburg Rustenburg Secunda Witbank Other Mpumalanga Gauteng Other / Unknown Average months spent outside of the household is omitted for small cells (N<10). 45
63 Around one-quarter of employed commuters work in the game reserves or game parks 12, and approximately another quarter works in the towns near the study site. Thus, nearly half of all commuters work in areas within daily traveling distance. Around a tenth of female commuters and an eighth of male commuters work in Gauteng. These commuters cannot feasibly travel between work and home every day. Those working in Gauteng or some of the more distant locations in Limpopo and Mpumalanga are likely to be new labor migrants or individuals engaged in labor migration for less than six months per year. Table 4.2 also reveals that 43 percent of male migrants and 32 percent of female migrants work in Gauteng, the province that includes the capital of Pretoria and city of Johannesburg. Although Gauteng is the primary destination of labor migrants from Agincourt, around 31 percent of men migrate to farther locals within Mpumalanga and 9 percent migrate to the game reserves, which are scattered throughout Limpopo and Mpumalanga. Around a quarter of women migrate to the more distant locations of Mpumalanga, while almost one-fifth are labor migrants to game reserves. Thus, the labor migrant streams from Agincourt are directed toward multiple locations; no single migration stream characterizes labor migration from Agincourt. Table 4.3 shows the number and percentage of Agincourt workers by economic sector. Commuter employment is dispersed among several economic sectors. Relatively few commuters are engaged in mining or manufacturing because industries within these sectors are not present in the study site or the vicinity. Otherwise, no sector appears to dominate commuter employment. The mining sector has been historically associated with migrant labor, but those working in the mining industry account for only 12 percent of the total number of employed labor migrants. 12 This category will also capture game reserves located in more distant provinces, such as KwaZulu-Natal and the Western and Eastern Cape. However, there are few labor migrants to these areas. 46
64 Another 10 percent of employed labor migrants work in manufacturing, and 6 percent work in agriculture. Table 4.3. Sectoral distribution of employed, by labor migrant status Local Workers Commuters Labor Migrant Total N % N % N % N % Male Tourism Mining , , Construction , Agriculture Manufacturing Government Retail Service , , Other Unknown Total 1, , , , Female Tourism Mining Construction Agriculture Manufacturing Government , Retail , Service , , Other Unknown Total 2, , , , The origin of the labor migration system in South Africa is rooted in the demand for male labor to work in the mines, and researchers commonly associate the labor migration system in South Africa with the mining industry. For the AHDSS area, though, labor migration is no longer sustained by the mining sector. Despite the preponderance of mine workers in labor migration during the colonial and early apartheid period, only 12 percent of Agincourt s male labor migrants worked in the mines by
65 Although the mines may account for the majority of labor migration from other former homelands, it is unlikely. First, the Shangaan were heavily recruited for mine working during the colonial expansion of the mining industry, and they were the majority employed within the mines (Niehaus et al. 2001). Thus, the study site of the AHDSS potentially has the most entrenched history of labor migration to the mines. Second, profitability within the mining industry declined during the second half of the 20 th century, and as a result, employment within the mines has consistently fallen during both the apartheid and post-apartheid periods (Terreblanche 2002). Apartheid policies forced the resettlement of many rural Africans from white-owned farms and plantations, rendering labor migration necessary for dislocated Africans to work in commercial agriculture. As such, agricultural workers in the former homelands were often migrant workers. Six percent of migrant men and 12 percent of migrant women work in agriculture. Due to close proximity of commercial farms and seasonal fluctuations in the demand for agricultural labor, many workers do not meet the six-month definition of a labor migrant, and much of the work is done as a commuter or short-term migrant. Eight percent of men and 20 percent of women employed outside of Agincourt work in agriculture. I should note that employment data indicate that few people work in the agriculture sector within Agincourt. Those involved in subsistence agriculture are not considered employed by the survey; rather, subsistence farmers are considered economically inactive. As will be seen in Chapter 5, subsistence farming was rarely listed as a reason for not working. Thus, overall, it appears that neither subsistence agriculture, to the exclusion of labor force participation, nor commercial farming account for the majority of economic activities of the Agincourt population. 48
66 The formal manufacturing sector of South Africa transitioned quickly to capital-intensive forms of productions, and factories have never been the primary destination of labor migrants. This remained true through Within the AHDSS, 10 percent of labor migrants work in manufacturing, and only three percent of migrant women work in manufacturing. The majority of workers in manufacturing are labor migrants: 92 percent of men and 81 percent of women working in manufacturing are labor migrants. Employment within manufacturing is largely located in Gauteng. The tourism industry has grown considerably since the fall of apartheid and has been presented as a solution to rural poverty and underdevelopment (Hill et al. 2006). Growth in the tourism sector has translated into greater employment for Agincourt. Eight percent of male and 14 percent of female labor migrants list tourism as their employment sector. Among those who are not labor migrants but work outside the AHDSS, 17 percent of both men and women work in tourism. Finally, the service industry has expanded considerably during the post-apartheid era (Tregenna 2008). This trend is reflected within the employment patterns of the Agincourt population. The majority of men and women who work outside Agincourt work in the services sector. EMPLOYMENT IN AGINCOURT This section addresses the employment of those individuals who work within the boundaries of the Agincourt study site. Around 12 percent of employed men and 34 percent of employed women work within Agincourt. As the following tables and discussion are based on the subset of workers who work within the study site, sample sizes are quite small. In 2008, only 49
67 1,340 men and 2,335 women worked within study site. When these subtotals are further subset by profession and employment characteristics, sample sizes are quite low. GOVERNMENT EMPLOYMENT Although comprehensive accounts of the work done within the former homelands are not available, some studies have suggested that much of the work done within the former homelands is either informal or within the public sector. Table 4.4 shows the percentage of men and women employed in different professions, disaggregated by public and private sector. About a quarter of all jobs within Agincourt are within government or public services. Nearly a quarter of the employed men and women within Agincourt owe their employment to the expansion of government and services into the area. Public sector employment within Agincourt is dominated by schools: 48 percent of male and 57 percent of female government employees are teachers. Apart from teachers, the government employs managerial and administrative staff as well as other support services, with cleaning, food services, and security each accounting for 5 percent or more of government jobs. Notably, some of these support service positions are likely due to jobs created within schools. There are few public health care facilities within the boundaries of the AHDSS, and public employment in health care accounts for only 3 to 5 percent of jobs among government employees. Thus, the public sector accounts for about a quarter of employment within Agincourt, and about half of that is in the teaching profession. Figure 4.1 shows the study site and the location of schools and health care facilities within the area. 50

68 Table 4.4. Distribution of professions among employed non-migrant workers in Agincourt Male Female Description of Work Total Private Public Total Private Public 1. Cleaning / Domestic Work Construction Selling Craft / Artisan Fieldworker Agricultural Services Teacher Office Work / Management Formal / Informal Health Food service Security Work Sewing, hairdressing, baking, brewing Small Business - Non-retail Driver Other Undefined Worker Unknown Number of Workers: 1,340 1, ,335 1, Figure 4.1. Public service facilities in the Agincourt HDSS study site Source: Agincourt HDSS (2014) 51
69 PRIVATE EMPLOYMENT The public sector accounts for only a quarter of employment within Agincourt, leaving three-quarters of employment is within private sector. This private sector work includes both formally regulated businesses and small-scale economic activities conducted by individuals or households. For those working in the private sector, there is no clear majority profession for men or women, though there are prominent types of professions. For men, construction accounts for a little less than a third of all private sector employment. In terms of overall employment within Agincourt, 22 percent of men are involved in construction, making it the most prevalent profession among men working locally. Selling and retail account for another 13 percent. Retail is the predominant profession among women: 45 percent of women employed privately are involved in the selling of goods. Overall, 34 percent of employed women are involved in selling in Agincourt, and another 21 percent of privately employed women provide cleaning services and domestic work. Thus, among non-government employees, over two-thirds of women are involved in either selling or cleaning. Those engaged in private employment are diverse, and their work spans all levels of formality. Unfortunately, the AHDSS data lack key indicators of the quality of these jobs. Specifically, the AHDSS data do not include information on incomes, employment benefits, job tenure, or working hours. The AHDSS does collect some employment characteristics that speak to the level of job security and the nature of the employment. For those who are employed, the AHDSS determines whether the employment is taxed; whether the employment is contract, temporary, or permanent; and whether someone is an employee, involved in a family business, or self-employed. I have measured informal employment broadly to reflect the atypical characteristics of the South African labor force. 52
70 Individuals working formally are more likely to have job security and earn more for their work than those working informally (Heintz and Posel 2008). Table 4.5 presents the percentage of private sector employees working formally in each profession. To provide a comparison, the same figures are presented for those who are employed privately outside of the AHDSS. The last column presents the odds ratio of formal employment outside of the AHDSS relative to formal employment within the AHDSS. As would be expected given post-apartheid economic changes, the impediments to education for Black Africans, and poor economic development in the former homelands, much of the work within Agincourt is informal in nature. However, employment within the study site is more likely to be informal than comparable professions outside the study site. Construction is the most prevalent profession among employed men working within the study site, and male employment within construction is entirely informal. Men involved in construction are not taxed, operate independent of an employer, and/or work on a temporary or contractual basis. Construction workers outside the study site are also likely to be employed informally, with only 20 percent having the job security afforded by formal jobs. 53
71 Table 4.5. The percent working informally and the average months spent outside of the household among employed men and women, by work location and profession % in Informal Avg. Mths Away % in Informal Avg. Mths Away N N Male 1. Cleaning / Domestic Work Construction Selling Craft / Artisan Fieldworker Agricultural Services Teacher Office Work / Management Formal / Informal Health Food service Security Work Sewing, hairdressing, baking, brewing Small Business - Nonretail Driver Other Female 1. Cleaning / Domestic Work Construction Selling Craft / Artisan Fieldworker Agricultural Services Teacher Office Work / Management Formal / Informal Health Food service Security Work Sewing, hairdressing, baking, brewing Small Business - Nonretail Driver Other Other category includes those who have undescriptive job titles, engage in employment found only outside of the Agincourt HDSS, or are unknown. Within AHDSS Outside of AHDSS Odds Ratio of informal outside AHDSS / inside AHDSS 1 Informal employment defined according to the standard employment relationship as those working who are employees, have taxed employment, and work on a permanent basis. 54
72 Retail is another prominent profession among employed men in the study site. Men involved in retail outside the study site are over 27 times more likely to have formal employment than those within the study site. The other category includes men in a variety of professions and is not entirely comparable, as those men working in tourism, manufacturing, or mining are classified as other since there is not a comparable profession within the study site. Overall, only about 6 percent of employed men work in formal job relationships when they work within the AHDSS, and with roughly 63 percent of men employed outside Agincourt working formally, the likelihood of formal employment among employed men is about 28 times greater outside Agincourt than within the study site, irrespective of occupation. The figures for women are similar to those of men. Only 1 percent of women working in retail in Agincourt are working formally. Those women who participate in selling or retail outside the study site are more than 16 times more likely to have formal employment, even though only 14 percent of women working in retail outside the study site have formal jobs. Jobs in selling and retail, the primary type of work among women, are overwhelmingly informal in nature. The second-most-prevalent employment category among women, cleaning and domestic work, has a higher rate of formality. Almost a quarter of women who work in cleaning have formal employment. Those outside the study site are about five times more likely to have formal jobs. Overall, women who are employed outside of Agincourt are about 16 times more likely to be employed formally; in Agincourt, only about 6 percent of women have formal employment, whereas outside of Agincourt, 49 percent have formal employment. Employment in Agincourt appears to be dominated by informal work. While I cannot conclude that individuals find better jobs outside the AHDSS due to the different selection mechanisms associated with labor migration and being employed, those who are employed 55
73 outside the AHDSS likely have more secure and better paying jobs than those who work within the AHDSS. DISCUSSION This chapter has shown that the employed population is heavily involved in labor migration. Simply put, 74 percent of working men and 46 percent of working women are labor migrants. That labor migration constitutes a major portion of the employed labor force is not surprising given the history of labor migration in South Africa. However, the fact that most of these labor migrants are involved in the services sector shows that the labor migrant system has adapted to post-apartheid economic changes. No single migration stream can adequately characterize the labor migration from Agincourt. Rather, laborers travel to multiple destinations and are employed in multiple economic sectors. Where employed individuals aren t engaged in labor migration, they work as commuters in nearby areas or within the study site. Only 12 percent of men and 34 percent of women work within the study site. Public services account for roughly a quarter of employment within the study site, and these jobs are largely located within schools. The other three-quarters of the population working within the study site work within the private sector, and most of these jobs are informal. Men often work in construction and, to a lesser extent, retail, whereas women are heavily engaged in informal retail and domestic work and cleaning. Because the majority of laborers work outside of Agincourt, the number of them working within different specific occupations is small. Those who work outside of Agincourt are more likely to be employed formally: Men are roughly 28 times more likely and women 16 times more likely to have formal employment outside the study site. Whereas I cannot assess many aspects of the quality of employment, such as wages and hours worked, the evidence presented suggests 56
74 that the work done within the study site is likely to be less secure and provide lower incomes than employment outside the study site. Based on the comparison of workers inside and outside the study site, we may reasonably expect the employment found outside Agincourt to be better paid and more ideal than the employment within the site. Because the AHDSS relies on a broad, de jure definition of the Agincourt population, it is able to capture the economic activity of those who travel to various locations throughout neighboring provinces. Some of these labor migrants may be enumerated in Agincourt during a national census or labor survey, but many of them will not be counted as members of the Agincourt labor force. For this reason, national data sources fail to fully capture the economic activities of individuals from the former homelands. 57
75 CHAPTER 5. RESIDENCY AND DIFFERENCES IN THE LABOR MARKET RATES OF AGINCOURT Chapter 4 presented the distribution of the employed Agincourt labor force in 2008 and showed that the majority of those employed in Agincourt are labor migrants. This chapter constructs standard measures of the labor market using both a de jure population (i.e., everyone) and de facto population (i.e., excluding migrants) to demonstrate that the labor force rates in the area are sensitive to the treatment of labor migrants. THE NATURE OF RESIDENCY REQUIREMENTS The preceding chapters stressed that circular labor migration is a ubiquitous feature of the labor force in the former homelands. Despite labor migrants social and financial ties to rural areas, they are enumerated where they reside when the survey is conducted. The central source of employment data in South Africa is the Quarterly Labor Force Survey (QLFS) 13. For a place to qualify as a respondent s residence in the QLFS, the respondent must have stayed there on average four nights per week during the four weeks preceding the survey (StatsSA 2011). This means that the employment of labor migrants and their contributions to origin households are measured through different mechanisms, if at all, than for the resident, non-migrant members of the household. For many purposes, the residency requirement is reasonable and necessary. Capturing population information through households identification of their members, as is done in the AHDSS, creates the potential for individuals to be over-counted and overrepresented. 13 In 2008, Statistics South Africa began the Quarterly Labour Force Survey to replace the biannual Force Survey (LFS) collected in March and September. 58
76 For proper demographic accounting, over-counting should be avoided. Although the residency requirement is necessary for demographic and statistical purposes, it obscures other social processes. If we interpret a household as a social unit that shares resources and engages in its own reproduction, local labor market rates will fail to reflect the economic reality of households. As an example, the prevalence of female-headed households is a statistic made readily available by many statistical agencies in developing countries. A study based on demographic surveillance data collected by the Africa Centre 14 in KwaZulu-Natal has shown that the prevalence of femaleheaded households is overestimated by national statistics due to their exclusion of labor migrants, i.e., the many male household heads who are away working (Hosegood and Timaeus 2011). The AHDSS reveals a similar difference in the prevalence of female-headed households and average household size. Figures calculated by Statistics South Africa (2014b) indicate that, in 2011, the prevalence of female-headed households in Bushbuckridge was 53 percent, with the average household consisting of four members. Comparable figures for the Agincourt study site in 2009 show a lower prevalence of female-headed households and larger household sizes. Women head 41 percent of households in Agincourt, and the average household includes 5.6 members. The difference between the official figures posted for Bushbuckridge by Statistics South Africa and the estimates for Agincourt may be due to the two-year difference in data collection or the fact that Agincourt is entirely rural while Bushbuckridge includes secondary towns and 14 The Africa Centre Demographic Information System was established in 2000 and shares the AHDSS feature of capturing information on non-resident household members and labor migrants (Tanser et al. 2008). 59
77 more developed areas. If we exclude all labor migrants as defined by the Agincourt HDSS and assume the oldest non-labor migrant to be the household head, the prevalence of female-headed households increases to 65 percent and the average household size falls to 4.6. Thus, residency requirements and the defining of household members have implications for household demographic characteristics. The nature of residency requirements often puts available data sources at odds with many theoretical perspectives that cast rural households, or more specifically migrant-origin households, as social nodes that tie labor migrants and non-migrants to the same decisionmaking processes. The sustainable livelihoods framework (Bebbington 1999; Bryceson 2002b; Ellis 2000; de Sherbinin et al. 2008) and various segments of the labor migration literature (Lucas and Stark 1985, 1985; Massey and Espinosa 1997; Stark and Lucas 1988) understand labor migration and mobility as a strategy for managing resource insecurity and acquiring capital. Including residential requirements in survey data necessarily undermines our ability to conceptualize households as groups of individuals whose activities and incomes are bounded to the same livelihood. This limitation also applies to our understanding of employment in the former homelands. Apartheid separated the working and non-working members of households in the former homelands through the labor migrant system. As labor migration continues, our understanding of employment in the former homelands is biased because the national survey data often used to understand the employment crisis in South Africa exclude labor migrants from the former homelands through the use of residency requirements. This chapter presents key employment rates for Agincourt in order to establish a basis for the remainder of the dissertation 60
78 and to highlight, indirectly, how the data and analyses presented in the dissertation will differ from the extant literature of employment in South Africa. CHAPTER METHODS This chapter presents labor migration rates and the following three key labor force rates: the labor force participation rate, the unemployment rate, and the employment rate, also known as the labor absorption rate or employment-to-population rate. These rates are calculated following the formulas listed in Equations 5.1 through 5.4. Equation 5.1. = Equation 5 2. = Equation 5.3. = Equation 5.4. = These rates are disaggregated by age and sex and presented for the total population and a subset of the population that excludes labor migrants in order to demonstrate the substantive differences in labor force rates resulting from how the population is defined. These rates are calculated separately for five-year age groups and by sex. Graphs of these rates are included with the text of the chapter, while rates presented in tabular form are located in Appendix 2. This chapter addresses the labor force rates of 2008 only (Table A2.4), but Appendix 2 also includes rates calculated for 2000 (Table A2.2) and 2004 (Table A2.3). While this chapter does not focus on educational attainment and labor force rates, these figures may be of use to other researchers. As such, I have included labor force rates broken down by high educational attainment in Appendix 2, Tables A2.5, A2.6, and A

79 AHDSS LABOR MIGRATION RATES Figure 5.1 shows labor migration rates in Agincourt in During their mid- to late- 20s, over half of all men are labor migrants and roughly one-third of women are labor migrants. These rates decline slowly over older age groups, but labor migration among the older groups is comparable to labor migration among younger adults. Just over half of men aged are labor migrants, and a little less than one-fifth of women aged are labor migrants. Figure 5.1. Labor migration rates in 2008 The age pattern of labor migration in Agincourt is at odds with the typical association between age and labor migration. The migration literature often finds the greatest labor migration among young adults. The pervasiveness of this trend has led to the development of uniform migration schedules that are used to determine age-specific migration rates (Rogers, Raquillet, and Castro 1978). Research aimed at understanding labor migration and the motivations behind labor migration have suggested a primary factor in the labor migration of Mexicans to the United States is to acquire capital for specific projects in the origin communities in Mexico (Massey and 62
80 Espinosa 1997). Due to the development milestones that occur during young adulthood (e.g., completing education, finding employment, and establishing families), greater movement among youth is reasonable. Interestingly, however, labor migration in Agincourt does not fit this profile. In Agincourt, it appears that men and women enter into labor migration in young adulthood and engage in labor migration throughout most of their prime working ages. Figure 5.2 shows the percentage of Black Africans in 2007 who changed households within the previous year. The data are based on the 2007 Community Survey, so only individuals residing in a location for four nights per week during the previous month are enumerated (StatsSA 2008a). These data indicate that youth are heavily involved in migration when measured through a residential requirement. In fact, the age profile of permanent migrations within Agincourt is similar (Collinson et al. 2007). In addition to the population of recent in-migrations, Figure 5.2 shows the national employment rate. Employment among the population increases through adulthood as individuals gain experience and training. Comparing the age profile of labor migration in Agincourt in Figure 5.1 to the employment and mobility rate in Figure 5.2, the age distribution of labor migration in Agincourt appears more similar to the age profile of employment rather than the age profile of migration. 63
 1")

81 Figure 5.2. The number of recent in-migrants 1 and employed Black Africans per 1000, by age and gender Source: Author s calculations of 2007 Community Survey (StatsSA 2008a) 1 In-migrants, or movers, are defined as those who changed residence between 2006 and enumeration. Figures include only individuals born in South Africa. AHDSS LABOR FORCE RATES LABOR FORCE PARTICIPATION Labor force participation rates indicate the proportion of the population that actively participates in the labor force, either working or seeking employment. National figures for the Black population indicate that 62 percent of men and 49 percent of women had employment or 64
82 were seeking employment in 2008 (StatsSA 2010). Figures from Agincourt are comparable, but labor force participation appears to be higher in Agincourt: men and women aged years old have labor force participation rates of 68 and 55 percent, respectively. The higher rates in Agincourt are potentially an artifact of differences in the survey instruments. Unlike the national rate, which was calculated using the QLFS, the rate I have created for the AHDSS does not require an active job search to determine labor force participation of those without a job. Figure 5.3 presents the labor force participation rate among the Agincourt population by age and sex group. If labor migrants are excluded, labor force participation in the AHDSS is reduced by about 8 percent for men 25 and older and about 7 percent for women 25 and older. By definition, labor migrants are economically active, and omitting them from the population must lower labor force participation rates. Labor force participation estimates for migrantsending areas based on survey data with stringent residential requirements will fail to measure the population s the labor force due to the temporary absence of those working and seeking work in other areas. Labor force participation in the area is quite high for those aged 25 to 54. Labor force participation peaks among men during their late 20s, with 95 percent of men either working or looking for work. Women participate in the labor force at lower rates than men, but at their peak between 25 and 30, roughly 80 percent of women are involved in employment or other incomegenerating activities. 65
83 Figure 5.3. Labor force participation rates in 2008 Labor force participation declines across the older age groups, but the decline is less pronounced for men. The participation rate for men is only 8.5 percent lower for year-olds than for year-olds. The difference across age groups is greater among women. Rates drop by 26 percent between the year-olds and year-olds. There are a multitude of reasons individuals may not participate in the labor force. They may forgo work in the labor force when they participate in traditional livelihood activities, such as subsistence farming. In the context of the HIV/AIDS epidemic, labor force participation may be prevented by illness and disability. Moreover, individuals may sacrifice participation in the work force to attend to domestic responsibilities or further their education. The availability of educational opportunities has been extended since the ending of apartheid. In addition to increasing school enrollment among children, adolescents, and young adults (Kraak 2008b), the government has established adult training and certification programs (Baatjes 2008). Figure 5.4 presents the number and percentage of the inactive population who are inactive due to school enrollment. 66


84 Figure 5.4. N and percent economically active and enrolled in school in 2008 In the AHDSS, the majority of economic inactivity is due to schooling for the 15- to 29- year-old age groups. The year-old age group shows a marked increase in labor force participation, so the overall number of inactive individuals is greatly reduced from the younger age groups. For this group, though, education still accounts for much of the economic inactivity. Around half of inactive men and nearly a quarter of women aged are students. The economic inactivity of those younger than 25 is largely explained by school enrollment. 67
85 There are greater numbers of women 29 and younger who do not participate in the labor force for reasons other than education. Taking the 15- to 29-year-old age groups collectively, education accounts for 95 percent of the economically inactive men, while it accounts for only 77 percent of the economically inactive women. Although older individuals may be enrolled in adult education and training programs, few men or women over 30 remain economically inactive due to school. Figure 5.5 excludes students from the inactive population and disaggregates the inactive population by the other reasons individuals in Agincourt do not participate in the labor force. The most common reason for non-participation for both men and women is that they are not looking for work, an unfortunately uninformative reason 15. Where a reason is given, the majority of men are inactive due to a disability or illness, while the majority of women are inactive due to domestic responsibilities. Disabilities account for around half of all economic inactivity among men over 25, and domestic work accounts for the majority of economic inactivity among women. Domestic work as a reason for not working increases across the older age categories of women. The other category is a combination of volunteer, subsistence farmer, and other. The data presented here suggest that very few individuals within the AHDSS are involved in subsistence farming to the exclusion of labor market activities. 15 This response could indicate that individuals would like to work and have not been actively seeking employment. Alternatively, this category could mean that the individuals do not wish to work for some other reason. This response code is discussed in greater detail in Chapter 3. 68

86 Figure 5.5. Reasons for economic inactivity in 2008 UNEMPLOYMENT The unemployment rate measures the ability of individuals within the labor force to find employment and is given as the number of individuals looking for or desiring a job over the entire labor force. The official, national unemployment rate among Blacks in 2008 was 23.6 percent among men and 30.9 percent among women (StatsSA 2010). The unemployment rates for the Agincourt men and women years old were 25.3 and 47.8 percent, respectively. The 69
87 male rates are comparable to the national figure, but the unemployment rates recorded in Agincourt are nearly 18 percentage points higher for women than in the national average. The higher rate of unemployment among women in the AHDSS could be due to a number of factors. As with labor force participation, the requirement that individuals participate in an active job search may mean that some women do not appear as unemployed in the unemployment rates produced from the QLFS because these women would appear as economically inactive. Because we see greater labor force participation and unemployment within Agincourt, the AHDSS rates and labor force classifications used throughout this dissertation are likely to include discouraged workers. Whether labor migrants are included in the population has considerable impact on the observed unemployment rate of both men and, to a lesser extent, women. Figure 5.6 plots unemployment rates for men and women by population; the first panel of shows the de facto population (i.e., excluding labor migrants) and the second panel shows the de jure population (i.e., everyone listed in the AHDSS). The unemployment rate of year-olds, inclusive of both labor migrants and non-migrants, is 18.8 percent among men and 47.8 percent among women. Removing labor migrants, these rates increase to 41.8 percent and 62.0 percent, respectively. The male rate more than doubles, by a factor of 2.2, and the female rate increases by a factor of 1.3. Male unemployment rates, relative to women s, are more sensitive to the exclusion of labor migrants due the greater involvement of men in the labor migrant system. 70
88 Figure 5.6. Unemployment rates in 2008 The difference between the two population definitions will be determined by the relative unemployment rates of labor migrants and non-migrants. In Agincourt, unemployment rates are much lower among labor migrants. In contexts where labor migration serves to relieve unemployment pressures, labor migrants could potentially experience higher unemployment rates than their non-migrant counterparts. In these cases, a de facto population would have lower unemployment rates than a population in which household membership is defined more loosely. Figure 5.7 shows unemployment rates calculated separately for labor migrants and nonmigrants. The non-migrant rates are identical to the de facto rates. The unemployment rate among labor migrants is included, along with non-migrants, in the de jure rate. The unemployment rate among labor migrants is lower than that of non-migrants, meaning that labor migrants are more likely than non-migrants to be employed. Excluding labor migrants from the Agincourt rates by limiting to a de facto population will necessarily increase unemployment rates relative to the de jure population due to the better employment outcomes of labor migrants. 71
89 Figure 5.7. Unemployment rates in 2008, by labor migrant status EMPLOYMENT RATES Despite their utility, unemployment rates may be misleading in the context of high unemployment due to the withdrawal of discouraged workers from the labor force. The employment rate, also referred to as the employment-to-population ratio or labor absorption rate, is robust to methodological decisions regarding who is economically inactive and who is unemployed. National employment rates of Black men and women in 2008 are 47.6 percent and 33.9, respectively (StatsSA 2010). This means a little less than half of all Black African men aged 15 to 64 have a job, while around a third of Black African women in the same age group have a job. The comparable figures for Agincourt are 50.5 and 28.8 percent for men and women. Thus, the Agincourt men appear to have slightly higher employment than the national average, while Agincourt women have lower employment than the national average. Although there are slight differences between national and AHDSS employment rates, we should interpret this difference with caution. As will be addressed in Chapter 6, the South African labor market is volatile, and these rates vary considerably over time. The national rate is 72
90 an annual measure, while the rate calculated for Agincourt applies to the August-October period. Seasonal variation may certainly contribute to the differences seen here. Many have claimed that the QLFS underestimates informal employment (Grant 2010; Muller and Esselar 2004), and researchers have suggested that the AHDSS labor survey is more apt to capture informal economic activities (Collinson and Wittenberg 2001). In regard to employment rates, the two data sources appear quite similar despite the considerable differences between survey instruments. Within the AHDSS, labor migrants contribute substantially to employment rates. Figure 5.8 presents employment rates for the two treatments of the AHDSS population: the first panel presents the de facto, resident-only population and the second panel presents the de jure population that is inclusive of labor migrants. If both employed and unemployed labor migrants are removed, employment rates fall considerably. For the age categories between 25 and 55, the employment rates fall between 21 and 30 percentage points for men and 9 to 14 percentage points for women. As is the case for unemployment rates, the male employment rates are more sensitive to the treatment of labor migrants than are the female rates. This is due to men s greater involvement in labor migration. Among both labor migrants and non-migrants, male employment rates peak during their early 30s at around 80 percent employment and remain steady through their late 40s. The employment rates among women peak at a later age. For ages 35 to 45, roughly 50 percent of the female population in Agincourt are employed. Thus, during their peak employment years of ages 30 45, roughly 80 percent of men are working, while the other 20 percent are either economically inactive or unemployed. During women s peak years of 35 45, roughly half of women are employed. 73
91 Figure 5.8. Employment rates in 2008 DISCUSSION Residency requirements, although necessary for some purposes, alter households and the underlying population composition. In societies where households and families remain fluid, a de facto population will fail to capture the familial and resource linkages between physical dwellings and communities. In Agincourt, we see that labor force figures vary considerably between a de facto and a de jure population. Using the de facto population for the AHDSS data, the unemployed and non-working population is overestimated when the rates are used to represent the ability of the population to find employment. This bias is intuitive when we consider that the majority of men and a nonnegligible number of women work outside the study site as labor migrants. When rates are prepared according to the de jure population, unemployment rates fall due to lower unemployment among labor migrants, and the overall employment-to-population ratio increases. The difference between the de facto and the de jure population will be greater, as is shown for men, when employment and economic activity are more dependent on labor migration. 74
92 The distinction between employment figures by de jure and de facto populations goes unrecognized in the employment literature of South Africa. National employment surveys and other demographic surveys, such as the Demographic and Health Survey, impose residential requirements and a de facto population. Spatially disaggregated employment figures derived from de facto populations should be interpreted with caution. In the presence of circular labor migration, the labor force rates of origin communities will fail to reflect the economic activities of circular labor migrants, while the labor force rates of destination communities will include the activities of labor migrants, or individuals who remain socially and financially tied to households in other regions. The magnitude of the bias between de jure and de facto populations will be dependent on the definitions used to define household membership and the residency restrictions placed on the de facto population. The direction of the bias will depend on the selective nature of labor migrants; specifically, origin areas will have higher unemployment rates than destination areas when de facto populations are used in contexts where labor migrants have higher employment rates than comparable non-migrants. The converse will be true when the unemployed factions of a population are pushed into labor migration and have lower employment rates than those who do not migrate. Note that apartheid policies yielded results consistent with the first context. Namely, labor migrants were required to have proof of employment to travel within destination areas, i.e., White-only areas. This chapter has shown that labor force rates are dependent on the operational definitions of households and the residency restrictions placed on enumerated populations. Substantively, the de jure population is more consistent with the theoretical treatment of households as interdependent familial and social groups. However, surveys and censuses often adopt de facto 75
93 populations. Future work should acknowledge these differences and evaluate whether the operational definition of household is in sync with the theoretical definition of a household. Where the de facto population and residency requirements allow for more precise demographic accounting and allow researchers to prevent over-counting, those implementing demographic surveys should consider whether instruments can be designed to achieve both purposes. This chapter indirectly highlights the primacy of labor migration in the economic activities in the area through a comparison of rates calculated while including and excluding labor migrants. Labor migration is a focus throughout the dissertation, but this chapter seeks to establish that the current understanding of the South African labor force is blind to the labor migrant system. The national surveys currently used to monitor the labor force impose residency requirements; in other words, individuals are counted where they are found during enumeration and, as such, represent a de facto population. As the labor migrant system separates families across administrative boundaries, the labor migrant work force of the former homelands disappears from the labor force figures of their origin areas. 76
94 CHAPTER 6. LABOR MIGRATION IN A VOLATILE LABOR ECONOMY Chapter 4 showed that labor migrants make up the bulk of the working population from Agincourt and suggested that employment outside the study site is likely to be better paid and more secure than the informal work taking place within the study site. Chapter 5 showed that the major labor force rates of the Agincourt population are sensitive to the treatment of labor migrants. Although much of the population works outside of Agincourt, the behavior of those who cannot find work through labor migration is the other face of labor migration in South Africa. Apartheid imposed strict regulations on the movement and mobility of those without work, with labor migrants returning to Black areas, often forcibly, on the expiration or termination of their employment contracts. If labor migrants return to rural households to wait for new employment opportunities, high unemployment in rural areas is in part determined by weak labor market demand in urban areas. This chapter seeks to evaluate the sensitivity of South Africa s labor migrant system to fluctuations in the national labor economy. To do this, I evaluate the entry into and exit from labor migration among working-aged individuals in Agincourt between 2001 and In addition to addressing labor migration as a function of the national economy, the chapter also examines what labor migrants do while in Agincourt. The chapter addresses the economic activity of labor migrants during spells of non-migration by identifying those most likely to be labor migrants and comparing their non-migrant employment status with those who are less likely to be labor migrants. 77
95 INTRODUCTION Labor migrants were first recruited by the mining companies in South Africa during the late 1880s (Cordell et al. 1996; Maloka 1997). Ever since, South Africans have established lifelong careers as labor migrants to the various mines, industrial areas, and urban centers throughout the country. Although apartheid did not create the labor migrant system, it engineered the economic and legal conditions to sustain the labor migrant system while enforcing the segregation of the unemployed and non-working Black Africans. Apartheid may not have been totally successful in preventing the rural-urban migration of unemployed Blacks, but the apartheid government went to great lengths to curb the resettlement of Blacks to White areas. By 1986, over 17.5 million Blacks in White areas were prosecuted under the pass laws and relocated (Savage 1986). By design, apartheid displaced unemployment to the former homelands. Apartheid redistributed unemployment among Black Africans away from White areas and into the townships and homelands (Lipton 1972). As such, the homelands earned the moniker labour reserves, and their primary function was to reproduce and house the unskilled labor force of White industries (Legassick 1974; Wolpe 1972). Despite the ending of apartheid, one may question whether the former homelands continue to absorb the excess unemployment of urban areas. The lack of economic opportunities and the deterioration of subsistence agriculture in many homelands under apartheid motivated the homelands labor force into labor migration. Conditions have improved somewhat in certain areas of the former homelands. Infrastructure has been improved, and large national and international chain restaurants and retail stores have 78
96 moved into many of the smaller towns and secondary urban areas. Thus, in relative terms, finding employment outside the labor migrant system is likely easier than it was under apartheid. The punitive costs imposed by the apartheid regime have been removed as South Africa has transitioned to a democratic state. As these costs have been removed, one would expect both the demands for labor and individual circumstances to motivate labor migration within South Africa. Our economic understanding of labor migration decision-making processes suggests that labor migrants weigh the immediate and future benefits of migration (the probability of employment and earning higher wages) against the economic and social costs of migration (Borjas 1989; Chiquiar and Hanson 2005; Harris and Todaro 1970; McKenzie and Rapoport 2010; McKenzie, Stillman, and Gibson 2010). Under apartheid, the major factor determining labor migration would have been the costs associated with labor migration. The pass laws and relocation effects created a disincentive for unemployed Black Africans to move to White areas. The decision to migrate should be influenced by the relative employment potential offered by origin and destination areas. However, the de facto nature of labor force data in South Africa makes a comparison of origin and destination rates inappropriate when the movement of the employed and unemployed alters the spatially disaggregated rates whose differentials are thought to inform the migrants decision to migrate. Under apartheid, weakened demand for labor in urban, White areas would have led to greater unemployment in the former homelands. Figure 6.1 shows urban and rural unemployment rates between 2000 and These graphs clearly show the gulf between urban and rural unemployment increasing as national unemployment rises. In these years, the rising national unemployment rate is translated into a growing gulf between urban and rural unemployment rates. One potential explanation for this is the return of unemployed labor migrants to their origin households in rural areas. Regional 79
97 unemployment rates may inform an individual s decision to migrate for work, but the return migration of individuals may also impact regional unemployment rates. Figure 6.1. Urban and rural unemployment rates, 2000 to 2004 Source: Rates were calculated using the September and March Labour Force Surveys (StatsSA 2008b) using the broad definition of unemployment among Black Africans. If labor migrants return to origin areas due to unemployment in urban areas, they will lower unemployment rates in urban areas. Depending on their activities once they return to origin areas, they will impact unemployment rates in their rural, origin areas as well. Labor migrants may potentially withdraw from the labor force when they return to origin areas, yielding no major change in the unemployment rate of their origin community. These individuals will, however, decrease the overall employment-to-population ratio. If return labor migrants engage in either informal or formal employment in these areas, they decrease unemployment rates in the origin communities, assuming they do not displace existing non-migrant workers. Finally, if they return to their origin communities where they remain unemployed, they can increase unemployment rates in their origin communities. 80
98 This analysis asks where labor migration from Agincourt is related to trends in national unemployment and employment rates by addressing entry into and exit from labor migration. This study further seeks to determine the employment status of these displaced migrants. CHAPTER METHODS This analysis seeks to establish the extent to which labor migration from the AHDSS is associated with fluctuations in the national labor market by evaluating entries into and exits from labor migration among the Agincourt population from 2000 to OUTCOME MEASURES The outcome measure is a measure of labor migration status during a given census year. Labor migration status is an annual measure based on the AHDSS s classification of the residency pattern of individuals who are away for six months or more during the preceding year. Labor migrants are defined as those who spend six months or more away from the household in order to work or look for work. The 12-month period covers approximately the period between the current and prior census date. Therefore, someone who is designated as a labor migrant in 2003 will have spent six or more months away from their household in Agincourt working or looking for work between approximately September 2002 and September The measure does not distinguish whether the time spent away from the household as a labor migrant was continuous or disrupted by periods spent in Agincourt. PREDICTIVE MEASURES Fluctuations in the national labor market are captured by annual age- and gender-specific employment and unemployment rates for Black Africans. The rates are calculated for a calendar year using data from the South African Labour Force Survey (LFS) (StatsSA 2008b) and the Quarterly Labour Force Surveys (QLFS) (StatsSA 2011). The LFS was conducted in March and 81
99 September for the years 2000 and The QLFS was conducted on a rolling basis with data organized by economic quarter. All rates are created using the broad definition of unemployment that includes discouraged workers as part of the unemployed labor force. Employment and unemployment rates vary considerably across age and sex groups. As such, interpretations of employment/unemployment rates as measures of the labor market will be confounded by age differences in the labor force rates. In order to address this issue, all rates are standardized by age and sex. This standardization means rates will be comparable between men and women and across age groups, and variations will be due to differences in the rates over time. Moreover, model coefficients will indicate the change in labor migration associated with a one standard deviation increase in the employment or unemployment rate. Unemployment and employment rates along with the standardized values, means, and standard deviations are presented in Appendix 2, Table A2.9 by year, age group, and sex. CONTROLS I include several individual factors related to labor migration and employment. First, I consider the age, education, and citizenship of the individuals. Age is modeled with indicator variables of five-year age groups. Educational attainment is measured as a binary indicator of high education where a value of 1 indicates that an individual s educational attainment is above the annual median of other individuals within his or her five-year age-sex group. A reference to median education values appears in Appendix 1, Table A1.1. South African citizenship is determined based on one s designation as a South African relative to Mozambican. This study evaluates employment statuses over time. It is important to note that the escalation of the HIV epidemic in South Africa and its potential to shape employment and labor migration (Clark et al. 2007; Morris, Burdge, and Cheevers 2000; Wagner et al. 2009) have 82
100 potentially impacted my outcome measures of interest. Unfortunately, the AHDSS does not include any suitable health-related measures that would allow me to filter out these impacts. As such, I include a binary measure that indicates whether an individual dies during the year following the observation year as a proxy for poor health. In other words, if the outcome is measured in year y, the death measure is created for year y+1. Finally, there is considerable mobility between households within the study site. Individuals who change residence may do so in order to gain access to resources (Collinson et al. 2007). I create a binary indicator that an individual moved into the observation household in the two years prior to enumeration because these individuals may be more prone to be unemployed non-migrants. LABOR MIGRATION In order to address migration transitions, the sample is divided by individuals prior labor migration status. A set of models predict labor migration in year y + 1 for a set of individuals who were labor migrants the prior year, y. Thus, these models predict the continuation of labor migration. Another set of models predicts labor migration in year y + 1 for a set of individuals who were not labor migrants the prior year. These models will predict entry into labor migration. Models include the basic controls X yi that are listed above. Age and high education are interacted to allow for differential returns to higher education across ages. The primary variables of interest are the standardized national unemployment and employment rate StdRate y and the change in the standardized rate ΔRate agy+1,y. The full linear equation of the logistic regression of labor migration appears as Equation
101 Equation 6.1. = + +, + h, + +, The sample includes men and women aged 20 to 49. Due to the lagging of the labor migration and labor market rates, the first year of observation is 2000 and predicts labor migration in The last year of observation is 2008, predicting labor migration patterns in This data structure is longitudinal, so attrition may bias results if the mechanisms leading to attrition are also related to labor migration. To mitigate the bias imposed by differential censoring, models are weighted on the inverse probability of follow-up, calculated by year, age, sex, and education. This method has been used elsewhere to address mortality selection (Boardman, Blalock, and Pampel 2010; Pampel 2005). Because the models are repeated cross-sections, individual observations are repeated for each year of the census between 2000 and The models include fixed effects for village of residence and include robust standard errors for non-independence of observations within households. LABOR MARKET STATUS OF NON-MIGRANTS In addition to modeling migration transitions, this chapter presents analysis of the labor market status of non-migrants. The analysis aims to understand how the economic activities of labor migrants differ from non-migrants when labor migrants cease labor migration. Given the nature of the labor migration data, establishing the counterfactual of a labor migrant working as a non-migrant is difficult. The approach adopted here is to calculate a propensity for labor migration based on individual and household characteristics. The propensity values are used to classify individuals as likely migrants. This information is then used to predict the non-migrant employment status of those who are not labor migrants in 2000, 2004, and The restriction 84
102 to these three years is necessary as the Labour Force Status Module, the source of non-migrant employment information, is available only for these three years. I create fitted probabilities of labor migration using the logistic model presented in Equation 6.2. Unlike the models defined in Equation 6.1, the models used to fit the propensity measure are entirely cross-sectional. The model is fit on data collected from the years , and the concurrent, rather than lagged, standard employment rates are included in the model. As the ultimate aim of this model is to develop a good prediction of labor migration, an extensive array of individual and household covariates is included 16 in addition to the covariates described above. Equation 6.2. = 1 = The fitted probabilities are purged of temporal variation in labor migration. The standardized unemployment and unemployment rates are set at the means (zero), and the year of observation indicator is set to The fitted probabilities are derived following Equation 6.3. Equation 6.3. = 1 = The propensity for labor migration is the primary predictor of local non-migrant employment status. The employment status is modeled as repeated cross-sections in 2000, 2004, and 2008 using multinomial logistic regressions with indicators of age categories, sex, high educational attainment, Mozambican refugee, age-by-education interaction, and controls for a 16 The additional covariates introduced to improve the predictive power of labor migration are household characteristics that can be determined in each year of the survey. These include household head information (age, education level, and sex), the presence of children (counts of children 5 and under, counts of children 14 and under, the presence of one s own child under 5 in the household, and a dependency ratio among non-migrants), other labor migrants within the households (counts of other males and females in the household who are labor migrants), spouse information (whether a spouse is in the household and whether that spouse is a labor migrant), and variables indicating the presence of male and female pensioners/older adults in the household. 85
103 subsequent death and a recent change of residence. The models predict a four-category employment status variable for non-labor migrants, Emp yi. This variable has a value of j that ranges from 0 to 3 where 0 = Economically Inactive, 1 = Unemployed, 2 = Employed Informally, 3 = Employed Formally. The multinomial models were used to test the model fit and to prepare fitted probabilities. In order to facilitate the interpretation of the models, comparable logistic regression models are presented in the results. The logistic models presented in lieu of multinomial models are defined in Equation 6.4. The models include fixed effects for village of residence and include robust standard errors for non-independence of observations within households. Equation 6.4. ( ) ( ) = + + ( = 1) RESULTS The AHDSS collected labor force data on the population in 2000, 2004, and The data were collected during different labor market contexts. Figure 6.2 presents the national unemployment rate among Black Africans between 2000 and 2011 and includes boxes for the years when AHDSS employment data are available. The 2000 data were collected at a time when unemployment and employment rates were around the period average, while 2004 and 2008 data were collected during periods of, respectively, the worst and best labor market conditions during the period. 86
104 Figure 6.2. National unemployment rates, 2000 to 2011 Figure 6.3 shows labor migration rates for the three years; corresponding figures are listed in Appendix 2, Table A2.1. For some groups of men and all age groups of women, labor migration is at its lowest in In that year, 39 percent of men were labor migrants, relative to 40 and 41 percent in 2000 and 2008, respectively. While the difference in male rates across time is modest, the female difference is slightly larger, with 15 percent of women being labor migrants in 2004, relative to 18 and 17 percent in 2000 and Whereas the labor migration rates include a sizeable economically inactive population that increases the stability of these rates over time, unemployment rates among labor migrants should fall if unemployed labor migrants return to Agincourt. Figures 6.4 and 6.5 show the unemployment rates of the migrant and non-migrant populations of men and women, respectively. The year 2004 saw heightened unemployment across South Africa. 87
105 Figure 6.3. Labor migrants per 1000 of the population, by year However, the unemployment rate among labor migrants was lower in 2004 than it was in 2000 for both men and women, suggesting that unemployed workers may have returned to their origin households during the period of high national unemployment. The unemployment rate dropped for male and female labor migrants from 27 and 38 percent to 12 and 15 percent. The unemployment rate in 2008 for men is comparable to the 2004 unemployment rate, while the 2008 unemployment rate among female labor migrants is higher. Figures 6.4 and 6.5 also demonstrate that the unemployment rate among non-migrants in Agincourt was the highest in One interpretation of these trends is that unemployed labor migrants returned to Agincourt during the economic turndown in
106 Figure 6.4. Male unemployment rates per 1000, by year and labor migrant status Figure 6.5. Female unemployment rates per 1000, by year and labor migrant status Table 6.1 presents transition rates into and out of labor migration over the period. The transitions are disaggregated by sex, age group, and levels of education. Looking first at the labor migrant sample, 86 percent of men are likely to continue as labor migrants through the following the year, compared to 76 percent of female labor migrants who continue as labor migrants through the following year. The youngest age groups of both sexes have lower rates of continuity among labor migrants than the older groups. 89
107 Table 6.1. Labor migrant status at a one year follow-up for labor migrants and non-migrant, by educational attainment, gender, and age N % a N % a N % a Male By age group: Female By age group: a Percent is the percentage of migrants who continue labor migration in the following year. N % b N % b N % b Male By age group: Female By age group: b Percent is the percentage of non-migrants who participate in labor migration in the following year. Labor Migrant Sample By Educational Attainment Total Low High Non-Labor Migrant Sample By Educational Attainment Total Low High 90
108 Only 77 percent of men and 63 percent of women aged continue labor migration, relative to 89 and 81 percent of the year-old men and women, respectively. There appears to be a slight tendency for those men with higher education to continue labor migration at the youngest age groups. For women, the differential by level of education is more pronounced, and it would appear that women with higher education have higher rates of continuing labor migration. Shifting to the non-migrant sample, we see that 19 percent of non-migrant men are likely to engage in labor migration during the following year, whereas only 7 percent of women enter into labor migration. Thus, the gender difference in labor migration occurs as women are less likely to enter into labor migration and more likely quit labor migration. The age pattern for both sexes is substantively the same: the youngest age groups are more likely to enter into labor migration than the older age groups. This tells us two things. First, the younger age groups shift more rapidly between non-migrant and migrant status than older individuals. This is potentially due to the high unemployment rates among the youth. They may take short-term employment as labor migrants or fail to find work and return to Agincourt the following year. A selection process may exist wherein older individuals secure more stable employment and economic activities. As such, they witness less change in labor migration status. Those who have higher education appear more likely to enter into labor migration. Thus, we may expect a selective process, particularly among the youngest age groups, where those with higher education are employed as labor migrants. Tables 6.2 and 6.3 show the logistic regression models predicting continuous labor migration and entry into labor migration. Both sets of models predict labor migration, and they differ only in that Table 6.2 shows models fit to a sample of existing labor migrants and the 91
109 models of Table 6.3 are fit on a sample of non-migrants. Focusing on the baseline model, model 1, we can see that higher educational attainment is predictive of higher rates of labor migration among both samples, meaning that those with higher education are more likely both to continue labor migration and to begin labor migration than less-educated individuals. Figure 6.6 shows the average fitted probabilities of continuing labor migration by age, sex, and educational attainment. As was noted in Table 6.1, the difference in the likelihood of continuing labor migration is greater among those who are better educated than their same-sex, same-aged peers. However, this difference is apparent only among the younger age groups, and educational attainment among older age groups is not a major factor for whether labor migrants continue labor migration for another year. One interpretation of this difference is that those with better education enjoy more job security and experience fewer disruptions to continuous employment as labor migrants. Figure 6.6. Average fitted probabilities of continued labor migration among labor migrants, by age and educational attainment 92
110 Table 6.2. Logistic regression models of continuing labor migration among 20 to 49 year olds from 2000 to Model 1 Model 2 Model 3 Model 4 Model 5 Males Age (Ref 20-24) *** (0.048) 0.489*** (0.048) 0.47*** (0.048) 0.488*** (0.048) 0.477*** (0.048) *** (0.055) 0.757*** (0.055) 0.746*** (0.055) 0.755*** (0.055) 0.754*** (0.055) *** (0.061) 0.893*** (0.061) 0.898*** (0.061) 0.88*** (0.062) 0.891*** (0.062) *** (0.067) 1.048*** (0.067) 1.037*** (0.067) 1.068*** (0.067) 1.075*** (0.067) *** (0.074) 0.979*** (0.074) 0.993*** (0.074) 0.977*** (0.074) 1.008*** (0.074) Mozambican *** (0.039) 0.203*** (0.039) 0.199*** (0.039) 0.204*** (0.039) 0.2*** (0.039) High Educational Attainment ** (0.056) 0.166** (0.056) 0.172** (0.055) 0.166** (0.056) 0.171** (0.055) High Education by Age Ref Low Educ. And High Edu. Aged * (0.074) 0.15* (0.074) (0.074) 0.146* (0.074) (0.074) (0.081) (0.082) (0.081) 0.03 (0.082) (0.081) (0.09) (0.091) (0.09) (0.091) (0.09) (0.1) (0.1) (0.1) (0.1) (0.1) (0.11) (0.111) (0.111) (0.111) (0.111) National Labor Force Measures 4 Base Unemployment Rate *** (0.012) *** (0.013) Unemployment Rate Change *** (0.019) Base Employment Rate 0.14*** (0.012) 0.208*** (0.014) Employment Rate Change 0.174*** (0.016) Constant 1.146*** (0.058) 1.161*** (0.059) 1.152*** (0.058) 1.145*** (0.059) 1.142*** (0.058) Females Age (Ref 20-24) *** (0.077) 0.355*** (0.077) 0.284*** (0.077) 0.356*** (0.077) 0.297*** (0.077) *** (0.082) 0.546*** (0.082) 0.46*** (0.082) 0.547*** (0.082) 0.49*** (0.082) *** (0.086) 0.861*** (0.086) 0.856*** (0.086) 0.862*** (0.086) 0.873*** (0.086) *** (0.095) 1.01*** (0.095) 1.01*** (0.095) 1.013*** (0.095) 1.053*** (0.095) *** (0.101) 0.809*** (0.101) 0.789*** (0.101) 0.811*** (0.101) 0.837*** (0.101) Mozambican ** (0.058) ** (0.059) -0.19** (0.058) ** (0.059) ** (0.058) High Educational Attainment * (0.083) 0.188* (0.083) 0.166* (0.083) 0.188* (0.083) 0.17* (0.082) High Education by Age Ref Low Educ. And High Edu. Aged * (0.105) 0.221* (0.105) 0.252* (0.105) 0.221* (0.105) 0.256* (0.104) (0.113) (0.113) (0.113) 0.18 (0.113) 0.2 (0.113) (0.118) (0.118) (0.118) (0.118) -0.1 (0.117) (0.132) (0.131) (0.131) (0.132) (0.131) (0.14) (0.14) (0.14) (0.14) (0.139) National Labor Force Measures 4 Base Unemployment Rate 0.01 (0.016) *** (0.018) Unemployment Rate Change *** (0.03) Base Employment Rate (0.017) 0.21*** (0.02) Employment Rate Change 0.357*** (0.021) Constant 0.386*** (0.084) 0.386*** (0.084) 0.417*** (0.084) 0.386*** (0.084) 0.448*** (0.084) 1 The models predict labor migration status from 2000 to 2009 for subset of individuals who were labor migrants during the prior year. Therefore, the model samples are labor migrants in The baseline sample is aged 20-49, and the measures of educational attainment are made at baseline. Individuals may contribute multiple observations and multiple individuals from the sample household may be present. Standard errors were adjusted for non-independence of observations within individuals and households. Village fixed effects were included, but not shown. Controls for changing residence and a subsequent death, as proxy for individual health, are included in all models, but not shown. 2 The study site population is roughly 30% Mozambique and these individuals either refugees, immigrants, or the decedents of immigrants. 3 High educational attainment is measured as having education that is higher than the median years of education of the same sex-gender group. Medians are calculated separately by baseline observation year. 4 Unemployment and employment rates are the annual, national rates, calculated from the South African Labour Force Survey and South African Quarterly Labour Force Surveys. The annual weights are standardized by age and sex group in order to purge age and gender differences in the employment measures. Estimates are weighted to be representative to the entire Black African population and the unemloyment rate is calculated under the broad definition of unemployment. 93
111 Table 6.3. Logistic regression models of beginning labor migration among 20 to 49 year olds from 2000 to Model 1 Model 2 Model 3 Model 4 Model 5 Males Age (Ref 20-24) *** (0.038) 0.512*** (0.038) 0.511*** (0.038) 0.512*** (0.038) 0.513*** (0.038) *** (0.05) 0.222*** (0.05) 0.222*** (0.05) 0.223*** (0.05) 0.223*** (0.05) (0.058) (0.058) (0.058) (0.058) (0.058) ** (0.071) ** (0.071) ** (0.071) ** (0.071) ** (0.071) *** (0.084) *** (0.084) *** (0.084) -0.43*** (0.084) *** (0.084) Mozambican *** (0.035) 0.458*** (0.035) 0.458*** (0.035) 0.457*** (0.035) 0.457*** (0.035) High Educational Attainment *** (0.036) 0.436*** (0.036) 0.437*** (0.036) 0.44*** (0.036) 0.439*** (0.036) High Education by Age Ref Low Educ. And High Edu. Aged (0.058) (0.058) (0.058) (0.058) (0.058) (0.073) (0.073) (0.073) (0.073) (0.073) *** (0.085) *** (0.085) *** (0.085) *** (0.085) *** (0.085) *** (0.103) *** (0.103) *** (0.103) *** (0.103) *** (0.103) * (0.119) * (0.119) * (0.119) * (0.119) -0.29* (0.119) National Labor Force Measures 4 Base Unemployment Rate (0.011) (0.012) Unemployment Rate Change (0.015) Base Employment Rate (0.01) (0.012) Employment Rate Change (0.013) Constant *** (0.047) *** (0.047) *** (0.047) *** (0.047) -1.67*** (0.047) Females Age (Ref 20-24) *** (0.051) 0.328*** (0.051) 0.323*** (0.051) 0.336*** (0.051) 0.334*** (0.051) ** (0.058) 0.183** (0.058) 0.177** (0.058) 0.186** (0.058) 0.184** (0.058) (0.068) (0.068) (0.068) (0.068) (0.068) ** (0.079) ** (0.078) ** (0.079) -0.23** (0.078) ** (0.078) *** (0.09) *** (0.09) *** (0.09) *** (0.09) *** (0.09) Mozambican *** (0.047) *** (0.047) *** (0.047) *** (0.047) *** (0.047) High Educational Attainment *** (0.05) 0.668*** (0.05) 0.681*** (0.05) 0.676*** (0.05) 0.68*** (0.05) High Education by Age Ref Low Educ. And High Edu. Aged * (0.071) * (0.071) * (0.071) * (0.071) * (0.071) *** (0.08) *** (0.08) -0.31*** (0.08) *** (0.08) *** (0.08) *** (0.093) -0.49*** (0.093) *** (0.093) *** (0.093) -0.5*** (0.093) *** (0.108) *** (0.108) *** (0.108) -0.58*** (0.108) *** (0.108) *** (0.128) *** (0.128) *** (0.129) *** (0.129) *** (0.129) National Labor Force Measures 4 Base Unemployment Rate *** (0.014) *** (0.014) Unemployment Rate Change *** (0.017) Base Employment Rate 0.115*** (0.012) 0.134*** (0.015) Employment Rate Change 0.039* (0.017) Constant *** (0.058) *** (0.058) -2.71*** (0.058) *** (0.058) *** (0.058) 1 The models predict labor migration status from 2000 to 2009 for subset of individuals who were not labor migrants during the prior year. Therefore, the model sample include non-labor migrants in The baseline sample is aged 20-49, and the measures of educational attainment are made at baseline. Individuals may contribute multiple observations and multiple individuals from the sample household may be present. Standard errors were adjusted for non-independence of observations within individuals and households. Village fixed effects were included, but not shown. Controls for changing residence and a subsequent death, as proxy for individual health, are included in all models, but not shown. 2 The study site population is roughly 30% Mozambique and these individuals either refugees, immigrants, or the decedents of immigrants. 3 High educational attainment is measured as having education that is higher than the median years of education of the same sex-gender group. Medians are calculated separately by baseline observation year. 4 Unemployment and employment rates are the annual, national rates, calculated from the South African Labour Force Survey and South African Quarterly Labour Force Surveys. The annual weights are standardized by age and sex group in order to purge age and gender differences in the employment measures. Estimates are weighted to be representative to the entire Black African population and the unemloyment rate is calculated under the broad definition of unemployment. 94
112 Figure 6.7 shows the fitted probabilities of beginning labor migration. The difference by educational attainment in the probability of beginning labor migration is more pronounced than the same difference in the probability of continuing migration. Thus, it appears that educational attainment among youth is more valued among labor migrants. Given the large degree of informal work in Agincourt, this makes sense. Figure 6.7. Average fitted probabilities of continued labor migration among labor migrants, by age and educational attainment Shifting focus to labor migration transitions over time, Figure 6.8 presents labor migration rates in the AHDSS between 2000 and 2009 along with the national unemployment and employment rates between 2000 and Overall, men have higher rates of labor migration, lower unemployment rates, and higher employment rates than women. Despite the differences of magnitude, the temporal trend in these rates is similar for both men and women. From 2000 to 2002, there is a sharp decline in labor migration accompanied by an equally dramatic increase in unemployment. Unemployment rates among women are more sluggish to improve; the labor migration of men rebounded to 2000 levels by about 2004, whereas the labor 95
113 migration of women did not return to 2000 levels until about By 2008, both men and women experience the lowest unemployment rates and highest employment rates in this series. Visually, labor migration appears to mirror the trend in national unemployment rates while following national unemployment rates loosely. Figure 6.8. Labor Migration, unemployment, and employment rates 1, Labor migration rates calculated for the year-old population in Agincourt 1 Unemployment and employment rates calculated with LFS and QLFS data, using the expanded definition of unemployment Model 2 of Table 6.2 introduces the standardized unemployment rate, at time t, to the migration continuation models. Recall that this sample includes labor migrants at time t and predicts labor migration at time t + 1. For men, a one standard deviation change in the agespecific unemployment rates leads to about a 10 percent reduction in the likelihood of continuing labor migration. The term for women is insignificant. Model 3 of the same table includes a change measure between the unemployment rate at year y + 1 and year y. This coefficient is significant for both men and women and suggests that an increase in the unemployment rate reduces the odds of continuing labor migration. 96
114 Model 4 introduces the employment rate, or the employment-to-population ratio, to the baseline model. As with the unemployment rate, the employment rate significantly predicts continued labor migration among men but not women. For men, a one standard deviation change in the age-specific employment rate leads to about a 15 percent increase in the likelihood of continued labor migration. Model 5 introduces the employment change measures, and these are significant for both men and women. Both the unemployment rate and the employment rate show similar results; individual labor migration is more likely to continue during periods when employment is more easily found throughout the country. The standardized rate measure suggests that there is more continuity in individuals labor migration when the labor market is relatively healthy, and the change measures suggest that deterioration in the labor market, rising unemployment and falling employment, leads many individuals to forgo labor migration. Figure 6.9 shows this graphically by presenting the average fitted probabilities of continued labor migration by the employment and unemployment rates and their change measures. The coefficient for the change measures of both rates are larger for women than men and can be seen here by steeper slopes in the lines of the fitted probabilities. This suggests that women may potentially be quicker to return to Agincourt upon losing or failing to find employment than are men. Turning focus to the non-migrants, Table 6.3 presents the logistic regressions of initiating labor migration. Neither the unemployment nor the employment rate are significant predictors of whether men initiate labor migration. Although men are more likely to return home in a poor economy, a weak labor market does not seem to impact men s decisions to participate in labor migration. 97
115 Figure 6.9. Average fitted probabilities of continued labor migration among labor migrants, by employment rates and unemployment rates Figure Average fitted probabilities of beginning labor migration among non-labor migrants, by employment rates and unemployment rates Women, on the other hand, appear to be less likely to engage in labor migration when the standardized unemployment rate is higher and more likely when the employment rate is higher. In other words, the initiation of labor migration among women is more closely tied to the labor market than it is for men. 98
116 LABOR MARKET STATUS OF NON-MIGRANTS We have seen that unemployment and employment rates fluctuate considerably between 2000 and 2009 and that labor migration rates have loosely trended with employment. Labor migration declines during periods of a weak labor economy. Both male and female labor migrants appear more likely to cease labor migration when there is an increase in unemployment, and women are more hesitant to begin labor migration when unemployment is high. By virtue of the de jure nature of the Agincourt data, we can determine the economic activity of these former and future labor migrants during their spells of non-migration. Figure 6.11 presents the distribution of employment statuses in the AHDSS in 2000, 2004, and The percentage of labor migrants and the percentage of employed non-migrants stand out as being lower in 2004 than in the other two years. In order to clarify what displaced labor migrants are likely to do while in Agincourt, I fit multinomial logistic models of nonmigrant employment status, i.e., the four non-migrant categories presented in Figure The logistic regression version of these models appears in Table 6.4, and these models are presented in lieu of the multinomial models in order to facilitate interpretation of model coefficients. The models are organized by columns, with each of the four non-migrant employment statuses having two models. The first model is a baseline model, and the second model introduces the propensity that the individual is a labor migrant. 99


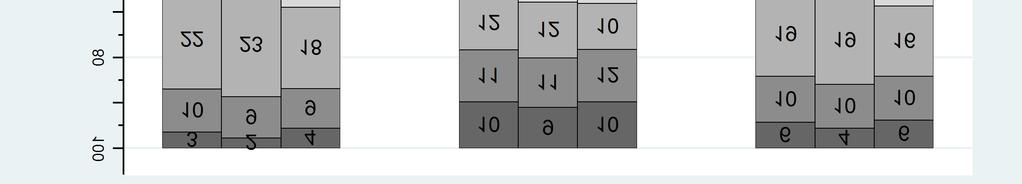

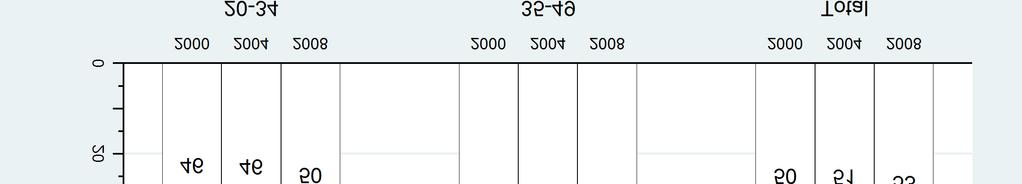
117 Figure Employment status, by sex, age group, and year 100
118 Table 6.4. Logistic regression models of economic activity among non-migrants in 2000, 2004, and Inactive Unemployed Informally Employed Formally Employed Model 1 Model 2 Model 1 Model 2 Model 1 Model 2 Model 1 Model 2 Estimate Robust SE Estimate Robust SE Estimate Robust SE Estimate Robust SE Estimate Robust SE Estimate Robust SE Estimate Robust SE Estimate Robust SE Female Year (Ref=2000) *** (0.03) -0.13*** (0.03) 0.46*** (0.03) 0.46*** (0.03) -0.3*** (0.04) -0.29*** (0.04) -0.35*** (0.05) -0.36*** (0.05) *** (0.03) -0.63*** (0.03) 0.77*** (0.03) 0.77*** (0.03) -0.21*** (0.04) -0.21*** (0.04) 0.45*** (0.06) 0.43*** (0.06) Age (Ref 20-24) *** (0.04) -0.83*** (0.04) 0.48*** (0.04) 0.48*** (0.04) 0.91*** (0.07) 0.91*** (0.07) 1.27*** (0.22) 1.27*** (0.22) *** (0.05) -0.85*** (0.05) 0.11* (0.05) 0.11* (0.05) 1.46*** (0.07) 1.46*** (0.07) 1.67*** (0.22) 1.67*** (0.22) *** (0.05) -0.86*** (0.05) -0.23*** (0.06) -0.24*** (0.06) 1.78*** (0.07) 1.78*** (0.07) 2.11*** (0.22) 2.1*** (0.22) *** (0.05) -0.57*** (0.05) -0.67*** (0.07) -0.67*** (0.07) 1.79*** (0.08) 1.79*** (0.08) 2.13*** (0.22) 2.12*** (0.22) *** (0.06) -0.37*** (0.06) -1.04*** (0.08) -1.04*** (0.08) 1.79*** (0.08) 1.79*** (0.08) 2.19*** (0.23) 2.19*** (0.23) South African -0.24*** (0.04) -0.23*** (0.04) 0.34*** (0.04) 0.34*** (0.04) -0.28*** (0.05) -0.27*** (0.05) 0.77*** (0.11) 0.74*** (0.11) High Education -0.41*** (0.05) -0.37*** (0.05) 0.35*** (0.05) 0.32*** (0.05) 0.02 (0.1) 0.04 (0.1) 1.22*** (0.23) 1.12*** (0.23) High Education by Age * (0.07) -0.16* (0.07) 0 (0.07) 0 (0.07) (0.12) (0.12) 0.03 (0.27) 0.04 (0.27) *** (0.08) -0.35*** (0.08) -0.1 (0.08) (0.08) 0.03 (0.12) 0.02 (0.12) 0.41 (0.27) 0.45 (0.27) *** (0.08) -0.36*** (0.08) -0.32*** (0.09) -0.3*** (0.09) (0.12) (0.12) 0.53* (0.26) 0.59* (0.26) *** (0.09) -0.33*** (0.09) -0.44*** (0.1) -0.41*** (0.1) 0.07 (0.12) 0.04 (0.12) 0.54* (0.26) 0.62* (0.26) (0.09) (0.09) -0.59*** (0.13) -0.57*** (0.13) 0.05 (0.13) 0.03 (0.13) 0.42 (0.27) 0.49 (0.27) Propensity Labor Migrant -0.15*** (0.04) 0.1* (0.04) -0.09* (0.05) 0.31*** (0.07) Constant 1.18*** (0.06) 1.19*** (0.06) -1.51*** (0.07) -1.51*** (0.07) -2.53*** (0.09) -2.53*** (0.09) -6.43*** (0.24) -6.43*** (0.24) Male Year (Ref=2000) (0.04) 0.02 (0.04) 0.1* (0.04) 0.1* (0.04) (0.05) (0.05) -0.25*** (0.06) -0.25*** (0.06) (0.04) (0.04) -0.15*** (0.04) -0.14*** (0.04) 0.04 (0.05) 0.04 (0.05) 0.37*** (0.06) 0.37*** (0.06) Age (Ref 20-24) *** (0.07) -1.84*** (0.07) 0.8*** (0.06) 0.8*** (0.06) 1.09*** (0.07) 1.09*** (0.07) 1.28*** (0.14) 1.28*** (0.14) *** (0.08) -1.91*** (0.08) 0.51*** (0.07) 0.5*** (0.07) 1.32*** (0.08) 1.31*** (0.08) 1.78*** (0.15) 1.78*** (0.15) *** (0.09) -1.68*** (0.09) 0.33*** (0.07) 0.33*** (0.07) 1.26*** (0.09) 1.26*** (0.09) 1.98*** (0.15) 1.98*** (0.15) *** (0.1) -1.48*** (0.1) 0 (0.09) 0.01 (0.09) 1.31*** (0.1) 1.31*** (0.1) 2.25*** (0.16) 2.25*** (0.16) *** (0.11) -1.42*** (0.11) 0.03 (0.1) 0.04 (0.1) 1.15*** (0.11) 1.15*** (0.11) 2.41*** (0.16) 2.41*** (0.16) South African 0.17** (0.05) 0.24*** (0.06) 0.2*** (0.05) 0.17*** (0.05) -0.61*** (0.06) -0.65*** (0.06) 0.26** (0.09) 0.25* (0.1) High Education -0.33*** (0.05) -0.39*** (0.05) 0.35*** (0.05) 0.37*** (0.05) -0.28*** (0.09) -0.25** (0.09) 0.64*** (0.16) 0.64*** (0.16) High Education by Age * (0.1) 0.25* (0.1) -0.28*** (0.09) -0.29*** (0.09) (0.12) (0.12) 0.14 (0.2) 0.14 (0.2) * (0.14) -0.36* (0.14) -0.48*** (0.1) -0.48*** (0.1) 0.05 (0.13) 0.05 (0.13) 0.66*** (0.2) 0.66*** (0.2) ** (0.14) -0.43** (0.14) -0.89*** (0.11) -0.9*** (0.11) 0.16 (0.14) 0.14 (0.14) 1*** (0.21) 0.99*** (0.21) ** (0.15) -0.4** (0.15) -0.79*** (0.13) -0.81*** (0.13) 0.17 (0.15) 0.14 (0.15) 0.75*** (0.21) 0.74*** (0.22) (0.15) (0.15) -0.8*** (0.14) -0.82*** (0.14) 0.3 (0.16) 0.27 (0.16) 0.33 (0.22) 0.33 (0.22) Propensity Labor Migrant 0.25*** (0.06) -0.11* (0.05) -0.14* (0.06) (0.09) Constant 0.45*** (0.08) 0.34*** (0.09) -1.01*** (0.08) -0.97*** (0.08) -1.83*** (0.1) -1.77*** (0.11) -4.54*** (0.18) -4.52*** (0.18)
119 The baseline models reveal interesting patterns over time and reflect the heightened national unemployment during the early 2000s. The female coefficients for year of observation indicate that economic inactivity among women has declined between 2000 and 2008, whereas the probability of non-migrant women being unemployed has increased. Women were less likely to be employed informally in 2004 and 2008 relative to Women were also less likely to be employed formally in 2004 relative to 2000 and more likely to be employed formally in 2008 relative to Non-migrant women have seen a shift from economic inactivity to unemployment between 2000 and Moreover, the non-migrant employment of women appears to be shifting away from informal employment to formal employment. The male models also reflect the poor economy in In that year, men were more likely to be employed and less likely to be unemployed formally than in Conversely, the improved economy in 2008 is observed by a reduced probability of being unemployed and a greater probability of formal employment. Over time, males have seen a decrease in unemployment and an increase in formal employment. These models also include age, high education, and an age-by-education interaction. Figure 6.12 shows the difference in the probability that an individual has a particular economic status by age group. We see that those with higher levels of education are more likely to be employed formally than those who are at or below the median level of educational attainment. The one exception to this is the younger age groups, where those who have higher education are more likely to be unemployed. For women, the greater likelihood of formal employment among those with higher education is offset by their reduced probability of being economically inactive. For men, the increased probability of formal employment looks to be offset by the reduced probabilities of being economically inactive and unemployed. 102
120 Figure Difference in the average fitted probabilities of employment status between high and low levels of educational attainment Those who have the highest education in their age groups exhibit a greater tendency toward economic activity, and these individuals are largely able to find formal employment. Those in the youngest age groups appear to have some difficulty translating their higher 103
121 education into employment as they have elevated probabilities of unemployment related to their less-educated peers. Model 2 of Table 6.4 introduces a binary indicator that an individual is a labor migrant. This measure is based on the fitted probability that an individual was a labor migrant in a particular year between 2000 and The probabilities were fit while holding the year of observation and the national employment and unemployment rates constant, effectively purging any temporal changes in labor migration. The measure indicates that an individual has a propensity for labor migration that is at or above the 75 th percentile of his or her age and gender group 17. Figure 6.13 shows the difference in the average fitted probabilities of the non-migrant employment statuses by those who have a higher propensity for labor migration relative to those below the 75 th percentile. The models and figure show that non-migrant women with a high propensity for labor migration are more likely to work formally or be unemployed than women with a lower propensity for migration. In fact, the odds that a woman with a high propensity for labor migration is unemployed is about 11 percent greater, e (0.1), than it is for other women. The odds that these women are formally employed are about 36 percent greater, e (0.36). This shows us that women who are likely labor migrants are slightly less likely to engage in informal employment within Agincourt than women with a lower propensity for migration. Men who have a higher propensity for labor migration are more likely to be economically inactive. The odds of these men being economically inactive are about 28 percent greater, e (.0.25), than for non-migrant men with a lower propensity for labor migration. There are three potential 17 Propensity measures often have extreme distributions. Histograms of the propensity measures by age group are shown in Appendix 2, Figures A2.1 and A2.2. The distributions do not appear overly skewed and have considerable variance to be a useful predictor of non-migrant employment status. 104
122 explanations for this trend. First, these men may be discouraged workers who are waiting for employment opportunities to arise. Figure Difference in the average fitted probability of employment status among non-labor migrants between those with a high and low propensity for labor migration 105
123 Given the loose definition unemployment used in this study, this is not likely to be the case. Second, these men, particularly the youngest men, may be continuing their education. Third, these men may not be labor migrants because they have become ill. Other work within the study site has shown that recently returned migrants have higher rates of mortality than longterm non-migrants (Clark et al. 2007). This indicates that a likely motive for men to forgo labor migration is their poor health. An interesting and counterintuitive non-finding is that those who have a high propensity for labor migration do not engage in informal employment at higher rates than those with a lower propensity for migration. The propensity measure sought to identify individuals who were potentially displaced by rising national unemployment. A reasonable expectation would be that labor migrants would engage in informal activities during periods of economic downturn, but this is not the case. The coefficients for year of survey even indicate a decline in informal employment in 2004 relative to 2000 and This is peculiar in that informal employment in rural areas is often described as a subsistence activity. One possibility is that economic downturns reduce the amount of remittances and incomes flowing into the area and limit the profitability and survival of informal enterprises. Discussion The findings of this chapter suggest that labor migration from Agincourt is partially explained by fluctuations in the national labor market. This link between the national labor market and labor migration raises important issues for the regional differences in unemployment rates that are often observed. Under apartheid, the loss of employment meant that labor migrants had to return home to the former homelands. We see the same pattern in labor migration from Agincourt. The odds of continuing labor migration are reduced by about 24 percent among men, 106
124 1 e (.269), and 36 percent among women, 1 e (.449), when unemployment rises by one standard deviation. As these individuals will be represented in the regional statistics at the place they reside during enumeration, rising unemployment nationally is likely to displace unemployed labor migrants to their origin households, skewing regional differences. While the study was able to measure annual transitions into and out of labor migration, a notable limitation and important area for future research is the appropriate time span for measuring labor migration transitions. Ideally, future work would not only identify labor migrants but delineate spells of migration. This would yield important information regarding the average length of time migrants are away and the frequency with which they return. Due to the close proximity of many migrant destinations and the lack of legal barriers, labor migrants in South Africa are likely to be fluid while looking for employment. They may tap into expansive migrant networks to obtain household and employment information (Curran, Garip, and Chung 2005; Massey 1990). Given the potential for such mobility among labor migrants, the annual measures, and particularly the change in an annual migration status, may encompass too large a time span to adequately identify the relationship between the national labor market and labor migration. That we do see a relationship despite the coarse temporal measures of labor migration is compelling. This study attempts to evaluate the trends in national employment and labor migration. However, data availability permits the evaluation of only a nine-year period. Due to the precision of the labor migration measures, this results in nine data points. In order to increase statistical power, the study disaggregates unemployment and employment rates by sex and age groups while standardizing to adjust for age differences in these rates. Future research could overcome 107
125 this limitation by narrowing the measurement to shorter intervals, such as economic quarters, and expanding the coverage of the time interval. The labor migrant system in South Africa has important policy implications for economic development in the former homelands. South Africa participates in a brand of pro-poor local economic development (LED) in which economic growth and increased employment in rural areas have been identified as vehicles for poverty alleviation (Rodriguez-Pose and Tijmstra 2005; Rogerson 2006). The success of these programs will be determined by the long-term investment of time and resources into small and informal businesses. This study raises questions about whether or not this will be the case. 108
126 CHAPTER 7. FEMALE LABOR MIGRATION AND HOUSEHOLD COMPOSITION The de facto de jure distinction is an important one in South Africa. The operational definition of household will likely be an issue for social research in many contexts where circular migration of household members is common. The de facto nature of data sources in South Africa challenge our ability to understand the labor migration and employment process. This chapter presents models of female labor migration using AHDSS data. The chapter focuses on two areas where scholars in South Africa have relied on household composition to understand the economic activities of women. INTRODUCTION FEMALE LABOR FORCE PARTICIPATION Since the dissolution of apartheid, the presence of women in the South African economy has grown, outpacing that of men (Casale and Posel 2002). Although women are joining the labor force, their increased participation has been met with rising unemployment and falling wages (Casale 2004). In Agincourt, the labor force participation rate among women aged increased by 7 percentage points between 2000 and 2008, while the unemployment rate increased by about 5 percentage points. Thus, despite an apparent increase in women s desire to engage in economic activities and employment outside the household, the employment-topopulation ratio remained fairly stable, with 278 women per thousand having any type of employment in 2000 and 289 per thousand having employment in As the demand for female labor appears to be constant, the rise in female labor migration does not seem to be driven by a growth in employment opportunities for women. 109
127 GENDER RELATIONS The gender composition of the household has been implicated in the labor migration of women. A lack of men in the household has been offered as an explanation of rising female labor migration in South Africa. This explanation accords with demographic trends: Marriage rates have fallen during the post-apartheid era (Hosegood et al. 2009), while the prevalence of femaleheaded households has increased (Madhavan and Schatz 2007). As fewer women are living with men, scholars have proposed two potential mechanisms linking men in the household and female labor migration. One possibility is that women experience greater economic freedoms, such as labor migration, in the absence of male authority figures who might force traditional gender roles (Posel and Casale 2003). Even in contexts in which husbands are absent from the household, there is evidence that women remain in the rural household in order to engage in farming to preserve the family s claim to their land (Potts 2000). Under this interpretation, men in the household signify traditional gender roles in which women remain behind to attend to domestic work while men engage in labor migration. Where the absence of men from the household may indicate a deviation from traditional gender roles, their absence also entails a lack of male breadwinners and potential economic hardship. In the second potential mechanism, women s economic hardship, rather than their empowerment to engage in economic activities, may prompt women to become labor migrants. The main study documenting the determinants of labor migration of women in South Africa was conducted by Posel and Casale (2003) using data from the 1993 Project for Statistics on Living Standards and Development (PSLSD). They found that women are less likely to migrate when they are married and have employed men in the household, and they are more likely to be labor migrants when there are male labor migrants in the household. The PSLSD 110
128 collects nominal information on labor migrants but does not assess the characteristics of those migrants. Thus, household composition measures, such as male employment, are based on the resident, de facto population. The trend for women to engage in labor migration where there are migrant males, and not engage in labor migration where there are employed men within the de facto household, is somewhat contradictory. As we have seen, labor migrants are more likely to be employed. If economic necessity prompts the labor migration of women, employed resident and non-resident men should lower the economic incentives for women to migrate. The research presented by Posel and Casale (2003) does not distinguish between married women whose husbands are or are not labor migrants. Married women whose husbands are labor migrants may engage in labor migration with their husbands. The composition and marital status measures poorly distinguish the relationship between female labor migration and employment versus presence of men in the household. As noted by the authors, this limitation is due to the limited information collected on labor migrants in the PSLSD (Casale and Posel 2002). Thus, household composition as a covariate and predictor of female labor migration is sensitive to who is and who is not considered part of the household. ELDERLY PENSIONS The definitions used to define households in national data have implications for our understanding of the economic activities of women due to the censoring of female labor migrants. South African researchers have also addressed the role of public transfers, such as the elderly grant, in shaping labor force decisions. After apartheid, public welfare programs were expanded to include all South Africans. One program, a means-tested, non-contributory elderly 111
129 pension, was made available to all men over and women over 60 whose households met the income requirements. Due to the relative poverty of Black Africans, most who meet the age requirements qualify for the pension (Edmonds 2006). As of 2014, the pension paid approximately 1,270 Rand per month (Republic of South Africa 2014). These pensions have had substantial impacts on household incomes and are a critical source of income among poor, Black African households. In 2007, roughly a third of African households indicated pensions as the primary source of income (Aliber 2009), and along with the private transfer of remittances, public grant transfers are the primary form of incomes and livelihoods among Africans in rural South Africa (Bryceson 2002a). Due to the sharing of pensions (Kuhn and Stillman 2004), their ability to improve the quality of life of individuals (Bertrand, Mullainathan, and Miller 2003; Case and Menendez 2007; Duflo 2000a, 2000b; Schatz 2007), households (Barrientos 2003; Schatz and Ogunmefun 2007), and even villages (Angelucci and Giorgi 2009) has been well documented. Given the pervasive use of the old-age pension to support immediate and extended kin, some have questioned the ability of pensions to shape the labor force choices of household members. A large international body of literature has documented a decline in household member employment on the receipt of various forms of public aid and welfare (Bargain and Doorley 2011; Hoynes and Schanzenbach 2012; Jacob and Ludwig 2012; Kiefer and Neumann 1979; Shimer and Werning 2007). These studies have theorized that individuals will accept a job only if the wage or salary meets their minimum reservation wage, and they will remain unemployed while waiting for a better-paying job if the jobs currently available fail to meet their 18 The age eligibility requirement for men was gradually lowered to 60, beginning in As these data cover periods prior to the transition, the age in which men become eligible for the pension is
130 acceptable reservation wage (Kiefer and Neumann 1979). According to this line of thought, those who have access to more household resources, including the elderly pension, are likely to maintain higher reservation wages and are more likely to remain unemployed relative to comparable individuals who do not have access to public grants and maintain a lower reservation wage. Drawing on this debate, researchers have investigated the employment outcomes of household members living with an elderly pensioner in South Africa. These studies have shown that those living with pensioners are less likely to be employed than their counterparts in households without access to a pensioner (Bertrand et al. 2003; Dinkelman 2004; Jensen 2004). These authors argue that those who are supported by an elderly pensioner have greater latitude in their job search as they maintain higher reservation wages and prolong their unemployment or choose not to participate in the labor force altogether. These studies suffer from a key methodological limitation created by the de facto definition of a household. In the South African context, employed household members are likely to reside outside the household throughout much of the year. In addition to other limitations 19, these studies fail to account for the employment of labor migrants. Others have argued that the elderly pension enables the labor migration of both men and women (Ardington, Case, and Hosegood 2009; Posel, Fairburn, and Lund 2006). Some have found that access to a pension in the household does not change individuals motivation to work (Surender et al. 2010). The de facto nature of national data masks a potential selection bias where pensioners support the employment of household members by enabling labor migration. 19 There is evidence that unemployed individuals cluster around stable sources of income (Francis 2002; Klasen and Woolard 2008), and as such, cross-sectional designs showing a relationship between an elderly pensioner and nonemployment cannot differentiate the selective effects from the impact of the pension. 113
131 This chapter uses the AHDSS data to address the labor migration of women. As the data are based on de jure households and include comparable employment information for labor migrants and non-migrants, this study provides a more nuanced measurement of the male composition of the household and a replication of a study of female employment in KwaZulu- Natal that has suggested that elderly pensions increase female labor migration (Ardington et al. 2009). CHAPTER METHODS STUDY SITE This chapter uses the AHDSS data collected in 2000, 2004, and As discussed in Chapter 2, this area is part of the former Gazankulu homeland and is located near commercial farms, tourist attractions, and major industrial and economic centers. As such, labor migration within the area is high, and the labor migration of women (Collinson et al. 2007) has increased since MEASURES This chapter uses the annual labor migration status measure; the Labour Force Survey Module collected in 2000, 2004, and 2008; and household-level compositional measures derived from the household roster to predict the labor migration of women. Labor Migration Status Labor migration status is measured annually. This study uses the data from 2000, 2004, and 2008 to identify the labor migration status of the sample women and various members of their household. Labor migrants are defined by the AHDSS as those who were away for 6 months or more during the 12 months preceding enumeration. Marital Status 114
132 To determine the extent to which female labor migration is related to the presence or absence of a husband, I have created a three-category measure of marital status. This measure defines women as single, married to a non-migrant husband, or married to a labor migrant. The measure incorporates the labor migration status of the husband because women may join their husbands as labor migrants. Due to the various sources of marital status information in the data, the marital status indicator requires that the husband be present on the household roster. This means that married women whose husbands are not included on the household roster are considered single. Based on marital status, I create two binary variables indicating that the woman is married to a nonmigrant or married to a labor migrant, with single women serving as the reference category. Household Males Although spouses may be expected to exert the greatest influence over women s labor migration, other males in the household may also constrain the economic activity of women. The lack of male breadwinners has been proposed as a push factor that increases female labor migration. To evaluate this mechanism linking household men to the labor migration of women, I create a measure of the number of men over 20 in the household who are employed and not the woman s spouse. As others have suggested that female labor migration may be prompted by household necessity and the lack of incomes provided by men, we would expected to find a negative relationship. Given the nature of the Agincourt data, the number of employed men will include both labor migrant and non-labor migrant men. Labor migrant men in the household, while expected to provide income and resources, also present the opportunity for women to engage in joint migration. To control for the confounding employment of labor migrants, I introduce a count of 115
133 employed men aged 20 or older who are labor migrants. The three count measures represent the non-spousal male composition of the household. They are not mutually exclusive, so the coefficients must be interpreted jointly, not separately. The male composition measures, combined with the spouse indicators, will capture much of the relationship between men in the household and female labor migration. However, the literature uses female headship as a composition measure that indicates the lack of male authority figures. An indicator of a female-headed household is introduced to the models to determine whether female headship continues to predict female labor migration after other measures of male composition in the household are controlled. Household Pension Status I seek to evaluate the potential dual roles of having a pensioner within the household. On one hand, the pensioner may facilitate the labor migration of women by providing childcare and other domestic duties. On the other, the pension itself may serve as a source of funding when women begin labor migration. I create two sets of count variables for men and women in the household who are 50 and over. The Labour Force Status Module determines whether individuals are pensioners, and with this information, I create count measures of the men and women over 50 who are and are not pensioners. Pension status in this study, unlike the study based in KwaZulu-Natal that links female labor migration to the elderly pension (Ardington et al. 2009), uses a direct report of pensioner status. These measures are included to determine whether the presence of older individuals increases the odds that women are labor migrants and whether the pension itself is associated with the labor migration of women. Controls I include two measures of potential migration constraints that women face. First, I include a measure of the non-migrant dependency ratio. This modified dependency ratio is 116
134 calculated as the ratio of resident children under 15 years old to the total number of non-migrant household members aged 15 and older. Note that unlike many dependency ratios, this measure does not count the elderly among dependents. With other household labor migrants omitted, this measure provides an indication of the household s need for child care. Second, I include an indicator of whether the sample woman has a child under the age of 5 within the household. These controls are important because married women are potentially more likely to have young children, and a negative association with labor migration and a spouse may be spurious to the extra child care responsibilities that married women have. I include several individual factors related to female labor migration. First, I consider the age, education, and citizenship of the individuals. Age is modeled continuously and includes an interaction term. Educational attainment is measured as a binary indicator of high education where one indicates that a woman s educational attainment is above the annual median of other women in her five-year age group. South African citizenship is determined based on one s designation as South African relative to Mozambican. In light of the HIV epidemic and due to a lack of adequate health information, I include a binary variable to approximate health. I determine whether an individual dies during the year following the observation year. In other words, if an observation reflects labor migration in 2000, the binary indicator will be a one if the individual dies in 2001 and zero otherwise. There is considerable mobility between households within the study site. Individuals who change residence may do so in order to gain access to resources (Francis 2002; Klasen and Woolard 2008). I create a binary indicator that an individual moved into the observation household in the two years prior to enumeration. As I use many count measures of household composition, I include household size as a baseline control. 117
135 MODELS I use logistic regressions to evaluate the relationship of female labor migration and household composition measures. The models predict the annual labor migration status of all women aged 20 to 49. Age and sample inclusion are based on the residence of women within the study site at the approximate midpoint of data collection, September 15 th, in the years 2000, 2004, and Because were collected during multiple years, observations are person-years, and an indicator of observation year is included within all models. Observations are repeated for the same individual and are clustered within households and villages. I include village fixed effects to account for differences by villages. I use robust standard errors to account for nesting within households. The repetition of individuals should not pose additional bias as the adjustment to the standard errors for household clustering will be more stringent than the adjustments for the repetition of individual records. The models are constructed incrementally. First, models are built to address whether the presence of men and/or spouses are related to the labor migration of women. Second, the pension measures are introduced to determine whether pensions are related to the labor migration of women. Lastly, the more substantive controls are included to determine whether these alter prior coefficients. RESULTS Table 7.1 presents the means and percentages of covariates included in the models. The estimates are disaggregated by the females migration status. A little over 20 percent of the sample are labor migrants, and most covariates vary significantly between non-migrant and labor migrant women. 118
136 Table 7.1. Means and percentages of model covariates, by labor migrant status Total Sample Size Covariates (79.5%) 7863 (20.5%) Age * * South African citizen 72.8% 70.7% * 80.9% * High educational attainment1 42.5% 39.7% * 53.5% * Died within year following enumeration 0.9% 0.9% 0.9% Changed residence 2 years prior to enumeration Household size Has own child <5 years in HH HH dependency ratio among non-labor migrants Marital Status 11.5% 12.3% * 8% * % 48.4% * 31.8% * * 0.45 * No spouse in HH 58.2% 52.8% * 79.1% * Non-migrant spouse in HH 16.6% 20.2% * 2.5% * Labor migrant spouse in HH 25.2% 27.0% * 18.5% * N male adults in HH * 1.38 * N employed men in HH 2 N labor migrant men in HH 2 HH head is female N female pensioners in HH 4 N male pensioners in HH * 0.71 * * 0.56 * 39.1% 35.5% * 53.2% * * 0.25 * * 0.08 * Pensioner mother in HH 8.2% 6.5% * 14.5% * Pensioner father in HH 3.5% 3.1% * 5.2% * Pensioner spouse in HH 0.8% 0.9% * 0.1% * N females aged 50+ in HH * 0.26 * N males aged 50+ in HH * 0.20 * * Denotes significance difference between non-migrants and labor migrants at p<.05 1 High educational attainment is a binary indicator that means a woman have more years of education than the median of her 5 year age group. Non-Migrants Labor Migrants 2 Household compositional count measures of men excludes a spouse and only applies to men aged 20 and over. Labor migrants have a higher mean age, are more likely to be South African rather than Mozambican, and have an educational attainment that is higher than the median of their age group. Migrant women are less likely to live with a husband. While labor migrant women are less likely to be married, their households include more men aged 20 or older, more employed men aged 20 or older, and more employed labor migrant men aged 20 or older. Finally, labor 119
137 migrant women are more likely to live in female-headed households. These bivariate trends suggest that the labor migration of women is in fact lower among married women. However, we see little evidence that having additional men in the household decreases labor migration among women. In fact, additional men in the household, particularly employed men and labor migrants, seem to be associated with greater labor migration among women. The labor migration of women is also positively associated with the number of male and female pensions in the household and the number of women aged 50 and older. The number of men aged 50 and older is greater in the households of non-migrant women. The results from the logistic regressions predicting female labor migration are presented in Tables 7.2 and 7.3, showing the male composition (Table 7.2) and pension measures (Table 7.3) separately. The full set of regressions is presented in Appendix 2, Table A2.11. The male composition measures in Table 7.2 Model 1 show the baseline model that includes age, education, and other individual controls. Marital status is coded with indicators of a non-migrant and a labor migrant spouse, using unmarried women as the reference category. Relative to unmarried women, married women have reduced odds of labor migration. Particularly, the odds of labor migration among married women whose husbands do not participate in labor migration is only 6 percent, e ( 2.74), of that of non-married women. Married women whose husbands are labor migrants have a greater likelihood of migration than those whose husbands are not labor migrants, but these women are still less likely to be labor migrants than unmarried women by a factor of about one-third, e ( 1.02). While the coefficients for the marital status indicators are muted by the successive introduction of additional controls, marital status remains a strong and significant predictor of the labor migration of women. The negative association between marriage and female labor migration does appear in the de jure data, and 120
138 although there may be joint migration among married women with labor migrant husbands, on average, women married to migrants are less likely to migrate. Table 7.2. Coefficients (standard errors) of logistic regression models predictive of labor migration among women aged 20 to 49 in 2000, 2004, and Males within Household Covariates Non-migrant spouse in HH Labor migrant spouse in HH N male adults in HH 4 N employed men in HH 4 N labor migrant men in HH 4 Constant HH head is female -2.74*** -2.69*** -2.69*** -2.68*** -2.54*** -2.44*** (0.09) (0.09) (0.09) (0.09) (0.09) (0.09) -1.02*** -0.97*** -0.97*** -0.97*** -0.83*** -0.65*** (0.04) (0.04) (0.04) (0.04) (0.05) (0.05) 0.11*** 0.07*** 0.07*** 0.1*** (0.02) (0.02) (0.02) (0.02) (0.02) 0.08** (0.03) (0.04) (0.04) (0.04) Model 2 introduces a measure of the number of males in the household who are 20 years old and older. This and other measures of male counts in the household do not include a spouse in the cases where a spouse is in the household. The coefficient indicates that each additional man in the household is associated with an 11 percent, e (0.11), increase in the likelihood of labor migration. Model 3 introduces the non-exclusive measure of the number of men aged 20 and *** 0.17*** 0.23*** (0.04) (0.04) (0.04) 0.23*** 0.27*** (0.04) (0.05) -2.4*** -2.4*** -2.39*** -2.4*** -2.53*** -1.91*** (0.09) (0.09) (0.09) (0.09) (0.1) (0.11) N * p<.05, ** p<.01, ***, p< Sample of women aged 20 to 49 in 2000, 2004, and 2008 and standard errors are adjusted for clustering within households. 300 records of women with husbands of pension-age were removed. 2 All models include 20 village fixed effects, controls for age, age squared, a binary indicator of high education based on the median age of each age group, an interaction of high education with age, an indicator of South African citizenship, an indicator of survey year, and household size. 3 The full model includes indicators of a pension-aged male (female) in the household, a male/female aged 50+, a measure of the HH depedancy ratio among non-migrants, and a binary indicator of one's own child in the household under 5. 4 Household compositional count measures of men exclude the spouse and are calculated for men aged 20 and older.
139 over who are employed within the household. The introduction of this measure accounts for the positive relationship among men in the household. Each additional employed man in the household is associated with about an 8 percent, e (0.08), increase in the odds of labor migration among women. This finding is contrary to the study of the PSLSD that found that employment among resident men is associated with lower female migration (Casale and Posel 2002), although the measure presented here includes employment among labor migrants as well. If female labor migration is instigated by the lack of male breadwinners in the household, we would expect to see the number of employed men to be negatively related to the probability of labor migration among women. That we do not find this association may indicate that the lack of male breadwinners is not the primary motivation behind increasing labor migration among women. In the context of considerable labor migration among men, most employment among men occurs outside the study site, as three-quarters of the employed men are labor migrants. The positive relationship between female labor migration and male employment is potentially spurious to the labor migration of those employed men. Model 4 introduces a non-exclusive count of male labor migrants within the household. Under the hypothesis that women are joining other employed, labor migrant men in the household, we would expect a positive coefficient. If the coefficient for employed men is being determined by male labor migration, the coefficient should be reduced. The coefficient for the number of employed labor migrant men is positive and reduces the employed male coefficient. Thus, the number of employed men appears unrelated to the labor migration of women net of the positive association between employed male labor migrants and female labor migration. Combining the coefficients of the three non-exclusive counts of men, the addition of an employed, non-migrant male does little to increase the odds of labor migration, an increase of 122
140 about 1 percent, e ( ). However, the addition of an employed male who is a labor migrant increases women s likelihood of labor migration by about 21 percent, e ( ). Model 5 introduces a binary indicator that the household is headed by a female. Femaleheaded households are typically more disadvantaged and face more economic hardships than male-headed households. Women in female-headed households are more likely to participate in labor migration. This coefficient is difficult to interpret given that the male composition of the household has been controlled. Model 10 includes all pension measures, discussed below, and controls of household dependency ratios and the presence of a woman s own child under age 5. All of these measures reduce the magnitude of the variables introduced in models 1 through 5, but they do not alter the substantive conclusions. Moving now to the relationship between the presence of an elderly pensioner and female labor migration, many researchers have suggested that the pension creates a work disincentive for others in the household. These conclusions are suspect as they have been based on study designs that are insensitive to labor migration, they are based on de facto populations in which the employment of labor migrants is overlooked, and a study in KwaZulu-Natal has suggested that the pensions actually facilitate labor migration (Ardington et al. 2009). Table 7.3 shows the logistic regression model coefficients for the composition measures of household members aged 50 and older. Model 6 shows that having both male and female pensioners in the household increases the likelihood of female labor migration. 123
141 Table 7.3. Coefficients (standard errors) of logistic regression models predictive of labor migration among women aged 20 to 49 in 2000, 2004, and Pensions Controls Covariates N female pensioners in HH 0.1* -0.22** -0.15* -0.16* -0.23** (0.04) (0.07) (0.07) (0.07) (0.07) N male pensioners in HH Female pensioners by age interaction Male pensioner by age interaction N females aged 50+ in HH N males aged 50+ in HH Females aged 50+ by age interaction Males aged 50+ by age interaction Changed residence 2 years prior to enumeration Died within year following enumeration Dependency ratio of non-labor migrants Has own child <5 years in HH Constant N * p<.05, ** p<.01, ***, p< (0.07) (0.11) (0.11) (0.11) (0.11) 0.03*** 0.03*** 0.03*** 0.03*** (0) (0) (0) (0) 0.03** 0.02** 0.02** 0.02** (0.01) (0.01) (0.01) (0.01) (0.06) (0.06) (0.06) 0.15* (0.07) (0.07) (0.07) 0.02*** 0.02*** 0.02*** (0.01) (0.01) (0.01) * (0) (0) (0) -0.24*** -0.22*** (0.05) (0.05) -0.32* -0.4** (0.14) (0.14) -0.7*** (0.07) -0.35*** (0.03) -2.52*** -2.42*** -2.42*** -2.37*** -1.91*** (0.1) (0.1) (0.1) (0.1) (0.11) 1 Sample of women aged 20 to 49 in 2000, 2004, and 2008 and standard errors are adjusted for clustering within households. 300 records of women with husbands of pension-age were removed. 2 All models include 20 village fixed effects, controls for age, age squared, a binary indicator of high education based on the median age of each age group, an interaction of high education with age, an indicator of South African citizenship, an indicator of survey year, and household size. In addition, these models include the covariates indicated in Table 5.2 Model 7 introduces age interaction terms with both pension indicators. These interactions allow for the relationship between pensions and female labor migration to vary by age. The 124
142 interaction terms with both male and female pension variables are significant and negate the main effects. In the case of the female pension main effect, it is now negative. As the youngest age, 20, is coded at 0, the youngest women in the sample experience lower labor migration when they live with pension-aged women. However, due to the interaction term, the older women in the sample show an increase in the likelihood of labor migration when they live with a female pensioner. As with female pensioners, male pensioners would seem to increase the likelihood of labor migration among older women. Model 8 introduces counts of non-pensioners within the household aged 50 and older. If the pension coefficients are significantly lower than the comparable coefficients for the number of members aged 50 and older, then the pension is associated with a lower likelihood of labor migration than would be expected given the presence of an older person in the household. Likewise, if the pension coefficients are significantly higher than the comparable coefficients for the number of members aged 50 and older, then the pension is associated with a greater likelihood of labor migration than would be expected given the presence of an older individual in the household. The age interaction terms render a direct comparison of the pensioner and nonpensioner coefficients inappropriate because the magnitude of these two variables will differ across ages. Table 7.4 presents fitted probabilities of labor migration for women living in households with no one aged 50 or older, those living with one non-pensioner aged 50 or older, and those living with a pensioner but no other person aged 50 or older. This is performed for female and male pensioners, and the average fitted probabilities are presented at ages 20, 30, 40, and
143 Table 7.4. Average fitted probabilities of female labor migration 1 Age Female Predictors No female One female 50+, no female pensioner One female pensioner, no other 50+ female Test of equality 2 p=.059 p=.098 p=1.000 p=1.000 Male Predictors No male One male 50+, no male pensioner One male pensioner, no other 50+ male Test of equality 2 p=.310 p=1.000 p=.009 p= These figures are the average of the fitted probabilities of Model 12 holding age, the pensioner counts, and the counts of those aged 50+ constant. The point estimates were derived with the values of other predictor variables maintaining their original values. 2 Post-hoc tests were performed between the female / male pensioner main effects and interaction and the corresponding coefficients for the counts of females / males aged 50+. This included comparisons of 2 set of variables (one male, one female) for 4 ages resulting in a total of 8 tests. The p-values presented are the Bonferroni-adjusted pvalues of two-tailed Wald tests. Two-tailed Wald test p-values are also presented that demonstrate significant differences between the pensioner coefficients and the non-pensioner coefficients at the four ages listed. The difference between the female pensioner and non-pensioner measures is not statistically significant at any age. Figure 7.1 presents the average fitted probabilities of labor migration for the different scenarios of female pensioners. Women living with a female pensioner and women living with a female non-pensioner aged 50 or older have higher probabilities of labor migration than women who do not live with a woman aged 50 or older. This increased probability is observed only at the older ages of the sample. 126
144 Figure 7.1. Mean fitted probabilities of female labor migration, by household composition of women aged 50 and older The male pensioner coefficient is statistically different from the male non-pensioner coefficient at older ages. The average fitted probabilities of the different scenarios of older men in the household are presented in Figure 7.2. Figure 7.2. Mean fitted probabilities of female labor migration, by household composition of men aged 50 and older 127
145 The male pension is associated with a higher likelihood of labor migration among women relative to women who live in households with non-pensioner men or no men over 50. However, this increased likelihood of labor migration is observed only among older women. For younger women, neither the male nor female pension measures are predictive of labor migration. These models include a plethora of household composition measures, and many of these measures are non-exclusive and will be highly collinear. In order to ensure that the coefficients are not being skewed by the presence of a small number of atypical households, Table 7.5 presents information to gauge the unique variance of the variables after including other covariates in the logistic models. Each covariate is regressed on the other model covariates included in the logistic model when a particular model is introduced. The table presents the original univariate standard deviation and the standard deviation of the residuals after regressing on the other covariates, allowing us to gauge the unique variance contributed to logistic models in the presence of other covariates. Over 80 percent of the original variance is still present in the residuals for most covariates. The count measures of men do show reduced variance with the introduction of covariates due to the nested nature of these variables. At a minimum, 46 percent of the original variance of the employed labor migrant count is still present after controlling for the other counts of men in the household. 128
146 Table 7.5. Uniqueness of variance Univariate Characteristics Residuals 1 Mean SD SD Percentiles % Unique Non-migrant spouse in HH Labor migrant spouse in HH N male adults in HH N employed men in HH 3 N labor migrant men in HH 3 HH head is female N female pensioners in HH N male pensioners in HH N females aged in HH N males aged 50+ in HH Changed residence years prior to enumeration Died within year following enumeration Dependency ratio of non-labor migrants Has own child <5 years in HH The variance of the covariates included in the logistic models of female labor migration was evaluated by regressing each covariate sequentially on the other covariates included in the logistic models. The residuals of these regressions are an indication of the unique variation associated with each covariate in the presence of other model predictors. 2 This is the ratio of the residual SD to the SD of the variable. This is the variance that is unexplained by other covariates. DISCUSSION Surveys based on a de facto definition of the household are inappropriate and can lead to erroneous conclusions when evaluating the economic activities of women. This study finds that the labor migration of women is negatively associated with marital status. The negative association is considerably greater when the husband is not a labor migrant. Single women are the most likely to be labor migrants. In terms of marital status, I do find evidence that men may curtail female labor migration, but this study finds that the presence of other men in the household is either irrelevant or associated with greater labor migration among women. In this sample, the lack of employed men or male incomes does not appear to be a primary predictor of labor migration. 129
147 Where an increased number of employed men in the household is associated with greater labor migration, this is entirely attributable to the employment of non-spousal labor migrants. This association may indicate that women are likely to engage in joint labor migration with the other men in the household, and it does not suggest that women are forced into labor migration by economic necessity. We cannot exclude economic necessity as a potential motivating factor for female labor migration. The Agincourt population may be particularly disadvantaged such that the majority of households face economic burdens that may motivate labor migration, regardless of the labor migration and employment of men in the households. This study used male employment and male labor migration in the household as indicators of economic burden. Direct measurement of household resources may indicate that women in wealthier households are less likely to be labor migrants. Women in female-headed households show a higher tendency toward labor migration than women in male-headed households. This trend, despite controls for male composition within the household, suggests potential qualitative differences between male- and femaleheaded households that cannot be easily explained by counts of men within the household. Pensioners and non-pensioners in this study were defined as individuals in the household that are 50 years or older. Pensioners are reported to be so in the LFSM. The findings here suggest that the presence of older men and women, whether pensioners or non-pensioners, is not predictive of labor migration among younger women. However, the household composition of older individuals is predictive of the labor migration of older women. The presence of female pensioners and older women in the household both increase the likelihood of labor migration, but there does not appear to be a pension effect above and beyond the presence of an older woman in the household. The presence of a male pensioner is associated 130
148 with a greater probability of labor migration, and this relationship does not appear to be spurious to the presence of older men in the household. The probability of labor migration is the same between women who live with an older non-pensioner male and women who do not live with a man over
149 CHAPTER 8. DISCUSSION KEY FINDINGS The employment of the AHDSS is strongly conditioned by South Africa s unique history of forced segregation, economic inequality, and labor migration. A common assumption following the repeal of pass laws in South Africa was that the labor migrant system would be replaced by the permanent resettlement of families to more economically developed areas. The research presented shows that labor migration continues to be an important avenue for employment among populations in the former homelands. Three-quarters of employed men and almost half of employed women spend six or more months away from their homes in Agincourt working elsewhere. The labor migrant system has adapted to the post-apartheid economic environment. Labor migration is no longer driven by the mining and agriculture sectors. Rather, the services sector has become the primary economic sector of employed labor migrants. The shift in the sectoral composition of labor migrants indicates that the labor migration system of South Africa is robust to the demands of individual economic sectors. Among employed men and women from Agincourt, only 12 percent of men and 35 percent of women work within the study site. Roughly a quarter of these are public employees who appear to work primarily in schools. The remaining three-quarters are privately employed or self-employed. Compared to workers in the same occupations outside the study site, those working in Agincourt are more likely to work informally. This is consistent with other descriptions of rural employment (Hajdu 2005; Webster and Von Holdt 2005). 132
150 All labor force rates for the Agincourt population differ between the de facto and de jure populations because of the predominance of labor migration in the area. Because much of the working population is involved in labor migration, unemployment rates for Agincourt are higher and employment rates are lower under the de facto population. This calls into question the extent to which regional unemployment rates speak to the ability of communities to find employment. In contexts of considerable circular labor migration, a de facto population necessarily speaks to the employment characteristics of destination areas rather than the origin populations. Labor migrants in Agincourt are less likely to continue labor migration when national unemployment rates increase. A faltering labor market may be translated into unemployment in Agincourt through the return of labor migrants. Local informal employment may also be stunted during national economic downturns through the loss of employment for and remittances from labor migrants. Married women are less apt to be labor migrants, and this is particularly true for women whose husbands are not labor migrants. This study finds no negative association between the presence of non-spousal men in the household and women s labor migration. In fact, the study finds that the number of employed labor migrants is associated with greater labor migration among women and that women in households with a male pensioner are more likely to be labor migrants. These findings question the economic necessity hypothesis for women s labor migration and point more toward shifts in gender roles as women forgo marriage and begin seeking careers as labor migrants. FUTURE DIRECTIONS This work has suggested that mobility and labor migration are key components to the livelihoods and economic activities of many households in developing countries. Taking this 133
151 analysis to be a case study of the economic activities of individuals in a former homeland of South Africa, we see that a de facto definition of a household will overlook and fail to document many of the economic activities of the population. Future research should be cognizant of the operational definitions of household and whether the contributions of labor migrants are included in household compositional measures. Surveys and censuses may be improved by expanding the instrument definitions of household in order to capture the non-resident portion of the household while capturing residency information. This approach will allow populations to be restricted to a de facto population when necessary while allowing the data to be used to evaluate the economic activity of households without overlooking labor migration. Data sources that are more inclusive of labor migration would assist researchers and policy makers in understanding labor migrants role in bridging the rural and urban economies. In developing countries, labor migration is often presented as a form of income diversification, where livelihoods are diversified away from agriculture. In South Africa, where agriculture is limited in many areas and a half-century of apartheid policies coerced the dependence of rural households on wage labor, labor migration may be adaptive in that the unemployed and dependents can live in rural areas while labor migrants can be opportunistic in taking jobs across multiple labor markets. By maintaining access and ties to the larger national labor market, labor migrants are better able to weather economic downturns and job instability. One area where we may seek to understand the persistence of labor migration in South Africa is the maintenance of dispersed households. Extra-household and non-resident kin and the ties between labor migrants and origin households are strong across southern Africa (Gugler 2002; Potts 2000; Smith and Hebinck 2007). In the context of South Africa s tumultuous labor 134
152 market, a household s maintenance of dispersed workers may afford the household greater resilience and adaptability to lost jobs and poor wages because a consolidated household anchored to a particular area will become dependent on the area s labor market. This logic concurs with the work of others who have identified mobility as a necessary ingredient for survival in developing countries (Langevang and Gough 2009). Assuming labor migration to be motivated by economic insecurity, internal circular labor migration will continue as long as national unemployment remains high and job security remains low. If labor migration in South Africa is the preferable route to employment among those in rural homes, we should reevaluate our expectations of rural development programs. Rural economic development initiatives target local factors that may enable or hinder the growth of rural economies. This dissertation suggests that labor migration presents a non-local source of employment and may have implications for rural development programs. Future work should evaluate whether labor migration may play a role in rural development. Some have argued that migrant remittances are translated into economic growth in origin communities by increasing demand for locally produced goods and services (Durand, Parrado, and Massey 1996; Mendola 2012). That we see a decline in informal employment within Agincourt in 2004, a period of high unemployment throughout the country, may be one indication that informal activities and small businesses in Agincourt are dependent on labor migrant remittances. 135
153 CHAPTER 9. REFERENCES Accomodation Advisor South Africa Game Reserve Reviews. Retrieved April 9, 2014 ( Agincourt HDSS Agincourt MRC/Wits Rural Public Health and Heath Transitions Research Unit. Retrieved November 7, 2012 ( Agincourt HDSS. 2013a. Census Fieldworker Guidelines. Guidelines, Definitions and Decision Rules for Field Work, General and Modules Included. Version 1. Agincourt MRC/Wits Rural Public Health and Health Transitions Research Unit. Retrieved October 10, 2013 ( Agincourt HDSS. 2013b. Data Documentation Agincourt. Agincourt MRC/Wits Rural Public Health and Health Transitions Research Unit. Retrieved October 10, 2013 ( Agincourt HDSS Maps of Agincourt Area. Agincourt MRC/Wits Rural Public Health and Health Transitions Research Unit. Retrieved March 22, 2014 ( Alemu, Zerihun Livelihood Strategies in Rural South Africa: Implications for Poverty Reduction. Addis Ababa, Ethiopia: United Nations Economic Commission for Africa. Retrieved January 25, 2012 ( Aliber, Michael Exploring Statistics: South Africa s National Household Surveys as Sources of Information about Food Security and Subsistence Agriculture. Unpublished Report, Centre for Poverty Employment and Growth, Pretoria, South Africa: Human Sciences Research Council. 136
154 Altman, Miriam Low Wage Work in South Africa. Berlin, Germany: Human Sciences Research Council. Angelucci, Manuela, and Giacomo De Giorgi Indirect Effects of an Aid Program: How Do Cash Transfers Affect Ineligibles Consumption? The American Economic Review 99(1): Anthony, Brandon The Dual Nature of Parks: Attitudes of Neighbouring Communities Towards Kruger National Park, South Africa. Environmental Conservation 34(03): Ardington, Cally, Anne Case, and Victoria Hosegood Labor Supply Responses to Large Social Transfers: Longitudinal Evidence from South Africa. American Economic Journal-Applied Economics 1(1): Ashley, Caroline, and Dilys Roe Making Tourism Work for the Poor: Strategies and Challenges in Southern Africa. Development Southern Africa 19(1): Baatjes, Ivor Adult Basic Education and Training. Pp in Human Resources Development Review: Education, Employment and Skills in South Africa, edited by Andre Kraak and Karen Press. Cape Town: HSRC Press. Baldwin, Alan Mass Removals and Separate Development. Journal of Southern African Studies 1(2): Banerjee, Abhijit V., Sebastian Galiani, Jim Levinsohn, Zoe McLaren, and Ingrid Woolard Why Has Unemployment Risen in the New South Africa? Economics of Transition 16(4): Bargain, Olivier, and Karina Doorley Caught in the Trap? Welfare s Disincentive and the Labor Supply of Single Men. Journal of Public Economics 95(9 10):
155 Barrientos, Armando What Is the Impact of Non-Contributory Pensions on Poverty? Estimates from Brazil and South Africa. SSRN elibrary. Retrieved October 28, 2012 ( Barrientos, Stephanie, and Andrienetta Kritzinger Squaring the Circle: Global Production and the Informalization of Work in South African Fruit Exports. Journal of International Development 16(1): Bebbington, Anthony Capitals and Capabilities: A Framework for Analyzing Peasant Viability, Rural Livelihoods, and Poverty. World Development 27(12): Bertrand, Marianne, Sendhil Mullainathan, and Douglas Miller Public Policy and Extended Families: Evidence from Pensions in South Africa. The World Bank Economic Review 17(1): Bezuidenhout, Andries, and Khayaat Fakier Maria s Burden: Contract Cleaning and the Crisis of Social Reproduction in Post-Apartheid South Africa. Antipode 38(3): Bhorat, Haroon, Murray Leibbrandt, Muzi Maziya, Servaas van der Berg, and Ingrid Woolard Fighting Poverty: Labor Markets and Inequality in South Africa. Cape Town: UCT Press. Boardman, Jason D., Casey L. Blalock, and Fred C. Pampel Trends in the Genetic Influences on Smoking. Journal of Health and Social Behavior 51(1): Bodibe, Oupa The Extent and Effects of Casualisation in Southern Africa: Analysis of Lesotho, Mozambique, South Africa, Swaziland, Zambia, and Zimbabwe. National Labour & Economic Development Institute. Borjas, George J Economic Theory and International Migration. International Migration Review 23(3):
156 Botha, J., E. T. F. Witkowski, and C. M. Shackleton Market Profiles and Trade in Medicinal Plants in the Lowveld, South Africa. Environmental Conservation 31(1): Bryceson, Deborah. 2002a. Multiplex Livelihoods in Rural Africa: Recasting the Terms and Conditions of Gainful Employment. The Journal of Modern African Studies 40(1):1 28. Bryceson, Deborah. 2002b. The Scramble in Africa: Reorienting Rural Livelihoods. World Development 30(5): Burger, Rulof, and Ingrid Woolard The State of the Labour Market in South Africa after the First Decade of Democracy. Journal of Vocational Education and Training 57(4): Burns, Justine, Susan Godlonton, and Malcolm Keswell Social Networks, Employment and Worker Discouragement: Evidence from South Africa. Labour Economics 17(2): Casale, Daniela What Has the Feminisation of the Labour Market Bought Women in South Africa?: Trends in Labour Force Participation, Employment and Earnings, Journal of Interdisciplinary Economics 15(3/4): Casale, Daniela, and Dorrit Posel The Continued Feminisation of the Labour Force in South Africa. South African Journal of Economics 70(1): Case, Anne, and Alicia Menendez Does Money Empower the Elderly? Evidence from the Agincourt Demographic Surveillance Site, South Africa. Scandinavian Journal of Public Health 35(69 suppl): Center for International Earth Science Information Network (CIESIN), and Centro Internacional de Agricultura Tropical (CIAT) South Africa: Population Density,
157 Retrieved April 3, 2014 ( Chiquiar, Daniel, and Gordon H. Hanson International Migration, Self-Selection, and the Distribution of Wages: Evidence from Mexico and the United States. Journal of Political Economy 113(2): Clark, Samuel J., Mark A. Collinson, Kathleen Kahn, Kyle Drullinger, and Stephen M. Tollman Returning Home to Die: Circular Labour Migration and Mortality in South Africa. Scandinavian Journal of Public Health 35(69 suppl): Cliggett, Lisa Remitting the Gift: Zambian Mobility and Anthropological Insights for Migration Studies. Population, Space and Place 11(1): Collinson, Mark A., Stephen M. Tollman, and Kathleen Kahn Migration, Settlement Change and Health in Post-Apartheid South Africa: Triangulating Health and Demographic Surveillance with National Census Data. Scandinavian Journal of Public Health 35(69 suppl): Collinson, Mark, and Martin Wittenberg Labour Force Dynamics in a Rural Part of South Africa: The Agincourt Sub-District of the Northern Province, in Labour Markets and Poverty in South Africa. Johannesburg, South Africa. Cordell, DD, JW Gregory, and V. Piché Hoe and Wage: A Social History of a Circular Migration System in West Africa. Westview Press. Cox, Donald, and Marcel Fafchamps Extended Family and Kinship Networks: Economic Insights and Evolutionary Directions. Pp in Handbook of Development Economics, edited by T. Schultz and John Strauss. 140
158 Crush, Jonathan, and Tshitereke, Clarence Contesting Migrancy: The Foreign Labor Debate in Post-1994 South Africa. Africa Today Curran, Sara, Filiz Garip, and Chang Chung Advancing Theory and Evidence About Migration and Cumulative Causation: Destination and Gender in Thailand. The Center for Migration and Development, Working Paper Series. Princeton University. Dinkelman, Taryn How Household Context Affects Search Outcomes of the Unemployed in Kwazulu natal, South Africa. South African Journal of Economics 72(3): Dovie, Delali, Charlie Shackleton, and E. T. F. Witkowski Conceptualizing the Human Use of Wild Edible Herbs for Conservation in South African Communal Areas. Journal of Environmental Management 84(2): Duflo, Esther. 2000a. Child Health and Household Resources in South Africa: Evidence from the Old Age Pension Program. The American Economic Review 90(2): Duflo, Esther. 2000b. Grandmothers and Granddaughters: Old Age Pension and Intra- Household Allocation in South Africa. National Bureau of Economic Research. Retrieved October 28, 2012 ( Durand, Jorge, Emilio A. Parrado, and Douglas S. Massey Migradollars and Development: A Reconsideration of the Mexican Case. International Migration Review 30(2): Edmonds, Eric V Child Labor and Schooling Responses to Anticipated Income in South Africa. Journal of Development Economics 81(2): Edwards, Lawrence Globalisation and the Skills Bias of Occupational Employment in South Africa. South African Journal of Economics 69(1):
159 Ellis, Frank Rural Livelihoods and Diversity in Developing Countries. Oxford: Oxford University Press. Francis, Elizabeth Rural Livelihoods, Institutions and Vulnerability in North West Province, South Africa. Journal of Southern African Studies 28(3): Frayne, Bruce Migration and Urban Survival Strategies in Windhoek, Namibia. Geoforum 35(4): Frayne, Bruce Survival of the Poorest: Migration and Food Security in Namibia. Pp in Agropolis: The Social, Political and Environmental Dimensions of Urban Agriculture, edited by Luc J A Mougeot. Sterling, VA: Earthscan. Fryer, David, and Desire Vencatachellum Returns to Education in South Africa: Evidence from the Machibisa Township. African Development Review 17(3): Garenne, Michel L., Stephen M. Tollman, Mark A. Collinson, and Kathleen Kahn Fertility Trends and Net Reproduction in Agincourt, Rural South Africa, Scandinavian Journal of Public Health 35(69 suppl): Grant, Richard Working It out: Labour Geographies of the Poor in Soweto, South Africa. Development Southern Africa 27(4): Gugler, Josef The Son of the Hawk Does Not Remain Abroad: The Urban-Rural Connection in Africa. African Studies Review 45(1): Hajdu, Flora Relying on Jobs instead of the Environment? Patterns of Local Securities in Rural Eastern Cape, South Africa. Social Dynamics 31(1): Harris, John, and Michael Todaro Migration, Unemployment and Development: A Two- Sector Analysis. The American Economic Review 60(1):
160 Heintz, James, and Dorrit Posel Revisiting Informal Employment and Segmentation in the South African Labour Market. South African Journal of Economics 76(1): Hill, Trevor, Etienne Nel, and Dayle Trotter Small-Scale, Nature-Based Tourism as a pro-poor Development Intervention: Two Examples in Kwazulu-Natal, South Africa. Singapore Journal of Tropical Geography 27(2): Hosegood, Victoria, Nuala McGrath, and Tom Moultrie Dispensing with Marriage: Marital Trends in Rural KwaZulu-Natal, South Africa Demographic Research 20(13): Hosegood, Victoria, and Ian Timaeus Household Composition and Dynamics in KwaZulu Natal, South Africa: Mirroring Social Reality in Longitudinal Data Collection. Retrieved ( u_natal_south_africa_mirroring_social_reality_in_longitudinal_data_collection). Hoynes, Hilary Williamson, and Diane Whitmore Schanzenbach Work Incentives and the Food Stamp Program. Journal of Public Economics 96(1 2): Hussmanns, Ralf Statistical Definition of Informal Employment: Guidelines Endorsed by the Seventeenth International Conference of Labour Statisticians (2003). Pp. 2 4 in 7th Meeting of the Expert Group on Informal Sector Statistics (Delhi Group). Retrieved April 29, 2014 ( Jacob, Brian A., and Jens Ludwig The Effects of Housing Assistance on Labor Supply: Evidence from a Voucher Lottery. American Economic Review 102(1): Jensen, Robert T Do Private Transfers `displace the Benefits of Public Transfers? Evidence from South Africa. Journal of Public Economics 88(1-2):
161 Johnston, Deborah Who Needs Immigrant Farm Workers? A South African Case Study. Journal of Agrarian Change 7(4): Kahn, Kathleen et al Research into Health, Population and Social Transitions in Rural South Africa: Data and Methods of the Agincourt Health and Demographic Surveillance System. Scandinavian Journal of Public Health 35:8 20. Kiefer, Nicholas, and George Neumann Empirical Job-Search Model, with a Test of the Constant Reservation-Wage Hypothesis. Journal of Political Economy 87(1): Kingdon, Geeta, and John Knight The Measurement of Unemployment When Unemployment Is High. Labour Economics 13(3): Klasen, Stephan, and Ingrid Woolard Surviving Unemployment Without State Support: Unemployment and Household Formation in South Africa. Journal of African Economies 18(1):1 51. Kraak, Andre. 2008a. Incoherence in the South African Labour Market for Intermediate Skills. Journal of Education and Work 21(3): Kraak, Andre. 2008b. The Education-Economy Relationship in South Africa, Pp in Human Resources Development Review: Education, Employment and Skills in South Africa, edited by Andre Kraak and Karen Press. Cape Town: HSRC Press. Kuhn, Randall, and Steven Stillman Understanding Interhousehold Transfers in a Transition Economy: Evidence from Russia. Economic Development and Cultural Change 53(1): Lam, David Generating Extreme Inequality: Schooling, Earnings, and Intergenerational Transmission of Human Capital in South Africa and Brazil. Research Report. University of Michigan: Population Studies Center. Retrieved April 15,
162 ( ). Langevang, Thilde, and Katherine Gough Surviving through Movement: The Mobility of Urban Youth in Ghana. Social & Cultural Geography 10(7): Legassick, Martin Legislation, Ideology and Economy in Post-1948 South Africa. Journal of Southern African Studies 1(1):5 35. Lewis, Jeffrey Policies to Promote Growth and Employment in South Africa. World Bank, Southern Africa Department. Lipton, Merle Independent Bantustans? International Affairs (Royal Institute of International Affairs 1944-) 48(1):1 19. Lucas, Robert, and Oded Stark Motivations to Remit: Evidence from Botswana. The Journal of Political Economy 93(5): Madhavan, Sangeetha, and Enid J. Schatz Coping with Change: Household Structure and Composition in Rural South Africa, Scandinavian Journal of Public Health 35: Madhavan, Sangeetha, Nicholas Townsend, and Anita Garey Absent Breadwinners : Father-Child Connections and Paternal Support in Rural South Africa. Journal of Southern African Studies 34(3): Maloka, Tshidiso Mines and Labour Migrants in Southern Africa. Journal of Historical Sociology 10(2): Massey, Douglas S Social Structure, Household Strategies, and the Cumulative Causation of Migration. Population Index 56(1):
163 Massey, Douglas S., and Kristin E. Espinosa What s Driving Mexican-US Migration? A Theoretical, Empirical, and Policy Analysis. American Journal of Sociology 102(4): Maylam, Paul The Rise and Decline of Urban Apartheid in South Africa. African Affairs 89(354): McKenzie, David, and Hillel Rapoport Self-Selection Patterns in Mexico-U.S. Migration: The Role of Migration Networks. Review of Economics and Statistics 92(4): McKenzie, David, Steven Stillman, and John Gibson How Important Is Selection? Experimental VS. Non Experimental Measures of the Income Gains from Migration. Journal of the European Economic Association 8(4): Mendola, Mariapia Rural out-migration and Economic Development at Origin: A Review of the Evidence. Journal of International Development 24(1): Morawczynski, Olga Surviving in the Dual System : How M-PESA Is Fostering Urbanto-Rural Remittances in a Kenyan Slum. in Towards an ICT Research Agenda for African Development. University of Pretoria, South Africa: International Federation for Information Processing. Morris, C. N., D. R. Burdge, and E. J. Cheevers Economic Impact of HIV Infection in a Cohort of Male Sugar Mill Workers in South Africa. South African Journal of Economics 68(5): Muller, Colette, and Jeanne Esselar Documenting the Informalisation of Working South Africa: Evidence from National Household Surveys, Journal of Interdisciplinary Economics 15:
164 Murray, Martin Taming the Disorderly City: The Spatial Landscape of Johannesburg after Apartheid. Cornell Univ Press. Nattrass, Jill Migrant Labour and South African Economic Development. South African Journal of Economics 44(1): Niehaus, Isak, Eliazaar Mohlala, and Kally Shokane Witchcraft, Power, and Politics: Exploring the Occult in the South African Lowveld. Pluto Press. Oosthuizen, Morne, and Pranushka Naidoo Internal Migration to the Gauteng Province. Retrieved ( Pampel, Fred C Diffusion, Cohort Change, and Social Patterns of Smoking. Social Science Research 34(1): Paumgarten, Fi, and Charlie M. Shackleton Wealth Differentiation in Household Use and Trade in Non-Timber Forest Products in South Africa. Ecological Economics 68(12): Pons-Vignon, Nicolas, and Ward Anseeuw Great Expectations: Working Conditions in South Africa since the End of Apartheid. Journal of Southern African Studies 35(4): Posel, Dorrit, and Daniela Casale What Has Been Happening to Internal Labour Migration in South Africa, ? South African Journal of Economics 71(3): Posel, Dorrit, James A. Fairburn, and Frances Lund Labour Migration and Households: A Reconsideration of the Effects of the Social Pension on Labour Supply in South Africa. Economic Modelling 23(5):
165 Potts, Deborah Worker-Peasants and Farmer-Housewives in Africa: The Debate about Committed Farmers, Access to Land and Agricultural Production. Journal of Southern African Studies 26(4): Reed, Holly Moving Across Boundaries: Migration in South Africa, Demography 50(1), Republic of South Africa Old Age Pension. Retrieved March 18, 2014 ( agegrant/en_za#standard). Rivett-Carnac, Kate Local Economic Development, Industrial Policy and Sustainable Development in South Africa: A Critical Reflection on Three New Policy Frameworks. Master s Thesis, Stellenbosh, South Africa: University of Stellenbosch. Rodriguez-Pose, Andres, and Sylvia Tijmstra Local Economic Development as an Alternative Approach to Economic Development in Sub-Saharan Africa. World Bank. Rodrik, Dani Understanding South Africa s Economic Puzzles. Economics of Transition 16(4): Rogers, Andrei, Richard Raquillet, and Luis J. Castro Model Migration Schedules and Their Applications. Environment and Planning A 10(5): Rogers, Barbara Divide & Rule: South Africa s Bantustans. Kent, UK: Bishop & Sons. Rogerson, Christian Pro-Poor Local Economic Development in South Africa: The Role of pro-poor Tourism. Local Environment 11(1): Saayman, Melville, and Andrea Saayman Regional Development and National Parks in South Africa: Lessons Learned. Tourism Economics 16(4):
166 Savage, Michael The Imposition of Pass Laws on the African Population in South Africa African Affairs 85(339): Schatz, Enid J `Taking Care of My Own Blood : Older Women s Relationships to Their Households in Rural South Africa. Scandinavian Journal of Public Health 35(69 suppl): Schatz, Enid, and Catherine Ogunmefun Caring and Contributing: The Role of Older Women in Rural South African Multi-Generational Households in the HIV/AIDS Era. World Development 35(8): Seidman, Gay Is South Africa Different? Sociological Comparisons and Theoretical Contributions from the Land of Apartheid. Annual Review of Sociology Sennott Winchester, Christie Modern Desires: Family Formation Patterns in the Context of HIV/AIDS in Post-Apartheid Rural South Africa. Doctoral Dissertation, Boulder, Colorado: University of Colorado at Boulder. Shackleton, Charlie, Cathy Dzerefos, Sheona Shackleton, and F. R. Mathabela The Use of and Trade in Indigenous Edible Fruits in the Bushbuckridge Savanna Region, South Africa. Ecology of Food and Nutrition 39(3): Shackleton, Charlie, and Sheona Shackleton The Importance of Non-Timber Forest Products in Rural Livelihood Security and as Safety Nets: A Review of Evidence from South Africa. South African Journal of Science 100(11 & 12): Shackleton, Charlie, Sheona Shackleton, M. Ntshudu, and J. Ntzebeza The Role and Value of Savanna Non-Timber Forest Products to Rural Households in the Kat River Valley, South Africa. Journal of Tropical Forest Products 8(1):
167 Shackleton, Sheona A Situation Analysis of the Woodcraft Industry in the Bushbuckridge District of the Eastern Transvaal, with Particular Reference to Resource Use. Unpublished Report. Wits Rural Facility, Acornhoek. Shackleton, Sheona, and Bruce Campbell The Traditional Broom Trade in Bushbuckridge, South Africa: Helping Poor Women Cope with Adversity. Economic Botany 61(3): Shackleton, Sheona, and Conrad Steenkamp The Woodcraft Industry in the Mpumalanga-Limpopo Province Lowveld. Pp in Indigenous Forests and Woodlands in South Africa: Policy, People and Practice, edited by Michael Lawes, Harriet Eeley, Charlie Shackleton, and Bev Geach. Pietermaritzburg, South Africa: University of KwaZulu-Natal Press. De Sherbinin, Alex et al Rural Household Demographics, Livelihoods and the Environment. Global Environmental Change-Human and Policy Dimensions 18(1): Shimer, Robert, and Iván Werning Reservation Wages and Unemployment Insurance. The Quarterly Journal of Economics 122(3): Smith, David M The Apartheid City and Beyond: Urbanization and Social Change in South Africa. New York: Routledge. Smith, Lothar, and Paul Hebinck Mobility and Population Dynamics. Pp in Livelihoods and Landscapes: The People of Guquka and Koloni and their Resources, edited by Paul Hebinck and Peter Lent. Leiden, The Netherlands: Brill. Stark, Oded, and Robert Lucas Migration, Remittances, and the Family. Economic Development and Cultural Change 36(3):
168 Statistics South Africa (StatsSA) Survey of Employment and Earnings in Selected Industries (P0271). Republic of South Africa, Pretoria. Statistics South Africa (StatsSA) Census: How the Count Was Done. Pretoria, Republic of South Africa, Pretoria. Statistics South Africa (StatsSA). 2008a. Community Survey 2007 (Population Information). Republic of South Africa, Pretoria. Retrieved March 29, 2014 ( ive.statssa.gov.za%3a8282%2fobj%2ffstudy%2fcs2007_persons&format=html&mod e=transform). Statistics South Africa (StatsSA). 2008b. Labour Force Survey: Historical Revision March Series 2001 to Republic of South Africa, Pretoria.. Statistics South Africa (StatsSA). 2008c. Labour Force Survey: Historical Revision, March Series, 2001 to 2007 (P0201). Republic of South Africa, Pretoria. Statistics South Africa (StatsSA). 2008d. Quarterly Labour Force Survey: Additional Aspects of the Labour Market in South Africa. Informal Employment; Underemployment and Underutilised Labour; Unemployment. (P0211.1). Republic of South Africa, Pretoria. Statistics South Africa (StatsSA) Labour Market Dynamics in South Africa Republic of South Africa, Pretoria. Statistics South Africa (StatsSA) Guide to the Quarterly Labour Force Survey: August Republic of South Africa, Pretoria. Retrieved ( 151
169 Statistics South Africa (StatsSA). 2014a. Agriculture as a Household Activity. Republic of South Africa, Pretoria. Retrieved April 20, 2014 ( Statistics South Africa (StatsSA). 2014b. Bushbuckridge Key Statistics. Republic of South Africa, Pretoria. Retrieved March 7, 2014 ( Statistics South Africa (StatsSA). 2014c. Unemployment. Republic of South Africa, Pretoria. Retrieved April 20, 2014 ( Surender, Rebecca, Michael Noble, Gemma Wright, and Phakama Ntshongwana Social Assistance and Dependency in South Africa: An Analysis of Attitudes to Paid Work and Social Grants. Journal of Social Policy 39(02): Swanson, Maynard W Urban Origins of Separate Development. Race & Class 10(1): Tanser, Frank et al Cohort Profile: Africa Centre Demographic Information System (ACDIS) and Population-Based HIV Survey. International Journal of Epidemiology 37(5): Terreblanche, Solomon Johannes A History of Inequality in South Africa, Pietermartizburg, South Africa: University of Natal Press. Theron, Jan Employment Is Not What It Used to Be. Industrial Law Journal 24:1247. Tomlinson, F. R Summary of the Report of the Commission for the Socio-Economic Development of the Bantu Areas Within the Union of South Africa. South Africa Commission for the Socio-Economic Development of the Bantu Areas. 152
170 Townsend, Nicholas Men, Migration, and Households in Botswana: An Exploration of Connections over Time and Space. Journal of Southern African Studies 23(3): Tregenna, F The Contributions of Manufacturing and Services to Employment Creation and Growth in South Africa. South African Journal of Economics 76:S175 S204. United Nations Educational, Scientific, and Cultural Organization (UNESCO). n.d. The Homelands in South Africa during Apartheid. Retrieved April 20, 2014 ( teile/homelands.htm). United Nations Office for the Coordination of Humanitarian Affairs (OCHA) Distribution of Migrants in South Africa by District Municipality in 2001 and Retrieved March 28, 2014 ( nal_migrants_2001_2007_2.pdf). Valodia, Imraan, Likani Lebani, Caroline Skinner, and Richard Devey Low-Waged and Informal Employment in South Africa. Transformation: Critical Perspectives on Southern Africa 60: Wagner, Glenn, Gery Ryan, Alexis Huynh, Cissy Kityo, and Peter Mugyenyi A Qualitative Analysis of the Economic Impact of HIV and Antiretroviral Therapy on Individuals and Households in Uganda. AIDS Patient Care and STDs 23(9): Webster, Eddie, and K. Von Holdt, eds Beyond the Apartheid Workplace: Studies in Transition. Scottsville, South Africa: University of KwaZulu-Natal Press. 153
171 Williams, Jill, Gayatri Singh, Benjamin Clark, and Mark Collinson Redefining Migration: Gender and Temporary Labor Migration in South Africa. New Orleans, LA: PAA. Wolpe, Harold Capitalism and Cheap Labour-Power in South Africa: From Segregation to Apartheid 1. Economy and Society 1(4): Woolard, Ingrid, and Stephan Klasen Determinants of Income Mobility and Household Poverty Dynamics in South Africa. Journal of Development Studies 41: Young, Lorraine, and Nicola Ansell Fluid Households, Complex Families: The Impacts of Children s Migration as a Response to HIV/AIDS in Southern Africa. The Professional Geographer 55(4):
172 APPENDIX 1. THE AGINCOURT HEALTH AND DEMOGRAPHIC SURVEILLANCE SYSTEM: CENSUS DEFINITIONS, SURVEY INSTRUMENTS, AND VARIABLE RECODES AGINCOURT DHSS DEFINITIONS These definitions are provided verbatim from the definitions provided by the Agincourt HDSS data website (Agincourt HDSS 2013b). Households: A group of people who reside and eat together, plus the linked temporary migrants who would eat with them on return. This is a de jure household definition because it is more closely related to links of responsibility within the household, as opposed to a de facto household definition which more closely matches the co-residential household, as used in the national census. One implication of the Agincourt definition in data collection is that when a field worker encounters a permanent out-migrant this person becomes removed from the household resident list, whereas a temporary migrant is retained on the household list. Permanent Migrant: A person who enters or leaves a household with a permanent intention of entering or leaving. This definition closely follows the classic definition that migrants are people who experience a change in residence. This includes people who leave the index household and establish a household or join a household elsewhere. A key feature is that the destination household becomes the new home base for the migrant. The main reasons given in the Health and Demographic Surveillance System for permanent migration are: union formation or dissolution ; to live with another and new dwelling for household. A permanent migrant is either in- or out-migrated. An out-migrant is removed from a household (i.e. a social group) and a dwelling (i.e. the physical 155
173 infrastructure), and an in-migrant is moved into a household and dwelling. Technically, a migrant is added or removed from a household by starting or ending a membership episode in the household, and simultaneously starting or ending a residence episode at the dwelling. The salient details of the migration event, e.g. date of move, origin or destination, are captured and stored in the migration table. Temporary Migration: A status based on resident months status which records the amount of time each person is physically present in the household during the year preceding the census interview. The fieldworker hears the account of a person s residence pattern and adds the residence episodes together, rounds this up to a whole number and records this as the number of months that a person was present in the previous year. This variable, i.e. resident months has been updated in successive census rounds in 1992, 1995, 1997, 1999, and annually since then. Based on the resident months variable a fieldworker also records a residence status variable. This is derived from resident months but contains slightly more information. Resident status has four categories, namely, Local resident, if resident months is between six and twelve months; Temporary Migrant, if resident months is less than six and the reason for absence is work-related; Other Temporary Migrant if resident months is less than six and the reason is not work-related; lastly, a Visitor is if a person was present at the census but should not be considered part of the household. A child born or in-migrated in the year prior to the census is considered a local resident if the household informant considered their residence to be permanent despite the number of resident months. SCHOOL ENROLLMENT The labor force status module includes a single variable that indicates that the individual is a student or a pensioner. Based on the module working and field guide, this measure should be independent of one s employment status. However, less than one percent of the individuals who are indicated as being students or pensioners have employment information. Figure A1.1 shows 156
174 the percentage of young adults attending school. Years 2000, 2004, and 2008 are calculated from the Labour Force Survey, and 2006 and 2009 are calculated based on the education module data. Graphically, I do not see any noticeable bias in the reporting of school enrollment. As such, I suspect that employment of students, probably informal as it occurs within Agincourt, goes unreported. As such, I typically exclude students from analyses. I do not exclude students from the female labor migration models in Chapter 5 because I narrow the sample to respondents 20 years old and older. Figure A1.1. Percent enrolled in school in Agincourt, by year 157
175 LABOUR FORCE STATUS MODULE The AHDSS defines work in the following way: Work is an activity that brings resources into the household from outside the household. Subsistence farming and home domestic work are therefore excluded from the work category, because they do not bring resources into the household from outside. Work can therefore be seen roughly as work for pay, although this must include all forms of informal selling and home-based production. Selling is definitely a type of work (code 18). Informal work includes the popular activities of making or growing food or other object of value, also buying and selling goods for profit. (Agincourt HDSS 2013a). Figure A1.2. AHDSS Labour Force Status Module: Response options for reasons not working. Not In Labor Force Labor Force Economically Inactive Unemployed Employed D=Disabled F=Subsistence farmer H=Home domestic S=Student V=Volunteer O=Other (specify) Q=Query X=Unknown B=Between occasional work C=Between contracts L=Looking N=Not looking '-'=Not applicable 158
176 Figure A1.3. AHDSS Labour Force Status Module: Response options for the questions used to designate informal employment Is the employment or business taxed? N=No Q=Query X=Unknown Y=Yes Period of Employment F=Fixed period O=Occasional P=Permanent Q=Query X=Unknown The employer providing work A=Self employed B=Employer C=Employee CD=Employee in family bus D=Family business E=Cooperative Q=Query X=Unknown Formal employment is defined as employment that is taxed, where the employer providing work is C=Employee and where the period of employed is P=Permanent. 159
177 Figure A1.4. Recoding procedures for work locations AHDSS Labour Force Status Module: Response options for work locations 0=Field site village 1=BBR village; Bushbuckridge village 2=BBR town; Bushbuckridge town 3=Other NP; Other Northern Province 4=Other MP; Other Mpumalanga place 5=N4 Road; Towns along N4 road 6=Gauteng 7=Mozambique 8=Other province; Other South African province 9=Other country Q=Query X=Unknown Specified work locations were cleaned manually for typographical and spelling errors. Game reserve locations were identified by a string search for the words camp, lodge, knp, kruger national park, game park, reserve and sabi sand. Gauteng was identified by work locations identified as Gauteng, Johannesburg, Germiston, Kempton Park, Pretoria, and Springs. In addition, a primary place code of 6 was used to determine Gauteng as a work location. Other Bushbuckridge, Other Limpopo, and Other Mpumalanga were identified for locations that were not identified specifically or other infrequent locations. Other cases are identified by the primary place code. Note that these locations are derived from the cleaning of text descriptions of location names and carry the inaccuracies of excluding unidentifiable locations and differing levels of specificity provided in the textual names. For example, the location of labor migrants working in Germiston, a suburb of Johannesburg, may be identified as working in Germiston, Johannesburg, or Gauteng. Moreover, the employment characteristics of labor migrants are likely to be reported by proxy. 160
178 Figure A1.5. Recoding procedures for employment sector AHDSS Labour Force Status Module: Response options for employment sector A=Agriculture C=CBO F=Manufacturing G=Game reserve M=Mining N=NGO/University O=Other (specify) P=Private service Q=Query R=Retail S=Government service U=Construction X=Unknown AHDSS Labour Force Status Module: Response options for work categories 1=Farm work 2=Domestic work 3=Construction work 4=Security work 5=Cleaning work 6=Small business owner 7=Mine work 8=Teacher 9=Traditional healer 10=Health sector (formal) 11=Game farm 12=Driver 13=Skilled worker 14=Cook/ chef/ catering 15=Unskilled worker 16=Artisan 17=Waiter/ barman 18=Informal selling 19=Small business assistant 20=Clerical and office work 21=Cattle herder 22=Sewing, hairdressing, baking, brewing 23=Police, soldier, fireman 24=Petrol attendant 25=Timber, sawmill, poles 26=Gardening services 27=Fieldworker - NGO 28=Art, craft, photography, fashion design 29=Senior Administrator, manager, professional 30=Priest 31=Traditional Healer 32=Unknown 33=Not working I have recoded a profession category out of primary employment sectors and a 32-category description of the type of work. Unfortunately, some categories are vaguely defined within the labor survey. For example, the 32-cateogry measure allows for respondents to describe the employment as small business owner, skilled worker, and unskilled worker. These designations offer little insight into individuals professions. Where possible, individuals professions have been recoded into the most refined category. However, the following categories are difficult to interpret as professions. In addition, professions not available to those within the AHDSS have been combined with the Other category. 161
179 Figure A1.6. Recoding procedures for occupation 1. Cleaning / Domestic Work Work category 2 Work category 5 2. Construction Work category 3 3. Selling Sector 8 and work category 6 Sector 8 and work category 19 Work category 18 Work Category Craft / Artisan Work category 28 Work category Fieldworker Work category Agricultural Services Work category 1 Work category 21 Work category 25 Work category Teacher Work category 8 8. Office Work / Management Work category 20 Work category Formal / Informal Health Work category 9 Work category Food service Work category 14 Work category Security Work Work category Sewing, hairdressing, baking, brewing Work category Small Business - Non-retail Work category 6 and sector not retail Work category 19 and sector not retail 14. Driver Work category Other Work category 7 Work category 11 Work category 23 Work category 30 Work category Undefined Worker Work category 13 Work category Unknown Work category
180 EDUCATIONAL ATTAINMENT Table A1.1. Median years of education (percent of individuals with education higher than the median), by age, sex, and year Year Male Age: (48%) 8 (32%) 8 (36%) 8 (43%) 8 (46%) 8 (47%) 9 (30%) 9 (33%) 9 (33%) 9 (36%) (38%) 10 (41%) 10 (44%) 10 (45%) 10 (46%) 10 (48%) 11 (36%) 11 (30%) 11 (35%) 11 (43%) (39%) 11 (40%) 11 (43%) 11 (41%) 11 (44%) 11 (44%) 11 (47%) 11 (46%) 11 (46%) 11 (48%) (50%) 9 (49%) 10 (47%) 10 (48%) 11 (44%) 11 (45%) 11 (47%) 11 (45%) 11 (44%) 11 (47%) (49%) 6 (50%) 7 (46%) 8 (46%) 8 (48%) 9 (47%) 10 (45%) 10 (47%) 10 (49%) 11 (44%) (44%) 5 (49%) 6 (44%) 6 (47%) 6 (49%) 7 (45%) 7 (45%) 7 (49%) 8 (48%) 9 (46%) (47%) 3 (49%) 4 (44%) 4 (48%) 5 (47%) 5 (50%) 6 (48%) 6 (49%) 6 (49%) 7 (44%) Female Age: (39%) 8 (40%) 8 (46%) 9 (29%) 9 (33%) 9 (36%) 9 (39%) 9 (42%) 9 (42%) 9 (44%) (39%) 10 (40%) 10 (41%) 10 (42%) 10 (45%) 10 (50%) 11 (34%) 11 (32%) 11 (36%) 11 (43%) (46%) 10 (47%) 10 (49%) 10 (48%) 10 (50%) 11 (37%) 11 (38%) 11 (38%) 11 (39%) 11 (42%) (46%) 9 (45%) 9 (47%) 9 (50%) 10 (47%) 10 (49%) 11 (39%) 11 (37%) 11 (37%) 11 (40%) (43%) 6 (45%) 6 (48%) 7 (45%) 7 (48%) 8 (48%) 9 (48%) 9 (49%) 10 (44%) 10 (48%) (44%) 4 (46%) 4 (49%) 5 (45%) 5 (50%) 6 (47%) 6 (48%) 7 (44%) 7 (46%) 8 (47%) (49%) 2 (47%) 2 (48%) 3 (44%) 3 (48%) 4 (46%) 4 (49%) 5 (44%) 5 (48%) 6 (45%) ELDERLY PENSION MEASURES In addition to students, the pension-student variable offers a direct measurement of pension receipt within the household. Figures A1.2 and A1.3 show the percentage of individuals receiving a pension based on this variable by age. The solid bars mark the point in which people are age-qualified. Overall, the graphs show that the receipt of the pension increases between 2000 and 2008 for Mozambicans. The graphs also show a non-negligible number of individuals younger than the qualifying age receiving a pension. This is likely due to the inaccurate reporting of age. The determination of age is more suspect among older individuals due to the estimation of birth dates by household respondents. For this reason, I have limited the upward age range in most of the analyses. 163
181 Figure A1.7. Percentage of age-eligible women receiving the pension Figure A1.8. Percentage of age-eligible men receiving the pension 164
182 APPENDIX 2. ADDITIONAL TABLES AND FIGURES Table A2.1. Labor migration rates per 1000, by sex and age group Year Male Total Female Total
183 Table A2.2. Employment rates of Agincourt HDSS in 2000, by de facto - de jure population Male Female Male Female Male Female Male Female Male Female Male Female Male Female Male Female N Rates per 1000 Labor Migration Rate Standard Error Low 95% CI High 95% CI Labor Force Participation Rate Standard Error Low 95% CI High 95% CI Rate Standard Error Low 95% CI High 95% CI Unemployment Rate Standard Error Low 95% CI High 95% CI Rate Standard Error Low 95% CI High 95% CI Employment Rate Standard Error Low 95% CI High 95% CI Rate Standard Error Low 95% CI High 95% CI De Jure De Jure De facto De Jure De facto De Jure De facto
184 Table A2.3. Employment rates of Agincourt HDSS in 2004, by de facto - de jure population Male Female Male Female Male Female Male Female Male Female Male Female Male Female Male Female N Rates per 1000 Labor Migration Rate Standard Error Low 95% CI High 95% CI Labor Force Participation Rate Standard Error Low 95% CI High 95% CI Rate Standard Error Low 95% CI High 95% CI Unemployment Rate Standard Error Low 95% CI High 95% CI Rate Standard Error Low 95% CI High 95% CI Employment Rate Standard Error Low 95% CI High 95% CI Rate Standard Error Low 95% CI High 95% CI De Jure De Jure De facto De Jure De facto De Jure De facto
185 Table A2.4. Employment rates of Agincourt HDSS in 2008, by de facto - de jure population Male Female Male Female Male Female Male Female Male Female Male Female Male Female Male Female N Rates per 1000 Labor Migration Rate Standard Error Low 95% CI High 95% CI Labor Force Participation Rate Standard Error Low 95% CI High 95% CI Rate Standard Error Low 95% CI High 95% CI Unemployment Rate Standard Error Low 95% CI High 95% CI Rate Standard Error Low 95% CI High 95% CI Employment Rate Standard Error Low 95% CI High 95% CI Rate Standard Error Low 95% CI High 95% CI De facto De Jure De facto De Jure De facto De Jure De Jure
186 Table A2.5. Employment rates of Agincourt HDSS in 2000, by educational attainment Male Female Male Female Male Female Male Female Male Female Male Female Male Female Male Female N Median Education Rates Per 1000 Labor Migration Rate Standard Error Low 95% CI High 95% CI Rate Standard Error Low 95% CI High 95% CI Labor Force Participation Rate Standard Error Low 95% CI High 95% CI Rate Standard Error Low 95% CI High 95% CI Unemployment Rate Standard Error Low 95% CI High 95% CI Rate Standard Error Low 95% CI High 95% CI Employment Rate Standard Error Low 95% CI High 95% CI Rate Standard Error Low 95% CI High 95% CI Low Edu High Edu Low Edu High Edu Low Edu High Edu Low Edu High Edu
187 Table A2.6. Employment rates of Agincourt HDSS in 2004, by educational attainment Male Female Male Female Male Female Male Female Male Female Male Female Male Female Male Female N Median Education Rates Per 1000 Labor Migration Rate Standard Error Low 95% CI High 95% CI Rate Standard Error Low 95% CI High 95% CI Labor Force Participation Rate Standard Error Low 95% CI High 95% CI Rate Standard Error Low 95% CI High 95% CI Unemployment Rate Standard Error Low 95% CI High 95% CI Rate Standard Error Low 95% CI High 95% CI Employment Rate Standard Error Low 95% CI High 95% CI Rate Standard Error Low 95% CI High 95% CI Low Edu High Edu Low Edu High Edu Low Edu High Edu Low Edu High Edu
188 Table A2.7. Employment rates of Agincourt HDSS in 2008, by educational attainment Male Female Male Female Male Female Male Female Male Female Male Female Male Female Male Female N Median Education Rates Per 1000 Labor Migration Rate Standard Error Low 95% CI High 95% CI Rate Standard Error Low 95% CI High 95% CI Labor Force Participation Rate Standard Error Low 95% CI High 95% CI Rate Standard Error Low 95% CI High 95% CI Unemployment Rate Standard Error Low 95% CI High 95% CI Rate Standard Error Low 95% CI High 95% CI Employment Rate Standard Error Low 95% CI High 95% CI Rate Standard Error Low 95% CI High 95% CI Low Edu High Edu Low Edu High Edu Low Edu High Edu Low Edu High Edu
189 Table A2.8. Percent of Agincourt HDSS workers working in taxed employment, as employees, and on a permanent basis, by profession and employment location Within AHDSS Outside of AHDSS % Taxed % Employees % Longterm % Taxed % Employees % Longterm N N Male 1. Cleaning / Domestic Work Construction Selling Craft / Artisan Fieldworker Agricultural Services Teacher Office Work / Management Formal / Informal Health Food service Security Work Sewing, hairdressing, baking, brewing Small Business - Non-retail Driver Other Female 1. Cleaning / Domestic Work Construction Selling Craft / Artisan Fieldworker Agricultural Services Teacher Office Work / Management Formal / Informal Health Food service Security Work Sewing, hairdressing, baking, brewing Small Business - Non-retail Driver Other Informal employment defined according to the standard employment relationship as those working who are employees, have taxed employment, and work on a permanent basis. 2 Other category includes those who have undescriptive job titles, engage in employment found only outside of the Agincourt HDSS, or are unknown. 172
190 Table A2.9. Annual unemployment rates and employment to population ratios, by sex and age group Unemployment Rate Employment to Population Rate Female Male Female Male Rate Std. Rate Rate Std. Rate Ratio Std. Ratio Ratio Std. Ratio Ages Mean S.D Ages Mean S.D Ages Mean S.D
191 Table A2.9 continued. Annual unemployment rates and employment to population ratios, by sex and age group Unemployment Rate Employment to Population Rate Female Male Female Male Rate Std. Rate Rate Std. Rate Ratio Std. Ratio Ratio Std. Ratio Ages Mean S.D Ages Mean S.D Ages Mean S.D
192 Table A2.10. Unemployed labor migrants per 1000 labor migrants, by year Number Labor Migrants Unemployed / 1000 Labor Migrants Male 6,497 7,063 9, By age categories , , ,258 1,683 2, ,189 1,317 1, ,060 1, , Female 3,012 2,706 3, By Age Categories


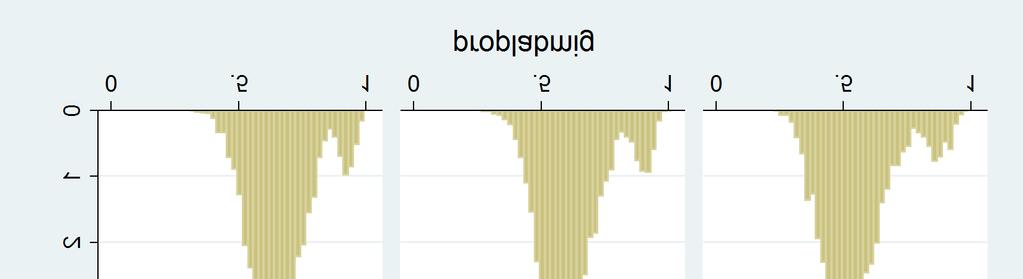
193 Figure A2.1. Distribution of fitted labor migrant probabilities in 2000, 2004, and 2008 for women aged 20-49, by 5-year age group Figure A2.2. Distribution of fitted labor migrant probabilities in 2000, 2004, and 2008 for men aged 20-49, by 5-year age group 176
Redefining Migration: Gender and Temporary Labor Migration in South Africa*
 Redefining Migration: Gender and Temporary Labor Migration in South Africa* March 7, 2008 Jill Williams, University of Colorado, Boulder Gayatri Singh, Brown University Benjamin Clark, University of the
Chapter VI. Labor Migration
 90 Chapter VI. Labor Migration Especially during the 1990s, labor migration had a major impact on labor supply in Armenia. It may involve a brain drain or the emigration of better-educated, higherskilled
What has been happening to Internal Labour Migration in South Africa, ?
 What has been happening to Internal Labour Migration in South Africa, 1993-1999? Dorrit Posel Division of Economics, University of Natal, Durban posel@nu.ac.za Daniela Casale Division of Economics, University
Gender, labour and a just transition towards environmentally sustainable economies and societies for all
 Response to the UNFCCC Secretariat call for submission on: Views on possible elements of the gender action plan to be developed under the Lima work programme on gender Gender, labour and a just transition
% of Total Population
 12 2. SOCIO-ECONOMIC ANALYSIS 2.1 POPULATION The Water Services Development Plan: Demographic Report (October December 2000, WSDP) provides a detailed breakdown of population per settlement area for the
POPULATION STUDIES RESEARCH BRIEF ISSUE Number
 POPULATION STUDIES RESEARCH BRIEF ISSUE Number 2008021 School for Social and Policy Research 2008 Population Studies Group School for Social and Policy Research Charles Darwin University Northern Territory
Roles of children and elderly in migration decision of adults: case from rural China
 Roles of children and elderly in migration decision of adults: case from rural China Extended abstract: Urbanization has been taking place in many of today s developing countries, with surging rural-urban
Migration and remittances in South Africa
 Migration and remittances in South Africa Background document on migration and first set of draft questions for inclusion in the National Income Dynamics Study Daniela Casale and Dori Posel University
EMPLOYMENT AND POPULATION ADJUSTMENT IN RURAL AUSTRALIA. Anne Margaret Garnett
 EMPLOYMENT AND POPULATION ADJUSTMENT IN RURAL AUSTRALIA Anne Margaret Garnett A thesis submitted for the degree of Doctor of Philosophy The University of Canberra Canberra April 2007 ABSTRACT Rural regions
Unequal Recovery, Labor Market Polarization, Race, and 2016 U.S. Presidential Election. Maoyong Fan and Anita Alves Pena 1
 Unequal Recovery, Labor Market Polarization, Race, and 2016 U.S. Presidential Election Maoyong Fan and Anita Alves Pena 1 Abstract: Growing income inequality and labor market polarization and increasing
DETERMINANTS OF INTERNAL MIGRATION IN PAKISTAN
 The Journal of Commerce Vol.5, No.3 pp.32-42 DETERMINANTS OF INTERNAL MIGRATION IN PAKISTAN Nisar Ahmad *, Ayesha Akram! and Haroon Hussain # Abstract The migration is a dynamic process and it effects
Online Appendices for Moving to Opportunity
 Online Appendices for Moving to Opportunity Chapter 2 A. Labor mobility costs Table 1: Domestic labor mobility costs with standard errors: 10 sectors Lao PDR Indonesia Vietnam Philippines Agriculture,
Internal Migration to the Gauteng Province
 Internal Migration to the Gauteng Province DPRU Policy Brief Series Development Policy Research Unit University of Cape Town Upper Campus February 2005 ISBN 1-920055-06-1 Copyright University of Cape Town
WORKFORCE ATTRACTION AS A DIMENSION OF REGIONAL COMPETITIVENESS
 RUR AL DE VELOPMENT INSTITUTE WORKFORCE ATTRACTION AS A DIMENSION OF REGIONAL COMPETITIVENESS An Analysis of Migration Across Labour Market Areas June 2017 WORKFORCE ATTRACTION AS A DIMENSION OF REGIONAL
Poverty profile and social protection strategy for the mountainous regions of Western Nepal
 October 2014 Karnali Employment Programme Technical Assistance Poverty profile and social protection strategy for the mountainous regions of Western Nepal Policy Note Introduction This policy note presents
Nalen Naidoo, 1 Murray Leibbrandt 2 and Rob Dorrington 3
 SADemJ (11)1 3 38 Magnitudes, Personal Characteristics and Activities of Eastern Cape Migrants: A Comparison with Other Migrants and with Non-migrants using Data from the 1996 and 2001 Censuses Nalen Naidoo,
Rural and Urban Migrants in India:
 Rural and Urban Migrants in India: 1983-2008 Viktoria Hnatkovska and Amartya Lahiri July 2014 Abstract This paper characterizes the gross and net migration flows between rural and urban areas in India
Executive summary. Strong records of economic growth in the Asia-Pacific region have benefited many workers.
 Executive summary Strong records of economic growth in the Asia-Pacific region have benefited many workers. In many ways, these are exciting times for Asia and the Pacific as a region. Dynamic growth and
Working women have won enormous progress in breaking through long-standing educational and
 THE CURRENT JOB OUTLOOK REGIONAL LABOR REVIEW, Fall 2008 The Gender Pay Gap in New York City and Long Island: 1986 2006 by Bhaswati Sengupta Working women have won enormous progress in breaking through
The Jordanian Labour Market: Multiple segmentations of labour by nationality, gender, education and occupational classes
 The Jordanian Labour Market: Multiple segmentations of labour by nationality, gender, education and occupational classes Regional Office for Arab States Migration and Governance Network (MAGNET) 1 The
Post-Secondary Education, Training and Labour September Profile of the New Brunswick Labour Force
 Post-Secondary Education, Training and Labour September 2018 Profile of the New Brunswick Labour Force Contents Population Trends... 2 Key Labour Force Statistics... 5 New Brunswick Overview... 5 Sub-Regional
Southern Africa Labour and Development Research Unit
 Southern Africa Labour and Development Research Unit Maternal and child migration in post-apartheid South Africa: Evidence from the NIDS panel study by Katharine Hall SALDRU Working Paper Number 178 NIDS
Internal migration determinants in South Africa: Recent evidence from Census RESEP Policy Brief
 Department of Economics, University of Stellenbosch Internal migration determinants in South Africa: Recent evidence from Census 2011 Eldridge Moses* RESEP Policy Brief february 2 017 This policy brief
Rural and Urban Migrants in India:
 Rural and Urban Migrants in India: 1983 2008 Viktoria Hnatkovska and Amartya Lahiri This paper characterizes the gross and net migration flows between rural and urban areas in India during the period 1983
Migration, Poverty & Place in the Context of the Return Migration to the US South
 Migration, Poverty & Place in the Context of the Return Migration to the US South Katherine Curtis Department of Rural Sociology Research assistance from Jack DeWaard and financial support from the UW
and Health Transitions Research Unit (Agincourt), School of Public Health, University of the Witwatersrand, South Africa.
, School of Public Health, University of the Witwatersrand, South Africa.") Children and Migration in South Africa: A case study from a rural, northeastern district (version 2) by Mark Collinson 1 23 March 2008 A scientific report for the Princeton University/ Rockefeller Foundation
Children and Migration in South Africa: A case study from a rural, northeastern district (version 2) by Mark Collinson 1 23 March 2008 A scientific report for the Princeton University/ Rockefeller Foundation
QUANTITATIVE ANALYSIS OF RURAL WORKFORCE RESOURCES IN ROMANIA
 QUANTITATIVE ANALYSIS OF RURAL WORKFORCE RESOURCES IN ROMANIA Elena COFAS University of Agricultural Sciences and Veterinary Medicine of Bucharest, Romania, 59 Marasti, District 1, 011464, Bucharest, Romania,
Characteristics of migrants in Nairobi s informal settlements
 Introduction Characteristics of migrants in Nairobi s informal settlements Rural-urban migration continues to play an important role in the urbanization process in many countries in sub-saharan Africa
Margarita Mooney Assistant Professor University of North Carolina at Chapel Hill Chapel Hill, NC
 Margarita Mooney Assistant Professor University of North Carolina at Chapel Hill Chapel Hill, NC 27517 Email: margarita7@unc.edu Title: Religion, Aging and International Migration: Evidence from the Mexican
Dimensions of rural urban migration
 CHAPTER-6 Dimensions of rural urban migration In the preceding chapter, trends in various streams of migration have been discussed. This chapter examines the various socio-economic and demographic aspects
The Informal Economy: Statistical Data and Research Findings. Country case study: South Africa
 The Informal Economy: Statistical Data and Research Findings Country case study: South Africa Contents 1. Introduction 2. The Informal Economy, National Economy, and Gender 2.1 Description of data sources
5. Destination Consumption
 5. Destination Consumption Enabling migrants propensity to consume Meiyan Wang and Cai Fang Introduction The 2014 Central Economic Working Conference emphasised that China s economy has a new normal, characterised
Volume 35, Issue 1. An examination of the effect of immigration on income inequality: A Gini index approach
 Volume 35, Issue 1 An examination of the effect of immigration on income inequality: A Gini index approach Brian Hibbs Indiana University South Bend Gihoon Hong Indiana University South Bend Abstract This
EMPLOYMENT AND QUALITY OF LIFE IN THE MISSISSIPPI DELTA. A Summary Report from the 2003 Delta Rural Poll
 EMPLOYMENT AND QUALITY OF LIFE IN THE MISSISSIPPI DELTA A Summary Report from the 2003 Delta Rural Poll Alan W. Barton September, 2004 Policy Paper No. 04-02 Center for Community and Economic Development
Remaking the Apartheid City* Presentation of Data: Durban, Draft, May 2007
 Remaking the Apartheid City* Presentation of Data: Durban, 1996-2001 Draft, May 2007 Daniel Schensul, Lead Investigator Ph.D. Candidate Department of Sociology Daniel_Schensul@Brown.edu Patrick Heller,
Economic benefits of gender equality in the EU
 Economic benefits of gender equality in the EU Improving gender equality has many positive impacts on individuals and also on the society at large. A more gender equal EU would have strong, positive GDP
Refugee Versus Economic Immigrant Labor Market Assimilation in the United States: A Case Study of Vietnamese Refugees
 The Park Place Economist Volume 25 Issue 1 Article 19 2017 Refugee Versus Economic Immigrant Labor Market Assimilation in the United States: A Case Study of Vietnamese Refugees Lily Chang Illinois Wesleyan
REMITTANCE TRANSFERS TO ARMENIA: PRELIMINARY SURVEY DATA ANALYSIS
 REMITTANCE TRANSFERS TO ARMENIA: PRELIMINARY SURVEY DATA ANALYSIS microreport# 117 SEPTEMBER 2008 This publication was produced for review by the United States Agency for International Development. It
Rural-to-Urban Labor Migration: A Study of Upper Egyptian Laborers in Cairo
 University of Sussex at Brighton Centre for the Comparative Study of Culture, Development and the Environment (CDE) Rural-to-Urban Labor Migration: A Study of Upper Egyptian Laborers in Cairo by Ayman
MAGNET Migration and Governance Network An initiative of the Swiss Development Cooperation
 International Labour Organization ILO Regional Office for the Arab States MAGNET Migration and Governance Network An initiative of the Swiss Development Cooperation The Kuwaiti Labour Market and Foreign
Intergenerational mobility during South Africa s mineral revolution. Jeanne Cilliers 1 and Johan Fourie 2. RESEP Policy Brief
 Department of Economics, University of Stellenbosch Intergenerational mobility during South Africa s mineral revolution Jeanne Cilliers 1 and Johan Fourie 2 RESEP Policy Brief APRIL 2 017 Funded by: For
Mining Toolkit. In-Migration
 Tool Child Rights and Mining Toolkit Children are the most vulnerable stakeholders regarding mining impacts, including the effects of project-related in-migration. As dependents of migrant mine workers,
Dynamics of Indigenous and Non-Indigenous Labour Markets
 1 AUSTRALIAN JOURNAL OF LABOUR ECONOMICS VOLUME 20 NUMBER 1 2017 Dynamics of Indigenous and Non-Indigenous Labour Markets Boyd Hunter, (Centre for Aboriginal Economic Policy Research,) The Australian National
An overview of migration in the SADC region. Vincent Williams
 An overview of migration in the SADC region Vincent Williams In August 1992, following the start of the process of transition in South Africa, what was formerly the Southern African Development Co-ordination
Regional Disparities in Employment and Human Development in Kenya
 Regional Disparities in Employment and Human Development in Kenya Jacob Omolo 1 jackodhong@yahoo.com; omolo.jacob@ku.ac.ke ABSTRACT What are the regional disparities in employment and human development
The Informal Economy and Sustainable Livelihoods
 The Journal of the helen Suzman Foundation Issue 75 April 2015 The Informal Economy and Sustainable Livelihoods The informal market is often considered to be an entity distinct from the larger South African
Community Well-Being and the Great Recession
 Pathways Spring 2013 3 Community Well-Being and the Great Recession by Ann Owens and Robert J. Sampson The effects of the Great Recession on individuals and workers are well studied. Many reports document
Research Statement. Jeffrey J. Harden. 2 Dissertation Research: The Dimensions of Representation
 Research Statement Jeffrey J. Harden 1 Introduction My research agenda includes work in both quantitative methodology and American politics. In methodology I am broadly interested in developing and evaluating
MIGRATION INTO GAUTENG PROVINCE
 Development Policy Research Unit University of Cape Town Private Bag Rondebosch 7701 Southern African Migration Project Post Net Box 321a Private Bag X30500 Johannesburg 2041 MIGRATION INTO GAUTENG PROVINCE
Did you sleep here last night? The impact of the household definition in sample surveys: a Tanzanian case study.
 Did you sleep here last night? The impact of the household definition in sample surveys: a Tanzanian case study. Tiziana Leone, LSE Ernestina Coast, LSE Sara Randall, UCL Abstract Household sample surveys
Youth labour market overview
 1 Youth labour market overview With 1.35 billion people, China has the largest population in the world and a total working age population of 937 million. For historical and political reasons, full employment
DECENT WORK IN TANZANIA
 International Labour Office DECENT WORK IN TANZANIA What do the Decent Work Indicators tell us? INTRODUCTION Work is central to people's lives, and yet many people work in conditions that are below internationally
Demographic Data. Comprehensive Plan
 Comprehensive Plan 2010-2030 4 Demographic Data Population and demographics have changed over the past several decades in the City of Elwood. It is important to incorporate these shifts into the planning
A Preliminary Snapshot
 The Economic and Social Impact of the Global Crisis in the Philippines: A Preliminary Snapshot Forum on Decent Work and Social Justice in Times of Crisis 22 April 2009 SMX Convention Center Pasay City
Data base on child labour in India: an assessment with respect to nature of data, period and uses
 Public Disclosure Authorized Public Disclosure Authorized Public Disclosure Authorized Public Disclosure Authorized Understanding Children s Work Project Working Paper Series, June 2001 1. 43860 Data base
Migrant mothers and mobile children New possibilities for exploring child poverty dynamics in South Africa
 DRAFT PLEASE DO NOT CITE OR CIRCULATE Migrant mothers and mobile children New possibilities for exploring child poverty dynamics in South Africa Katharine Hall Children s Institute, University of Cape
Background Paper Series. Background Paper 2003: 3. Demographics of South African Households 1995
 Background Paper Series Background Paper 2003: 3 Demographics of South African Households 1995 Elsenburg September 2003 Overview The Provincial Decision-Making Enabling (PROVIDE) Project aims to facilitate
Report. Poverty and Economic Insecurity: Views from City Hall. Phyllis Furdell Michael Perry Tresa Undem. on The State of America s Cities
 Research on The State of America s Cities Poverty and Economic Insecurity: Views from City Hall Phyllis Furdell Michael Perry Tresa Undem For information on these and other research publications, contact:
GLOBALISATION AND WAGE INEQUALITIES,
 GLOBALISATION AND WAGE INEQUALITIES, 1870 1970 IDS WORKING PAPER 73 Edward Anderson SUMMARY This paper studies the impact of globalisation on wage inequality in eight now-developed countries during the
Migration and the Urban Informal Sector in Colombia. Carmen Elisa Flórez
 Migration and the Urban Sector in Colombia Carmen Elisa Flórez Universidad de Los Andes Colombia Abstract: Rural-urban migration has been an important determinant of the urbanization process in Colombia.
Volume Publisher: University of Chicago Press. Volume URL: Chapter URL:
 This PDF is a selection from an out-of-print volume from the National Bureau of Economic Research Volume Title: Wages and Labor Markets in the United States, 1820-1860 Volume Author/Editor: Robert A. Margo
Research Report. How Does Trade Liberalization Affect Racial and Gender Identity in Employment? Evidence from PostApartheid South Africa
 International Affairs Program Research Report How Does Trade Liberalization Affect Racial and Gender Identity in Employment? Evidence from PostApartheid South Africa Report Prepared by Bilge Erten Assistant
STRENGTHENING RURAL CANADA: Fewer & Older: Population and Demographic Challenges Across Rural Canada A Pan-Canadian Report
 STRENGTHENING RURAL CANADA: Fewer & Older: Population and Demographic Challenges Across Rural Canada A Pan-Canadian Report This paper has been prepared for the Strengthening Rural Canada initiative by:
THE IMPACT OF TAXES ON MIGRATION IN NEW HAMPSHIRE
 THE IMPACT OF TAXES ON MIGRATION IN NEW HAMPSHIRE Jeffrey Thompson Political Economy Research Institute University of Massachusetts, Amherst April 211 As New England states continue to struggle with serious
Chapter 8 Migration. 8.1 Definition of Migration
 Chapter 8 Migration 8.1 Definition of Migration Migration is defined as the process of changing residence from one geographical location to another. In combination with fertility and mortality, migration
How to Generate Employment and Attract Investment
 How to Generate Employment and Attract Investment Beatrice Kiraso Director UNECA Subregional Office for Southern Africa 1 1. Introduction The African Economic Outlook (AEO) is an annual publication that
Working paper 20. Distr.: General. 8 April English
 Distr.: General 8 April 2016 Working paper 20 English Economic Commission for Europe Conference of European Statisticians Work Session on Migration Statistics Geneva, Switzerland 18-20 May 2016 Item 8
8AMBER WAVES VOLUME 2 ISSUE 3
 8AMBER WAVES VOLUME 2 ISSUE 3 F E A T U R E William Kandel, USDA/ERS ECONOMIC RESEARCH SERVICE/USDA Rural s Employment and Residential Trends William Kandel wkandel@ers.usda.gov Constance Newman cnewman@ers.usda.gov
Issue Brief: Immigration and Socioeconomic Status
 Elliot Shackelford des2145 Race and Ethnicity in American Politics Issue Brief Final Draft November 30, 2010 Issue Brief: Immigration and Socioeconomic Status Key Words Assimilation, Economic Opportunity,
Heather Randell & Leah VanWey Department of Sociology and Population Studies and Training Center Brown University
 Heather Randell & Leah VanWey Department of Sociology and Population Studies and Training Center Brown University Family Networks and Urban Out-Migration in the Brazilian Amazon Extended Abstract Introduction
The End of Mass Homeownership? Housing Career Diversification and Inequality in Europe R.I.M. Arundel
 The End of Mass Homeownership? Housing Career Diversification and Inequality in Europe R.I.M. Arundel SUMMARY THE END OF MASS HOMEOWNERSHIP? HOUSING CAREER DIVERSIFICATION AND INEQUALITY IN EUROPE Introduction
Magdalena Bonev. University of National and World Economy, Sofia, Bulgaria
 China-USA Business Review, June 2018, Vol. 17, No. 6, 302-307 doi: 10.17265/1537-1514/2018.06.003 D DAVID PUBLISHING Profile of the Bulgarian Emigrant in the International Labour Migration Magdalena Bonev
Provincial Review 2016: Western Cape
 Provincial Review 2016: Western Cape The Western Cape s real economy is dominated by manufacturing and commercial agriculture. As a result, while it did not benefit directly from the commodity boom, it
Contents. Acknowledgements...xii Leading facts and indicators...xiv Acronyms and abbreviations...xvi Map: Pacific region, Marshall Islands...
 Contents Acknowledgements...xii Leading facts and indicators...xiv Acronyms and abbreviations...xvi Map: Pacific region, Marshall Islands... xii CHAPTER 1: CENSUS ORGANIZATION AND OPERATIONS...1 CHAPTER
Sixteenth Meeting of the IMF Committee on Balance of Payments Statistics Washington D.C., December 1 5, 2003
 BOPCOM-03/18 Sixteenth Meeting of the IMF Committee on Balance of Payments Statistics Washington D.C., December 1 5, 2003 The Concept of Residence with Special Reference to the Treatment of Migrant Workers
Labour Market Reform, Rural Migration and Income Inequality in China -- A Dynamic General Equilibrium Analysis
 Labour Market Reform, Rural Migration and Income Inequality in China -- A Dynamic General Equilibrium Analysis Yinhua Mai And Xiujian Peng Centre of Policy Studies Monash University Australia April 2011
Wage and Employment Effects of Minimum Wage Policy in the Indonesian Urban Labor Market
 executive summary Wage and Employment Effects of Minimum Wage Policy in the Indonesian Urban Labor Market A paper from the SMERU Research Institute, with support from USAID/PEG October 2001 The findings,
Lecture 22: Causes of Urbanization
 Slide 1 Lecture 22: Causes of Urbanization CAUSES OF GROWTH OF URBAN POPULATION Urbanization, being a process of population concentration, is caused by all those factors which change the distribution of
LESOTHO'S HOUSEHOLD STRUCTURE: SOME REFLECT!OHS FROM WORKING PAPERS IN DEMOGRAPHY. Working Paper No. 18 November 1990
 70-74 30-3 * M-» 10-24 10-1* 10-1* WWW 00-04 IULCS FEMALES WORKING PAPERS IN DEMOGRAPHY LESOTHO'S HOUSEHOLD STRUCTURE: SOME REFLECT!OHS FROM THE HOUSEHOLD BUDGET SURVEY Tiisetso by Makatjane Working Paper
MIGRATION TRENDS AND HUMAN SETTLEMENTS
 MIGRATION TRENDS AND HUMAN SETTLEMENTS SOME IMPLICATIONS FOR SERVICE CENTRES CATHERINE CROSS, CPEG 27 OCTOBER 2009 ECONOMY AND MIGRATION The economic downturn is now the key driver for migration The world
National Assessments on Gender and Science, Technology and Innovation (STI) Overall Results, Phase One September 2012
 Overall Results, Phase One September 2012") National Assessments on Gender and Science, Technology and Innovation (STI) Scorecard on Gender Equality in the Knowledge Society Overall Results, Phase One September 2012 Overall Results The European
National Assessments on Gender and Science, Technology and Innovation (STI) Scorecard on Gender Equality in the Knowledge Society Overall Results, Phase One September 2012 Overall Results The European
A Profile of the Gauteng Province: Demographics, Poverty, Income, Inequality and Unemployment from 2000 till 2007
 Background Paper Series Background Paper 2009:1(7) A Profile of the Gauteng Province: Demographics, Poverty, Income, Inequality and Unemployment from 2000 till 2007 Elsenburg February 2009 Overview The
II. Roma Poverty and Welfare in Serbia and Montenegro
 II. Poverty and Welfare in Serbia and Montenegro 10. Poverty has many dimensions including income poverty and non-income poverty, with non-income poverty affecting for example an individual s education,
Selected trends in Mexico-United States migration
 Selected trends in Mexico-United States migration Since the early 1970s, the traditional Mexico- United States migration pattern has been transformed in magnitude, intensity, modalities, and characteristics,
Contents. List of Figures List of Maps List of Tables List of Contributors. 1. Introduction 1 Gillette H. Hall and Harry Anthony Patrinos
 Contents List of Figures List of Maps List of Tables List of Contributors page vii ix x xv 1. Introduction 1 Gillette H. Hall and Harry Anthony Patrinos 2. Indigenous Peoples and Development Goals: A Global
Chinese on the American Frontier, : Explorations Using Census Microdata, with Surprising Results
 Chew, Liu & Patel: Chinese on the American Frontier Page 1 of 9 Chinese on the American Frontier, 1880-1900: Explorations Using Census Microdata, with Surprising Results (Extended Abstract / Prospectus
A Profile of the Mpumalanga Province: Demographics, Poverty, Income, Inequality and Unemployment from 2000 till 2007
 Background Paper Series Background Paper 2009:1(8) A Profile of the Mpumalanga Province: Demographics, Poverty, Income, Inequality and Unemployment from 2000 till 2007 Elsenburg February 2009 Overview
Migration Patterns in The Northern Great Plains
 Migration Patterns in The Northern Great Plains Eugene P. Lewis Economic conditions in this nation and throughout the world are imposing external pressures on the Northern Great Plains Region' through
How Job Characteristics Affect International Migration: The Role of Informality in Mexico
 Demography (2013) 50:751 775 DOI 10.1007/s13524-012-0153-5 How Job Characteristics Affect International Migration: The Role of Informality in Mexico Andrés Villarreal & Sarah Blanchard Published online:
Planning for the Silver Tsunami:
 Planning for the Silver Tsunami: The Shifting Age Profile of the Commonwealth and Its Implications for Workforce Development H e n r y Renski A NEW DEMOGRAPHIC MODEL PROJECTS A CONTINUING, LONG-TERM SLOWING
Sierra Leone 2015 Population and Housing Census. Thematic Report on Migration and Urbanization
 Sierra Leone 2015 Population and Housing Census Thematic Report on Migration and Urbanization STATISTICS SIERRA LEONE (SSL) OCTOBER 2017 Sierra Leone 2015 Population and Housing Census Thematic Report
Foreign Labor. Page 1. D. Foreign Labor
 D. Foreign Labor The World Summit for Social Development devoted a separate section to deal with the issue of migrant labor, considering it a major development issue. In the contemporary world of the globalized
Socio-economic and Socio-political Effects of Emigration on the Sending Countries. Magdalena Bonev. Walltopia Austria GmbH, Vienna, Austria
 Economics World, July-Aug. 2018, Vol. 6, No. 4, 325-330 doi: 10.17265/2328-7144/2018.04.008 D DAVID PUBLISHING Socio-economic and Socio-political Effects of Emigration on the Sending Countries Magdalena
Determinants of Return Migration to Mexico Among Mexicans in the United States
 Determinants of Return Migration to Mexico Among Mexicans in the United States J. Cristobal Ruiz-Tagle * Rebeca Wong 1.- Introduction The wellbeing of the U.S. population will increasingly reflect the
Chapter 5. Residential Mobility in the United States and the Great Recession: A Shift to Local Moves
 Chapter 5 Residential Mobility in the United States and the Great Recession: A Shift to Local Moves Michael A. Stoll A mericans are very mobile. Over the last three decades, the share of Americans who
Emigrating Israeli Families Identification Using Official Israeli Databases
 Emigrating Israeli Families Identification Using Official Israeli Databases Mark Feldman Director of Labour Statistics Sector (ICBS) In the Presentation Overview of Israel Identifying emigrating families:
Release of 2006 Census results Labour Force, Education, Place of Work and Mode of Transportation
 Backgrounder Release of 2006 Census results Labour Force, Education, Place of Work and Mode of Transportation On March 4, 2008 Statistics Canada released further results from the 2006 census focusing on
Povery and Income among African Americans
 Povery and Income among African Americans Black Median Household income: $35,481 (all races $53,657) All Black Workers 2015 weekly earnings:$624 (all races $803) Black Men weekly earnings: $652 (All men
Family Ties, Labor Mobility and Interregional Wage Differentials*
 Family Ties, Labor Mobility and Interregional Wage Differentials* TODD L. CHERRY, Ph.D.** Department of Economics and Finance University of Wyoming Laramie WY 82071-3985 PETE T. TSOURNOS, Ph.D. Pacific
The Northern Territory s Non- Resident Workforce
 Research Brief 201204 The Northern Territory s Non- Resident Workforce Dean Carson Flinders University (1) Andrew Taylor Charles Darwin University (2) (1) Flinders University Rural Clinical School / Poche