The Canadian Urban System,
|
|
|
- Charlotte Price
- 6 years ago
- Views:
Transcription
1 Centre for Urban and Community Studies UNIVERSITY OF TORONTO The Canadian Urban System, Responses to a Changing World Jim Simmons and Larry S. Bourne Research Paper 200 Centre for Urban and Community Studies University of Toronto September 2003 ISSN ; ISBN
2
3 The Canadian Urban System, : Responses to a Changing World Jim Simmons and Larry S. Bourne Research Paper 200 July 2003, viii, 71 pp. ISSN ISBN Centre for Urban and Community Studies University of Toronto 455 Spadina Avenue, 4 th floor Toronto M5S 2G8 Canada Telephone: Fax urban.centre@utoronto.ca Website: The opinions expressed in this or any paper published by the Centre for Urban and Community Studies do not necessarily reflect the views of the Centre, or those of the University of Toronto.
4
5 Authors Jim Simmons is Professor Emeritus of Geography and Planning at the University of Toronto, and currently a Senior Research Fellow at the Centre for the Study of Commercial Activity at Ryerson University in Toronto. He lives in Victoria, British Columbia, and keeps in touch through the web. His principal research interest, in addition to monitoring change in the Canadian urban system, focuses on the changing commercial structure of cities and regions in Canada and abroad. Larry S. Bourne is Professor of Geography and Planning at the University of Toronto, and a past director of the Centre for Urban and Community Studies. His current research interests, in addition to a continuing interest in growth and change in the Canadian urban system, include studies of changes in urban form and public policy, population redistribution through immigration and migration, social and spatial polarization within cities and suburbs, and metropolitan governance. Abstract Canada is now overwhelmingly an urban nation. More than 80% of Canadians now live in urban areas and over 60% in the larger metropolitan regions. As those cities change, so too does the nation. In recent decades, Canadian cities and the entire urban system have undergone a substantial transformation, not least because the context national and international in which Canadian cities have developed has changed. As the factors driving change have evolved, so must our ideas evolve about how the urban system is organized. Drawing on an extensive body of research on urban Canada over the last thirty years, much of it undertaken through the Centre for Urban and Community Studies, this paper provides an overview of change in the Canadian urban system for the period from 1971 to It begins with a critical review of the early ideas that guided that research and offers a revised and more comprehensive conceptual framework. Particular attention is paid to the importance of changes in the national environment in the economy, the demography, and the public sector and to shifts in the global environment that have in combination reshaped the urban system. The empirical analysis then demonstrates how that system has responded. Each change in the external environment produces a different pattern of linkages within the urban system and with cities outside the country, and thus a new geography of urban growth and change. The paper concludes with a review of current forecasts of anticipated urban growth to 2026 and speculates on the future evolution of the urban system within a rapidly changing continental and global environment. That system will certainly continue to evolve, but often in unpredictable ways. Growth is likely to become more uneven, with further concentration in a few large metropolitan regions and with much of the rest of the country in relative decline. The direction of evolution of the urban system is likely to become more dependent on forces emanating from outside the country.
6
7 Acknowledgements We wish to thank our research assistant, Linda Lum, for her diligent work on the database; Shizue Kamikihara for preparing the maps and charts; and Philippa Campsie for her editorial expertise in putting the paper into publishable form. We should also acknowledge the generations of students over the years who have waited more or less patiently while we tried to sort out these patterns during classes and seminars. Finally, we wish to acknowledge the generous support of the Social Sciences and Humanities Research Council for research on the Canadian urban system at the University of Toronto.
8
9 Table of Contents PREFACE INTRODUCTION The Canadian Urban System (CUS) in The Changing Urban System: The Original Conceptualization of the Canadian Urban System The Changing Environment of the Urban System RESPONSES OF THE CANADIAN URBAN SYSTEM Urban Growth over Time Provincial Case Studies SUMMARY The Canadian Urban System The Changing Environment of the CUS REINTERPRETATION The Future of the CUS The CUS within Canada Continental and Global Urban Systems...59 APPENDIX A: CREATING THE FILE OF URBAN POPULATIONS APPENDIX B: URBAN POPULATIONS: PAST, PRESENT AND PROJECTED REFERENCES...70
10 List of Tables Table 1: The Canadian Urban System, Table 2: Population Growth within the Canadian Urban System, Table 3: Population Growth within the Canadian Urban System, Table 4: Shifts in Population Rank of Canadian Metropolitan Areas, Table 5: Changes in Air Passenger Flows, Table 6: Employment Growth by Sector, Table 7: The Varieties of Population Growth: CMAs, Table 8: Age Structure, Table 9: Sources of Immigration, Table 10: Public-Sector Events Affecting the Canadian Urban System, Table 11: Growth Rates of Provincial Centres, Table 12: The Components of the Population Forecasts (Based on Canada, 2026: Medium Growth Scenario)...55 Table 13: The Canadian Urban System, Table 14: Projected Growth within the Canadian Urban System,
11 List of Figures Figure 1a: The Canadian Urban System, Figure 1b: The CUS in a Continental Context, Figure 2a: Urban Growth and Decline, Figure 2b: Urban Growth and Decline Rate, Figure 3a: Air Passenger Flow, Figure 3b: Air Passenger Flow to U.S. Cities, Figure 4a: Absolute Urban Growth, Figure 4b: Urban Growth Rate, Figure 5: City Size and Growth Rate, Figure 6a: Changes in Air Passenger Flows, Figure 6b: Changes in Air Passenger Flows to U.S. Cities, Figure 7a: The Urban Hierarchy Circa 1970: Economic Flows...19 Figure 7b: The Urban Hierarchy circa Figure 8: The Growth of the Canadian Economy, Figure 9a: GDP Share by Industry, Figure 9b: Employment Share by Industry, Figure 10a: Gross Domestic Product, Figure 10b: Trade Flows, Figure 11: Employment Growth, Figure 12: Sources of Population Growth, Figure 13: Types of Population Growth, CMAs, Figure 14: Interprovincial Migration, Figure 15a: Federal Government Expenditures, Figure 15b: Provincial Government Expenditures, Figure 16: Provincial Revenues, Figure 17a: Personal Income Per Capita, Figure 17b: Personal Income Per Capita, Figure 18a: Growth Rates by City Size, Figure 18b: Growth Rates by Region, Figure 19: Net Flows of Migrants, Ontario, Figure 20: Net Flows of Migrants, Quebec, Figure 21: Net Flows of Migrants, Alberta, Figure 22: Net Flows of Migrants, British Columbia,
12
13 Preface The principal impetus for this paper was a series of requests to prepare overviews of the Canadian urban system (CUS) for international conferences and publications on comparative urbanization (Bourne, 2000a; Bourne and Simmons, 2002, 2003). Writing these papers forced us to rethink our ideas about the way the CUS is organized, how it operates, and how it is evolving. This, in turn, suggested the need for a more comprehensive evaluation of the directions of change in the CUS, and in Canada generally, that we have been tracking over the last 30 years. Our original ideas about the CUS originated in a flurry of Canadian urban research that took place during the late 1960s and early 1970s. Continued high levels of immigration into Canada, coupled with high rates of natural increase (the baby boom), had produced forecasts of explosive urban growth, which would absorb huge amounts of land, resources, and capital. Suddenly, urban growth was seen as a problem! Several government agencies emerged to fund urban research, including Canada Mortgage and Housing Corporation (CMHC), the Canadian Council on Urban and Regional Research (CCURR), and the federal Ministry of State for Urban Affairs (MSUA). Universities across the country responded to the research funding by hiring professors and setting up programs and institutes to study urban issues (including the Centre for Urban and Community Studies at the University of Toronto). Research on cities surged, including Stone s (1967) book on urbanization in Canada, an urban textbook by Simmons and Simmons (1969), a series of empirical studies on alternative urban futures for the Central Canada corridor sponsored by Bell Canada (Bourne et al., 1972, 1973, 1974), and a major overview of the characteristics and growth of Canadian cities by Statistics Canada based on the 1971 Census of Canada (Ray et al., 1976). These materials shaped our image of the CUS and how it grew for the next three decades. The image was one of rapid and widespread urban growth, directed by the expansion of production in staple economies and manufacturing as well as rapid natural increase and immigration, and shaped by tariffs and policies developed by domestic institutions. By 1976 the baby boom was over, and the issues of rapid population growth had given way to concerns about economic growth, especially the need to create jobs for millions of babyboomers. Many of the urban agencies closed down or reduced their activities. Nonetheless, we continued to update our empirical studies of the CUS (Bourne and Simmons, 1979, 1984, 1989; Bourne and Olvet, 1995), and in a number of studies of particular themes (Simmons, 1974,
14 2 The Canadian Urban System, , 1979b, 1980, 1984, 1986a). These studies were largely based on the same conceptual framework. By 2003, however, the original concepts were getting a bit frayed, and it seemed like an appropriate time to re-examine the CUS, to evaluate the accumulated changes in the urban system and the underlying growth processes we have observed over a 30-year period, and to rethink the concepts, even the terminology, and their applicability in the context of significant changes in the environment of urbanization at national, continental, and international scales. This document has been released in this series to make it widely available as a reference for students, researchers, and communities. The subsequent generation can take up the challenge of any further updating of the ideas or information after the next census in Jim Simmons and Larry Bourne Victoria and Toronto, 2003
15 1. Introduction The importance of the Canadian Urban System (CUS) within Canada is now well established and widely recognized. In 2001, almost 80% of Canada s population lived in cities 1 with more than 10,000 population; 37% live in the four largest centres of Toronto, Montreal, Vancouver, and Ottawa-Gatineau. Canada is an urban nation in every sense: economic cycles, demographic trends, even political debates, take place largely within urban environments. The well-being of Canadians depends on the characteristics of the urban centre in which they live. The size and growth rate of their particular city, in turn, shape their opportunities for jobs, income, housing, education even marriage. During the last census period, , the four largest metropolitan areas captured 62% of the total population growth, while non-urban places actually lost population in aggregate. Cities, effectively, now define what it means to be Canadian; they shape our lifestyles, affect our health, and alter our attitudes to immigrants and our views on social issues and policies. The recognition of the increasing importance of cities is one of the many significant changes that have occurred since At that time, many Canadians preferred to think of Canada in terms of rural and small town settings and regional environments. But cities 2 and the set (or aggregation) of interdependent cities and metropolitan areas that we have defined here as the CUS have changed remarkably over the last 30 years. Accordingly, the ways that we think about cities, and especially our perception of the processes that shape them, must change as well. This paper begins with an overview of the major changes in the CUS over the last 30 years, including its rate of growth, degree of spatial concentration, and patterns of interaction. These changes in the CUS are significant, but perhaps less so than the changes that have occurred in the processes that shape such urban systems: the parallel economic, demographic, and political evolution of Canada, the North American continent, and the rest of the world that affects the location of people, jobs, and power. The CUS continues to grow, but now the growth processes are different, and for this reason, the locations at which that growth is expressed have changed. 1. Census metropolitan areas (CMAs) or census agglomerations (CAs). 2. In this paper we use the term cities as a convenient short-hand, but in all cases (except those references to political municipalities) we mean functional urban regions the census metropolitan areas (CMAs) and census agglomerations (CAs) defined by Statistics Canada.
16 4 The Canadian Urban System, Discussion of these processes is the subject of the second part of the paper, followed by an analysis in the third part that tracks the urban system s response to these changes. In the fourth section we offer a critique of traditional concepts and approaches to the urban system, and then try to reformulate our ideas about the CUS and how it is evolving at the beginning of the 21st century. In sum, the urban system has changed, but the processes that shape it have changed even more. In this section we also speculate on the future of the CUS within new continental and global environments. What will the CUS and its neighbouring urban systems look like in another 20 to 30 years? In aggregate, the Canadian urban system increasingly represents the human geography of Canada. As such it embodies most if not all the major economic, social, and political processes at work within the country. When disaggregated, however, each component in the urban system each individual city represents a unique combination of population size, economic specialization, and rate of growth that defines the economic and social opportunities open to each resident. In this sense, the urban system is the reality of Canada as seen and experienced by individuals, families, and firms going about their daily routines. The significance of understanding the urban system for researchers, planners, and policy-makers lies in the variety of processes that link the local realities of everyday life to the larger entities the context of which they are a part. How much variation in growth performance, or differentiation in characteristics and living conditions, can exist among cities, and within what kind of geographical pattern? What forces determine the characteristics of particular urban places? And, of course, what factors and processes determine the attributes of entire urban systems? For example, all national urban systems share certain regularities in their characteristics and growth processes. These include: the standard log-normal distribution of urban population sizes, in which cities are ordered by size in a more-or-less consistent fashion; some form of city size/distance-decay relationship governing the levels of interaction, the flows and linkages (travel or communication) among cities; the presence of boundary effects that reduce the level of interaction across national borders and accentuate the contrasts between the core and the periphery; a growth regime in which larger cities in the core region approximate the national growth rate, while smaller cities especially those in the periphery exhibit much greater variability in their growth rates and economic viability. 1.1 The Canadian Urban System (CUS) in 2001 The Census of Canada 2001 marked a turning point for Canadian cities. While the popular press made much of continued urban concentration and the rapid growth taking place in the very largest cities, it is equally significant that the postwar pattern of continuing growth no longer holds for most urban centres. Of the 139 Census Metropolitan Areas (CMAs) and Census Agglomerations (CAs) identified by the census in 2001, 44% have declined in population since 1996, and another 12% grew by less than 1%. Only 31 places (22%) grew by more than 5% over the last five-year census period. (See Appendixes A and B for details.)
17 The Canadian Urban System, At the same time, the very largest metropolitan areas Toronto, Vancouver, Calgary, Edmonton, Ottawa, and their near neighbours continued to grow rapidly. The resulting differences between high-growth and no-growth cities will lead to very different urban conditions and living environments in the years to come, with distinctive social, economic, and policy challenges. Fortunately, most Canadians will live in the cities that are most likely to grow, since these are the largest places. For other places, however, slow and uneven growth poses a number of issues for policy-makers at both local and senior levels of government. The spatial organization of the CUS in 2001 is displayed in Table 1 and Figure 1a. The 139 CMA/CAs house a population of 23.8 million, or 79.4% of the Canadian population. The four largest places account for 37.2% of the population, and the 15 metropolitan areas with more than 300,000 population contribute 57.5% of the total. Canada is not only urban, but increasingly metropolitan as well. Central Canada (southern Ontario and southern Quebec) is home to 51% of all cities, and 65% of the total urban population. The typical Canadian, if there is such a person, now lives in a large urban area in Central Canada. Table 1: The Canadian Urban System, 2001 Number of cities Size/Region B.C. Prairies Ontario Quebec Atlantic Canada Over 1 m ,000k k k k Total Urban Population (in 000s) Over 1 m. 1, ,489* 3, , ,000k ,561 2, , k , , k , k ,044 Total Urban 3,407 3,556 9,929* 5,676 1,262 23,830 Rural 594 1,518 1,481 1,561 1,023 6,177 Region 4,001 5,074 11,410 7,237 2,285 30,007 Territories cities grouped with British Columbia *Note that Ontario excludes the 258,000 residents of the Ottawa-Gatineau CMA who live in Gatineau. Quebec includes them. Source: Statistics Canada, Census of Canada, The second version of the map (Figure 1b) reveals an important point about the relative size and spatial organization of the CUS by putting the urban system into a continental context.
18 6 The Canadian Urban System, Figure 1a: The Canadian Urban System, 2001 Figure 1b: The CUS in a Continental Context, 2001
19 The Canadian Urban System, Canada s population is roughly one-tenth the size of the population of the United States; with one-tenth of the cities, and that population is scattered across a much larger territory. Plotted on a continental scale, the CUS appears to be small and peripheral relative to North American cities in total. Many Canadian cities are closer geographically to their immediate American neighbours than they are to other Canadian cities. To the degree that information, people, money, and goods flow increasingly easily across the border, the traditional east-west connections that define the CUS may be overwhelmed by continental linkages. The border still matters, as we demonstrate later, but for how long and for what kinds of connections is uncertain. The geographical distribution of urban growth over the last five years ( ) is far more concentrated than the overall population distribution (Table 2). The four largest cities Toronto, Montreal, Vancouver, and Ottawa generated 62% of the population growth, and the 15 cities with populations over 300,000 received 92% of the country s urban growth. Meanwhile, non-urban areas as a whole lost 25,000 people. Regionally, almost all of the urban growth occurred west of the Quebec border, with 93.5% of the growth in Ontario, the Prairies, and British Columbia. Ontario alone contributed 55% of the urban population growth, including 419,000 additional residents in the Toronto region. This represents more than one-third of all the population growth in Canada. Table 2: Population Growth within the Canadian Urban System, Urban Population Growth (1000s) Size/Region B.C. Prairies Ontario Quebec Atlantic Canada Over 1 m * ,000k k k k Total Urban * Rural Total Region Growth Rate (%) Over 1 m * ,000k k k k Total Rural Region Territories cities grouped with British Columbia *Ontario excludes the 11,000 population growth that occurred in Gatineau. It is credited to Quebec. Source: Statistics Canada, Census of Canada, 2001.
20 8 The Canadian Urban System, When this absolute growth is translated into growth rates, a regular variation in urban growth rates occurs by city size category, ranging from 1.2% for the smallest cities (under 30,000) to +7.1% for the largest places. This is the third consecutive census in which this pattern of growth increasing with city size has been observed, and the pattern is now stronger than ever. There appears to be a breakpoint around 150,000 population: above that population, most cities are growing; below it, the smaller cities are declining. Only Alberta overcomes this pattern by generating growth among all city size groups, even rural municipalities. The Alberta government has maintained a substantial program of fiscal transfers to smaller centres for the provision of various services, in effect producing a spatial redistribution of the revenues from the oil and gas bonanza. The maps of urban growth (Figures 2a and 2b) present some striking images that illustrate Table 2. In absolute terms, population growth is highly concentrated in southern Ontario and Quebec and the two westernmost provinces. Changes in all other locations are minute, whether positive or negative. In terms of growth rates, however, the positive and negative rates differentiate the extensive urban cores in southern Ontario/Quebec, Alberta, and the settled parts of southern British Columbia, from all of the peripheral zones to the North. The Canadian frontier appears to be retreating southward at a rapid rate. Figure 2a: Urban Growth and Decline,
21 The Canadian Urban System, Figure 2b: Urban Growth and Decline Rate, The concentration of Canadians in the largest cities has accelerated, and as we have argued above, these are now the environments that shape our lives. Our political institutions have not yet responded, however, in terms of political representation, fiscal autonomy, or public administration. Agricultural ministries, programs, and subsidies seem to go on forever; while urban issues seldom make the national news. Statistics Canada recognized the role and needs of metropolitan areas long before the provincial governments did. The problem of declining urban centres is going to become prominent, however, as more and more households find that their jobs, their assets (houses), and the public services they expect are eroded by factors beyond their control. Is it possible to plan for decline? How can we compensate people who happen to live in the wrong place? Is there a rate of urban decline that is socially and politically unacceptable? Sixty-four cities lost population between 1996 and Ten cities lost more than 6.9% of their population during this period all of them peripheral resource communities with Prince Rupert, British Columbia ( 12.1%), and Elliot Lake, Ontario ( 11.8%), leading the way. The other essential element in the description of the CUS is the pattern of interdependence among the cities, as well as the links to neighbouring cities in the United States. An overview of the pattern of economic connections among major cities, derived from the movements of air passengers, is shown in Figure 3. Most air passengers are travelling on business; thus,
22 10 The Canadian Urban System, Figure 3a: Air Passenger Flow, 1999 (passengers per route) Figure 3b: Air Passenger Flow to U.S. Cities, 1999 (passengers per route)
23 The Canadian Urban System, airports and flight schedules are designed to serve them. Figure 3a illustrates the intense concentration of flows within the Windsor-Quebec corridor, even though trains, buses, and cars offer alternative means for making short trips. The most popular route, not surprisingly, is the Toronto-Montreal connection. Toronto-Vancouver is next, followed by Toronto-Ottawa. All the evidence on economic links emphasizes the intensity of intercity contacts within the Windsor-Quebec corridor, as both inputs and outputs that flow readily among different sectors and locations. As expected, given their size, Toronto and Montreal anchor seven of the ten largest flows in the urban system. Beyond the corridor, the main flows are spatially defined, typically in the form of links between a regional urban centre and nearby cities (e.g., Vancouver-Kelowna, Halifax-St. John s), and then through each regional centre to cities in the corridor, especially Toronto. The regional centres are the largest cities outside the corridor: Vancouver, Calgary and Edmonton, Winnipeg, and Halifax; and they also interact with each other. The Calgary-Vancouver link is the fourth largest in the system. Some of the largest airline links connect Canadian cities to cities in the United States (Figure 3b). The largest cities Toronto and Montreal are linked to the largest American cities New York and Los Angeles. Canadians also have strong links with holiday centres in Florida, Hawaii, and Mexico. Tourism aside, however, flows to the major cities of the United States are roughly one-fifth the volume that would be expected to flow to Canadian cities of comparable size and distance apart. Thus, borders still matter. The predominant links for the CUS are still east-west, although the patterns continue to evolve toward increased continental integration. 1.2 The Changing Urban System: The picture of the CUS in 2001 and the patterns of growth for the period provide a snapshot of an urban system and a set of growth processes that have changed substantially since Over the last 30 years, the number of urban places (CMAs and CAs over 10,000 population) has increased only marginally, from 135 to 145, while the overall urban population has grown by more than 40%, from 16.2 to 23.8 million. There have also been substantial shifts in the rank of cities and in the relationships among them. At the same time, the patterns of growth and change have themselves evolved substantially from one census period to the next. In some decades, but especially since 1986, the largest cities have grown faster; in other times, smaller places do better. For the most part, urban growth rates are neutral with respect to city population, but vary widely by region; led, first, by Ontario, then perhaps Alberta, or British Columbia. This section compares the CUS in 2001 with the CUS of 1971, which was described in a landmark study by Ray et al. (1976). The development of an internally consistent time series of data for Canadian cities since 1971 turned out to be a complicated task, largely because of frequent boundary changes for CMAs/CAs (see Appendix A for a fuller discussion). Table 3 summarizes the growth patterns since 1971, based on the estimated values (using the boundary correction) in The upper half of the table shows the location of absolute growth; the lower half converts the absolute growth to growth rates. Each part of the table has two versions of the totals, at first excluding the 12 small cities that entered the system during the period (that is, their populations
24 12 The Canadian Urban System, passed the 10,000 threshold), and then adding them all together. The urban system has gained more than 7.2 million residents since 1971, for an overall growth rate of 43.4%. This compares with the national growth of 8.4 million and 39.1%. The urban system has contributed about 85% of all population growth during the three decades. Table 3: Population Growth within the Canadian Urban System, Urban Population Growth (1000s) Size in 1971 B.C. Prairies Ontario Quebec Atlantic Canada Over 1m , , ,000k , k k k Total 1, , , ,092.7 <10k.* Total Urban 1, , , ,211.2 Rural ,228.0 Total Region 1, , , , ,439.2 Growth Rate (%) C. of V.** Over 1m ,000k k k k Total < 10k.* Total Urban Rural Total Region C. of V *These are places that had fewer than 10,000 population in 1971, but emerged later as cities. **C. of V. is the Coefficient of Variation, defined as the Average Growth Rate/ Standard Deviation. Source: Statistics Canada, Census of Canada, various years. Most of the population growth took place in large cities, especially the three largest metropolitan areas, which contributed 47% of the urban growth. Together, all cities over 300,000 population accounted for 73% of urban growth. The amount of growth and the rate of growth are lowest for the smaller urban areas. The two largest urban size groups grew at a rate of close to 50%, while the other size groups were closer to 30%. Meanwhile, rural areas grew at a rate of only 25% over the period. The most dramatic variations occur among regions, with urban growth rates averaging only 17% in the Atlantic region, but more than 80% in British Columbia (Figures 4a and 4b).
25 The Canadian Urban System, Figure 4a: Absolute Urban Growth, The growth rates vary from east to west, with Alberta s growth rate substantially higher than that of Manitoba and Saskatchewan. Ontario, with its large urban population base in 1971 and its high rate of subsequent growth, has generated 45% of Canada s urban growth since Only 15% of all urban growth occurred east of the Ontario border. The coefficient of variation in growth rates describes the variability of growth by city size and region (see Table 3). The larger cities grew in a more predictable fashion, approximating the overall national growth rate. Smaller cities tended to be more specialized in one or two economic activities, and their growth rates therefore tended to be more erratic; in other words, they have higher coefficients of variation. During this period the coefficient also declines from east to west, suggesting that the national pattern is dominated by the regional differences in growth rates. In fact, the Prairies and British Columbia have higher standard deviations of growth rates than the rest of the country.
26 14 The Canadian Urban System, Figure 4b: Urban Growth Rate, Figure 5 plots the growth rate for against population size in The scatter of points demonstrates urban system relationships in which the size and growth of particular cities is constrained by the properties of the larger distribution. Note, for example, the roughly log-normal distribution of city population sizes, with many more smaller places than large ones. The growth rates of the largest cities, as suggested above, are far more uniform and approximate the national growth rate (actually, they surpass it), while the growth rates of smaller cities vary widely. As a result, only smaller places have negative growth rates. In most countries, in most time periods, there is no significant correlation between city size and growth rate; although in Canada, during the last two decades, larger cities appear to have an advantage. The graph also differentiates cities in the core (=1) and the periphery (=0), and it is apparent that urban growth rates are far more variable in the latter. Core cities depend on their location advantages for growth; cities of the periphery depend on the local resource base, and thus on commodity prices. The latter can, and do, fluctuate widely. The interpretation of overall changes in the Canadian urban system in this paper largely reflects events and processes that vary regionally and by city size; inevitably, the discussion focuses on factors determining the growth of larger places such as Toronto, Montreal, Calgary, and Vancouver. Despite the level of overall growth and the variability by city size and region, the hierarchy of urban places has remained remarkably stable over time (Table 4).
27 The Canadian Urban System, Figure 5: City Size and Growth Rate, Note: gr7101b is the rate of population growth, ; lpop71e is the log of the estimated population in 1971; and core identifies cities in southern Ontario and southern Quebec The size differences among larger cities are so great that the ranking does not change easily. Most of the same cities remain on the list of the 25 largest places; and the urban rankings are similar at each census. By far the most significant shift was the replacement of Montreal by Toronto in the first position between 1971 and 1981, and the subsequent intensification of that dominance. The shifts in rank among Calgary, Edmonton, and Winnipeg have been important within western Canada, while Halifax and St. John s have grown in importance relative to other cities in the Atlantic region. Sherbrooke dominates the eastern townships of Quebec. No new cities have broken into the top nine places, but several newcomers have appeared at the lower end of the list: Sherbrooke, Barrie, Kelowna, and Abbotsford have replaced Cape Breton (originally Sydney), Thunder Bay, Kingston, and Saint John in the list of the top 25 cities.
28 16 The Canadian Urban System, Table 4: Shifts in Population Rank of Canadian Metropolitan Areas, Gain 1. Montreal Toronto Toronto Toronto Toronto Montreal Montreal Montreal Vancouver Vancouver Vancouver Vancouver 0 4. Ottawa Ottawa Ottawa Ottawa 0 5. Winnipeg Edmonton Edmonton Calgary Hamilton Calgary Calgary Edmonton Quebec City Winnipeg Winnipeg Quebec City 0 8. Edmonton Quebec City Quebec City Winnipeg Calgary Hamilton Hamilton Hamilton London St. Catharines London London St. Catharines London St. Catharines Kitchener Halifax Kitchener Kitchener St. Catharines Windsor Halifax Halifax Halifax Kitchener Windsor Victoria Victoria Victoria Victoria Windsor Windsor Oshawa Oshawa Oshawa Oshawa Sudbury Saskatoon Saskatoon Saskatoon Saskatoon Regina Regina Regina Chicoutimi Chicoutimi St. John s St. John s Regina Sudbury Chicoutimi Sudbury St. John's St. John s Sudbury Chicoutimi Cape Breton Trois-Rivières Sherbrooke Sherbrooke enter 23. Thunder Bay Sherbrooke Kingston Barrie enter 24. Kingston Cape Breton Trois-Rivières Kelowna enter 25. Saint John Thunder Bay Saint John Abbotsford enter Source: Statistics Canada, Census of Canada, various years. Changes in the patterns of connections among the cities are less well-known, but may be more significant than the population changes (Figure 6a). Our database records the number of air passenger movements among the 27 largest urban centres in the country at five-year intervals between 1971 and During this period, the number of air passengers in Canada grew much more rapidly than the population, at a rate of 124%, compared to the population growth of 39%. Higher incomes, lower airfares, and improved air transport technology contributed to this growth, but it also reflects the intensification of linkages among the different parts of the country. The majority of air passenger traffic is motivated by business connections, and increasingly these connections are national (or international) rather than regional in scale. For instance, air traffic within Canada s regions grew at a rate of 61%, while interregional links grew at a rate of 147% (Table 5). At the same time, the destinations became moderately more centralized, with the share of total traffic represented by the largest 27 destinations increasing from 89% to 92% of the total.
29 The Canadian Urban System, Table 5: Changes in Air Passenger Flows, Passengers in 1000s Among Canadian Regions Pattern of Flows in 1999 Change (%) Atl. Que. Ont. Pr. B.C. Atl. Que. Ont. Pr. B.C. Atlantic Quebec Ontario 1,016 1,517 1, Prairies , B.C ,439 1, Total 2,006 2,578 7,262 4,913 3, To U.S ,989 5,398 1,734 2, Grand Total 2,383 4,567 12,660 6,647 6, Air passenger flows among 27 Canadian cities, and 28 destinations in the USA. The rows designate origins; the columns destinations. The diagonal entries indicate flows within the region. Source: Statistics Canada. Air Passenger Origin and Destination, Domestic. Catalogue ; Air Passenger Origin and Destination, Canada-United States. Catalogue , various years. Figure 6a: Changes in Air Passenger Flows, (passengers per route)
30 18 The Canadian Urban System, Within this network, the biggest winners were Toronto, which completely dominates the network by 1999, followed by Vancouver and Calgary. In 1999, Toronto generated 24.1% of all air passenger flows in Canada, compared to 20.9% in 1971; while Montreal dropped from 14.8% to 10.4%, and Vancouver and Calgary grew from 11.7% to 14.2% and from 7.0% to 10.2%, respectively. The volume of domestic air traffic through Vancouver has now surpassed that of Montreal, and Calgary is not far behind. Whatever the volume and direction of air passenger travel actually measure be it level of economic influence, the location of head offices, or simple centrality the networks of connections among places and economic activities have certainly shifted westward over the study period. As a result, Calgary and Vancouver are now very closely tied to Toronto, rather than to some of the alternatives in the American Midwest or West Coast. The network of connections with cities in the United States reveals a slightly different pattern of change over time (Figure 6b). First, the rate of growth for cross-border flights was significantly higher than for domestic traffic: 301%, compared to 124% for the study period. During this period, the ratio of cross-border flights to domestic flights increased from 0.64 to 1.15, as the spatial integration of the CUS extended to include the rest of the continent. Recall, though, that the United States has roughly ten times the population and number of cities as Canada, so that air passenger traffic is still disproportionately domestic when compared to the potential destinations across the continent. Figure 6b: Changes in Air Passenger Flows to U.S. Cities, (passengers per route)
31 The Canadian Urban System, Second, the connections to cities in the United States are becoming much more widely diffused, as the share of total passenger traffic going to the largest 28 American cities declined from 42.7% to 40.8%. New York s share of Canadian destinations dropped from 13.4% to 6.5% now slightly more than Edmonton. Chicago declined from 3.6% to 3.0%, while Los Angeles increased from 3.0% to 4.6%; but clearly there is no city in the United States with the dominance that Toronto exerts on the domestic Canadian network. The increased integration with the United States urban system suggests an overall intensification of business contacts among a variety of smaller centres. On the Canadian side of the border, the links are also becoming more diffused. Toronto s share of cross-border flights has dropped slightly from 19.9% to 19.3% little more than its share of the Canadian market. Montreal has dropped significantly, from 13.4% to 7.8%; while Vancouver increased its share from 3.6% to 4.6% and Calgary from 2.0% to 3.9%, respectively. In sum, the CUS has grown substantially, and some places have grown much more rapidly than others. As well, the matrix of connections among the cities the glue that binds the cities together as a system has intensified, but again, some places have become much more closely linked than others. Does this suggest that the population growth pattern in the CUS has altered the pattern of interdependence among cities, and the nature of the growth processes? Or have the growth processes themselves evolved over time to produce these patterns of change? 1.3 The Original Conceptualization of the Canadian Urban System Papers written during the 1970s (cf. Simmons, 1974, 1979a) reveal three dominant themes: the relative isolation of the national urban system at least in the minds of urbanists from its external context; the strong core-periphery differentiation in the economic role of cities; the importance of the urban hierarchy in channelling growth through the urban system. The two diagrams in Figure 7, drawn from that earlier period of research, convey the simplicity of the conceptualization. Figure 7a: The Urban Hierarchy Circa 1970: Economic Flows Low-order Staple Production High-order Service Centres Nearby Manufacturing Centres Exports Imports of consumer goods UNITED STATES (plus Europe and Japan)
32 20 The Canadian Urban System, Figure 7b: The Urban Hierarchy circa 1970 C Calgary NY New York Su Sudbury CJ Chicoutimi-Jonquière O Ottawa T Toronto E Edmonton Q Quebec TB Thunder Bay H Hamilton R Regina V Vancouver Hx Halifax S Saskatoon Vi Victoria K Kitchener SC St. Catharines W Winnipeg L London SJ Saint John Wr Windsor M Montreal SJs St. John s The notion of isolation requires some qualification. The importance of export markets in determining the location of economic activity in Canada has been widely acknowledged, notably in the classic staple model of economic growth (Watkins, 1977). In this model, the demand for an export commodity the staple stimulated growth at the point of production, such as a mine or mill, and at other locations connected to that point by three kinds of linkages: forward (transportation), backward (sources of supplies), and final demand (consumption). But the external connections were not specified, by either sector or location; and imports were assumed to be filtered by and through a variety of tariffs and regulations. The export stimuli clearly influenced growth at the point of production, but the remainder of the urban system was largely unaffected by other external influences. A variety of unilateral regulations restricted foreign ownership and maintained the integrity of the Canadian market. The importance of immigration for population growth, especially in the post World War II period, was also recognized; but again, Canada was perceived as an island, as if it were separated from the rest of the world by a substantial body of water, instead of as a peripheral location along the edge of a huge and aggressive economy, and penetrated by a continuous flows of information, culture, ideas, goods, investment, and personnel from the United States. Perhaps we were simply in denial. ca
33 The Canadian Urban System, The notion of the border, permeable to exports but controlled for imports, supported the theme of the core-periphery differentiation, as illustrated in the upper part of Figure 7a. The core was the Windsor Quebec corridor, essentially the regions surrounding the two metropolitan poles, Toronto and Montreal. The periphery was the remaining 90% of the national territory. Canada s economic development was driven primarily by investment and growth in various staple activities within the periphery (reflecting the local resource base) and the level of international prices. Resource exports generated sales and income in the periphery. Various institutional arrangements managed by interests in Central Canada channelled the periphery s linkages the forward, backward, and final demand links through the core, where the production of goods and services for the national market occurred, and where selected imports were processed. Urban growth in the periphery fluctuated with the weather (such as droughts) and the prices of resource commodities; but growth in the core reflected the average value of all growth rates across the entire periphery. Migrants, both international and domestic, were attracted to the locations of job creation in both the core and periphery. This version of the Canadian economy is still quite relevant, but the simplicity of the model has been weakened in several ways. The erosion of tariffs and other restrictions on foreign goods and services through trade liberalization has weakened the control of the core over the periphery. The latter can now import goods and capital directly from the United States. Energy has become the key export commodity, but it generates minimal employment at the point of production and provides few spatial linkages except through final demand (consumption). Alberta has become the richest province, thanks to oil and gas resources. Meanwhile, the core has also developed export markets for manufactured goods, especially the system of automobile production that integrates the economy of southern Ontario with the American Midwest. The presence of the United States is felt everywhere in Canada, providing markets and alternative sources of goods, and in turn modifying the distribution system for all goods. In the original conceptual framework, the economic relationships within the core and the periphery and between the two were structured by the urban hierarchy. A preoccupation of the early research on the CUS was the actual structure of intercity relationships (see Simmons, 1979b) and how they determined urban growth hence the hierarchical approach. Initial crude assumptions about population and distance gave way to the study of actual flows by telephone, migration, and trade. As Figure 7b suggests, each urban centre was linked upward to a single larger centre, and downward to a number of smaller places. Growth stimuli moved upward and downward through these hierarchical linkages. Within the periphery, the urban hierarchy described the forward and backward linkages of staples, especially the final demand connections. People in smaller centres turned to the next largest place to buy more sophisticated goods and services. Larger cities in the periphery competed for service areas. And these service areas, in turn, provided a steady flow of domestic in-migrants to cities during the 1950s and 1960s as the growth of services compensated for the gradual decline in the number of primary workers in agriculture, forestry, and mining. The structure of the transportation system notably rail and road reinforced the spatial hierarchy. Toronto and Montreal which were roughly equal in size at the time shared the top spot in the urban hierarchy, each one connected to the regional centres that controlled the local hierarchies. Within the core region, urban hierarchies were less clearly defined, principally because of shorter distances among cities and
34 22 The Canadian Urban System, greater specialization in production. These intercity linkages were often nested and overlapped in a complex fashion. The urban hierarchy, too, has evolved. As noted earlier, shifts in the population size rankings mirror the changing relationships among cities. More important, though, are the variety of alternative markets and sources for goods and services that have eroded the traditional concept of service area. Automobiles and inexpensive communications media have weakened the effects of distance, so that any firm in any town can now deal directly with Toronto or New York. American firms and distribution centres now provide direct competition for firms located in Central Canada. At the same time, we will show that the Canadian market remains a distinct entity within North America. 1.4 The Changing Environment of the Urban System Canada in 2003 is a very different place from Canada in 1971, and the world in which it is increasingly embedded has changed dramatically as well. Both the CUS and the processes that shape it have evolved in response. This section of the paper outlines the variety of changes that have occurred, both within Canada and in Canada s relationships with the rest of the world. The following section examines the responses of the urban system to these changes through the years. The changes are grouped into three themes economic, demographic, and the public sector but the themes interact with each other, in addition to their direct impacts on the CUS. The Economy At least three aspects of change in the Canadian economy shaped the Canadian urban system between 1971 and First, this has been a period of substantial growth, as the population has increased by almost 40%, and the GDP grew by more than 140%. The location of this added economic activity determines much of the pattern of spatial change of population. Second, as part of this overall growth, the economy has shifted in its sectoral composition; not so much in terms of GDP, but in terms of employment hence in the spatial distribution of jobs and population. Private-sector services, and the large cities that support them, have gained most of the jobs, while the primary and manufacturing activities have lagged behind. Finally, changes in the world economy and the overall liberalization of international trade, in which Canada actively participated, have significantly increased the levels of imports and exports relative to GDP and these in turn have modified the sectoral and spatial patterns of economic activity, as well as the networks of connections among places. The economic growth of Canada since 1961 is summarized in Figure 8. All variables have been set to the value 1.0 in 1971, so that their growth rates can be directly compared. The value of production (GDP) in constant dollars has grown more than three times as fast as the population, so that income levels (roughly equivalent to GDP per capita) have grown by 67%. The increase in the level of income alters the choices and lifestyles of Canadians for
35 The Canadian Urban System, example, when combined with the increases in longevity, the result is substantial numbers of migrant retirees. Part of the reason for the increase in income is the higher proportion of the population in the labour force (the participation rate), now that there are fewer children, more adults, and more employment and career opportunities for women. The level of employment has increased more than twice as fast as the population, creating about 7 million more jobs and increasing the ratio of jobs to population from 0.37 in 1971 to 0.49 in As a result, overall dependency rates (combining the proportions of children and the elderly) have declined. In summary, over the period the equivalent of an entire economy has been superimposed upon the pre-existing pattern. The types and locations of jobs created in the newly added economy largely determine the degree of change in the urban system. One source of stability for the urban system, however, is also evident. To the degree that the growth of the economy reflects the employment of larger proportions of the existing population, that is, the increased participation rate, then that growth will tend to reinforce the economies of the pre-existing urban centres rather than support growth in new locations. In earlier times, the development of new economic staples tended to open up new regions to development, each with a new urban subsystem to support that growth. A closer look at Figure 8 indicates that the 1970s continued the high growth rates of the 1960s, but subsequent decades reveal uneven growth patterns for the economic variables, although the population continued to grow regularly. Major downturns are apparent in the early 1980s and early 1990s in the growth of employment and GDP. In fact, the ratio of jobs to population has not grown substantially since 1989, and GDP per capita has not done much better. As will be evident later, the dramatic slowdown in economic growth in the early 1980s, following a long period of rapid growth, also led to crises in the public-sector economy that were to continue for more than a decade. Figure 8: The Growth of the Canadian Economy, (relative to 1971 = 100)
36 24 The Canadian Urban System, Figure 9a: GDP Share by Industry, Figure 9b: Employment Share by Industry,
37 The Canadian Urban System, The allocation of economic growth among the country s major industrial sectors is illustrated in Figure 9. Depending on the data used, two quite different results emerge. Figure 9a shows the GDP, which more than quadrupled from $220 billion in 1961 to $938 billion in 2001 (using constant dollars). But as the graph indicates, the shares of the major industrial sectors changed very little. The primary sector lost three or four percentiles, while the manufacturing share remained virtually unchanged. The contribution of infrastructure including construction, transportation, utilities, and communications is also unchanged. The commercial services sector, especially business services, picked up the share lost by the primary sector. The public sector (including education and health) first expanded, as the economy grew rapidly, but has declined since the early 1980s. Thus, in the broadest sense, the composition of the Canadian economy has changed relatively little since The economic growth that has been added reinforces the earlier sectoral hence spatial patterns of change. The composition of employment, however, shows substantial differences in rates of change that have surely modified the urban system (Figure 9b and Table 6). The rate of job creation varies widely among the five major sectors. The primary sector has declined by 12% since 1971, and now provides 90,000 fewer jobs. Manufacturing has grown by 28%, creating more than 500,000 jobs, but the growth rate is only one-third of the overall employment growth rate. Employment in infrastructure activities has grown at a rate of 76%. The great majority of new jobs have been created in the services, both private and public; a total of 4.1 and 1.7 million jobs respectively. These new jobs are a potential source of change in the urban system. Table 6: Employment Growth by Sector, Employment in 1000s Year Total Jobs Primary a Manufacturing Infrastructure Commercial Services c Public Services d , , ,773 1, , ,766 1,184 2,647 1, , ,204 1,618 4,282 2, , ,956 1,754 5,599 3, , ,275 2,093 6,817 3,274 Growth, , ,170 1,702 Growth Rate, % a Agriculture, fishing and trapping forestry and mining b Construction, transportation, utilities, communication c Trade, finance, business and personal services d Education, health, public administration Source: Statistics Canada. Census of Canada, various years. Services are more likely to be found in urban centres than in small town or rural areas, and high-order services (such as business and professional services) are more likely to locate in the largest cities. At the same time, these new service jobs are disproportionately filled by women most of whom are already living in urban centres; and directly or indirectly the services provided are linked to the same kinds of primary and secondary activities (or their
38 26 The Canadian Urban System, workers) that drove the economy in the first place. The jobs in professional services serve nearby farms and factories; the public revenues from resource industries pay for the educators and health care workers of the provinces that collect the money. In short, there are constraints on the opportunities for spatial change in the urban system. One other aspect of the changing economy has direct implications for the urban system. A series of trade agreements and the general trend toward the globalization of the economy have increased Canada s orientation toward export markets (Figure 10a). While the GDP overall has grown by 136%, the value of exports increased fivefold, by 424%, and the shipments to domestic markets by only 62%. Figure 10b compares the level of exports with the level of trade among the provinces. While the latter interprovincial trade has grown only modestly since 1981, exports have more than doubled, especially since the Free Trade Agreement in The implications of this shift for the urban system are threefold. First, those cities and regions that produce exports will be favoured over those that produce for the domestic market. Figure 10a also shows the dramatic growth in value of two important export products: automobiles (southern Ontario) and energy products (British Columbia, Alberta, and Quebec). Both Ontario and Alberta have boomed during this period. Second, the locations that are most accessible to the growing export markets have prospered. The external markets that have grown most rapidly are in Asia (served by Vancouver) and the United States, to which southern Ontario is so closely linked. Figure 10a: Gross Domestic Product,
39 The Canadian Urban System, Figure 10b: Trade Flows, Third, as Courchene and Telmer (1998) have argued, the decline in the relative importance of domestic trade flows and markets relative to exports reduces the incentives for richer and increasingly export-oriented provinces to share revenues with poorer provinces. The latter are no longer viewed as essential to the domestic market, but as part of the competition for export markets lying outside the country. The pressures to maintain the political and economic integration of the country are thereby reduced (Bourne and Simmons, 2003). A recent study by Brown (2003) summarizes the current pattern of trade flows within North America and concludes that the overall level of interprovincial trade (controlling for size and distance) is still six times stronger than interstate trade. This, in turn, implies an asymmetry in border effects: the border reduces flows originating in the United States by one half (relative to interstate flows), but reduces cross-border flows from Canada to one in 12 (relative to interprovincial flows). Although trade flows are adjusting to the North American Free Trade Agreement (NAFTA), the hierarchical linkages within Canada are still very powerful. The net results of these economic shifts can be seen in Figure 11, which shows differences in the employment growth rates by region. Since 1971 Canadian employment as a whole has grown by about 86% approximately the same rate as Ontario. Two regions, Alberta and British Columbia, have grown much more rapidly than the average, by more than 120%; while the Atlantic region, Quebec, and the eastern Prairies have grown more slowly, at rates of 40 to 60%. Thus, job creation explains most of the regional variation in urban growth. Interestingly, despite the arguments for the attractions of larger cities, the region that contains Montreal, which was Canada s largest city in 1971, has grown very slowly. Both
40 28 The Canadian Urban System, demographic factors (including lower levels of immigration) and political uncertainty are part of the explanation. Virtually all of the job creation over the last 15 years, as noted, has occurred in the services, especially business services, and these activities usually originate in larger cities. Primary and secondary activities, in contrast, have undergone substantial employment downsizing so that the old economic base model no longer drives urban growth in Canada. Only Fort McMurray, Alberta (also known as Wood Buffalo), continues to grow rapidly as a resource-based boom town on the frontier. Services are also the basis of the widespread growth in Alberta cities; eight of the 25 fastest-growing cities in the country are in Alberta. As noted above, the province is spending oil and gas revenues on the health and education facilities that support small cities. Figure 11: Employment Growth, (relative to 1971 = 100) The impacts of the proliferation of multinational corporations in Canada are difficult to evaluate. Between 1975 (the first year of the time series) and 1999, the proportion of Canadian corporate revenues controlled by foreign firms actually declined from 33.5% to 29.6%, as the economy shifted away from primary activities such as forestry and mining toward services (Statistics Canada, ). Nonetheless, the impact of these firms continues to be significant. They generate most of Canada s exports and also bring in most of the imports. Their knowledge of conditions and prices elsewhere serves to enforce international prices, technology, and standards upon Canada. These firms are also active in the implementation of trade agreements. Within Canada, investments by multinational corporations clearly influence the sectors and locations of growth. They choose the subcontractors and the parts manufacturers.

41 The Canadian Urban System, Perhaps the most worrisome implication of increasing globalization is the reduction of regulatory diversity, both interprovincially and internationally, as the result of the continued lobbying by multinationals to reduce taxes, weaken environmental and labour regulations, and increase subsidies, in order to make Canada more like Alabama or Mexico. As a result, Canada has become more specialized (and, paradoxically, probably more productive) within a narrow set of economic activities, but effectively becomes excluded from other activities and these choices are made for us by others. Demography Although the demographic processes of growth and spatial redistribution are also shaped by economic and political conditions, these processes have made substantial contributions to the changes in the urban system in their own right. The most significant processes include: the marked decline in fertility rates (the baby bust) and greater longevity, which have jointly brought about the sharp decline in the rate of natural increase; the expansion of international immigration in absolute terms, but especially in comparison to the level of natural increase; the relative decline in the importance of domestic migration as a factor in explaining urban growth. Figure 12: Sources of Population Growth,
42 30 The Canadian Urban System, Figure 12 tells most of the story. In 1961, natural increase added more than 300,000 persons per year (equivalent to 1.5% of the population), while net immigration added about 30,000. By 2001, the contribution of immigration surpassed natural increase, which had dropped to little more than 100,000 a year (0.3%). The latter is now only one-third of the rate during the peak growth period, and is well below the replacement rate. Table 7: The Varieties of Population Growth: CMAs, Growth Rank CMA Population Growth (%) Natural Increase (%) Net Domestic Migration (%) Net Immigration (%) 1. Calgary Oshawa Toronto Edmonton Vancouver Kitchener Abbotsford Windsor Ottawa-Hull Hamilton Halifax London Saskatoon Montreal Sherbrooke Victoria Quebec Kingston St. Catharines Winnipeg Regina St. John s Trois Rivières Saint John Chicoutimi Thunder Bay Sudbury Average Source: Census of Canada, Domestic migration is given in the Census, net immigration is estimated from provincial retention ratios, and natural increase is the residual value. The latter estimates are thus most prone to error.
43 The Canadian Urban System, The effect on urban growth patterns has been dramatic (see Figure 13 and Table 7). Natural increase is widely dispersed; it occurs everywhere there is population. In 1971 it guaranteed every community an annual growth rate of more than 1% barring large-scale out-migration. By 2001 the average rate of natural increase for the 27 CMAs was only 1.5% for five years, and many small communities have begun to lose population through this process. While a few cities in Quebec and Newfoundland are only now completing the demographic transition and still have higher birth rates, natural increase levels will also drop sharply there in the future. The information in Table 7 suggests that only cities that can attract in-migrants particularly young adults are able to generate high rates of natural increase (Calgary, Edmonton, Kitchener, Vancouver, Toronto). The decline in fertility levels has other implications for the urban system. It eventually results in an aging population, and this in turn further reduces the level of domestic migration, since migration is highly concentrated in the age group A larger proportion of domestic migrants are now retirees, who are largely unresponsive to economic signals; in fact, they often reverse moves that were made into larger cities a couple of generations earlier, in order to live in less-crowded, less-expensive communities. Figure 13: Types of Population Growth, CMAs,
44 32 The Canadian Urban System, Table 8: Age Structure, Percent of Total Population Age Group Total Population (in 000s) 18,238 21,568 24,343 27,297 30,007 Source: Statistics Canada. Census of Canada, various years. Table 8 summarizes the changes in age structure from : a massive decline in the proportion of population under 15, coupled with an equally dramatic increase in the share of the elderly. The proportion of young adults (15-24), and that of the working age population (25-44) have remained relatively stable (so far), but the proportion of older adults (45-64) has increased sharply during the last decade as the baby-boom ages. Reduced levels of natural increase affect all parts of the urban system, but net immigration is highly selective, as shown in Table 7 and Figure 13. Immigration is highly concentrated in the largest cities, and especially in Toronto and Vancouver; as well as in locations near these cities, notably in southern Ontario. Immigration in the Atlantic region and Quebec, outside the Montreal region, is almost non-existent. While immigration levels used to rise and fall with the strength of the Canadian economy hence the rate of job creation recent levels have become more detached from the economy. Moreover, the composition of immigrants has changed over time. There are now more family members, and immigrants originate in countries that are less competitive in terms of economic opportunity. With its long waiting list, Canada can have as many immigrants as it cares to accept, although the competition for skilled immigrants has intensified. Changes in the sources of immigrants suggest some reasons for the high degree of spatial concentration (see Table 9). During the 1960s, immigrants were overwhelmingly European, with a significant proportion from the United Kingdom. Recent immigrants are less likely to be Europeans and more likely to come from East or South Asia. They prefer to live, at least initially, where there are established networks and communities that share the same language and culture. Eventually, immigrants may disperse more widely throughout the country, but the initial location decisions tend to favour a small number of large, diversified cities. Neither the rate of natural increase nor net immigration responds strongly to local economic growth. Thus, the only demographic mechanism remaining to adjust population to the needs of local labour markets is domestic migration. Canadians do relocate frequently, at an annual rate of more than 15%, but the vast majority of moves take place within the same urban centre, or between the urban centre and the immediate service area. The best measure of longer-distance moves is the level of interprovincial migration, for which a long time series is available (Figure 14).
45 The Canadian Urban System, Table 9: Sources of Immigration, Origin United Kingdom 21.4% Other Europe Asia South & Central America USA Africa Other Number of Immigrants 745, ,300 1,041,500 1,830,700 Source: Statistics Canada. Census of Canada, Figure 14: Interprovincial Migration, The level of gross migration depends in the long term on the age structure; as noted earlier; young adults move more often. Interprovincial migration levels peaked during the 1970s as the baby boomers came of age. Economic and political cycles are imposed on this trend and show up in the pattern of net interprovincial migration, which has fluctuated between 30,000
46 34 The Canadian Urban System, and 90,000 persons a year. Note the impact of the FLQ events in Quebec , generating a surge of migrants from Montreal to Toronto. A similar wave occurred after the election of the Parti Quebecois in The energy boom in the west during the late 1970s (and the subsequent bust in the 1980s) drew job-seekers from Ontario and then sent them home again. A secondary peak in net migration occurred in Substantial flows occur within provinces as well; thereby adjusting the population growth of larger and smaller centres to changing economic conditions. During the 1950s and 1960s people tended to move from rural areas and small towns to the cities; the 1970s witnessed a reverse flow, temporarily, as the population dispersed into smaller places, while more recently, larger cities are again attracting migrants from smaller centres (Table 7 and Figure 13). Some cities are attractions in their own right (Calgary, Edmonton, Ottawa); while others attract large in-flows from nearby larger cities, in the form of overspill suburbanization (Oshawa from Toronto; Abbotsford from Vancouver). Continued rapid economic growth and immigration and the associated high house prices also encourage part-time workers or retirees in larger cities to relocate to small town and ex-urban settings, often outside the CMA boundaries. In sum, as the overall level of natural increase continues to decline, a city s growth will depend more and more on its ability to attract migrants, domestic or international. It must be perceived as a good place to live. The correlations between rates of natural increase, net domestic migration, and net immigration for 139 CMA/CAs were and respectively, while the net domestic and net international migration flows were correlated at All three growth processes were positively correlated with the size of the city in Government The substantial influence of governments on the economy and lifestyles of Canadians, and on growth and change in the CUS is widely recognized (see, for example, Simmons, 1982, 1986), but only partially understood. The economy is shaped by policies, including macroeconomic and trade policies, as well as subsidies and taxes that target various industrial sectors. Immigration policy obviously affects the rate of population growth. Infrastructure investments modify the distance barriers between places and help knit the country together. Massive fiscal transfers and social programs redistribute income from richer to poorer regions. How do all these activities affect the evolution of the Canadian urban system? Let us begin by recognizing that governments act, among other ways, as gatekeepers, by responding to a variety of external and internal economic and social pressures. As the world changes, or some aspect of Canada changes, governments respond by negotiating a treaty or passing legislation to incorporate that change. For example, Table 10 lists a series of government decisions that have altered the urban system significantly. The most important changes modify the national boundary, making it either less permeable (with the usual result of centralizing growth within the country) or more open (thereby dispersing growth). Notable events for the Canadian urban system were the signing of the Auto Pact in 1965 that encouraged the specialization of Ontario manufacturing and the gradual integration of that region with the American Midwest. The success of the Auto Pact encouraged the Free Trade Agreement of 1989 that opened the door to even greater integration with the United States,
47 The Canadian Urban System, as shown earlier in the growth of exports (Figure 10). The North American Free Trade Agreement (1994) simply expanded the agreement to include Mexico. The Immigration Act (1978) helped increase the flow of immigrants and diversify the sources of immigration. To the extent that family members were preferred, recent immigration destinations have tended to replicate previous immigration concentrations; to the extent that immigrants come from Asia, for example, big cities with established Asian immigrant communities are favoured. Table 10: Public-Sector Events Affecting the Canadian Urban System, Date Event Impact on CUS 1965 The Auto Pact Accelerated growth in Ontario; created stronger northsouth links with the Midwestern United States Equalization payments Current format initiated. Transferred funds for public services from rich provinces to poor ones Medical Care Act Increased federal funding and provincial expenditures, hence increasing spatial redistribution FLQ crisis in Quebec Frightened anglophones and their firms away from Quebec Expanded unemployment benefits 1973 Foreign Investment Review Agency Transferred substantial sums to smaller resource communities, especially in Eastern Canada. Monitored acquisitions of Canadian firms; and new investments by foreign firms. Did it discourage American capital from investing in Canada? In 1985 the agency was converted into Investment Canada PQ victory in Quebec Accelerated the flight of anglophones and capital from Quebec Immigration Act Established priorities and targets, expanding the level of immigration National Energy Policy Diverted oil and gas income from Alberta to the East, slowing down growth and investment in the West. Revoked by Tories after Free Trade Agreement Largely eliminated duties and restrictions on trade between Canada and the United States Federal cutbacks Reduced level of transfers to provinces, in turn reducing redistribution. Reduced unemployment benefits to Atlantic Canada NAFTA Extended Free Trade Agreement to Mexico. Source: The Canadian Encyclopedia Other policy initiatives increased the level of spatial redistribution of income from wealthy provinces to poorer ones, and from big cities to smaller (and poorer) places, thereby reducing the variation in income per capita. Equalization payments among provinces took their present form in Unemployment benefits have a similar redistributive effect, and they were expanded in Pensions and health care benefits also increase the level of redistribution (Simmons, 1984). On the other hand, programs intended to eliminate the deficit, imposed by the Liberal government after 1993, reduced the levels of social transfers and payments to the provinces, creating a series of budget crises for the latter.
48 36 The Canadian Urban System, Other significant political events have strengthened or weakened the political integration of the country, and thus affected the operation of the urban system. Events and policies in Quebec have weakened the ties between the Francophone urban subsystem centred on Montreal and the rest of Canada. The National Energy Policy and other political actions have reduced support for federal policies of integration in the West. The collapse of constitutional negotiations in the 1980s created tensions between provinces and the federal government. It is now unlikely that the federal government could introduce a major program that implied the further redistribution of resources among the provinces. Instead, Canada is moving towards even greater decentralization, with increased roles for the provinces and international agencies (read the United States), and with the federal government s role in relative decline. The less visible actions of governments include incremental changes in revenues (taxes) and expenditures that transfer money from wealthier (growing) locations to other poorer places. By improving services in the latter, and reducing the gap in regional incomes, these actions reduce the variance in urban growth rates. The geography of who has political jurisdiction over which tax bases and expenditures is quite important. The federal government can transfer funds interregionally (that is, from one column to another in Table 1). Taxes generated in the high-income provinces of Ontario and Alberta are transferred to the Atlantic region or Quebec by direct transfers or through payments for programs. The provinces may also redistribute income, but only within the province, usually from higher-income metropolitan areas to poorer rural areas and small towns. In other words, the provinces transfer money up and down the columns in Table 1. In this way, the relative importance of government spending at the federal or provincial level affects the spatial pattern of redistribution among cities, hence the variation in income (and urban growth). In summary, a reduced role for the federal government leads to greater income variation among regions; a reduced role for the provinces leads to more variation by city size. Consider the trends in federal government expenditures over the last 30 years (Figure 15a). For the most part, federal revenues have remained more or less stable over the study period, ranging from 15% to 18% of GDP, increasing in good times and declining during recessions. A wider variation occurs in the level of federal expenditures: this line records the entire trauma of debt and recovery between 1974 and As government revenues flattened in the aftermath of the first oil crisis, expenditures continued to soar, peaking at 23% of GDP in The growth occurred first in transfers to business (1974) and then in those to persons (1982). When the expenditures were finally reduced in the early 1990s, the federal government s direct expenditures (the civil service) and transfers to persons and to provinces were affected. By 2001 the transfers to provinces had declined to the 1960 level of 3%, down onethird from the peak of 4.5% in The federal government s ability to redistribute funds regionally is now about the same as it was in 1970, but has been reduced by 30% since At the same time, demands on the provinces were growing rapidly (Figure 15b). Provincial revenues and expenditures doubled from about 10% of GDP in 1960 (equivalent to 60% of the federal government level) to 21% in 2001 (115% of the federal level). Meanwhile, the level of transfers from the federal government rose and then declined, returning to the same level as Most of the growth went toward the purchase of goods and services, notably health care, although municipalities obtained modestly larger shares as well, at least until the cutbacks in the 1990s. Most of the increase in health care spending was raised within the
49 The Canadian Urban System, Figure 15a: Federal Government Expenditures, Figure 15b: Provincial Government Expenditures,
50 38 The Canadian Urban System, provinces, and when the federal government reduced its contributions to the provinces in the 1990s, the latter found themselves squeezed between growing health care costs and shrinking revenues from transfers. There was not much money left for municipalities; their share grew from 2.1% in 1960 to 4.3% of GDP in 1992 but declined to 2.8% by In sum, the ability of the provinces to redistribute income from larger to smaller cities has increased over the period as the taxes raised in the larger cities increased, but the pressures for expanded social services has also meant that provinces targeted places according to their health and education needs. Without any growth in federal government expenditures, the ability to compensate for regional disparities in income and levels of service remains unchanged. At the same time, however, the expenditures by provinces have increased emphasizing the disparities among provincial tax bases. Figure 16 shows the diversity in revenue sources for provinces and regions. Each bar on the graph displays a different combination of incomes; this, in turn, implies a different pattern of economic growth as local and national economies evolve. Income taxes are perhaps the most similar, ranging from 15 to 20% (Alberta, the Atlantic region) to 30% (Quebec), with the share of revenue derived in this way increasing in all jurisdictions. Indirect taxes are also very similar, except for Alberta, which has no sales tax. In other provinces, the share ranges from 30% (Manitoba, Saskatchewan, the Atlantic provinces) to 40% (Ontario), and again the share has been increasing over time. Corporation taxes typically generate less than 5% of total revenue, except for Alberta and Ontario. Social insurance charges are even smaller. The major sources of provincial variation are the level of federal transfers and the flow of revenue from resources. Part of the transfers go to all provinces to pay for health and education; but equalization payments are restricted to the poorer provinces as a compensation for their weak revenue base. Alberta, British Columbia (until recently), and Ontario typically do not share in the latter, so transfers contribute only 10 to 15% of their provincial revenue. Manitoba, Saskatchewan, and Quebec receive an additional 10 to 15% of revenue due to equalization; while the Atlantic region obtains 40 to 50% of provincial revenue from the federal government. In every region the share of these transfers has declined over time, as the federal government has cut back; hence the compensating increases in income and sales taxes. Resource revenues vary widely as well; generating only 5 to 10% for Ontario and Quebec (the core), but ranging from 10% in the Atlantic region to 30% in Alberta. In the past, as much as 60% of Alberta s revenue has come from gas and oil royalties hence the low levels of taxation. To generalize: Quebec is the high-tax province, despite the equalization payments, but provides a wide range of services. Ontario obtains more corporate taxes. The western provinces have substantial resource revenues, especially Alberta. The Atlantic region lives or dies through federal largess. Whatever the source, these provincial revenues pay for employment in public services (20% of employment) and for infrastructure. The overall decline in the flow of federal funds inevitably increases the variation in growth rates among the regions.


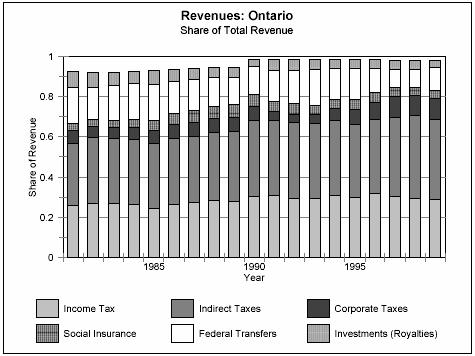
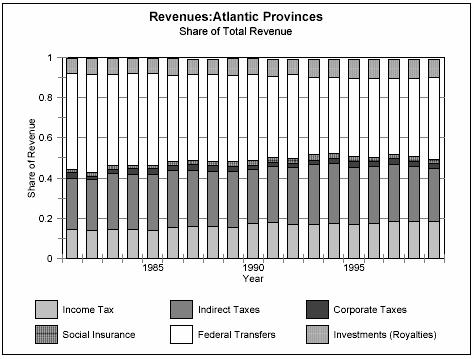
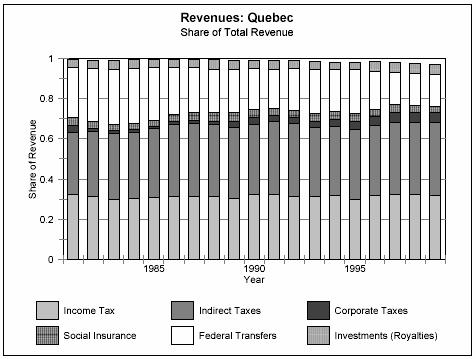
51 The Canadian Urban System, Figure 16: Provincial Revenues,
The Canadian Urban System, Responses to a Changing World
 Centre for Urban and Community Studies Research Bulletin # 18 September 2003 The Canadian Urban System, 1971-2001 Responses to a Changing World by Jim Simmons and Larry S. Bourne A summary of Research
2001 Census: analysis series
 Catalogue no. 96F0030XIE2001006 2001 Census: analysis series Profile of the Canadian population by mobility status: Canada, a nation on the move This document provides detailed analysis of the 2001 Census
Demographic and Socio-economic Influences on Housing Demand. n After averaging 154,000 from 1991 to 2001,
 Chapter 4 Demographic and Socio-economic Influences on Housing Demand Fast Facts n After declining during the 28-9 recession, employment grew in 21 and 211, reducing the national unemployment rate from
Handout 1: Graphing Immigration Introduction Graph 1 Census Year Percentage of immigrants in the total population
 2001 Census Results Teacher s Kit Activity 10: Immigration and Citizenship Suggested Level: Intermediate Subjects: Mathematics, Geography, History, Citizenship Overview In this activity, students complete
Understanding the Occupational Typology of Canada s Labour Force
 Understanding the Occupational Typology of Canada s Labour Force Author: Taylor Brydges, Taylor.Brydges@rotman.utoronto.ca p.416.946.7300 f.416.946.7606 Martin Prosperity Institute Joseph L. Rotman School
Dependence on cars in urban neighbourhoods by Martin Turcotte
 Life in metropolitan areas Dependence on cars in urban neighbourhoods by Martin Turcotte To get around easily in today s big cities, especially in their sparsely populated suburbs, access to a private
The Canadian Urban System in 2011: Looking Back and Projecting Forward
 The Canadian Urban System in 2011: Looking Back and Projecting Forward Jim Simmons and Larry S. Bourne Research Paper 228 Cities Centre, University of Toronto August, 2013 ISSN 0316-0068; ISBN-13 978-0-7727-1491-6
Annual Demographic Estimates: Subprovincial Areas, July 1, 2016
 Catalogue no. 91-214-X ISSN 1920-8154 Annual Demographic Estimates: Subprovincial Areas, July 1, 2016 by Demography Division Release date: March 8, 2017 How to obtain more information For information about
MIGRATION BY THE NUMBERS ONEDC MIGRATION PRESENTATION 6 OCTOBER, SUDBURY CHARLES CIRTWILL, PRESIDENT & CEO, NORTHERN POLICY INSTITUTE
 MIGRATION BY THE NUMBERS ONEDC MIGRATION PRESENTATION 6 OCTOBER, 216. SUDBURY CHARLES CIRTWILL, PRESIDENT & CEO, NORTHERN POLICY INSTITUTE Northern Ontario s Immigration Trends in Context 2 Ontario Immigration
State of the West 2003
 State of the West 2003 Western Canadian Demographic and Economic Trends Robert Roach May 2003 F O U N D A T I O N BUILDING THE NEW WEST This report is part of the Canada West Foundation s Building the
Will small regions become immigrants choices of residence in the. future?
 Will small regions become immigrants choices of residence in the future? By: Siyu Wang Student No. 6698166 Major paper presented to the department of economics of the University of Ottawa in partial fulfillment
HOUSING RESEARCH REPORT. Household Mobility and Housing Choices
 HOUSING RESEARCH REPORT Household Mobility and Housing Choices CMHC helps Canadians meet their housing needs. Canada Mortgage and Housing Corporation (CMHC) has been helping Canadians meet their housing
Effect of Immigration on Demographic Structure
 PSC Discussion Papers Series Volume 16 Issue 9 Article 1 10-1-2002 Effect of Immigration on Demographic Structure Roderic Beaujot University of Western Ontario, rbeaujot@uwo.ca Follow this and additional
RECENT DEMOGRAPHIC TRENDS
 RECENT DEMOGRAPHIC TRENDS IN REGINA AND SASKATCHEWAN Presentation to the Emerging Business Trends Conference Regina Chamber of Commerce November 14, 2012 Doug Elliott Sask Trends Monitor 444 19th Avenue
2016 Census: Release 5 Immigration and ethnocultural diversity, Housing and the Aboriginal population
 2016 Census: Release 5 Immigration and ethnocultural diversity, Housing and the Aboriginal population Dr. Doug Norris Senior Vice President and Chief Demographer November 2, 2017 Today s presenter Dr.
Metro Vancouver Backgrounder Metro 2040 Residential Growth Projections
 Metro Vancouver 2040 - Backgrounder Metro 2040 Residential Growth Projections Purpose Metro Vancouver 2040 Shaping our Future, Metro s draft regional growth strategy, was released for public review in
Artists in Large Canadian Cities
 Artists in Large Canadian Cities http://www.hillstrategies.com info@hillstrategies.com Statistical insights on the arts, Vol. 4 No. 4 Hill Strategies Research Inc., March 2006 ISBN 0-9738391-6-3; Research
STRENGTHENING RURAL CANADA: Fewer & Older: Population and Demographic Crossroads in Rural Saskatchewan. An Executive Summary
 STRENGTHENING RURAL CANADA: Fewer & Older: Population and Demographic Crossroads in Rural Saskatchewan An Executive Summary This paper has been prepared for the Strengthening Rural Canada initiative by:
The Impact of Interprovincial Migration on Aggregate Output and Labour Productivity in Canada,
 The Impact of Interprovincial Migration on Aggregate Output and Labour Productivity in Canada, 1987-26 Andrew Sharpe, Jean-Francois Arsenault, and Daniel Ershov 1 Centre for the Study of Living Standards
Catalogue no. of Quebec
 Catalogue no. A of Quebec How to obtain more information For information about this product or the wide range of services and data available from Statistics Canada, visit our website at www.statcan.gc.ca,
OBSERVATION. TD Economics A DEMOGRAPHIC OVERVIEW OF ABORIGINAL PEOPLES IN CANADA
 OBSERVATION TD Economics May 1, 213 A DEMOGRAPHIC OVERVIEW OF ABORIGINAL PEOPLES IN CANADA Highlights New data from the National Household Survey (NHS) show that just over 1.4 million people identified
Greater Golden Horseshoe
 Greater Golden Horseshoe 2017 REGIONAL MARKET ACTIVITY (AS AT Q3 2016) TORONTO - OVERVIEW The Toronto Census Metropolitan Area ( CMA ) is comprised of the City of Toronto, which is the capital of the province
Metropolitan Characteristics and Immigrant Entrepreneurship. Eric Fong, Junmin Jeong, Julie Jo. University of Toronto
 Metropolitan Characteristics and Immigrant Entrepreneurship Eric Fong, Junmin Jeong, Julie Jo University of Toronto October, 2012 It has become more common to find immigrant entrepreneurs not only in immigrant
HUMAN CAPITAL LAW AND POLICY
 VOLUME 7, ISSUE 1, MARCH 17 IMMIGRATION IN BC: A COMPLEX TAPESTRY HIGHLIGHTS Immigration remains a key element in building a skilled workforce in BC and will play an even more significant role in the coming
how neighbourhoods are changing A Neighbourhood Change Typology for Eight Canadian Metropolitan Areas,
 how neighbourhoods are changing A Neighbourhood Change Typology for Eight Canadian Metropolitan Areas, 1981 2006 BY Robert Murdie, Richard Maaranen, And Jennifer Logan THE NEIGHBOURHOOD CHANGE RESEARCH
Catalogue no X. Measuring Crime in Canada: Introducing the Crime Severity Index and Improvements to the Uniform Crime Reporting Survey
 Catalogue no. 85-004-X Measuring Crime in Canada: Introducing the Crime Severity Index and Improvements to the Uniform Crime Reporting Survey 2009 How to obtain more information For information about this
Chapter One: people & demographics
 Chapter One: people & demographics The composition of Alberta s population is the foundation for its post-secondary enrolment growth. The population s demographic profile determines the pressure points
Demographics. Chapter 2 - Table of contents. Environmental Scan 2008
 Environmental Scan 2008 2 Ontario s population, and consequently its labour force, is aging rapidly. The province faces many challenges related to a falling birth rate, an aging population and a large
CANADIAN CITIES IN TRANSITION: NEW SOURCES OF URBAN DIFFERENCE
 Dela 21 2004 97-107 CANADIAN CITIES IN TRANSITION: NEW SOURCES OF URBAN DIFFERENCE Larry S. Bourne Department of Geography, University of Toronto, Toronto ON M5S 3G3, Canada e-mail: Bourne@geog.utoronto.ca
STRENGTHENING RURAL CANADA: Fewer & Older: The Coming Demographic Crisis in Rural Ontario
 STRENGTHENING RURAL CANADA: Fewer & Older: The Coming Demographic Crisis in Rural Ontario An Executive Summary 1 This paper has been prepared for the Strengthening Rural Canada initiative by: Dr. Bakhtiar
Urbanization and Migration Patterns of Aboriginal Populations in Canada: A Half Century in Review (1951 to 2006)
") Urbanization and Migration Patterns of Aboriginal Populations in Canada: A Half Century in Review (1951 to 2006) By Mary Jane Norris and Stewart Clatworthy Based on paper prepared with the support of the
Urbanization and Migration Patterns of Aboriginal Populations in Canada: A Half Century in Review (1951 to 2006) By Mary Jane Norris and Stewart Clatworthy Based on paper prepared with the support of the
Greater Moncton in The Role of Immigration to Support a Sustainable Urban Economy. NewConversationsNB.com
 Greater Moncton in 2030 The Role of Immigration to Support a Sustainable Urban Economy Prepared by: David Campbell, Jupia Consultants Inc. for the New Brunswick Multicultural Council March 2018 NewConversationsNB.com
COMMUTE DISTANCE AND POLICY IMPLICATIONS Sundar Damodaran, Ph.D., P.Eng.
 Introduction COMMUTE DISTANCE AND POLICY IMPLICATIONS, Ph.D., P.Eng. Commute distance is the distance between a worker's place of residence and his/her usual place of work. Nationally, Census data is the
Evolving Headquarters Geographies. Canada s Top 1000 Firms, Murray D. Rice UNT Geography. AAG 2011 Annual Meeting Seattle, Washington
 Evolving Headquarters Geographies Canada s Top 1000 Firms, 1986-2006 Murray D. Rice AAG 2011 Annual Meeting Seattle, Washington Headquarters (HQ) facilities are important, but under-studied, economic activities
The New Canada. Presented by: Dr. Darrell Bricker
 The New Canada Presented by: Dr. Darrell Bricker 2018 Darrell Bricker. All rights reserved. Contains Proprietary information and insights may not be disclosed or reproduced without the prior written consent
Conodo's Population Demographic Perspectives
 Conodo's Population Demographic Perspectives Canada's Population Demographic Perspectives One of a series from the 1976 Census of Canada Introduction The 1976 Census of Canada enumerated 23 million people,
Assessment of Demographic & Community Data Updates & Revisions
 Assessment of Demographic & Community Data Updates & Revisions Scott Langen, Director of Operations McNair Business Development Inc. P: 306-790-1894 F: 306-789-7630 E: slangen@mcnair.ca October 30, 2013
The Implications of New Brunswick s Population Forecasts
 The Implications of New Brunswick s Post-Secondary Education, Training and Labour September 2017 In spring 2017, two papers (i) New Brunswick Population Snapshot and (ii) Small Area Population Forecasts
2018 Greater Vancouver Economic Scorecard. Dr. Daniel F. Muzyka Immediate Past President and Chief Executive Officer The Conference Board of Canada
 2018 Greater Vancouver Economic Scorecard Dr. Daniel F. Muzyka Immediate Past President and Chief Executive Officer The Conference Board of Canada Agenda Regional scorecard purpose Scorecard results Greater
VIVRE ENSEMBLE AVEC LA DIVERSITÉ, NOT THE CASE FOR MANY MUNICIPALITIES: THE COUNTRY S LEAST DIVERSE PLACES AND CANADIAN ATTITUDES TOWARDS PLURALISM
 VIVRE ENSEMBLE AVEC LA DIVERSITÉ, NOT THE CASE FOR MANY MUNICIPALITIES: THE COUNTRY S LEAST DIVERSE PLACES AND CANADIAN ATTITUDES TOWARDS PLURALISM CANADIAN INSTITUTE OF IDENTITIES AND MIGRATION JANUARY,
Centre for Urban and Community Studies. Research Bulletin # 33. February New Urban Divides
 Centre for Urban and Community Studies Research Bulletin # 33 February 2007 New Urban Divides How economic, social, and demographic trends are creating new sources of urban difference in Canada Larry S.
Population Projection Methodology and Assumptions
 Population Projection Methodology and Assumptions Introduction Population projections for Alberta and each of its 19 census divisions are available for the period 217 to 241 by sex and single year of age.
Urbanization and Migration Patterns of Aboriginal Populations in Canada: A Half Century in Review (1951 to 2006)
") Urbanization and Migration Patterns of Aboriginal Populations in Canada: A Half Century in Review (1951 to 2006) By Mary Jane Norris Norris Research Inc. And Stewart Clatworthy** Four Directions Project
Urbanization and Migration Patterns of Aboriginal Populations in Canada: A Half Century in Review (1951 to 2006) By Mary Jane Norris Norris Research Inc. And Stewart Clatworthy** Four Directions Project
Economic and Demographic Trends in Saskatchewan Cities
 Economic and Demographic Trends in Saskatchewan Cities Presentation to the: Association of Professional Community Planners of Saskatchewan Doug Elliott Tel: 306-522-5515 Sask Trends Monitor Fax: 306-522-5838
Land Supply: Scarce means Dense and Expensive
 Daedalus Analytics Incorporated Written by David Baxter Copyright 2016 Daedalus Analytics Incorporated Way back in the early 1970s the Greater Vancouver Regional District (GVRD) was involved in a long
Changes in Wage Inequality in Canada: An Interprovincial Perspective
 s u m m a r y Changes in Wage Inequality in Canada: An Interprovincial Perspective Nicole M. Fortin and Thomas Lemieux t the national level, Canada, like many industrialized countries, has Aexperienced
Juristat article. Police-reported crime statistics in Canada, by Shannon Brennan. Component of Statistics Canada catalogue no.
 Component of Statistics Canada catalogue no. 85-002-X Juristat Juristat article Police-reported crime statistics in Canada, 2011 by Shannon Brennan Released on July 24, 2012 How to obtain more information
Beyond the New Deal for Cities
 Centre for Urban and Community Studies Research Bulletin #21 March 2004 Beyond the New Deal for Cities Confronting the Challenges of Uneven Urban Growth by Larry S. Bourne Department of Geography and Programme
New Brunswick Population Snapshot
 New Brunswick Population Snapshot 1 Project Info Project Title POPULATION DYNAMICS FOR SMALL AREAS AND RURAL COMMUNITIES Principle Investigator Paul Peters, Departments of Sociology and Economics, University
Article. W Visible Minority Women. by Tina Chui and Hélène Maheux. July 2011
 Component of Statistics Canada Catalogue no. 89-503-X Women in Canada: A Gender-based Statistical Report Article W Visible Minority Women by Tina Chui and Hélène Maheux July 2011 How to obtain more information
Crime Statistics in Canada, 2003
 Statistics Canada Catalogue no. 85-2-XIE, Vol. 24, no. 6 Crime Statistics in Canada, 23 by Marnie Wallace Highlights The national crime rate increased by 6% in 23, the first substantial increase in over
Next Cities The Top Canadian Hotspots for Young, Talented Workers
 Next Cities The Top Canadian Hotspots for Young, Talented Workers 2009-2010 Canada Version WHAT IS A NEXT CITY? Next Cities are places with the assets and amenities that attract and keep a young, educated
The North American Urban System: The Limits to Continental Integration
 Centre for Urban and Community Studies UNIVERSITY OF TORONTO The North American Urban System: The Limits to Continental Integration Jim Simmons and Shizue Kamikihara with the assistance of Larry Bourne
Canada at 150 and the road ahead A view from Census 2016
 Canada at 150 and the road ahead A view from Census 2016 Dr. Doug Norris Senior Vice President and Chief Demographer 2017 Environics Analytics User Conference November 8, 2017 Canada continues to lead
MAJOR RELEASES OTHER RELEASES NEW PRODUCTS 7
 Catalogue 11-001E (Français 11-001F) ISSN 0827-0465 Thursday, September 5, Released at 8:30 am Eastern time MAJOR RELEASES Building permits, 2 The value of building permits reached an unprecedented high
Re s e a r c h a n d E v a l u a t i o n. L i X u e. A p r i l
 The Labour Market Progression of the LSIC Immigrants A Pe r s p e c t i v e f r o m t h e S e c o n d Wa v e o f t h e L o n g i t u d i n a l S u r v e y o f I m m i g r a n t s t o C a n a d a ( L S
STRENGTHENING RURAL CANADA: Fewer & Older: Population and Demographic Challenges Across Rural Canada A Pan-Canadian Report
 STRENGTHENING RURAL CANADA: Fewer & Older: Population and Demographic Challenges Across Rural Canada A Pan-Canadian Report This paper has been prepared for the Strengthening Rural Canada initiative by:
Aboriginal People in Canadian Cities,
 Aboriginal People in Canadian Cities, 1951 1996 Guide for Research in Summer, 2002 Evelyn J. Peters Department of Geography University of Saskatchewan 9 Campus Drive Saskatoon, SK S7J 3S9 (306) 966-5639
Post-Secondary Education, Training and Labour September Profile of the New Brunswick Labour Force
 Post-Secondary Education, Training and Labour September 2018 Profile of the New Brunswick Labour Force Contents Population Trends... 2 Key Labour Force Statistics... 5 New Brunswick Overview... 5 Sub-Regional
'Stop being so humble' urban expert urges Canadian
 1 of 5 4/15/2009 1:20 PM 'Stop being so humble' urban expert urges Canadian cities BY SHANNON PROUDFOOT, CANWEST NEWS SERVICE APRIL 5, 2009 Richard Florida, director of the Martin Prosperity Institute
Population Projection Alberta
 Population Projection Alberta 215 241 Solid long term growth expected Alberta s population is expected to expand by about 2.1 million people by the end of the projection period, reaching just over 6.2
Alberta Population Projection
 Alberta Population Projection 213 241 August 16, 213 1. Highlights Population growth to continue, but at a moderating pace Alberta s population is expected to expand by 2 million people through 241, from
Preliminary Demographic Analysis of First Nations and Métis People
 APPENDIX F Preliminary Demographic Analysis of First Nations and Métis People A Background Paper Prepared for the Regina Qu Appelle Health Region Working Together Towards Excellence Project September 2002
NORTHERN ONTARIO IMMIGRATION PROFILE. Michael Haan & Elena Prokopenko
 NORTHERN ONTARIO IMMIGRATION PROFILE Michael Haan & Elena Prokopenko FALL 2015 This Employment Ontario project is funded by the Ontario government The views expressed in this document do not necessarily
Rural Manitoba Profile:
 Rural Manitoba Profile: A Ten-year Census Analysis (1991 2001) Prepared by Jennifer de Peuter, MA and Marianne Sorensen, PhD of Tandem Social Research Consulting with contributions by Ray Bollman, Jean
MONITORING THE METROS: A MUCH-AWAITED 2011 UPDATE
 THE METRO BEAT TD Economics MONITORING THE METROS: A MUCH-AWAITED 211 UPDATE The 211 National Household Survey release on May 8 th provides a demographic and diversity update across Canada. This is the
Demographic and Economic Trends and Issues Canada, Ontario and the GTA
 Demographic and Economic Trends and Issues Canada, Ontario and the GTA Presented by Tom McCormack The Centre for Spatial Economics www.c4se.com Presented to Professional Marketing Research Society Toronto
SSRL Evaluation and Impact Assessment Framework
 SSRL Evaluation and Impact Assessment Framework Taking the Pulse of Saskatchewan: Crime and Public Safety in Saskatchewan October 2012 ABOUT THE SSRL The Social Sciences Research Laboratories, or SSRL,
Focus Canada Fall 2018
 Focus Canada Fall 2018 Canadian public opinion about immigration, refugees and the USA As part of its Focus Canada public opinion research program (launched in 1976), the Environics Institute updated its
We Are All Border States: The importance of cross-border trade
 We Are All Border States: The importance of cross-border trade 12th Annual International Legislators Forum Friday, June 22, 2012 Grand Forks, ND Mike Flaherty Senior Trade Commissioner Tim Cipullo Consul
WHY IS TORONTO DRAWING NEW WARD BOUNDARIES? Ward Population Background Brief. Revised, July 2015
 WHY IS TORONTO DRAWING NEW WARD BOUNDARIES? Ward Population Background Brief Revised, July 2015 CONTENTS Why is Toronto Drawing New Ward Boundaries?... 2 Alignment with Federal and Provincial Electoral
2011 National Opinion Poll: Canadian Views on Asia
 2011 National Opinion Poll: Canadian Views on Asia Table of Contents Methodology Key Findings Section 1: Canadians Mental Maps Section 2: Views of Canada-Asia Economic Relations Section 3: Perceptions
New Immigrants Seeking New Places: The Role of Policy Changes in the Regional Distribution of New Immigrants to Canada
 New Immigrants Seeking New Places: The Role of Policy Changes in the Regional Distribution of New Immigrants to Canada by Aneta Bonikowska, Feng Hou, Garnett Picot Social Analysis Division, Statistics
Greater Golden Horseshoe Transportation Plan
 Greater Golden Horseshoe Transportation Plan Socio-Economic Profile Executive Summary October 2017 PREPARED BY Urban Strategies Inc. and HDR for the Ministry of Transportation SOCIO-ECONOMIC PROFILE -
Regional Economic Report
 Regional Economic Report April June 2016 September 14, 2016 Outline I. Regional Economic Report II. Results April June 2016 A. Economic Activity B. Inflation C. Economic Outlook III. Final Remarks Regional
Aboriginal Peoples in Canada: First Nations People, Métis and Inuit
 Aboriginal Peoples in Canada: First Nations People, Métis and Inuit 2011 National Household Survey (NHS) Social and Aboriginal Statistics September 16, 2013 Main analytical document Aboriginal Peoples
WORKFORCE ATTRACTION AS A DIMENSION OF REGIONAL COMPETITIVENESS
 RUR AL DE VELOPMENT INSTITUTE WORKFORCE ATTRACTION AS A DIMENSION OF REGIONAL COMPETITIVENESS An Analysis of Migration Across Labour Market Areas June 2017 WORKFORCE ATTRACTION AS A DIMENSION OF REGIONAL
Provincial and Territorial Culture Indicators, 2010 to 2014
 Catalogue no. 13-604-M ISBN 978-0-660-04937-3 Income and Expenditure Accounts Technical Series Provincial and Territorial Culture Indicators, 2010 to 2014 by Eric Desjardins Release date: May 11, 2016
WHY IS TORONTO DRAWING NEW WARD BOUNDARIES? Ward Population Background Brief. November 2014
 WHY IS TORONTO DRAWING NEW WARD BOUNDARIES? Ward Population Background Brief November 2014 TORONTO WARD BOUNDARY REVIEW DRAW THE LINES Why is Toronto Drawing New Ward Boundaries? Toronto has been managed
65. Broad access to productive jobs is essential for achieving the objective of inclusive PROMOTING EMPLOYMENT AND MANAGING MIGRATION
 5. PROMOTING EMPLOYMENT AND MANAGING MIGRATION 65. Broad access to productive jobs is essential for achieving the objective of inclusive growth and help Turkey converge faster to average EU and OECD income
Focus Canada Winter 2018 Canadian public opinion about immigration and minority groups
 Focus Canada Winter 2018 Canadian public opinion about immigration and minority groups As part of its Focus Canada public opinion research program, the Environics Institute partnered with the Canadian
Trafficking in persons in Canada, 2016
 Catalogue no. 85-005-X ISSN 1925-3427 Juristat Bulletin Quick Fact Trafficking in persons in Canada, 2016 by Dyna Ibrahim Canadian Centre for Justice Statistics Release date: June 27, 2018 How to obtain
Introduction HIGHLIGHTS
 Rural and Small Town Canada Analysis Bulletin Catalogue no. 21-6-XIE Vol. 3, No.5 (January 22) INFORMATION AND COMMUNICATION TECHNOLOGIES IN RURAL CANADA Louise M c Laren, Statistics Canada HIGHLIGHTS
A Profile of CANADiAN WoMeN. NorTHerN CoMMuNiTieS
 A Profile of CANADiAN WoMeN in rural, remote AND NorTHerN CoMMuNiTieS DeMogrAPHiC Profile in 2006, the last census year for which data are currently available, approximately 2.8 million women resided in
Research Proposal: Is Cultural Diversity Good for the Economy?
 Wesley Sze ECON 495 9 November 2010 Research Proposal: Is Cultural Diversity Good for the Economy? 1 Research Question I would like to examine the economic consequences of increased cultural diversity
STRENGTHENING RURAL CANADA: Fewer & Older: The Coming Population and Demographic Challenges in Rural Newfoundland & Labrador
 STRENGTHENING RURAL CANADA: Fewer & Older: The Coming Population and Demographic Challenges in Rural Newfoundland & Labrador An Executive Summary 1 This paper has been prepared for the Strengthening Rural
INTO THE 21 ST CENTURY: CANADA, COMMODITIES AND THE GLOBAL ECONOMY
 INTO THE 21 ST CENTURY: CANADA, COMMODITIES AND THE GLOBAL ECONOMY Presentation for Fields on Wheels Conference, Winnipeg, Manitoba, November 9 th, 2012 Outline Short Run Economic Environment Quick Economic
Comparative. Economic Analysis. Québec City Metropolitan Region
 2008 Comparative Economic Analysis Québec City Metropolitan Region Prepared by the Conference Board of Canada on behalf of POLE Québec Chaudière-Appalaches and the Québec City Metropolitan Community (CMQ)
Situational Analysis: Peterborough & the Kawarthas
 Canadian Centre for Economic Analysis Toronto Situational Analysis: February 2018 Geospatial Data Analysis Group ISBN: 978-1-989077-03-0 c 2018 Canadian Centre for Economic Analysis The Canadian Centre
Understanding the potential impacts of technological trends across Canada
 June 2017 data insights Automation Across the Nation: Understanding the potential impacts of technological trends across Canada Authors CREIG LAMB Policy Advisor Creig is a Policy Advisor at the Brookfield
RECENT IMMIGRANTS IN METROPOLITAN AREAS. Regina. A Comparative Profile Based on the 2001 Census April 2005
 RECENT IMMIGRANTS IN METROPOLITAN AREAS Regina A Comparative Profile Based on the 2001 Census April 2005 Produced by Strategic Research and Statistics For additional copies, please visit our website: Internet:
Guelph 3Ts Reference Report
 Guelph 3Ts Reference Report Benchmarking Project: Ontario Competes Ontario in the Creative Age April 2009 REF. 2009-BMONT-009 Contents Introduction... 3 Technology Results... 4 Talent Results... 5 Tolerance
The migration ^ immigration link in Canada's gateway cities: a comparative study of Toronto, Montreal, and Vancouver
 Environment and Planning A 2006, volume 38, pages 1505 ^ 1525 DOI:10.1068/a37246 The migration ^ immigration link in Canada's gateway cities: a comparative study of Toronto, Montreal, and Vancouver Feng
International Migration Continues to Fuel Greater Vancouver s Population Growth and Multicultural Change
 GVRD Policy & Planning Department February 2003 2001 CENSUS BULLETIN #6 IMMIGRATION International Migration Continues to Fuel Greater Vancouver s Population Growth and Multicultural Change According to
Tourism Snapshot A Monthly Monitor of the Performance of Canada s Tourism Industry
 Tourism Snapshot A Monthly Monitor of the Performance of Canada s Tourism Industry December Volume 13, Issue 12 www.destinationcanada.com Tourism Snapshot December 1 KEY HIGHLIGHTS In, international arrivals
Changing patterns of core-periphery migration in Canada,
 Prairie Perspectives 1 Changing patterns of core-periphery migration in Canada, 1961 1991 Siaw Akwawua Luther College, University of Regina Abstract: In this paper, census data for the period 1961 to 1991
Tourism Snapshot A Monthly Monitor of the Performance of Canada s Tourism Industry
 Tourism Snapshot A Monthly Monitor of the Performance of Canada s Tourism Industry December Volume 13, Issue 12 www.destinationcanada.com Tourism Snapshot December 1 KEY HIGHLIGHTS In, international arrivals
DEMOGRAPHIC AND ECONOMIC STATISTICS
 DEMOGRAPHIC AND ECONOMIC STATISTICS ABOUT IMMIGRATION IN SASKATCHEWAN Prepared for the: Association for Financial Professionals Regina March 17, 2016 Doug Elliott Sask Trends Monitor 444 19th Avenue Regina,
The impact of Chinese import competition on the local structure of employment and wages in France
 No. 57 February 218 The impact of Chinese import competition on the local structure of employment and wages in France Clément Malgouyres External Trade and Structural Policies Research Division This Rue
Culture Plan Progress Report II. Toronto Culture, February 2008
 Culture Plan Progress Report II Toronto Culture, February 2008 Progress Report II Highlights 2008 marks the fifth year since the Culture Plan for the Creative City, a ten-year strategy for placing culture