2016 Census: Release 5 Immigration and ethnocultural diversity, Housing and the Aboriginal population
|
|
|
- Phyllis Andrews
- 6 years ago
- Views:
Transcription


1 2016 Census: Release 5 Immigration and ethnocultural diversity, Housing and the Aboriginal population Dr. Doug Norris Senior Vice President and Chief Demographer November 2, 2017

2 Today s presenter Dr. Doug Norris Senior Vice President and Chief Demographer 2
3 housekeeping Listen-only mode for attendees Questions at the end. Use the Webex Q&A Feature in your Interface Technical difficulties? Presentation deck will be available environicsanalytics.com/webcasts 3

4 Long-form census data 1. Data in this release are from the census long form, a 25 percent sample of households 2. The universe for the data is the population in private households 4

5 Overview 1. Cultural Diversity Ethnic Origin/Ancestry Immigration/Citizenship Visible Minorities 2. Aboriginal Population 3. Housing 5

6 Ethnicity Question 6
7 250 Ethnic origins reported by Canadians Top Ethnic Origins, Single and Multiple Responses, 2016, Canada Canadian count 11,136,000 % multiple count % multiple 42.2 First Nations 1,525, English 6,320, East Indian 1,374, Scottish 4,799, Ukrainian 1,359, French 4,670, Dutch 1,111, Irish 4,627, Polish 1,106, German 3,322, Filipino 837, Chinese 1,769, Russian 622, Italian 1,588, Métis 600, Total Multiple 41.1%
8 A mix of first, second and third generations Top Ethnic Origins by Generation, 2016, Canada First generation Second generation Third generation Filipino % Ukrainian Chinese English East Indian Scottish Russian Irish Italian French Polish First Nations Dutch Canadian German Métis
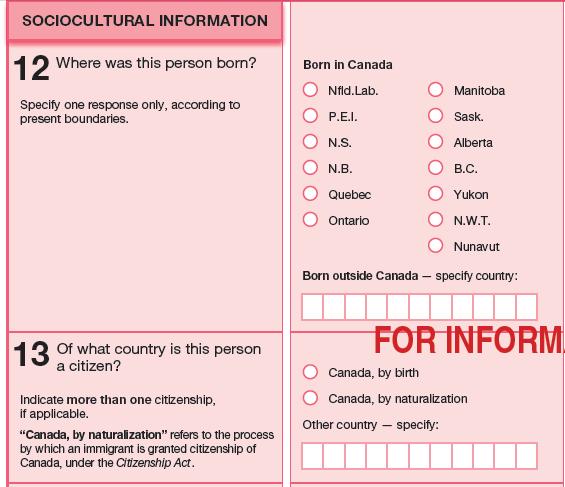
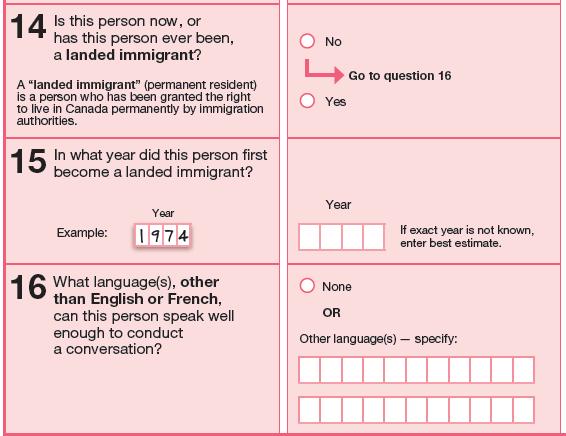
9 Immigration Questions 9

10 Generation Question 10
11 Immigration to Canada has averaged over 250,000 in last five years Immigration to Canada, , , , , , , , ,000 50,000 Count Percent of Population 6% 5% 4% 3% 2% 1% 0 0% Source: Citizenship and immigration Canada
12 In recent years, close to 60% of Immigrants were Economic class Distribution (in percentage) of Immigrants Living in Canada, by Admission Category and Year of Immigration, % 60% 50% 40% 30% 20% 10% % Economic immigrants % Immigrants sponsored by family % Refugees % Other immigrants 0% Source: Citizenship and immigration Canada
13 Immigrants now at highest level since 1931 Number and Proportion of Foreign-born Population in Canada, 1871 to 2036 Number Percentage 14,000,000 12,000,000 10,000,000 8,000,000 6,000, % 25% 20% 15% 4,000,000 10% 2,000,000 5% ,540,830 Immigrants 356,000 Non-permanent residents 0% Source: Statistics Canada
14 number of immigrants will continue to increase Number and Proportion of Foreign-born Population in Canada, 1871 to ,000,000 12,000,000 10,000,000 8,000,000 6,000, Number Percentage Actual 23.7 Projected % 25% 20% 15% 4,000,000 10% 2,000,000 5% ,540,830 Immigrants 356,000 Non-permanent residents 0% Source: Statistics Canada Diversity projections
15 Nearly One third of Immigrants have been in Canada less than 10 years Immigrants by Period of Immigration, Canada, 2011 Before % 12.1% 19.7% 12.3% 14.0% 16.1% 1,941, ,600 1,486, ,900 1,056,100 1,212, % 100.0% 7,540,830 Immigrants 356,000 Non-permanent residents
16 Toronto and Vancouver account for half of all immigrants to Canada Distribution of Total Population and Total Immigrants, Canada, 2016 Percent of Canadian Population Percent of Immigrants in Canada Toronto CMA 17 % Toronto CMA 36 % Montreal CMA 12 Montreal CMA 12 Vancouver CMA 7 Vancouver CMA 13 Next largest 7 CMAs* 20 Next largest 7 CMAs* 20 Rest of Canada 45 Rest of Canada 19 * Calgary, Ottawa-Gatineau, Edmonton, Hamilton, Winnipeg, Kitchener, London
17 Immigrants spreading across the country Immigrants by Province, Canada Ontario Quebec Alberta British Columbia Manitoba Saskatchewan Nova Scotia New Brunswick Newfoundland and Labrador Prince Edward Island Immigrants , , , ,600 63,200 47,900 11,800 9,300 3,700 3,400 % Change from Total Canada : 1,212, % increase
18 12 larger CMAs areas have more than 20% of immigrants Percent of Population Immigrants, CMAs, 2016, Canada Toronto Vancouver Calgary Abbotsford - Mission Hamilton Winnipeg Edmonton Montréal Kitchener - Cambridge - Waterloo Windsor Guelph %
19 Africa surpasses Europe as source of immigrants Immigrants by Period of Immigration and Source Region (%), 2016, Canada Europe US and Oceania 6 South/Central America and Caribbean % Africa Asia Before
20 89 countries with 10,000 or more immigrants Top Countries for Total Immigrants, 100,000 or More, 2016 India 668,600 Percent in Last 10 Years 39.9 Iran 154,400 Percent in Last 10 Years 44.7 China Philippines United Kingdom United States Italy 649, , , , , Poland Germany Portugal Jamaica 146, , , , Hong Kong 208, Sri Lanka 132, Pakistan 202, Korea, South 123, Viet Nam 169, France 105, Total immigrants 7,540,825; percent in last 10 years 30.1 %
21 Large increases in immigrants from Iran, France and Philippines; 30,000 immigrants from Syria Number of Immigrants By Country of Origin, Canada Philippines India 188, , Percent change in Immigrants compared to Immigrants China 129, Iran 42, Pakistan 41, United States 33, Total Canada 1,212, % Syria 29, United Kingdom 24, France 24, Korea, South 21, Iraq 20,
22 Most immigrants speak English or French at home Percent of Immigrants Who Speak English or French Most Often or Regularly at Home, 2016, Canada Total on top % Speaks English or French regularly at home Speaks English or French most often at home All Immigrants Before
23 Over 40 percent are first or second generation Number and Percentage Change of Foreign-born Population by Generation, , Canada Population 2016 (Millions) 34.5 Percentage Growth Third generation or more % First generation % Second generation % 4.9 Total generations 13.9 First generation 7.0 Second generation 1.0 Third generation or more
24 Nearly 80% of Toronto Cma are first or second generation Percent of Population by Generation, Canada, 2016 CMAs of 200,000 pop or more Toronto % London % Vancouver Calgary Hamilton Edmonton First generation Second generation Total at end Oshawa Montréal Canada St. Catharines - Niagara Ottawa - Gatineau Windsor K-C-W Winnipeg Victoria Regina Saskatoon Halifax Sherbrooke Québec K-C-W is Kitchener - Cambridge - Waterloo
25 Incomes increase with length of time in Canada Median Individual Total Income, 2015 Canada $60,000 $50,000 $40,000 $30,000 $20,000 $10,000 Non-immigrants Before 1981 $ Age Groups Source: 2016 Census
26 Higher level of immigrants with low incomes, but declines with length of time in Canada Percent of Population in Low-income Households, 2015, Canada % % Total Non-immigrants Immigrants Before
27 Nearly 70% of Eligible immigrants are citizens Immigrants Before 2012 by Citizenship, 2016, Canada Citizens of Canada and at least one other country 16.8% Not Canadian citizens 14.2% Citizens of Canada only 69.0%
28 High level of citizenship after 15 years in Canada Percent of Immigrants with Canadian Citizenship, 2016, Canada % Total on top Canadian only Canadian and other Before

29 Population Group/Visible Minority Status 29
30 Nearly 1 in 5 are members of a visible minority group Number and Proportion of Visible Minority Population in Canada, 1981 to 2036 Millions Number 11.2 Percentage Actual 22.3 Projected % 35% 30% 25% 20% 15% 10% 5% % 2016 Visible Minority Population 7,674,580 Sources: Statistics Canada, 2016 Census of Population Release, and Diversity: Population Projections for Canada and its Regions, 2011 to 2036 (reference scenario).
31 Nearly 1 in 5 are members of a visible minority group Number and Proportion of Visible Minority Population in Canada, 1981 to 2036 Millions Number 11.2 Percentage Actual 22.3 Projected % 35% 30% 25% 20% 15% 10% 5% % 2016 Visible Minority Population 7,674,580 Sources: Statistics Canada, 2016 Census of Population Release, and Diversity: Population Projections for Canada and its Regions, 2011 to 2036 (reference scenario).
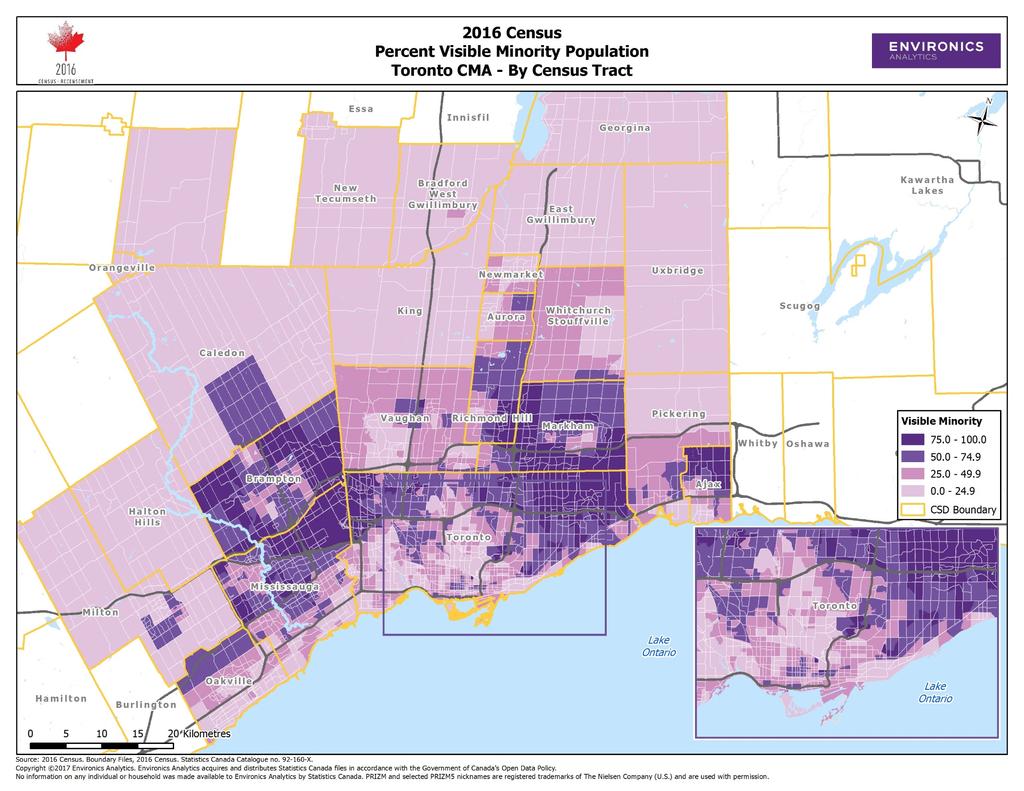
32 Visible minority now a majority in Toronto CMA Percent of the Population Visible Minority, CMAs, 2016, Canada Toronto 51 % Ottawa - Gatineau 22 % Vancouver 49 Windsor 20 Calgary Abbotsford - Mission Edmonton Winnipeg K - C - W Hamilton Regina Oshawa Saskatoon Montréal 23 Guelph 17 Canada 22 London 16 K-C-W is Kitchener - Cambridge - Waterloo
33 The Minority is now a majority in 12 municipalities Percentage of Population Visible Minority, Census Subdivisions, 2016 Markham Richmond Brampton Greater Vancouver A Burnaby Richmond Hill Surrey Mississauga Ajax Vancouver Toronto Coquitlam %
34 34
35 Visible minority population will continue to increase Percent of the Population Visible Minority, CMAs, 2016, Canada Toronto Vancouver Calgary Abbotsford - Mission Edmonton Winnipeg Montréal Canada % 2016 Ottawa - Gatineau Projected 2036 % Windsor K - C - W Hamilton Regina Oshawa Saskatoon Guelph London % K-C-W is Kitchener - Cambridge - Waterloo
36 Visible minority population numbers 7.6 million Visible Minority Population, 2016, Canada Percent 2+ Generations, 2016, Canada South Asian Chinese Black Filipino Arab Latin American Southeast Asian West Asian Multiple visible minorities Korean Visible minority, n.i.e. Japanese 1,924,600 1,577,100 1,198, , , , , , , , ,100 92,900 count South Asian Chinese Black Filipino Arab Latin American Southeast Asian West Asian Multiple visible minorities Korean Visible minority, n.i.e. Japanese 31 %
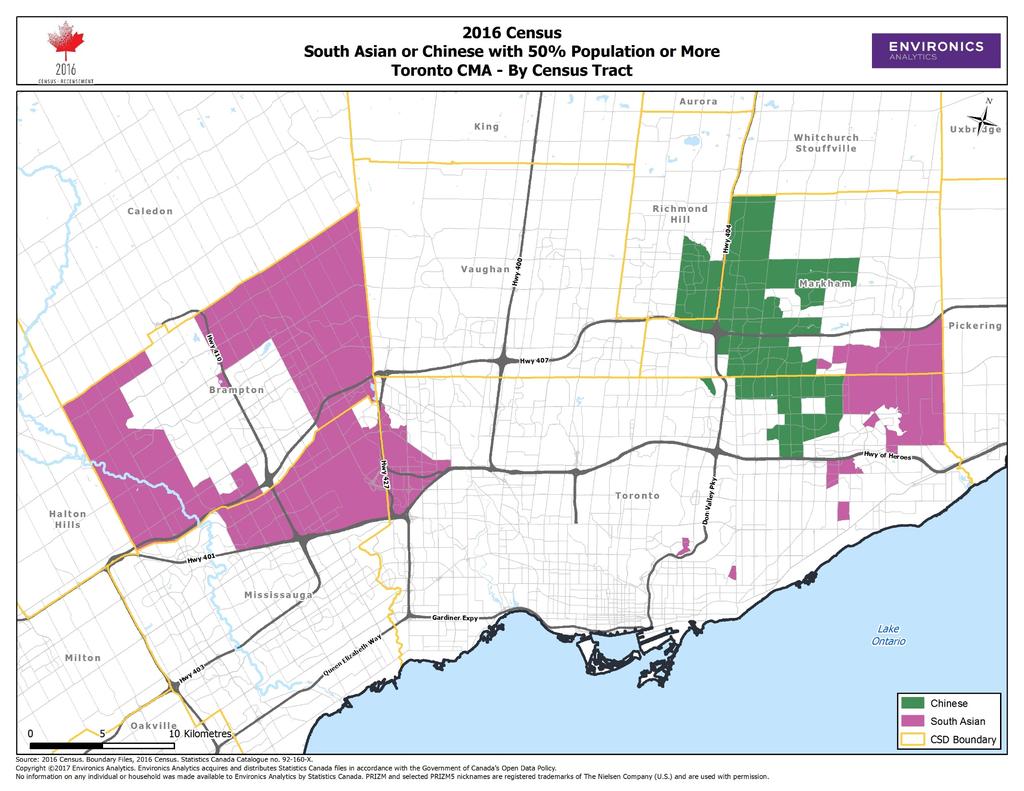
37 Different mix of diversity across the country Largest Visible Minority Groups, Selected CMAs, 2016 Toronto Montréal Vancouver Calgary Ottawa - Gatineau Edmonton Winnipeg Hamilton South Asian Black Chinese South Asian Black South Asian Filipino South Asian Chinese Arab South Asian Chinese Arab Filipino South Asian Black Black Latin American Filipino Filipino Chinese Chinese Black Chinese 37
38 38
39 More diversity at younger ages Percent of Population Visible Minority by Generation, 2016, Canada First generation 2+ generations Total on top % All ages Age Groups
40 Most groups index below average on individual income, but second generation shows improvement Index of Median Individual Income, Population Aged 25-54, 2015, Canada (Total Population Aged =100) Not a visible minority Filipino Black Latin American Southeast Asian South Asian Chinese Japanese Arab Korean West Asian First Generation Index Chinese Japanese Not a visible minority Korean South Asian Filipino Arab Southeast Asian Black West Asian Latin American Second Generation Index Median income for total population $43,300

41 Aboriginal Questions 41
42 Enumeration of Aboriginal Population 14 Reserves not enumerated in Reserves not enumerated in census in Reserves in Census Division of Kenora, Ontario, enumerated later as a result of fires 42
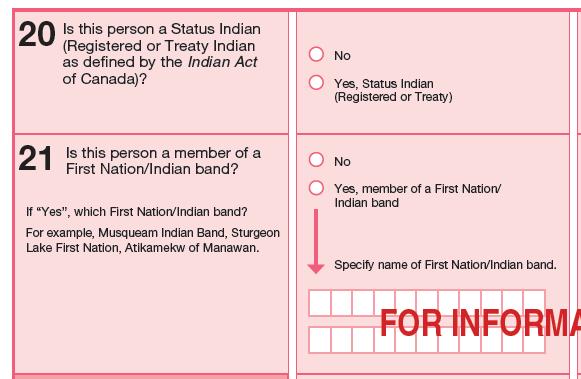
43 Close to 1.7 million aboriginal peoples in Canada Percent and Population, Aboriginal, 2016, Canada First Nations (North American Indian) 977,235 58% Métis 587,545 35% Total Aboriginal Population 1,673,780 Other 43,975 3% Inuk (Inuit) 65,025 4%
44 Diversity within the aboriginal population Aboriginal Identity First Nations North American Indian First Nations Registered or Treaty Indian, 2016, Canada Off reserve 1,334,190 80% On reserve 339,595 20% Off reserve 642,845 66% On reserve 334,385 34% Off reserve 415,500 56% On reserve 329,300 44% Total aboriginal population 1,673,780 Total First Nations 977,235 Total First Nations Registered or Treaty Indian Status 744,900
45 A large majority of aboriginal population live off reserve Aboriginal Population, 2016, Canada On Reserve Off Reserve 1,334, , ,595 47, , ,350 Total Urban (CMA/CA) Rural Total Aboriginal Identity Population 1,673,800
46 Aboriginal population increases by 20 percent Population Growth, Canada Population Growth, % % Aboriginal Population Total Population First Nations (North American Indian) Métis Inuk (Inuit) and 2011 National Household Survey
47 Visible minority and aboriginal populations account for all of total population growth Population Growth , Canada % 4.9 Total population Visible minority population Aboriginal population -0.3 Rest of population Population (millions)
48 Ontario has largest Aboriginal population, but Manitoba and Quebec have highest concentrations outside the North Total Aboriginal Population (000s), 2016, Canada Count in 000s Ontario British Columbia Alberta Manitoba Quebec Saskatchewan Nova Scotia Newfoundland and Labrador Nunavut New Brunswick Northwest Territories Yukon Prince Edward Island On reserve Off reserve Total at end % of Total Pop ON BC (000s) On reserve Off reserve Total Aboriginal Pop Canada 340 1,334 1,674 (4.9%) 6.5 AB 18.0 MB 2.3 QC 16.3 SK 5.7 NS 8.9 NL 85.9 NU 4.0 NB 50.7 NT 23.3 YK 2.0 PE
49 Aboriginal population in Winnipeg Nearly 100,000 Urban Areas (CMA/CA) with at least 10,000 Aboriginal Population, 2016, Canada Winnipeg Edmonton 92,800 76, Percent of Total Population Prince Albert Halifax 16,800 15, Percent of Total Population Vancouver 61, Greater Sudbury 15, Toronto 46, Thunder Bay 15, Calgary 41, Hamilton 14, Ottawa - Gatineau 38, Prince George 12, Montréal 34, London 12, Saskatoon 31, St. Catharines - Niagara 11, Regina 21, Québec 11, Victoria 17, Kelowna 11, Kamloops 10,
50 A much younger aboriginal population Age Distribution, Canada, 2016 Aboriginal Population 26.8% 16.9% 38.9% 10.1% 7.3% Age Age % 100.0% Non-Aboriginal Population 16.4% 12.0% 40.9% 14.3% 16.3% Age Age 65+
51 aboriginal population is also aging Percent Growth of Aboriginal Population, , Canada % Total - all ages Age Groups
52 Less than 60 percent of aboriginal children live with two parents Living Arrangements of Aboriginal Children Aged 0-14, 2016, Canada Aboriginal Children Living with Others Loneparents 35% With others 8% Two parents 57% Living with grandparents (no parents present) Number Percent 12, % Living with other relatives 6, % Foster children 14, % Total Aboriginal Identity Population 1,673,800
53 Aboriginal population have lower levels of individual income Median Individual Income, Canada, 2016 Aboriginal identity Non-aboriginal $ ,900 47,500 25,500 34,600 28,400 37,100 37,800 36,700 31,600 40,600 22,400 27,500 10,200 11,600 All ages Age Groups
54 Aboriginal population has higher level of low income Percent of Aboriginal Population (excluding reserves and the North) Living in Low-income Households, 2015, Canada 30.4 % % Aboriginal Non Aboriginal Age Groups
55 Metis population has median income close to non-aboriginal population 43,700 Median Income Ages 25-54, 2015, Canada 41,500 Percentage Prevalence of Low-income (%), Excluding Reserves and the North, 2015, Canada 30 $ ,700 32,800 % Non-Aboriginal identity First Nations (North American Indian) Métis Inuk (Inuit) Non-Aboriginal identity First Nations (North American Indian) Métis Inuk (Inuit)
56 Housing conditions remain poor, especially on reserve and in Inuit communities Percent of Aboriginal Population Living in Dwellings Considered "Unsuitable", Canada % 10.0 % % 8.5 Aboriginal Non-aboriginal On reserve Off reserve First Nations Metis Inuit
57 Many dwellings in need of major repair; especially on reserves and in Inuit communities Percent of Population Living in Dwellings in Need of Major Repair, 2016, Canada Aboriginal Non-aboriginal % % 13.2 % On reserve Off reserve First Nations Metis Inuit


58 Housing
59 Housing Variables Dwelling Characteristics Tenure Subsidized Type of dwelling Number of rooms/bedrooms Financial Presence of mortgage Shelter costs Shelter costs/income ratio (30%) Condo status Period of construction Value of dwelling Condition of dwelling (need of repairs) Suitability (National Occupancy Standard)
60 Over two thirds of dwellings are owner occupied; 60 percent of owners have mortgages; 13 percent of rental housing is subsidized Home Ownership, 2016, Canada Mortgages, 2016, Canada Subsidized Rental Housing, Canada, 2016 Renter 4,452,850 32% Owner 9,368,330 68% Without mortgage 3,680,875 39% With mortgage 5,687,455 61% Not subsidized housing 3,876,140 87% Subsidized housing 576,710 13% Total Dwellings 13,821,180 Total Owners 9,368,330 Total Renters 4,452,850
61 Home ownership level drops for first time in 10 years Percentage Home Ownership, Canada % Source: Statistics Canada, various censuses
62 Home ownership drops at all ages except seniors Percent Homeowners, Canada % Total and over Source: Statistics Canada, 2006,2011 and 2016 Census
63 Home ownership varies across the country Home Ownership in CMAs, 2016, Canada Oshawa Not a CMA/CA Barrie Kelowna Calgary St. Catharines Niagara Brantford Thunder Bay Windsor Abbotsford Mission Lethbridge Peterborough Highest 77.8 Lowest % Toronto Greater Sudbury Kingston Saguenay London Vancouver Victoria Québec Halifax Trois-Rivières Sherbrooke Montréal %
64 Over half of all dwellings are single-detached... Number of Dwellings, ,072, 080 Population in Private Dwellings 34,460, 060 Singledetached house 54% Apartment, building that has five or more storeys 10% Singledetached house 60% Apartment, building that has five or more storeys 7% Other 37% Other 33% 64
65 ... But much higher growth for high-rise apartments Growth in Number of Dwellings by Type, Canada % Total Single-detached Apartment 5 or more storeys Other 751, , , ,900 Growth Source: Statistics Canada, 2006, Census 65
66 Nearly a third of recently constructed dwellings are condos Percent of Dwellings that are Condominiums, 2016, Canada Condos % Rented 33% Owned, 67% Total 1920 or before Source: Statistics Canada, 2006 Census and 2016 Census
67 Increasingly, condos are hi-rise Percent of Condominiums that are Hi-rise by Period of Construction, 2016, Canada % Total 1920 or before
68 Nearly one-third of Vancouver dwellings are condos Percent Share of Dwellings that are Condominiums by Census Metropolitan Area (CMA), 2016 Vancouver 30.6 % Montréal 16.0 % Calgary 21.8 Québec 14.6 Abbotsford Mission 21.5 Ottawa Gatineau 14.0 Kelowna 21.3 Guelph 13.7 Toronto 20.9 Regina 13.4 Edmonton 19.8 Canada 13.3 Victoria 18.4 Hamilton 13.0 Saskatoon 17.6 London 12.3 K-C-W 10.9 K-C-W is Kitchener Cambridge Waterloo
69 Young and old homeowners most likely to live in condos Percent of Homeowners Living in Condominiums by Age Group, 2016, Canada Hi-rise Other % Total - all ages Age of primary household maintainer
70 Home values highest in Toronto, Vancouver and Victoria Vancouver Toronto Victoria Kelowna Calgary Abbotsford Mission Hamilton Guelph Oshawa Canada Edmonton Barrie Ottawa Gatineau K-C-W Saskatoon Regina Montréal Kingston Average Self-reported Home Value (2015$), CMAs, 2016, Canada 1,005, , , , , , , , , , , , , , , , , ,800 $ 45.5 % 48.4 K-C-W is Kitchener Cambridge Waterloo Percentage Change in Average Home Value, CMAs, , Canada Vancouver Toronto Victoria Kelowna Calgary Abbotsford Mission Hamilton Guelph Oshawa Canada Edmonton Barrie Ottawa Gatineau K-C-W Saskatoon Regina Montréal Kingston
71 Young homeowners have highest shelter costs Percent of Owners Paying 30% or More of Income on Shelter Costs, 2016, Canada Owner 2006 Owner % All All Ages ages Age Groups
72 Younger and older renters have highest shelter costs Percent of Renters Paying 30% or More of Income on Shelter Costs, 2016, Canada Renter 2006 Renter % All All ages Ages Age Groups
73 High shelter costs for lone parents and persons living alone Percent of Households Paying 30% or More on Shelter Costs, 2016, Canada Total households 23.6 % One-person 40.4 Lone-parent Non-family 2 or more persons Couple with children Multiple family Couple without children Source: Statistics Canada, 2006 Census and 2016 Census
74 Unattached Seniors pay the most in Shelter Costs Seniors Paying More Than 30 % of Income for Shelter Costs, 2016, Canada Total Owners Renters 60.5 % % % Total Couple Living alone Total Couple Living alone Total Couple Living alone
75 Nearly a third of all households in Toronto and Vancouver have high shelter costs Percent of Households that Paid 30% or More of Household Total Income Towards Shelter Costs, 2016, Canada Toronto Vancouver Victoria Barrie Peterborough Kelowna Kingston London Abbotsford Mission St. Catharines Niagara Hamilton Halifax Oshawa Belleville Montréal Canada Kitchener Cambridge Waterloo Guelph Saskatoon % Brantford Ottawa Gatineau Regina Windsor Edmonton Calgary St. John's Greater Sudbury Sherbrooke Winnipeg Census agglomeration (CA) Lethbridge Moncton Thunder Bay Trois-Rivières Saint John Québec Not a CMA/CA Saguenay %


76 What s still to come 76
77 Final Census Release November 29,2017 Labour Journey to work Language of work Mobility and migration 77


78 What s Ahead for Environics Analytics DemoStats 2017 DemoStats released Based on 2011 Census geography Based on 2011 Census 2018 DemoStats released at end of March Shift to 2016 Census geography Still based on 2011 Census, but will incorporate some trends from DemoStats released at end of March Built with 2016 Census-based estimates adjusted for 2016 coverage Update to PRIZM5 based on 2016 Census and other data 78

79 Questions Dr. Doug Norris Senior Vice President and Chief Demographer
Canada at 150 and the road ahead A view from Census 2016
 Canada at 150 and the road ahead A view from Census 2016 Dr. Doug Norris Senior Vice President and Chief Demographer 2017 Environics Analytics User Conference November 8, 2017 Canada continues to lead
HOUSING RESEARCH REPORT. Household Mobility and Housing Choices
 HOUSING RESEARCH REPORT Household Mobility and Housing Choices CMHC helps Canadians meet their housing needs. Canada Mortgage and Housing Corporation (CMHC) has been helping Canadians meet their housing
CENSUS BULLETIN #5 Immigration and ethnocultural diversity Housing Aboriginal peoples
 CENSUS BULLETIN #5 Immigration and ethnocultural diversity Housing Aboriginal peoples October 25, 217 Bulletin Highlights: 86.1 per cent of the Brampton s 216 surveyed population held a Canadian citizenship
Article. W Visible Minority Women. by Tina Chui and Hélène Maheux. July 2011
 Component of Statistics Canada Catalogue no. 89-503-X Women in Canada: A Gender-based Statistical Report Article W Visible Minority Women by Tina Chui and Hélène Maheux July 2011 How to obtain more information
Visit our Publications and Open Data Catalogue to find our complete inventory of our freely available information products.
 Welcome to Mississauga Data This report and other related documents can be found at www.mississauga.ca/data. Mississauga Data is the official City of Mississauga website that contains urban planning related
2016 Census: Housing, Immigration and Ethnocultural Diversity, Aboriginal peoples
 October 26, 2017 Backgrounder 2016 Census: Housing, Immigration and Ethnocultural Diversity, Aboriginal peoples The 2016 Census Day was May 10, 2016. On October 25, 2017, Statistics Canada released data
2001 Census: analysis series
 Catalogue no. 96F0030XIE2001008 2001 Census: analysis series Canada s ethnocultural portrait: The changing mosaic This document provides detailed analysis of the 2001 Census of Population data released
Understanding the Occupational Typology of Canada s Labour Force
 Understanding the Occupational Typology of Canada s Labour Force Author: Taylor Brydges, Taylor.Brydges@rotman.utoronto.ca p.416.946.7300 f.416.946.7606 Martin Prosperity Institute Joseph L. Rotman School
The New Canada. Presented by: Dr. Darrell Bricker
 The New Canada Presented by: Dr. Darrell Bricker 2018 Darrell Bricker. All rights reserved. Contains Proprietary information and insights may not be disclosed or reproduced without the prior written consent
Demographic and Socio-economic Influences on Housing Demand. n After averaging 154,000 from 1991 to 2001,
 Chapter 4 Demographic and Socio-economic Influences on Housing Demand Fast Facts n After declining during the 28-9 recession, employment grew in 21 and 211, reducing the national unemployment rate from
Canada s Visible Minorities: Andrew Cardozo and Ravi Pendakur
 Canada s Visible Minorities: 1967-2017 Andrew Cardozo and Ravi Pendakur Introduction Introductory remarks Demographic overview Labour market outcomes Policy initiatives Some defining moments Demographic
Will small regions become immigrants choices of residence in the. future?
 Will small regions become immigrants choices of residence in the future? By: Siyu Wang Student No. 6698166 Major paper presented to the department of economics of the University of Ottawa in partial fulfillment
Artists in Large Canadian Cities
 Artists in Large Canadian Cities http://www.hillstrategies.com info@hillstrategies.com Statistical insights on the arts, Vol. 4 No. 4 Hill Strategies Research Inc., March 2006 ISBN 0-9738391-6-3; Research
Handout 1: Graphing Immigration Introduction Graph 1 Census Year Percentage of immigrants in the total population
 2001 Census Results Teacher s Kit Activity 10: Immigration and Citizenship Suggested Level: Intermediate Subjects: Mathematics, Geography, History, Citizenship Overview In this activity, students complete
OBSERVATION. TD Economics A DEMOGRAPHIC OVERVIEW OF ABORIGINAL PEOPLES IN CANADA
 OBSERVATION TD Economics May 1, 213 A DEMOGRAPHIC OVERVIEW OF ABORIGINAL PEOPLES IN CANADA Highlights New data from the National Household Survey (NHS) show that just over 1.4 million people identified
Aboriginal Peoples in Canada: First Nations People, Métis and Inuit
 Aboriginal Peoples in Canada: First Nations People, Métis and Inuit 2011 National Household Survey (NHS) Social and Aboriginal Statistics September 16, 2013 Main analytical document Aboriginal Peoples
2001 Census: analysis series
 Catalogue no. 96F0030XIE2001006 2001 Census: analysis series Profile of the Canadian population by mobility status: Canada, a nation on the move This document provides detailed analysis of the 2001 Census
Annual Demographic Estimates: Subprovincial Areas, July 1, 2016
 Catalogue no. 91-214-X ISSN 1920-8154 Annual Demographic Estimates: Subprovincial Areas, July 1, 2016 by Demography Division Release date: March 8, 2017 How to obtain more information For information about
North York City of Toronto Community Council Area Profiles 2016 Census
 Bar Chart showing the rate of population growth between the years 2006 and 2016 for the Ward compared to the City of based on the 2006 and data. For more information, please contact Michael Wright at 416-392-7558
2011 National Household Survey Profile on the Town of Richmond Hill: 1st Release
 2011 National Household Survey Profile on the Town of Richmond Hill: 1st Release Every five years the Government of Canada through Statistics Canada undertakes a nationwide Census. The purpose of the Census
Ward 4 Etobicoke Centre City of Toronto Ward Profiles 2016 Census
 Bar Chart showing the rate of population growth between the years 2006 and 2016 for the Ward compared to the City of based on the 2006 and data. For more information, please contact Michael Wright at 416-392-7558
people/hectare Ward Toronto
 Bar Chart showing the rate of population growth between the years 2006 and 2016 for the Ward compared to the City of based on the 2006 and data. For more information, please contact Michael Wright at 416-392-7558
Ward 14 Parkdale-High Park City of Toronto Ward Profiles 2016 Census
 Bar Chart showing the rate of population growth between the years 2006 and 2016 for the Ward compared to the City of based on the 2006 and data. For more information, please contact Michael Wright at 416-392-7558
MULTICULTURALISM IN CANADA
 MULTICULTURALISM IN CANADA Evidence and Anecdote ANDREW GRIFFITH Purpose Provide integrated view of multiculturalism Demographic, economic, social, political Latest data available Set out issues and implications
Immigration and Ethno-Cultural Diversity
 2016 London Census: Fact Sheet 7 Immigration and Ethno-Cultural Diversity On October 25, 2017 Statistics Canada released the 2016 Census data on Immigration and Ethno-Cultural Diversity. This summary highlights
Ward 17 Davenport City of Toronto Ward Profiles 2016 Census
 Bar Chart showing the rate of population growth between the years 2006 and 2016 for the Ward compared to the City of based on the 2006 and data. For more information, please contact Michael Wright at 416-392-7558
Scarborough City of Toronto Community Council Area Profiles 2016 Census
 Bar Chart showing the rate of population growth between the years 2006 and 2016 for the Ward compared to the City of based on the 2006 and data. For more information, please contact Michael Wright at 416-392-7558
MIGRATION BY THE NUMBERS ONEDC MIGRATION PRESENTATION 6 OCTOBER, SUDBURY CHARLES CIRTWILL, PRESIDENT & CEO, NORTHERN POLICY INSTITUTE
 MIGRATION BY THE NUMBERS ONEDC MIGRATION PRESENTATION 6 OCTOBER, 216. SUDBURY CHARLES CIRTWILL, PRESIDENT & CEO, NORTHERN POLICY INSTITUTE Northern Ontario s Immigration Trends in Context 2 Ontario Immigration
COMMUTE DISTANCE AND POLICY IMPLICATIONS Sundar Damodaran, Ph.D., P.Eng.
 Introduction COMMUTE DISTANCE AND POLICY IMPLICATIONS, Ph.D., P.Eng. Commute distance is the distance between a worker's place of residence and his/her usual place of work. Nationally, Census data is the
Study Area Maps. Profile Tables. W Broadway & Cambie St, Vancouver, BC Pitney Bowes 2016 Estimates and Projections. W Broadway & Cambie St
 Powered by PCensus Page 1 Study Area Maps Profile Tables 2016 Demographic Snapshot Population Trends Household Trends Population by Age and Sex Comparison Population by Age and Sex Household Maintainers
The Chinese Community in Canada
 Catalogue no. 89-621-XIE No. 001 ISSN: 1719-7376 ISBN: 0-662-43444-7 Analytical Paper Profiles of Ethnic Communities in Canada The Chinese Community in Canada 2001 by Colin Lindsay Social and Aboriginal
MONITORING THE METROS: A MUCH-AWAITED 2011 UPDATE
 THE METRO BEAT TD Economics MONITORING THE METROS: A MUCH-AWAITED 211 UPDATE The 211 National Household Survey release on May 8 th provides a demographic and diversity update across Canada. This is the
Putting Numbers into Action: Aboriginal Data on the Statistics Canada Website
 Putting Numbers into Action: Aboriginal Data on the Statistics Canada Website Findings from the 2011 National Household Survey (NHS) Social and Aboriginal Statistics Division, Statistics Canada Outline
Tracking Trends in Kingston
 Tracking Trends in Photo: 22, Courtesy of City Hall Total Population: 152,358 Population Changes for CMAs, 21 to 26 25 19.2 2 15 1 11.6 9.2 8.9 8.2 6.6 59 5.9 55 5.5 54 5.4 51 5.1 51 5.1 5 5. 46 4.6 3.8
DIVERSITY IN SASKATCHEWAN
 DIVERSITY IN SASKATCHEWAN Prepared for the: Saskatchewan Cooperative Association January 2016 Doug Elliott Sask Trends Monitor 444 19th Avenue Regina, Saskatchewan S4N 1H1 306-522-5515 sasktrends@sasktel.net
Post-Secondary Education, Training and Labour January New Brunswick Analysis 2016 Census Topic: Immigration
 Post-Secondary Education, Training and Labour January 2018 New Brunswick Analysis 2016 Census Topic: Contents General Information... 2 Overview... 2 Population... 2 Demographics... 3 Sub-Provincial...
Immigrant and Temporary Resident Children in British Columbia
 and Temporary Resident Children in British Columbia January 2011 During the five-year period from 2005 to 2009, on average, approximately 40,000 immigrants arrived in B.C. annually and approximately 7,900
Immigration and Ethnocultural Diversity in Quebec
 Immigration and Ethnocultural Diversity in Quebec The National Household Survey (NHS) Regional analysis January 2014 Immigration and Ethnocultural Diversity in Canada was part of the first release of data
CITY OF MISSISSAUGA. Overview 2-1. A. Demographic and Cultural Characteristics
 Portraits of Peel Overview 2-1 A. Demographic and Cultural Characteristics Population: Size, Age and Growth 2-2 Immigrants 2-3 Visible Minorities 2-4 Language 2-5 Religion 2-6 Mobility Status 2-7 B. Household
Demographic and Economic Trends and Issues Canada, Ontario and the GTA
 Demographic and Economic Trends and Issues Canada, Ontario and the GTA Presented by Tom McCormack The Centre for Spatial Economics www.c4se.com Presented to Professional Marketing Research Society Toronto
Immigrant. coquitlam, B.C Coquitlam Immigrant Demographics I
 Immigrant demographics coquitlam, B.C. - 2018 Immigrant Demographics I Page 1 coquitlam IMMIGRANT DEMOGRAPHICS Your quick and easy look at facts and figures around immigration. Newcomers are an important
Chairman and Members of the Planning and Development Committee. Thomas S. Mokrzycki, Commissioner of Planning and Building
 CD.15.DAT DATE: TO: FROM: SUBJECT: Chairman and Members of the Planning and Development Committee Thomas S. Mokrzycki, Commissioner of Planning and Building Mississauga: A City of Many Cultures MEETING
Trafficking in persons in Canada, 2016
 Catalogue no. 85-005-X ISSN 1925-3427 Juristat Bulletin Quick Fact Trafficking in persons in Canada, 2016 by Dyna Ibrahim Canadian Centre for Justice Statistics Release date: June 27, 2018 How to obtain
Victoria A City in Capital Regional District
 Produced by Stats for Global Non-Response Rate: 24.6 Population Total Immigrants Change in Change in Immigrants Population Number Percent Population Number Percent 1991 71,228 14,665 20.6 1991 to 1996
VIVRE ENSEMBLE AVEC LA DIVERSITÉ, NOT THE CASE FOR MANY MUNICIPALITIES: THE COUNTRY S LEAST DIVERSE PLACES AND CANADIAN ATTITUDES TOWARDS PLURALISM
 VIVRE ENSEMBLE AVEC LA DIVERSITÉ, NOT THE CASE FOR MANY MUNICIPALITIES: THE COUNTRY S LEAST DIVERSE PLACES AND CANADIAN ATTITUDES TOWARDS PLURALISM CANADIAN INSTITUTE OF IDENTITIES AND MIGRATION JANUARY,
Immigrant PORT COQUITLAM, B.C Port Coquitlam Immigrant Demographics I
 Immigrant demographics PORT COQUITLAM, B.C. - 2018 Immigrant Demographics I Page 1 PORT COQUITLAM IMMIGRANT DEMOGRAPHICS Your quick and easy look at facts and figures around immigration. Newcomers are
If this information is required in an accessible format, please contact ext. 2564
 If this information is required in an accessible format, please contact 1-800-372-1102 ext. 2564 From: Report: Date: Commissioner of Planning and Economic Development #2018-INFO-53 April 13, 2018 Subject:
TOWNSHIP OF LANGLEY, B.C Township of Langley Immigrant Demographics I
 Immigrant demographics TOWNSHIP OF LANGLEY, B.C. - 2018 Township of Langley Immigrant Demographics I Page 1 TOWNSHIP OF LANGLEY IMMIGRANT DEMOGRAPHICS Your quick and easy look at facts and figures around
North Okanagan A Regional District in British Columbia
 Population Total Immigrants Change in Change in Immigrants Population Number Percent Population Number Percent 1991 61,744 7,855 12.7 1991 to 1996 9,863 685 8.7 1996 71,67 8,54 11.9 1996 to 1 1,6-28 -
RECENT IMMIGRANTS IN METROPOLITAN AREAS. Saskatoon
 RECENT IMMIGRANTS IN METROPOLITAN AREAS Saskatoon A Comparative Profile Based on the 2001 Census April 2005 Produced by Strategic Research and Statistics For additional copies, please visit our website:
Juristat article. Police-reported crime statistics in Canada, by Shannon Brennan. Component of Statistics Canada catalogue no.
 Component of Statistics Canada catalogue no. 85-002-X Juristat Juristat article Police-reported crime statistics in Canada, 2011 by Shannon Brennan Released on July 24, 2012 How to obtain more information
Immigrant DELTA, B.C Delta Immigrant Demographics I
 Immigrant demographics DELTA, B.C. - 2018 Immigrant Demographics I Page 1 DELTA IMMIGRANT DEMOGRAPHICS Your quick and easy look at facts and figures around immigration. Newcomers are an important and growing
new westminster, B.C New Westminster Immigrant Demographics I
 Immigrant demographics new westminster, B.C. - 2018 Immigrant Demographics I Page 1 new westminster IMMIGRANT DEMOGRAPHICS Your quick and easy look at facts and figures around immigration. Newcomers are
Catalogue no. of Quebec
 Catalogue no. A of Quebec How to obtain more information For information about this product or the wide range of services and data available from Statistics Canada, visit our website at www.statcan.gc.ca,
Strathcona A Regional District in British Columbia
 Produced by Stats for Population Total Immigrants Change in Change in Immigrants Population Number Percent Population Number Percent 1991 - - - 1991 to 1996 - - - 1996 - - - 1996 to 1 - - - 1 - - - 1 to
Social and Demographic Trends in Burnaby and Neighbouring Communities 1981 to 2006
 Social and Demographic Trends in and Neighbouring Communities 1981 to 2006 October 2009 Table of Contents October 2009 1 Introduction... 2 2 Population... 3 Population Growth... 3 Age Structure... 4 3
2016 Census of Canada
 2016 Census of Canada People Introduction This release examines the demographic and geographic aspects of the identity population in Alberta from the 2016 Census. The population is relatively young and
RECENT IMMIGRANTS IN METROPOLITAN AREAS. Regina. A Comparative Profile Based on the 2001 Census April 2005
 RECENT IMMIGRANTS IN METROPOLITAN AREAS Regina A Comparative Profile Based on the 2001 Census April 2005 Produced by Strategic Research and Statistics For additional copies, please visit our website: Internet:
2016 Coordinated PiT Count
 Overview and Data First Annual Canadian Homelessness Data Sharing Initiative Calgary, Alberta - May 4, 2016 Dr. Patrick Hunter, Policy Analyst Homelessness Partnering Strategy, ESDC Background The PiT
Post-Secondary Education, Training and Labour April New Brunswick Analysis 2016 Census Topic: Journey to Work
 Post-Secondary Education, Training and Labour April 2018 2016 Census Topic: Journey to Work Contents General Information... 2 Section 1 Place of Work... 2 1.1 Overview... 2 1.1 Sub-Provincial... 3 Section
Metropolitan Characteristics and Immigrant Entrepreneurship. Eric Fong, Junmin Jeong, Julie Jo. University of Toronto
 Metropolitan Characteristics and Immigrant Entrepreneurship Eric Fong, Junmin Jeong, Julie Jo University of Toronto October, 2012 It has become more common to find immigrant entrepreneurs not only in immigrant
Post-Secondary Education, Training and Labour July New Brunswick Analysis 2016 Census Topic: Age & Sex
 Post-Secondary Education, Training and Labour July 2017 New Brunswick Analysis 2016 Census Topic: Age & Sex General Information On May 3, 2017, the second wave of data from the 2016 Census of Population
2011 CENSUS & NATIONAL HOUSEHOLD SURVEY CITY OF BRAMPTON - WARD 1 PROFILE
 CENSUS & NATIONAL HOUSEHOLD SURVEY CITY OF BRAMPTON WARD 1 PROFILE WARD HIGHLIGHTS Population 53,130 Population 51.0% Females Population by Age Group 9% 20% 014 10.14% of total population 36 Median Age
2011 CENSUS & NATIONAL HOUSEHOLD SURVEY CITY OF BRAMPTON - WARD 4 PROFILE
 2011 CENSUS & NATIONAL HOUSEHOLD SURVEY CITY OF BRAMPTON WARD 4 PROFILE WARD HIGHLIGHTS Population 9.51% of total population 49,850 2011 Population 34 Median Age 50.5% Females 49.5% Males 2011 Population
2011 CENSUS & NATIONAL HOUSEHOLD SURVEY CITY OF BRAMPTON - WARD 3 PROFILE
 2011 CENSUS & NATIONAL HOUSEHOLD SURVEY CITY OF BRAMPTON WARD 3 PROFILE WARD HIGHLIGHTS Population 47,500 2011 Population 50.7% Females 2011 Population by Age Group 13% 18% 014 9.07% of total population
North Vancouver, City of A City in Greater Vancouver Regional District
 Global Non-Response Rate: 25.8 Population Total Immigrants Change in Change in Immigrants Population Number Percent Population Number Percent 1991 38,436,8 28.2 1991 to 1996 3,39 2,46 22.7 1996 41,475
Nanaimo A City in Nanaimo Regional District
 A City in Regional District Produced by Stats for Population Total Immigrants Change in Change in Immigrants Population Number Percent Population Number Percent 1991 6,129 8,885 14.8 1991 to 1996,1 2,44
East Kootenay A Regional District in British Columbia
 Produced by Stats for Global Non-Response Rate: 35.5 Population Total Immigrants Change in Change in Immigrants Population Number Percent Population Number Percent 1991 52,368 5,9 11.3 1991 to 1996 3,998-55
Saanich A District Municipality in Capital Regional District
 Produced by Stats for Population Total Immigrants Change in Change in Immigrants Population Number Percent Population Number Percent 1991 95,583 20,285 21.2 1991 to 1996 5,805 755 3.7 1996 101,388 21,040
CENSUS RESULTS WARD 3 PROFILE
 2011 CENSUS RESULTS WARD 3 PROFILE Town of Halton Hills City of Brampton Hwy. 407 Finch Ave. Town of Milton Hwy. 407 ETR Ninth Line 10 Derry Rd. Winston Churchill Blvd. 9 Erin Mills Pkwy. Mississauga Rd.
RECENT IMMIGRANTS IN METROPOLITAN AREAS. Toronto. A Comparative Profile Based on the 2001 Census April 2005
 RECENT IMMIGRANTS IN METROPOLITAN AREAS Toronto A Comparative Profile Based on the 2001 Census April 2005 Produced by Strategic Research and Statistics For additional copies, please visit our website:
HIGHLIGHTS Ward Toronto. 67% with postsecondary 58% $1,040 average monthly rent. $ $1,026 average monthly rent. China #1 immigrant place of birth
 HIGHLIGHTS Ward Toronto 2010 Household Income 67% with postsecondary certificate, diploma or degree 58% with postsecondary certificate, diploma or degree 30% 25% 20% 15% 10% 5% $1,040 average monthly rent
Alberta Immigrant Highlights. Labour Force Statistics. Highest unemployment rate for landed immigrants 9.8% New immigrants
 2016 Labour Force Profiles in the Labour Force Immigrant Highlights Population Statistics Labour Force Statistics Third highest percentage of landed immigrants in the working age population 1. 34. ON 2.
Form F5 Change of Information in Form F4 General Instructions
 Form 33-109F5 Change of Information in Form 33-109F4 General Instructions 1. This notice must be submitted when notifying a regulator of changes to Form 33-109F6 or Form 33-109F4 information in accordance
PRINCE EDWARD ISLAND POPULATION REPORT 2017
 OVERVIEW PRINCE EDWARD ISLAND POPULATION REPORT 2017 DIAGRAM 1: PRINCE EDWARD ISLAND POPULATION, AS OF JULY 1, 1998-2017 155,000 150,000 145,000 140,000 135,000 130,000 On September 27, 2017 Statistics
Lake Country A District Municipality in Central Okanagan Regional District
 Produced by Stats for Population Total Immigrants Change in Change in Immigrants Population Number Percent Population Number Percent 1991 1991 to 1996 1996 9,7 1,275 14.2 1996 to 1 26 7 5.5 1 9,267 1,345
SELECTED DEMOGRAPHIC TRENDS IN THE REGINA METROPOLITAN AREA
 SELECTED DEMOGRAPHIC TRENDS IN THE REGINA METROPOLITAN AREA Prepared for the: Regina Public Library Staff Development Day November 20, 2015 Doug Elliott Sask Trends Monitor 444 19th Avenue Regina, Saskatchewan
HIGHLIGHTS. 62% with postsecondary 58% $1,081 average monthly rent. $1,026 average monthly rent. China #1 immigrant. China #1 immigrant place of birth
 HIGHLIGHTS Ward Toronto 2010 Household Income 62% with postsecondary certificate, diploma or degree 58% with postsecondary certificate, diploma or degree 30% 25% 20% 15% 10% 5% $1,081 average monthly rent
CENSUS RESULTS WARD 8 PROFILE
 2011 CENSUS RESULTS WARD 8 PROFILE Town of Halton Hills City of Brampton Hwy. 407 Finch Ave. Town of Milton Hwy. 407 ETR Ninth Line 10 Derry Rd. Winston Churchill Blvd. 9 Erin Mills Pkwy. Mississauga Rd.
Permanent and temporary immigration to Canada from 2012 to 2014
 Catalogue no. 91-209-X ISSN 1718-7788 Permanent and temporary immigration to Canada from 2012 to 2014 by Laurent Martel and Carol D Aoust Release date: July 5, 2016 How to obtain more information For information
CENSUS RESULTS WARD 7 PROFILE
 2011 CENSUS RESULTS WARD 7 PROFILE Town of Halton Hills City of Brampton Hwy. 407 Finch Ave. Town of Milton Hwy. 407 ETR Ninth Line 10 Derry Rd. Winston Churchill Blvd. 9 Erin Mills Pkwy. Mississauga Rd.
2011 CENSUS & NATIONAL HOUSEHOLD SURVEY CITY OF BRAMPTON - WARD 10 PROFILE
 2011 CENSUS & NATIONAL HOUSEHOLD SURVEY CITY OF BRAMPTON WARD 10 PROFILE WARD HIGHLIGHTS Population 10.72% of total population 56,185 2011 Population 33 Median Age 50.1% Females 49.9% Males 2011 Population
$ $1,026. HIGHLIGHTS Ward Toronto. 52% with postsecondary 58% $978 average monthly rent. China #1 immigrant place of birth
 HIGHLIGHTS Ward Toronto 2010 Household Income 52% with postsecondary certificate, diploma or degree 58% with postsecondary certificate, diploma or degree 35% 30% 25% 20% 15% 10% 5% $978 average monthly
Youth Criminal Justice in Canada: A compendium of statistics
 Youth Criminal Justice in Canada: A compendium of statistics Research and Statistics Division and Policy Implementation Directorate Department of Justice Canada 216 Information contained in this publication
Castlegar A City in Central Kootenay Regional District
 Produced by Stats for Population Total Immigrants Change in Change in Immigrants Population Number Percent Population Number Percent 1991 6,579 885 13.5 1991 to 1996 448 45 5.1 1996 7,27 93 13.2 1996 to
View Royal A Town in Capital Regional District
 Produced by Stats for Global NonResponse Rate: 18.4 Population Total Immigrants Change in Change in Immigrants Population Number Percent Population Number Percent 1991 5,996 9 15.6 1991 to 1996 445 315
Burnaby A City in Greater Vancouver Regional District
 Produced by Stats for Global Non-Response Rate: 23.6 Population Total Change in Change in Population Number Percent Population Number Percent 1991 158,858 49,5 31.2 1991 to 1996,351 24,5 49.1 1996 179,9
CENSUS RESULTS WARD 9 PROFILE
 2011 CENSUS RESULTS WARD 9 PROFILE Town of Halton Hills City of Brampton Hwy. 407 Finch Ave. Town of Milton Hwy. 407 ETR Ninth Line 10 Derry Rd. Winston Churchill Blvd. 9 Erin Mills Pkwy. Mississauga Rd.
CENSUS RESULTS WARD 10 PROFILE
 2011 CENSUS RESULTS WARD 10 PROFILE Town of Halton Hills City of Brampton Hwy. 407 Finch Ave. Town of Milton Hwy. 407 ETR Ninth Line 10 Derry Rd. Winston Churchill Blvd. 9 Erin Mills Pkwy. Mississauga
CENSUS RESULTS WARD 6 PROFILE
 2011 CENSUS RESULTS WARD 6 PROFILE Town of Halton Hills City of Brampton Hwy. 407 Finch Ave. Town of Milton Hwy. 407 ETR Ninth Line 10 Derry Rd. Winston Churchill Blvd. 9 Erin Mills Pkwy. Mississauga Rd.
CANADIAN DATA SHEET CANADA TOTAL POPULATION:33,476,688 ABORIGINAL:1,400,685 POPULATION THE ABORIGINAL PEOPLE S SURVEY (APS) ABORIGINAL POPULATION 32%
 ABORIGINAL POPULATION 32%") CANADA TOTAL POPULATION:33,476,688 ABORIGINAL:1,400,685 THE ABORIGINAL PEOPLE S SURVEY (APS) The 2012 Aboriginal Peoples Survey (APS) is a national survey of First Nations, Métis and Inuit people living
CANADA TOTAL POPULATION:33,476,688 ABORIGINAL:1,400,685 THE ABORIGINAL PEOPLE S SURVEY (APS) The 2012 Aboriginal Peoples Survey (APS) is a national survey of First Nations, Métis and Inuit people living
Ward 16 River. City of Ottawa Ward Profiles 2011 Census and National Household Survey POPULATION* 45, ,390. Total City of Ottawa Population
 POPULATION* Total Ward Population 45,795 +2.0% 2006-2011 Total City of Ottawa Population 883,390 +8.8% 2006-2011 Population by Age Group Ward 16 City of Ottawa 2006 2011 06-11 2006 2011 06-11 Age Group
State of the West 2003
 State of the West 2003 Western Canadian Demographic and Economic Trends Robert Roach May 2003 F O U N D A T I O N BUILDING THE NEW WEST This report is part of the Canada West Foundation s Building the
Introduction... i. Population Family Structure Education Mobility Status... 7
 Table of Contents Introduction... i Population... 2 Family Structure... 5 Education... 6 Mobility Status... 7 Ethnicity, Language, Immigrants and Visible Minority... 9 ward three Labour Force Characteristics...13
Catalogue no X. Measuring Crime in Canada: Introducing the Crime Severity Index and Improvements to the Uniform Crime Reporting Survey
 Catalogue no. 85-004-X Measuring Crime in Canada: Introducing the Crime Severity Index and Improvements to the Uniform Crime Reporting Survey 2009 How to obtain more information For information about this
Salmon Arm A City in Columbia-Shuswap Regional District
 Produced by Stats for Global NonResponse Rate: 22.8 Population Total Change in Change in Population Number Percent Population Number Percent 1991 12,115 1,365 11.3 1991 to 1996 2,549 25 18.3 1996 14,664
RECENT IMMIGRANTS IN METROPOLITAN AREAS. Québec. A Comparative Profile Based on the 2001 Census April 2005
 RECENT IMMIGRANTS IN METROPOLITAN AREAS Québec A Comparative Profile Based on the 2001 Census April 2005 Produced by Strategic Research and Statistics For additional copies, please visit our website: Internet:
Highlands A District Municipality in Capital Regional District
 Produced by Stats for Global NonResponse Rate: 33 Population Total Immigrants Change in Change in Immigrants Population Number Percent Population Number Percent 1991 1,94 1991 to 1996 329 1996 1,423 21
BRAMALEA. Overview A. Demographic and Cultural Characteristics
 The Social Planning Council of Peel Portraits of Peel BRAMALEA Overview 13-1 A. Demographic and Cultural Characteristics Population: Size, Age and Growth 13-2 Immigrants 13-3 Visible Minorities 13-4 Language
MAJOR RELEASES OTHER RELEASES NEW PRODUCTS 7
 Catalogue 11-001E (Français 11-001F) ISSN 0827-0465 Thursday, September 5, Released at 8:30 am Eastern time MAJOR RELEASES Building permits, 2 The value of building permits reached an unprecedented high