Findings from the National Agricultural Workers Survey (NAWS) : A Demographic and Employment Profile of United States Farmworkers
|
|
|
- Crystal Jordan
- 5 years ago
- Views:
Transcription

1 Findings from the National Agricultural Workers Survey (NAWS) : A Demographic and Employment Profile of United States Farmworkers Research Report No. 13
2 Material contained in this publication is in the public domain and may be reproduced, fully or partially, without permission of the Federal Government. Source credit is requested. Permission is required only to reproduce any copyrighted material contained herein. This material will be made available to deaf and hard of hearing individuals upon request. Voice phone: TTY FIRS:
3 Findings from the National Agricultural Workers Survey (NAWS) A Demographic and Employment Profile of United States Farmworkers January 2018 This report was prepared for the U.S. Department of Labor, Employment and Training Administration, Office of Policy Development and Research by JBS International, Inc., under contract #GS-10F-0285K. Since contractors conducting research and evaluation projects under government sponsorship are encouraged to express their own judgment freely, this report does not necessarily represent official opinion or policy of the U.S. Department of Labor. It was written by: Trish Hernandez, JBS International Susan Gabbard, JBS International The authors are grateful to Jorge Nakamoto and Alberto Sandoval of JBS International for coordinating the field interviews on which the report is based, as well as to the interviewers and support staff of JBS International. The authors also thank the 5,342 U.S. crop workers who graciously participated in an interview during , and the agricultural employers who helped survey staff reach the workers.
4 Table of Contents EXECUTIVE SUMMARY... i INTRODUCTION... i Topics Covered... ii CHAPTER 1: Birthplace, Employment Eligibility, and Migrant Types... 1 Summary of Findings:... 1 Place of Birth... 1 Ethnicity and Race... 2 Foreign-born Workers First Arrival to the United States... 3 Work Authorization... 4 Migrant Farmworkers... 5 CHAPTER 2: Demographics, Family Size, and Children and Household Structure... 7 Summary of Findings:... 7 Gender and Age... 7 Marital Status and Family Type... 8 Children and Household Structure... 8 CHAPTER 3: Language, Education, and English Skills Summary of Findings: Primary Language English Language Skills Education Adult Education CHAPTER 4: Housing Characteristics and Distance to Work Summary of Findings: Location of Housing and Payment Arrangement Type of Housing Household Crowding Distance to Work and Transportation CHAPTER 5: Employment Patterns and Farm Job Characteristics Summary of Findings: Type of Employer and Job Recruitment Primary Crops and Farm Job Tasks Basis for Pay and Hours Worked... 21
5 Wages Monetary Bonuses Worksite Availability of Water and Toilets Pesticide Training Insurance Benefits CHAPTER 6: Employment Experience Summary of Findings: Number of U.S. Farm Employers in Previous 12 Months Number of Years with Current Farm Employer Weeks and Days of Farm Work in Previous 12 Months Years of U.S. Farm Work Experience Other Work History Plans to Remain in Farm Work CHAPTER 7: Non-Crop Work Activities During the Year Summary of Findings: Time Spent Not Employed or Abroad in Previous 12 Months Non-Crop Work in Previous 12 Months Reasons for Leaving Non-Crop Work in Previous Year Periods of Unemployment During the Year CHAPTER 8: Income, Assets, and Use of Assistance Programs Summary of Findings: Income Assets in the United States and Abroad Use of Contribution- and Need-Based Programs CHAPTER 9: Health Care in the United States Summary of Findings: Health Insurance Coverage for Farmworkers and Family Members Health Care Utilization and Barriers to Health Care APPENDIX A: Methodology Overview Stratification Sampling within Strata APPENDIX B: Map of the NAWS Migrant Streams APPENDIX C: Index of Percentages and Means for Key Variables... 51
6 Chapter Chapter Chapter Chapter Chapter Chapter Chapter Chapter Chapter
7 Table of Figures Figure 1.1: Place of Birth, Figure 1.2: Years Since First Arrival to the United States, Figure 1.3: Distribution of Migrant Types (As Percent of Migrants), Figure 1.4: Distribution of Migrant Types According To Their Migrant Travel Patterns (As Percent of Migrants), Figure 2.1: Age Distribution of Farmworkers, Figure 2.2: Number of Minor Children in the Household of Farmworkers, Figure 2.3: Percent of Farmworkers Unaccompanied by Nuclear Family, Figure 3.1: Farmworkers' Self-Reported English Speaking and Reading Ability, Figure 3.2: Among Farmworkers Whose Primary Language Is Spanish, Self-Reported Spanish Speaking and Reading Ability, Figure 3.3: Distribution of Highest Grade Completed by Farmworkers, Figure 3.4: Percent of Farmworkers Who Attended Adult Education Classes, Figure 3.5: Percent of Farmworkers Who Attended At Least One Adult Education Class in the United States, Figure 4.1: Percent of Farmworkers Who Lived in Employer-Provided Housing, Figure 4.2: Housing Arrangement, Figure 4.3: Type of Housing, Figure 4.4: Type of Housing by Length of Time in the United States, Figure 5.1: Primary Crop at Time of Interview, Figure 5.2: Primary Task at Time of Interview, Figure 5.3: Average Number of Hours Worked in Week Prior to Interview by Crop and Task at Time of Interview, Figure 5.4: Average Number of Hours Worked in Week Prior to Interview by Farmworker Characteristic, Figure 5.5: Average Hourly Wage by Farmworker Characteristic, Figure 5.6: Types of Cash Bonuses Farmworkers Received, Figure 5.7: Percent of Farmworkers Whose Employer Offers Health Insurance, Figure 6.1: Percentage Distribution of Number of Farm Work Employers in Previous 12 Months by Farmworker Characteristic, Figure 6.2: Percentage Distribution of Number of Years with Current Farm Employer, Figure 6.3: Average Number of Weeks of Farm Work in Previous 12 Months, by Farmworker Characteristic,
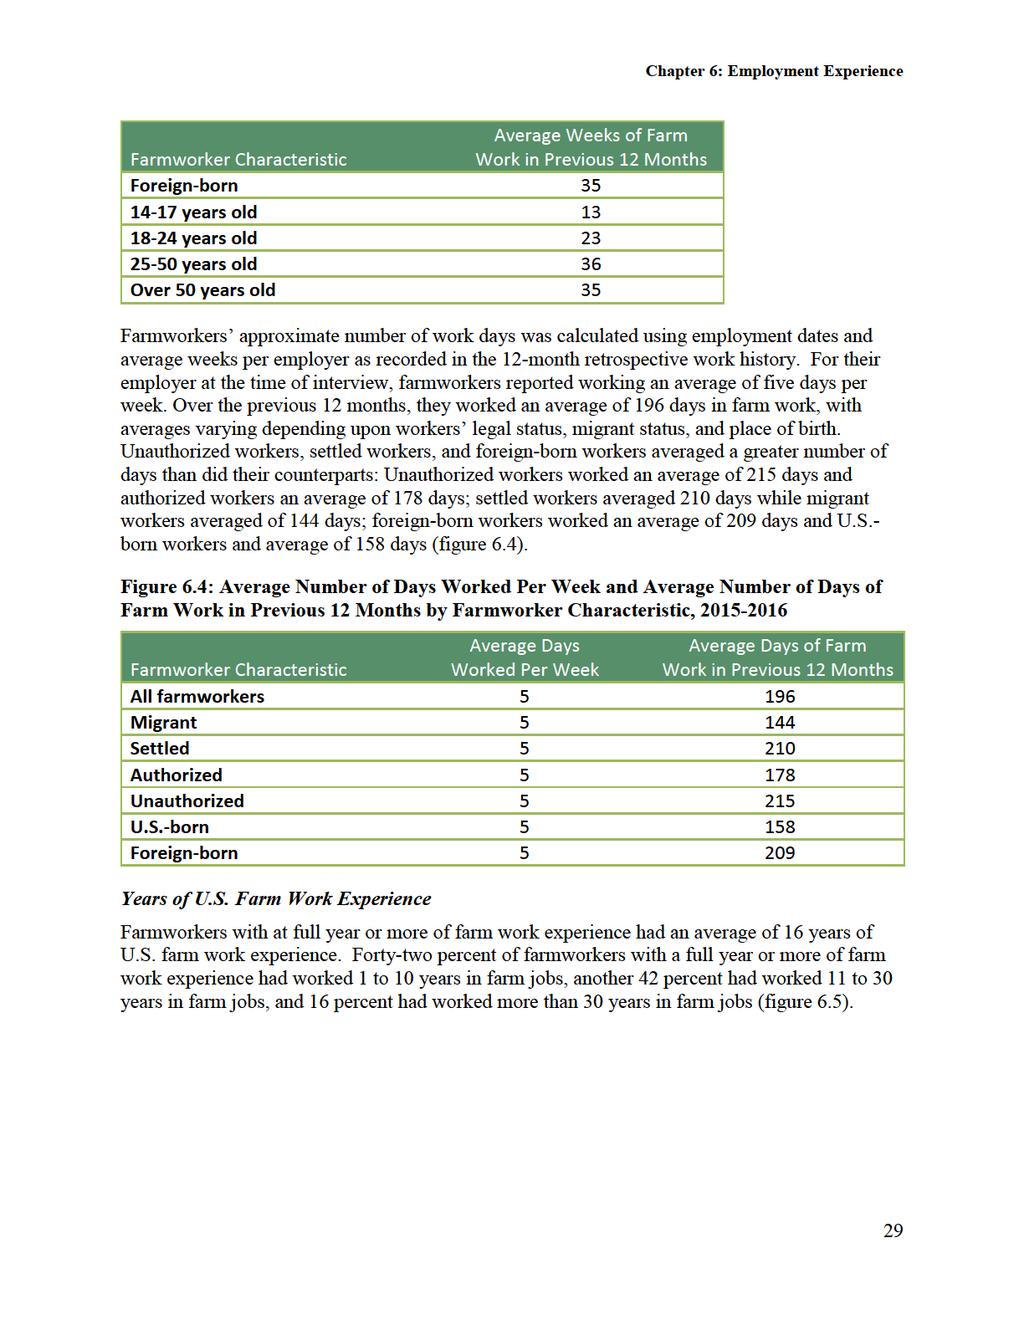
8 Figure 6.4: Average Number of Days Worked Per Week and Average Number of Days of Farm Work in Previous 12 Months by Farmworker Characteristic, Figure 6.5: Years U.S. Farm Work Experience, Figure 6.6: U.S. Non-Crop Work Experience, Figure 6.7: Last Time Parents Did Hired Farm Work in United States, Figure 7.1: Average Number of Weeks Not Employed and Abroad in Previous 12 Months, Figure 7.2: Percent of Farmworkers Who Held a Non-Crop Job the Previous Year, Figure 7.3: Types of Non-Crop Jobs Held in Previous 12 Months, Figure 8.1: Percent of Farmworkers with Total Family Income Below Poverty Level by Family Size, Figure 8.2: Percent of Farmworkers with Total Family Income Below Poverty Level by Farmworker Characteristic, Figure 8.3: Assets in the United States, Figure 8.4: Percent of Farmworkers Who Reported That a Member of the Household Received Benefits from Contribution- or Needs-Based Programs in the Last Two Years, Figure 9.1: Percent of Farmworkers with Health Insurance, Figure 9.2: Sources of Farmworkers' Health Insurance, Figure 9.3: Sources of Farmworkers' Spouses Health Insurance, Figure 9.4: Sources of Farmworkers' Children s Health Insurance, Figure 9.5: Visited a U.S. Health Care Provider in the Last Two Years by Health Insurance Status, Figure 9.6: Type of U.S. Health Care Provider Visited by Health Insurance Status,
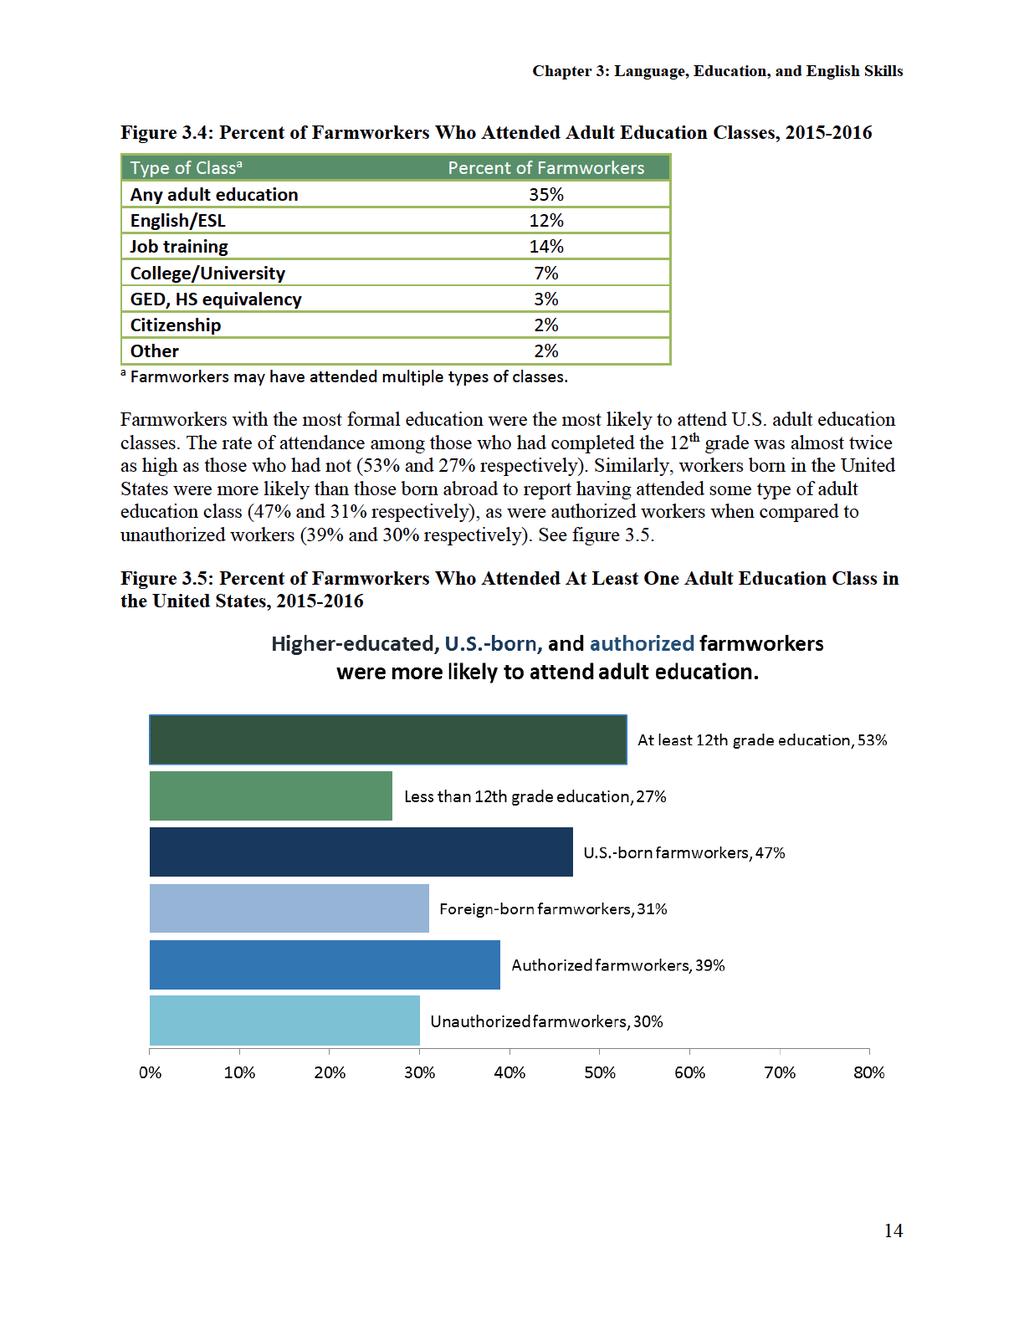
9 EXECUTIVE SUMMARY This report is the thirteenth in a series of Department of Labor publications on the demographic and employment characteristics of hired agricultural workers in the United States (U.S.). It examines recent information on the demographics and employment characteristics of those who perform U.S. crop work. The primary focus of this report is the presentation of findings for the period covering fiscal years (FY) 2015 and These findings are based on data collected from face-to-face interviews with 5,342 crop farmworkers through the U.S. Department of Labor s National Agricultural Workers Survey (NAWS) between October 1, 2014 and September 30, Birthplace, Ethnicity, and Race Sixty-nine percent of hired farmworkers interviewed in FYs were born in Mexico, 24 percent were born in the United States, 1 percent were born in Puerto Rico 1, 6 percent were born in Central America, and a small portion (1%) originated from various other regions, including South America, the Caribbean, Asia, and the Pacific Islands. Eighty-three percent of all farmworkers were Hispanic. Among U.S.-born workers, 35 percent were Hispanic. In terms of race, nearly a quarter of farmworkers self-identified as White (24%), and nearly three quarters categorized their race with an open-ended other response (73%). Six percent of farmworkers were identified as indigenous. Employment Eligibility and Number of Years in the United States Just more than half of all farmworkers in had work authorization (51%): 29 percent were U.S. citizens, 21 percent were legal permanent residents, and 1 percent had work authorization through some other visa program. Among citizens, 85 percent were born in the U.S. and 15 percent were naturalized citizens. On average, foreign-born farmworkers interviewed in first came to the United States 18 years before being interviewed. Most respondents had been in the United States at least 10 years (78%), with 58 percent arriving 15 years or more prior to their NAWS interview. Four percent of farmworkers were in their first year in the United States. Eighty-one percent of farmworkers were settled workers and 19 percent were migrants. Demographics and Family Composition Males comprised 68 percent of the hired crop labor force in Farmworkers were relatively young, their average age being 38. Forty-four percent of workers were under the age of 35, 41 percent were ages 35 to 54, and 14 percent were age 55 or older. Fifty-seven percent of farmworkers were married and 55 percent had children. At the time they were interviewed, farmworker parents with minor children living with them had an average of 2 minor children. Among these parents, 67 percent had 1 or 2 minor children in their household, 23 percent had 3 minor children, and 10 percent had 4 or more minor children. Forty percent of farmworkers were living apart from all nuclear family members at the time of their interview (i.e. were unaccompanied). Seventy-three percent of these unaccompanied 1 Estimate should be interpreted with caution because it has a RSE of 31 to 50 percent. i
10 workers were single without children, 20 percent were parents, and 7 percent had a spouse but no children. Language and Education In , 77 percent of farmworkers said that Spanish was the language in which they are most comfortable conversing, 21 percent said English was, and 1 percent reported an indigenous language. In rating their English language skills, 30 percent of farmworkers reported that they could not speak English at all, 41 percent said they could speak English a little or somewhat, and 29 percent said they could speak English well. In terms of their ability to read English, 41 percent of workers reported they could not read English at all, 30 percent said they could read English a little or somewhat, and 28 percent said that they could read English well. The average level of formal education completed by farmworkers was eighth grade. Four percent of workers reported that they had no formal schooling and 37 percent reported that they completed the sixth grade or lower. Nineteen percent of workers said they completed grade 7, 8, or 9, and 30 percent said they completed grade 10, 11, or 12. Ten percent of workers reported completing some education beyond high school. Thirty-five percent of workers reported having taken at least one adult education class in the United States. Housing Fifty-four percent of farmworkers interviewed in reported that they lived in housing they rented from someone other than their employer, 28 percent of workers said they lived in a home owned by themselves or a family member, and 1 percent said they paid rent for housing provided by the government, a charity, or other organization. Sixteen percent of workers lived in employer-provided housing: 11 percent received it free of charge, 2 percent paid rent either directly or via payroll deduction, and 4 percent had other arrangements with their employers that were not specified. Fifty-seven percent of all farmworkers reported living in detached, single-family houses, 20 percent said they lived in mobile homes, 20 percent lived in apartments, and 4 percent lived in various other types of housing including duplexes or triplexes, dormitories or barracks, and motels or hotels. Thirty-three percent of farmworkers lived in crowded dwellings, defined as housing units in which the number of persons per room was greater than one. Distance to Work and Transportation When asked how far their current farm job was from their current residence, 11 percent of workers reported that they lived where they worked, 70 percent lived fewer than 25 miles from their current farm job, and 16 percent lived between 25 and 49 miles from work. Fifty-eight percent of workers drove a car to work, 13 percent rode with others, 8 percent walked or took public transportation, and 15 percent rode with a raitero 2. Job Characteristics and Employment History In , 80 percent of farmworkers were employed directly by growers and 20 percent were employed by farm labor contractors. At the time of interview, 37 percent of farmworkers 2 Raitero, derived from ride, is the Spanish word for a person who charges a fee for providing a ride to work. ii
11 were working in vegetable crops, 32 percent in fruit and nut crops, and 19 percent in horticulture. Another 10 percent were working in field crops and 3 percent were working in mixed crops. Thirty percent of farmworkers were performing pre-harvest tasks, 17 percent were harvesting crops, 25 percent were performing post-harvest activities, and 29 percent were performing technical production tasks. In the 12 months prior to being interviewed, respondents spent an average of 33 weeks employed in farm work and performed an average of 192 days of farm work. Workers worked an average of 5 days per week for their current employer and reported an average of 45 work hours in the previous week. The majority of workers said that their basis for pay was an hourly wage (88%), and workers reported earning an average of $10.60 per hour. Forty-three percent of farmworkers said that they were covered by Unemployment Insurance (UI) if they were to lose their current job, 62 percent said they would receive workers compensation if they were injured at work or became ill as a result of their work, and 18 percent reported that their employer offered health insurance for injury or illness suffered while not on the job. Farmworkers in worked for an average of 1 U.S. farm employer in the 12 months prior to being interviewed. Eighty percent of workers reported having worked for only 1 farm employer in the previous 12 months, 13 percent worked for 2 employers, and 7 percent had 3 or more farm employers. At the time of interview, farmworkers had been employed by their current farm employer for an average of 7 years. The majority of farmworkers interviewed in expected to continue doing farm work for more than 5 years (76%). In the year prior to their NAWS interview, workers spent an average of 11 weeks living in the United States but not working and 3 weeks abroad. Twenty-four percent of farmworkers held at least 1 non-crop work job in the previous 12 months, and those who held a non-crop job worked an average of 25 weeks in non-crop employment. Income and Assets Farmworkers mean and median personal incomes the previous year were in the range of $17,500 to $19,999. Fourteen percent of workers said their total personal income was less than $10,000, 29 percent said they had personal incomes of $10,000 to $19,999, another 29 percent had personal incomes of $20,000 to $29,999, and 14 percent reported that their total personal income was $30,000 or more. Nine percent of workers reported that they did not work at all during the prior calendar year. Workers mean and median total family incomes the previous year were in the range of $20,000 to $24,999. Six percent of workers said that they did not work in the prior year, twenty-seven percent said that their total family income the prior year was less than $20,000, another 27 percent had a family income of $20,000 to $29,999, and 32 percent had a family income of $30,000 or more 3. Thirty-three percent of farmworkers had family incomes below the poverty level. 3 An additional 8 percent of workers reported that they did not know their family income for the prior year. iii
12 Approximately two-thirds of farmworkers stated that they owned or were buying at least one asset in the United States (68%). The most common assets were a vehicle (reported by 63% of workers) or a home (reported by 18% of workers). In , 14 percent of farmworkers reported that someone in their household received a benefit from at least one contribution-based program, including disability insurance, UI, or Social Security. Ten percent of households received payments from UI, three percent received Social Security payments, and one percent received payments from disability insurance. Fiftyfour percent of farmworkers reported that they or someone in their household used at least one type of public assistance program in the previous two years. The most common programs utilized were Medicaid (44%), Supplemental Nutrition Assistance Program (SNAP, 18%), Special Supplemental Nutrition Program for Women, Infants, and Children (WIC, 17%), and public health clinics (10%). Health Care Forty-seven percent of farmworkers interviewed in reported that they had health insurance. Among them, 29 percent said their employer provided the insurance, 43 percent reported that they had insurance provided by the government, 12 percent said that they or their spouse paid for insurance themselves, 6 percent reported that they had insurance under their spouse s employer s plan, 6 percent reported that they were covered by a family member other than the spouse, such as a parent, and another 7 percent reported that some other entity paid for their insurance 4. Among workers with spouses, 56 percent said their spouse had health insurance. Among workers with minor children in the US or Puerto Rico, 89 percent reported that all of their children had health insurance, 3 percent reported that some of their children had health insurance, and 7 percent reported that none of their children had health insurance. Sixty-three percent of farmworkers used a health care provider in the United States sometime in the last two years. The last time they visited a health care provider, 40 percent of workers went to a private medical doctor s office or private clinic, 34 percent said they visited a community health center or migrant health clinic, 12 percent saw a dentist, 11 percent went to a hospital, and 3 percent went to some other health care provider. Thirty-four percent of farmworkers paid for their last health care visit out of their own pockets, 22 percent said that they had Medicaid or Medicare, 13 percent reported that the cost was covered by health insurance provided by their employer, and 11 percent said the majority of the cost was covered by health insurance that they or their family had purchased themselves. An additional nine percent of workers stated that they went to a public clinic that did not charge for the visit, three percent reported that they used some combination of sources to pay, they were covered by worker s compensation, or that they were billed for service but did not pay, and the remaining seven percent provided a variety of other responses. The most common difficulty farmworkers said they faced when they needed to access health care was that health care visits were too expensive (reported by 23% of respondents). 4 Percentages sum to more than 100 percent because respondents could select all that apply. iv
13 INTRODUCTION The U.S. Department of Labor s National Agricultural Workers Survey (NAWS) is an employment-based, random-sample survey of U.S. crop workers that collects demographic, employment, and health data in face-to-face interviews. The survey began in Federal Fiscal Year (FY) 1989; since then over 66,000 workers have been interviewed. The primary purposes of the NAWS are to monitor the terms and conditions of agricultural employment and assess the conditions of farmworkers. The survey also generates information for various Federal agencies that oversee farmworker programs. The NAWS is a survey of hired workers who are currently employed in crop and crop-related work. To be interviewed, workers must be hired by an eligible establishment and working at an eligible task. Eligible establishments are those classified in the North American Industrial Classification System (NAICS) as Crop Production (NAICS code 111) or as Support Activities for Crop Production (NAICS code 1151). NAICS 111 comprises establishments such as farms, orchards, groves, greenhouses, and nurseries that are primarily engaged in growing crops, plants, vines, or trees and their seeds. NAICS 1151 includes establishments primarily engaged in providing support activities for growing crops. Examples of support activities include supplying labor, aerial dusting or spraying, cotton ginning, cultivating services, farm management services, planting crops, and vineyard cultivation services. Eligible tasks include work in all phases of crop production (pre-harvest, harvest, and postharvest), as well as supervising workers, operating machinery, and packing crops. Workers who pack crops, however, are interviewed only if the packing facility at which they are employed is on or adjacent to the sampled crop producer, and the facility is owned by and primarily packs crops for that producer. The NAWS sampling universe does not include: persons employed at eligible establishments who do not perform crop-related work, such as secretaries or mechanics, unless such workers also perform crop-related work; and crop workers with an H-2A visa (a temporary-employment visa for foreign agricultural workers). Both migrant and seasonal crop workers are sampled in the NAWS. The NAWS is unique for its broad coverage of the characteristics of hired crop workers and their dependents and its nearly year-round interviewing schedule. Data are collected throughout the year, over three cycles, to reflect the seasonality of agricultural production and employment. The NAWS differs from many Federal worker surveys in that: 1) it is an establishment survey (workers are sampled at their workplaces); 2) only currently employed persons are sampled; and 3) data is collected through face-to-face interviews with farmworkers. The use of an employer-based sample rather than a household-based sample increases the likelihood that migrant workers will be interviewed in the NAWS. Multi-stage sampling is implemented to account for seasonal and regional fluctuations in the level of farm employment. To capture seasonal fluctuations in the agricultural work force, the sampling year is divided into three interviewing cycles. For each cycle, there are six levels of selection: i
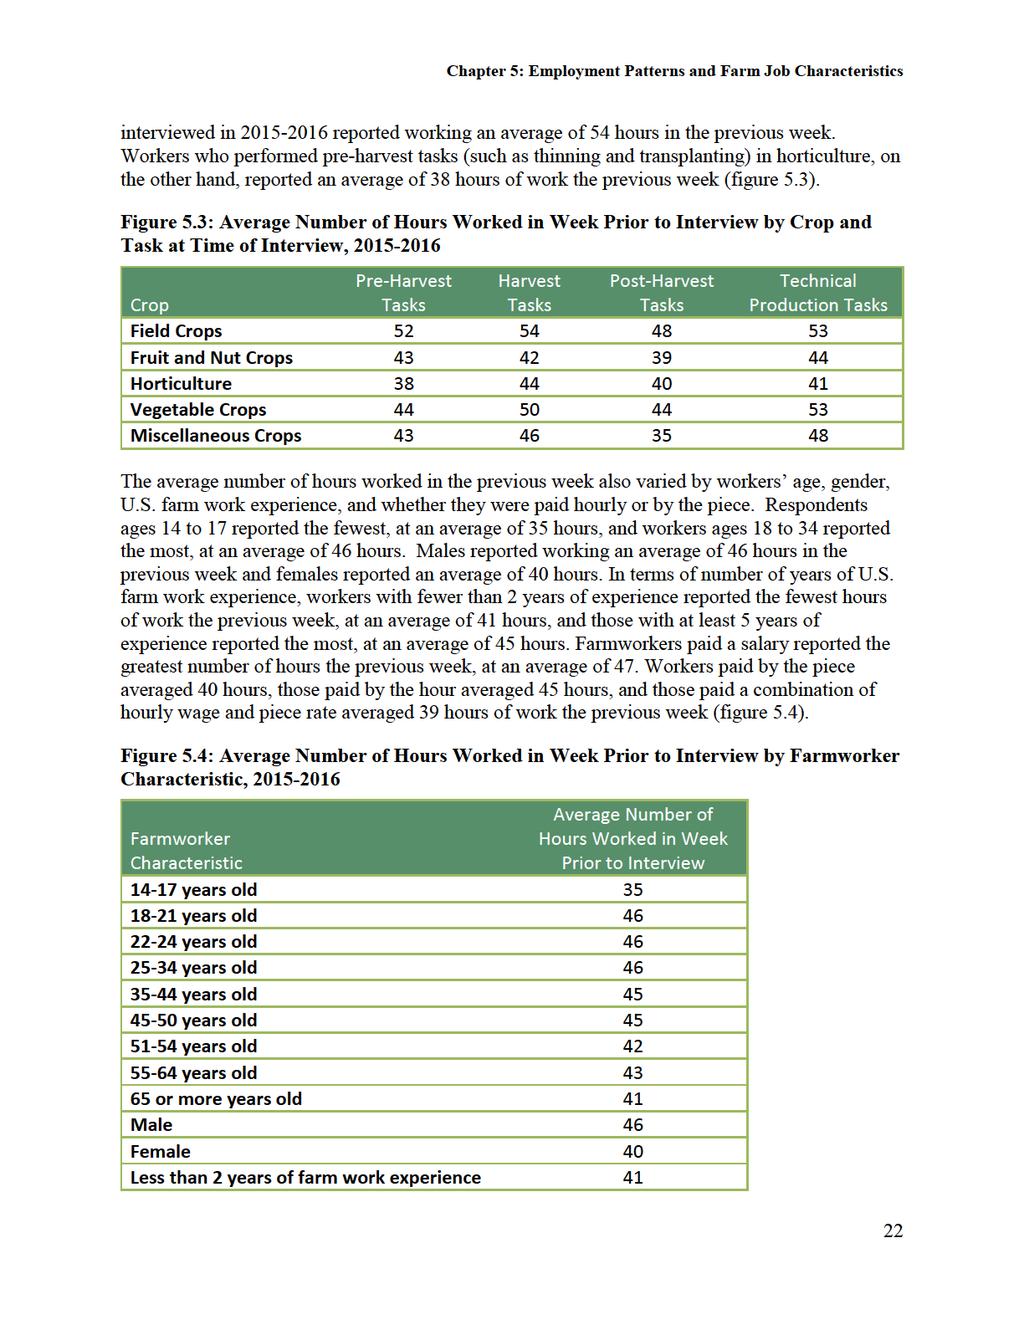
14 region; single counties or groupings of counties called farm labor areas (FLA), which constitute the primary sampling unit; county ZIP Code region; employer; and respondent. A full description of the survey's sampling design is available in the Statistical Methods of the National Agricultural Workers Survey ( atement%20part%20b.pdf). The NAWS has benefited from collaboration with multiple Federal agencies, which continue to share in the design of the questionnaire. Information provided through the NAWS informs the policies and programs of the many Federal government agencies that protect and provide services to migrant and seasonal farmworkers and their dependents. Topics Covered This report presents information collected from face-to-face interviews with 5,342 crop workers interviewed between October 1, 2014 and September 30, It is organized into nine chapters, each beginning with a summary of the chapter s key findings. The report also contains three appendices: Appendix A describes the procedures used to select the sample, Appendix B displays a map of the NAWS migrant streams, and Appendix C contains a table of the percentages and means of the principle variables presented in the report. Chapters 1 through 3 summarize the demographic characteristics of farmworkers, including place of birth, ethnicity and race, work authorization, gender, age, marital status, household size and structure, education, and language ability. Chapter 4 discusses farmworkers housing, including the types of housing they live in, the location of their housing in relation to their jobs, and crowded conditions. Chapter 5 summarizes the characteristics of farm jobs, including crops and tasks, job recruitment, hours and wages, and benefits. Chapter 6 gives an overview of farmworkers participation in U.S. agricultural employment and chapter 7 discusses workers participation in non-crop employment, including farm jobs in other types of agriculture, and periods of unemployment. Chapter 8 presents information on farmworkers income, assets, and use of assistance programs, and chapter 9 summarizes health insurance coverage for farmworkers and their family members, health care utilization in the United States, and barriers to health care access. ii
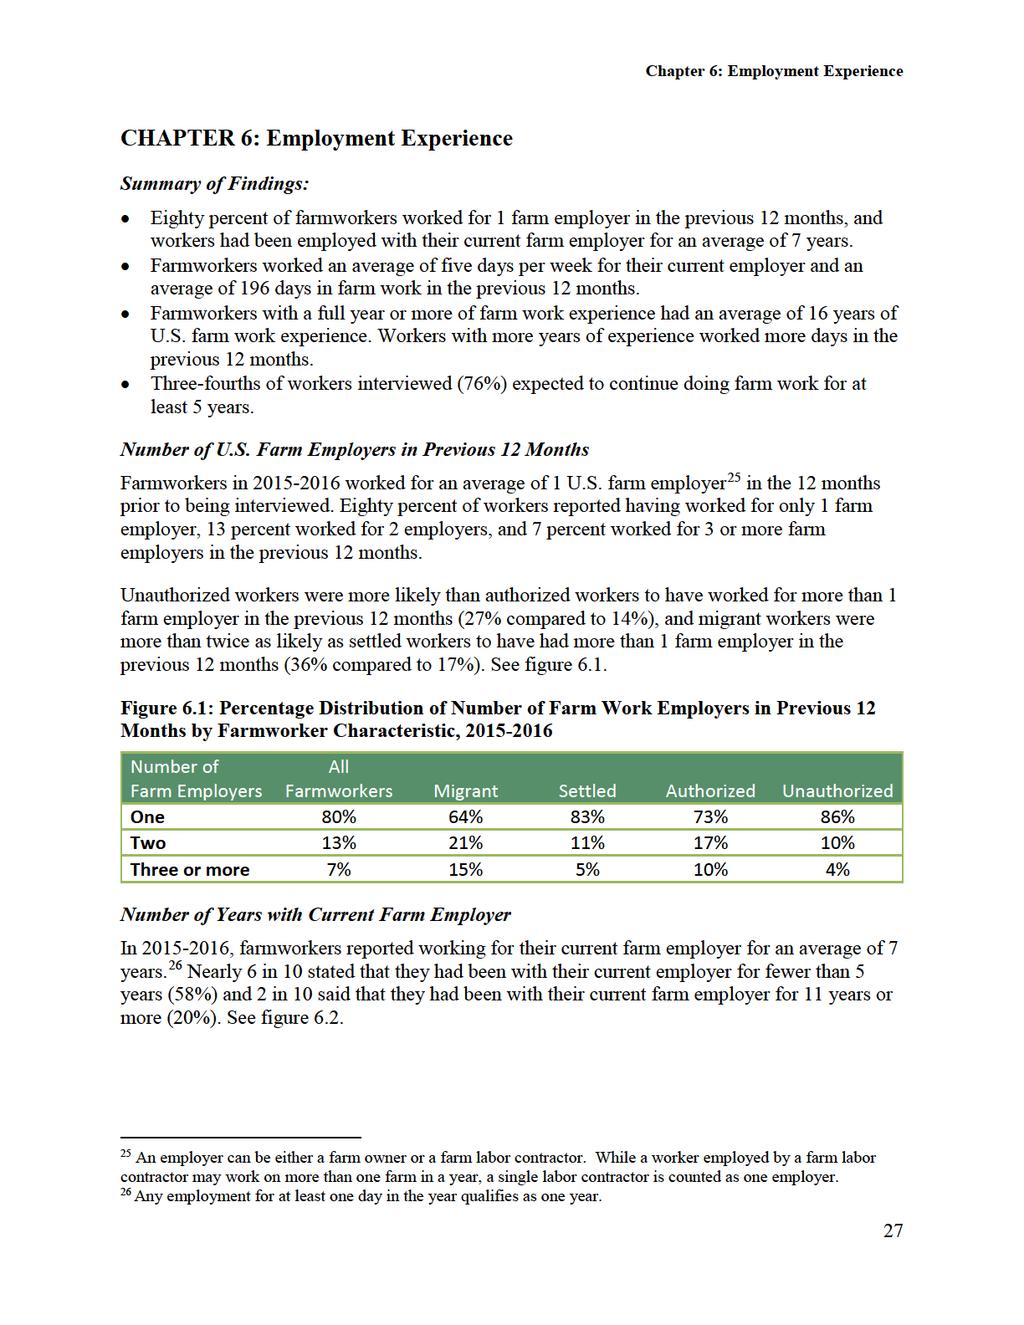
15 Chapter 1: Birthplace, Employment Eligibility, and Migrant Types CHAPTER 1: Birthplace, Employment Eligibility, and Migrant Types Summary of Findings: Nearly 7 in 10 hired farmworkers were born in Mexico (69%). Eighty-three percent of all farmworkers were Hispanic. Among U.S.-born workers, 35 percent were Hispanic. Twenty-four percent of farmworkers self-identified as White, one percent as American Indian or Alaska Native, and three percent as Black or African American. Seventy-three percent of respondents categorized their race with an open-ended other response. Six percent of farmworkers were identified as indigenous. Farmworkers who were in their first year in the United States comprised only four percent of the hired crop labor force. Just more than half of all farmworkers had work authorization (51%). The vast majority of farmworkers were settled workers (81%). Nineteen percent were migrants. Place of Birth Nearly 7 in 10 hired farmworkers interviewed in were born in Mexico (69%), onequarter were born in the United States (24%), 1 percent were born in Puerto Rico 5, 6 percent were born in Central America, and a small portion (1%) originated from various other regions, including South America, the Caribbean, Asia, and the Pacific Islands (figure 1.1). 5 Estimate should be interpreted with caution because it has a RSE of 31 to 50 percent. 1

16 Chapter 1: Birthplace, Employment Eligibility, and Migrant Types Figure 1.1: Place of Birth, Ethnicity and Race Hispanic origin, as defined in the United States, can be viewed as the heritage, nationality group, lineage, or country of birth of the person or the person s parents or ancestors. 6 Foreign-born workers may more readily identify with a national origin rather than an abstract ethnicity concept such as Hispanic or Latino. Workers born in the United States, or those who have been in the United States for several years, may have a better understanding of the U.S-based ethnicity label system. To capture Hispanic identity, farmworkers were asked to indicate which of a variety of categories best described them. Eighty-three percent of workers identified themselves as members of a Hispanic group: 65 percent as Mexican, 9 percent as Mexican-American, and the remaining 9 percent as Chicano, Puerto Rican, or other Hispanic. Among U.S.-born workers, 35 percent self-identified as Hispanic: 20 percent as Mexican-American, 4 percent as Mexican, and 11 percent as Puerto Rican, Chicano, or other Hispanic. Farmworker respondents were also asked to indicate the race with which they identify. Respondents had the opportunity to choose one or more race categories from the standard list 6 Humes, K. R., Jones, N. A., and Ramirez, R. R. (2011). Overview of Race and Hispanic Origin: Census Briefs (p. 2). 2
17 Chapter 1: Birthplace, Employment Eligibility, and Migrant Types required by the U.S. Office of Management and Budget. Twenty-four percent of all respondents in self-identified as White, 1 percent as American Indian or Alaska Native, and 3 percent as Black or African American 7. Nearly three-quarters of respondents gave an answer not on the standard list (73%). Among them, 84 percent classified their race as Latino or Hispanic (including Latino/a, Hispanic, Hispano/a, Mexican, Mexicano/a, Mexican-American, and Chicano), 10 percent referenced their complexion (including moreno/a and café), 3 percent identified with an indigenous group, 2 percent identified with their Central American origin (Guatemalan, Honduran, and Salvadoran), and another 1 percent provided a variety of other responses (examples include American, Filipino, and Portuguese). The categories used in the NAWS questions on ethnicity and race might not be intuitively understood by indigenous individuals who identify themselves as members of a specific community or language group rather than a more generic racial group such as indigenous. Beginning in 2005, the NAWS began supplementing the question on primary language use with questions that ask about adult languages spoken as well as childhood language exposure. 8 The NAWS uses a combination of the responses to these questions and the question about race to identify farmworkers who are indigenous, and in , 6 percent of NAWS respondents were identified as indigenous. Foreign-born Workers First Arrival to the United States While not a measure of continued residence, data on the month and year a foreign-born farmworker first entered the United States provides some information about migration history. For example, time in the United States since first arrival can serve as a measure of attachment to the farm workforce. On average, foreign-born farmworkers interviewed in first came to the United States 18 years before being interviewed. The vast majority of respondents had been in the United States at least 10 years (78%), with more than half arriving at least 15 years prior to their NAWS interview (58%). Farmworkers who first arrived in the United States in the year predating their interview comprised 3 percent of workers interviewed in (figure 1.2). 7 Estimates with relative standard errors (RSE) higher than 30 percent are identified throughout this report. The RSE is calculated by dividing the standard error of the estimate (mean or percentage) by the estimate itself. Estimates with RSEs greater than 30 percent but no more than 50 percent are published but should be used with caution. Estimates with RSEs greater than 50 percent are considered statistically unreliable and are suppressed. The estimate of 3 percent of workers who identified as Black or African American has a RSE of 31 percent to 50 percent and should be interpreted with caution. 8 Gabbard, S., Kissam, E., Glasnapp, J., Nakamoto, J., Saltz, R., Carroll, D. J., & Georges, A. (November, 2012). Identifying Indigenous Mexicans and Central Americans in Surveys. International Conference on Methods for Surveying and Enumerating Hard-to-Reach Populations (November, 2012) New Orleans, LA. 3
 before coming to the United States.")
18 Chapter 1: Birthplace, Employment Eligibility, and Migrant Types Figure 1.2: Years Since First Arrival to the United States, Foreign-born respondents were asked to report where they lived (state/department/province) before coming to the United States. Among Mexico-born workers interviewed in , most came from the states of Michoacán (20%), Guanajuato (15%), Jalisco (10%), Oaxaca (7%), and Guerrero (7%). The greatest proportion of Mexico-born farmworkers originated from the Western Central region (47%), 28 percent came from Northern Mexico, and another 25 percent came from Southern Mexico 9. Work Authorization A series of related questions in the survey provides a picture of whether foreign-born respondents have work authorization. These questions address the foreign-born worker s existing status (citizen, legal permanent resident, border crossing-card holder, applicant for residency, temporary visa holder, or unauthorized) and, when applicable, the date and program under which the individual applied for legal status. In addition, each foreign-born respondent is asked whether he or she has authorization to work in the United States. To be classified as work authorized, a worker must provide consistent answers, and answers that conform to visa regulations. For example, a worker who reports work authorization from a visa program that expired before he or she entered the country would be classified as unauthorized. 9 The Western Central region of Mexico includes the states of Colima, Guanajuato, Jalisco, and Michoacán. The Northern region includes the states of Aguascalientes, Baja California, Chihuahua, Coahuila, Mexico City, Durango, Estado de Mexico, Hidalgo, Nayarit, Nuevo Leon, Queretaro, San Luis Potosi, Sinaloa, Sonora, Tamaulipas, and Zacatecas. The Southern region of Mexico includes the states of Campeche, Chiapas, Guerrero, Morelos, Oaxaca, Puebla, Quintana Roo, Tabasco, Tlaxcala, Veracruz, and Yucatan. 4
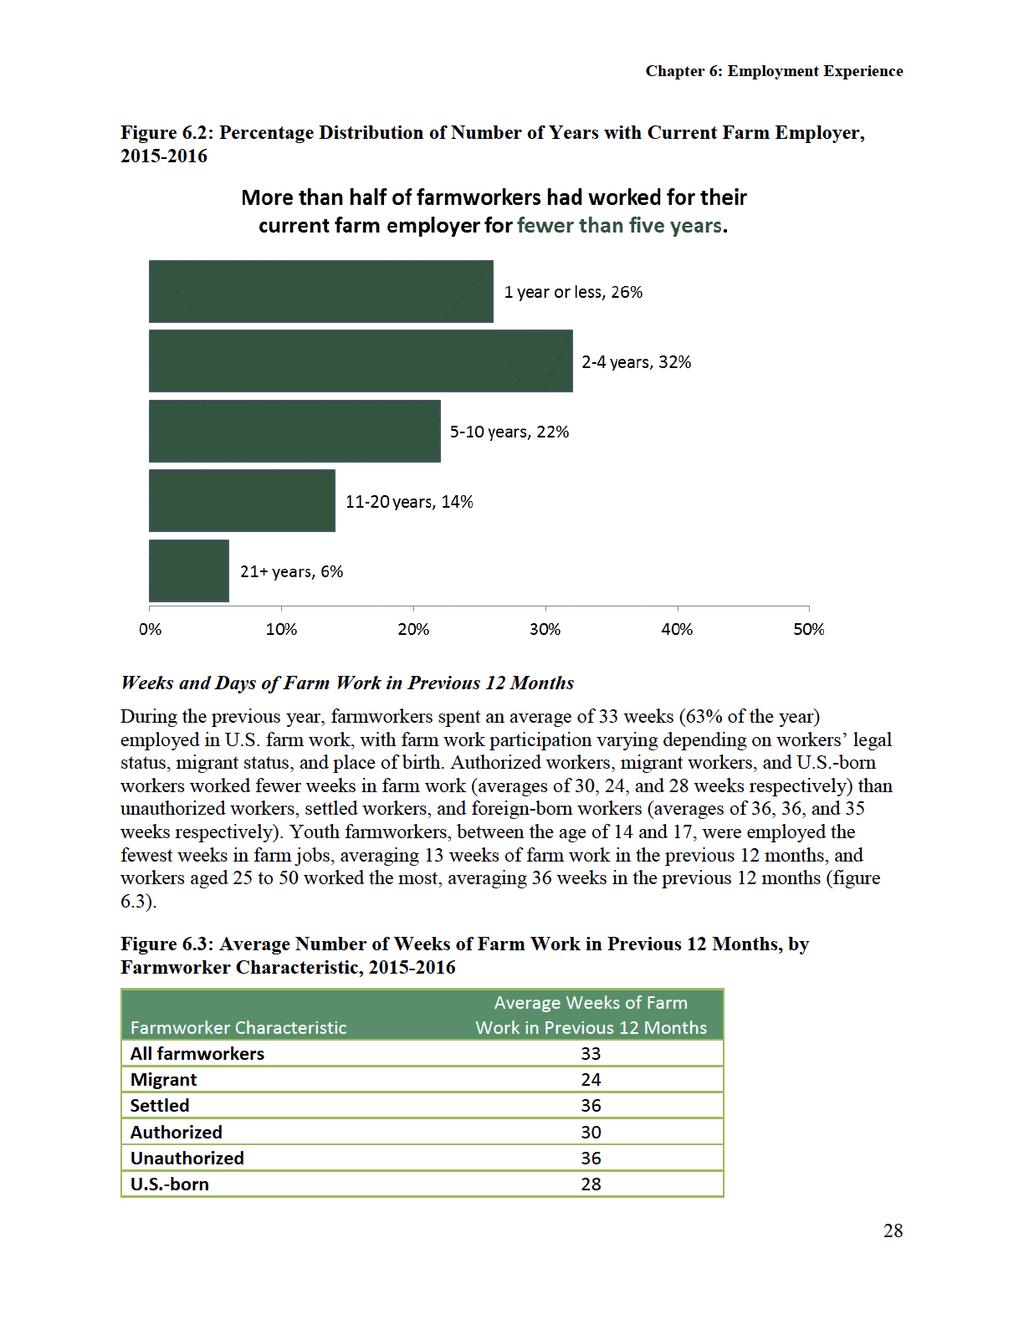
19 Chapter 1: Birthplace, Employment Eligibility, and Migrant Types Fifty-one percent of the hired crop labor force had work authorization in U.S. citizens comprised 29 percent of the work-authorized population and among them, 85 percent were born in the United States and 15 percent were naturalized citizens. The remainder of the work authorized population consisted mainly of legal permanent residents (21%) and 1 percent had work authorization through some other visa program. Migrant Farmworkers The definition of migrant has varied across Federal government agencies and programs that provide services to migrant and seasonal farmworkers. The NAWS has defined a migrant as a person who reported jobs that were at least 75 miles apart or who reported moving more than 75 miles to obtain a farm job during a 12-month period 10. Interpreting migration patterns requires some caution. Since the analysis presented here covers only one year of farm employment data, these definitions describe movement during that particular year. The discussion below assumes that most of the workers making a move during the year were cyclical migrants. However, a portion of these workers may have been making a permanent move. For the purpose of this report, migrant farmworkers were categorized according to their migrant travel patterns. Migration consisted of moving from a home base, the location where the migrant spent the greatest amount of time during the year preceding his/her NAWS interview, to one or more destination locations where work was available. Shuttle migrants were workers who did not work on a U.S. farm at their home base, but who traveled 75 miles or more to do farm work in a single U.S. location, and worked only within a 75-mile radius of that location. Followthe-crop migrants were workers who traveled to multiple U.S. farm locations for work. Followthe-crop migrants might or might not have done U.S. farm work at their home base. This report further classifies migrants into domestic migrants (those who traveled solely within the United States in the 12 months preceding their interview to do farm work) or international migrants (those who crossed the U.S. border to do farm work). Nineteen percent of farmworkers interviewed in were migrants. Among them, nearly half were domestic migrants (27% domestic follow-the-crop and 21% domestic shuttle migrants), a third were international migrants (3% international follow-the-crop and 32% international shuttle migrants), and 18 percent were newcomers who had been in the U.S. less than a year (see figures 1.3 and 1.4). 10 Migrant programs often use a 24-month look-back period in their definitions of migrant. The NAWS collects data about travel to another city to do farm work during the 12 months preceding the NAWS interview, and also the 12 months prior to that. In , 24 percent of farmworkers reported that they traveled to another city to do farm work sometime during the previous 24 months. 5


20 Chapter 1: Birthplace, Employment Eligibility, and Migrant Types Figure 1.3: Distribution of Migrant Types (As Percent of Migrants), Figure 1.4: Distribution of Migrant Types According To Their Migrant Travel Patterns (As Percent of Migrants),

21 Chapter 2: Demographics, Family Size, and Children and Household Structure CHAPTER 2: Demographics, Family Size, and Children and Household Structure Summary of Findings: Sixty-eight percent of farmworkers were men. Farmworkers were relatively young: their average age was 38. Fifty-seven percent of farmworkers were married and 55 percent had children. Forty percent of farmworkers were living apart from all nuclear family members at the time of their interview. Seventy-three percent of the unaccompanied were single workers without children, 20 percent were parents, and 7 percent had a spouse but no children. Gender and Age In , the U.S. crop labor force was predominantly male (68%) and relatively young, with an average age of 38. Just under half of all workers were under the age of 35 (44%) and 14 percent were age 55 or older (figure 2.1). Figure 2.1: Age Distribution of Farmworkers, In , unauthorized workers were younger than authorized workers (an average of 36 and 41 years of age respectively) and newcomers to U.S. farm work (i.e., those arriving in the United States within the year prior to interview) were younger than experienced workers (an average of 25 and 39 years of age respectively). The average age of males and females was nearly the same 38 and 39 years respectively. 7
. Among parents, 76 percent were married or living together, 14 percent were single, and 10 percent were separated, divorced, or widowed.")
22 Chapter 2: Demographics, Family Size, and Children and Household Structure Marital Status and Family Type More than half of farmworkers interviewed in were married (57%) and more than half were parents (55%). Among parents, 76 percent were married or living together, 14 percent were single, and 10 percent were separated, divorced, or widowed. Children and Household Structure In , farmworker parents with minor children living in their household had an average of 2 minor children living with them at the time they were interviewed. Sixty-seven percent of these parents had 1 or 2 minor children living with them (29% and 38% respectively), 23 percent had 3 minor children, 7 percent had 4 minor children, and 2 percent had 5 or more minor children (figure 2.2). Figure 2.2: Number of Minor Children in the Household of Farmworkers, Of parents with children under the age of 18, 53 percent had children younger than age 6, 65 percent had children ages 6-13, and 38 percent had children ages Three percent of parents resided with only some of their minor children and 17 percent lived away from all their minor children. Migrant parents were nearly three times more likely than settled parents to be living away from all their minor children (37% and 13% respectively). Unaccompanied farmworkers, defined as those who were living apart from all nuclear family members (parents, siblings, spouse, and children) at the time of their interview, comprised 40 8

23 Chapter 2: Demographics, Family Size, and Children and Household Structure percent of the U.S. crop labor force in Migrant workers were much more likely than settled workers to be unaccompanied (61% and 35% respectively) as were men when compared to women (49% and 23% respectively). See Figure 2.3. The majority of the unaccompanied were single workers without children (73%), 20 percent were parents, and 7 percent had a spouse but no children. Figure 2.3: Percent of Farmworkers Unaccompanied by Nuclear Family, Among farmworker parents in , nearly all mothers (98%) and approximately threequarters of fathers (77%) were accompanied by at least some nuclear family members. Similarly, among married workers without children, 95 percent of women and 75 percent of the men were accompanied at the time of the interview. 9
24 Chapter 3: Language, Education, and English Skills CHAPTER 3: Language, Education, and English Skills Summary of Findings: Approximately three-quarters of farmworkers reported that Spanish is their primary language (77%). Twenty-nine percent of workers reported that they could speak English well and 30 percent said not at all. Twenty-eight percent reported that they could read English well while 41 percent said not at all. The average level of formal education completed by farmworkers was eighth grade. Thirty-five percent of workers reported having taken at least one adult education class in the United States. Primary Language In , approximately three-quarters of farmworkers said that Spanish was the language in which they are most comfortable conversing (77%), 21 percent said English was, and 1 percent reported an indigenous language 11. Among workers born in Mexico or Central America, nearly all reported that Spanish was their primary language (97%). Of the remainder, one percent said that English was their primary language and two percent reported an indigenous language as the one in which they are most comfortable conversing. English Language Skills Farmworkers were asked two questions about their English fluency, How well do you speak English? and How well do you read English? In , 30 percent of workers responded that they could not speak English at all, 32 percent said they could speak English a little, 9 percent said they could speak English somewhat, and 29 percent said they could speak English well. Regarding their ability to read English, 41 percent of workers reported they could not read English at all, 24 percent said they could read English a little, 7 percent said they could read English somewhat, and 28 percent said they could read English well (figure 3.1) Indigenous languages reported by farmworkers interviewed in include Acateco, Amuzgo, Chatino, Chuj, Mam, Nahuatl, Popti, Purepecha/Tarasco, Tlapaneco, and Triqui. 12 Respondents self-reports of language proficiency could be higher or lower than their actual proficiency. 10

25 Chapter 3: Language, Education, and English Skills Figure 3.1: Farmworkers' Self-Reported English Speaking and Reading Ability, Farmworkers who reported having a primary language other than English were asked to indicate how well they could speak and read in that language. Among workers whose primary language was Spanish, nearly all reported they could speak Spanish well (98%). In describing their Spanish reading ability, 81 percent responded with well, 10 percent replied with somewhat, 7 percent said a little, and 2 percent replied with not at all. 13 (figure 3.2). 13 Estimate should be interpreted with caution because it has a RSE of 31 to 50 percent. 11
26 Chapter 3: Language, Education, and English Skills Figure 3.2: Among Farmworkers Whose Primary Language Is Spanish, Self-Reported Spanish Speaking and Reading Ability, a Estimate should be interpreted with caution because it has a RSE of 31 percent to 50 percent. Education In , farmworkers average educational attainment was eighth grade. Four percent of workers reported that they had no formal schooling and 37 percent reported that they completed the 6 th grade or lower. Nineteen percent of workers said they completed grade 7, 8, or 9, and 30 percent said they completed grade 10, 11, or 12. Ten percent of farmworkers reported completing some education beyond high school (figure 3.3). 12

27 Chapter 3: Language, Education, and English Skills Figure 3.3: Distribution of Highest Grade Completed by Farmworkers, The highest grade completed varied by place of birth. On average, the highest grade completed by workers born in the United States was 12 th and the highest grade completed by workers born in Mexico or other countries was 7 th. Approximately 7 in 10 U.S.-born farmworkers completed the 12 th grade or higher (68%), as did 18 percent of Mexico-born workers and 21 percent of workers born in other countries. Adult Education In , 35 percent of farmworkers reported having taken at least one adult education class in the United States. The most common classes were English (12%), job training (14%), college or university classes (7%), and high school equivalency (GED) classes (3%). Small shares of workers (2%) reported taking other types of classes (figure 3.4). 13
28
29 Chapter 4: Housing Characteristics CHAPTER 4: Housing Characteristics and Distance to Work Summary of Findings: Fifteen percent of farmworkers lived in property owned or administered by their current employer: 12 percent on the farm of the grower for whom they were working and 4 percent off the farm. Fifty-seven percent of workers lived in detached, single-family houses. One-third of farmworkers lived in a dwelling defined as crowded (33%). Seven in 10 workers lived fewer than 25 miles from their current farm job (70%) and 16 percent lived between 25 and 49 miles from work. Eleven percent of workers lived where they worked. Fifty-eight percent of workers drove a car to work, 15 percent rode with a raitero 14, and 6 percent took a labor bus, truck, or van. Location of Housing and Payment Arrangement Farmworkers provided information about their housing situation (arrangement, location, type, and occupancy) while working at their current farm job. Fifteen percent of farmworkers lived in employer-provided housing (i.e., property owned or administered by their current employer): 12 percent on the farm of the grower for whom they were working and 4 percent off the farm. The remaining 84 percent of workers lived in property not owned or administered by their current employer. Employer-provided housing (either on or off the employer s farm) was most common in the Eastern migrant stream 15, with 24 percent of farmworkers interviewed in reporting that they lived in employer-provided housing, compared to 15 percent of workers in the Midwest migrant stream and 12 percent in the Western migrant stream (figure 4.1). 14 Raitero, derived from ride, is the Spanish word for a person who charges a fee for providing a ride to work. 15 Migrant streams are one way of showing usual patterns of migration and the linkages between downstream and upstream states that many migrants travel in search of farm work. While these patterns are typical, some migrants may cross streams in their search for work. A map of the NAWS migrant streams can be found in Appendix B. 15

30 Chapter 4: Housing Characteristics Figure 4.1: Percent of Farmworkers Who Lived in Employer-Provided Housing, a A map of the NAWS migrant streams can be found in Appendix B. In addition to information about the location of their housing, farmworkers provided information about the payment arrangements they had for their housing. In , more than half of all farmworkers reported that they lived in housing that they rented from someone other than their employer (54%), 28 percent of workers said they lived in a home owned by themselves or a family member, 1 percent said they paid rent for housing provided by the government, a charity, or other organization, and sixteen percent of workers lived in employer-provided housing. Among those living in employer-provided housing, 11 percent received it free of charge, 2 percent paid rent either directly or via payroll deduction, and 4 percent had other arrangements with their employers. Migrant workers were nearly 3 times more likely than settled workers to live in employerprovided housing that they received free of charge (22% and 8% respectively) and far less likely than settled workers to live in a home that they or a family member owned (16% and 31% respectively). See figure
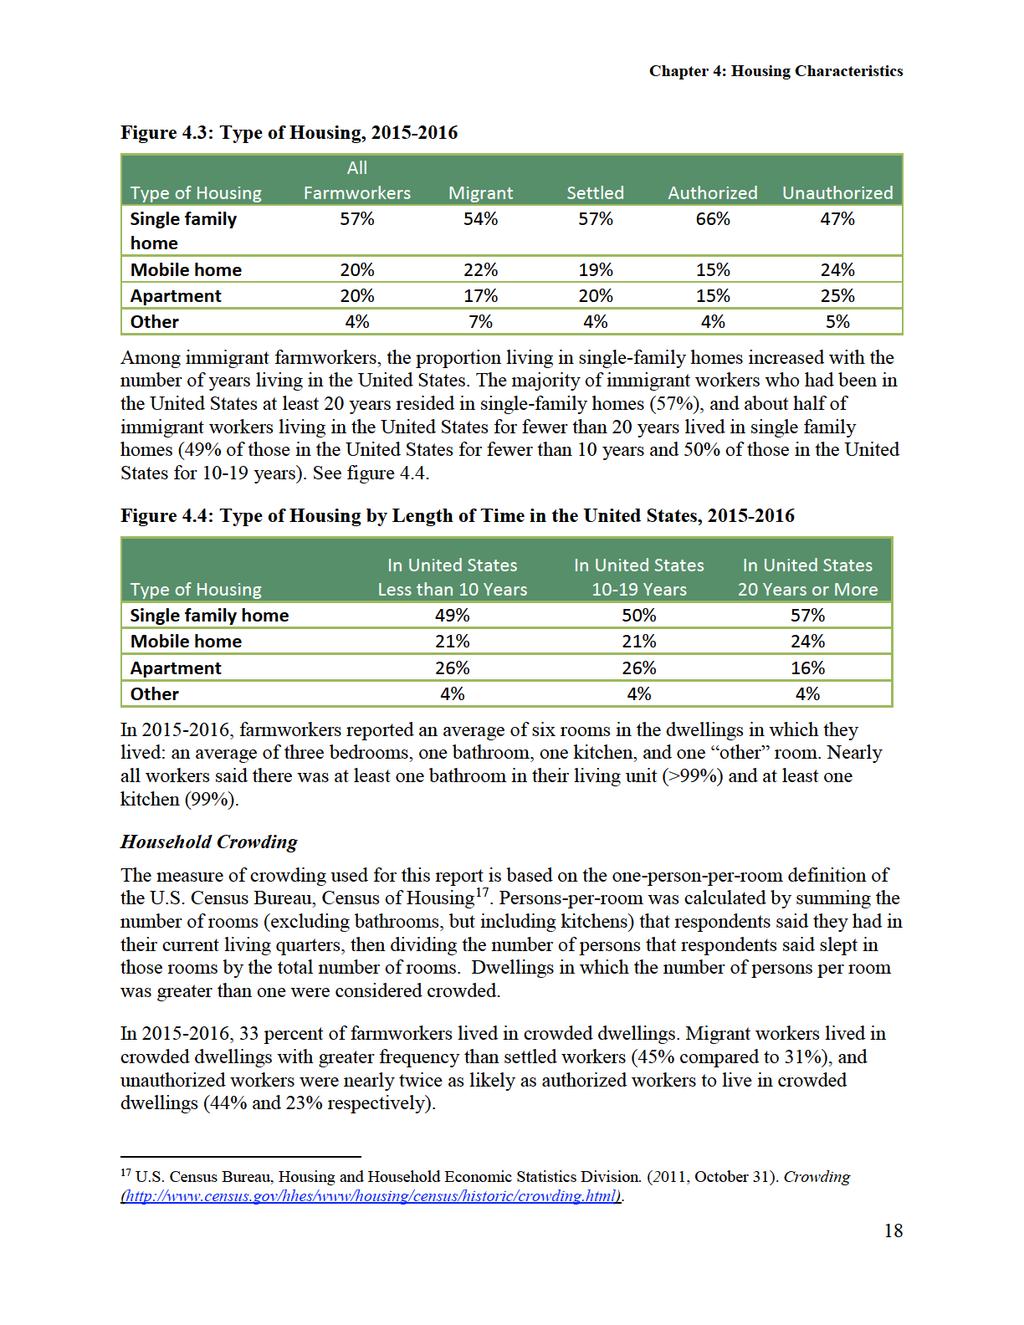
31 Chapter 4: Housing Characteristics Figure 4.2: Housing Arrangement, Farmworkers who reported that they paid for their housing were asked how much they paid at their current residence, including for their family if their family lived with them. Nine percent reported that they paid less than 200 dollars per month, approximately a third said they paid dollars per month (32%), 24 percent paid dollars per month, and 35 percent paid 600 dollars or more per month. Type of Housing In , more than half of farmworkers reported living in detached, single-family houses (57%), 20 percent said they lived in a mobile home, and another 20 percent lived in an apartment. The remaining four percent lived in various other types of housing. 16 Migrant workers were slightly less likely than settled workers to report living in detached, single-family homes (54% and 57% respectively) or apartments (17% and 20% respectively), and slightly more likely than settled workers to live in mobile homes (22% and 19% respectively). Unauthorized workers were less likely than authorized workers to reside in singlefamily homes (47% and 66% respectively) and more likely to live in mobile homes (24% and 15% respectively) and apartments (25% and 15% respectively). See figure Other types of housing in which farmworkers reporting living included a duplex or triplex, dormitory or barracks, motel or hotel, or other. 17
32
33 Chapter 4: Housing Characteristics Distance to Work and Transportation When asked how far their current farm job was from their current residence, 11 percent of farmworkers in reported that they lived where they worked, 31 percent said they lived within 9 miles of their job location, 39 percent lived between 10 and 24 miles from work, 16 percent lived between 25 and 49 miles from work, and 3 percent 18 lived 50 or more miles from work. Farmworkers used various modes of transportation to get to work. In , 58 percent of workers reported that they drove a car (63% of workers said they owned a car or truck, as discussed in chapter 8) and 8 percent said they walked or took public transit. Thirty-three percent of workers did not provide their own transportation but commuted via rides with others (13%), rides with a raitero 19 (15%), or rides on a labor bus, truck or van (6% 20 ). Among workers who did not provide their own transportation, seven percent reported that it was mandatory or obligatory for them to use their current mode of transportation. Twenty-eight percent of these workers reported having to pay a fee for these rides to work and 39 percent said they paid, but only for gas. Thirty-two percent said they paid no fee for their rides with the raitero, on the labor bus, or with others. 18 The estimate of 3 percent of farmworkers who reported living 50 or more miles from their current farm job should be interpreted with caution because it has a RSE of 31 percent to 50 percent. 19 Raitero, derived from ride, is the Spanish word for a person who charges a fee for providing a ride to work. 20 The estimate of 6 percent of farmworkers who reported that their mode of transportation to work was a labor bus, truck, or van should be interpreted with caution because it has a RSE of 31 percent to 50 percent. 19
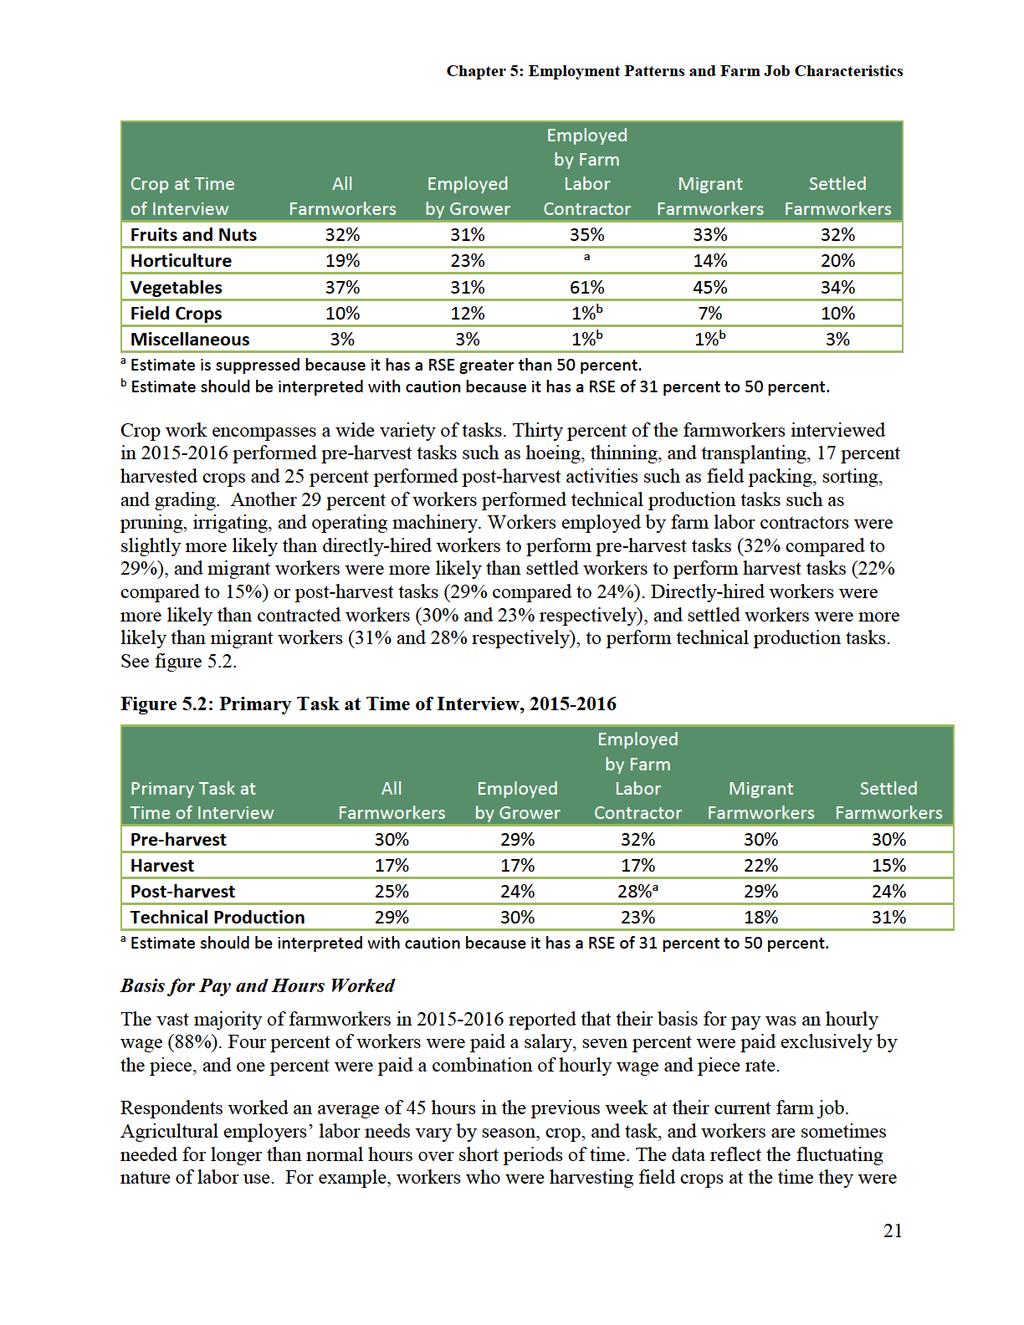
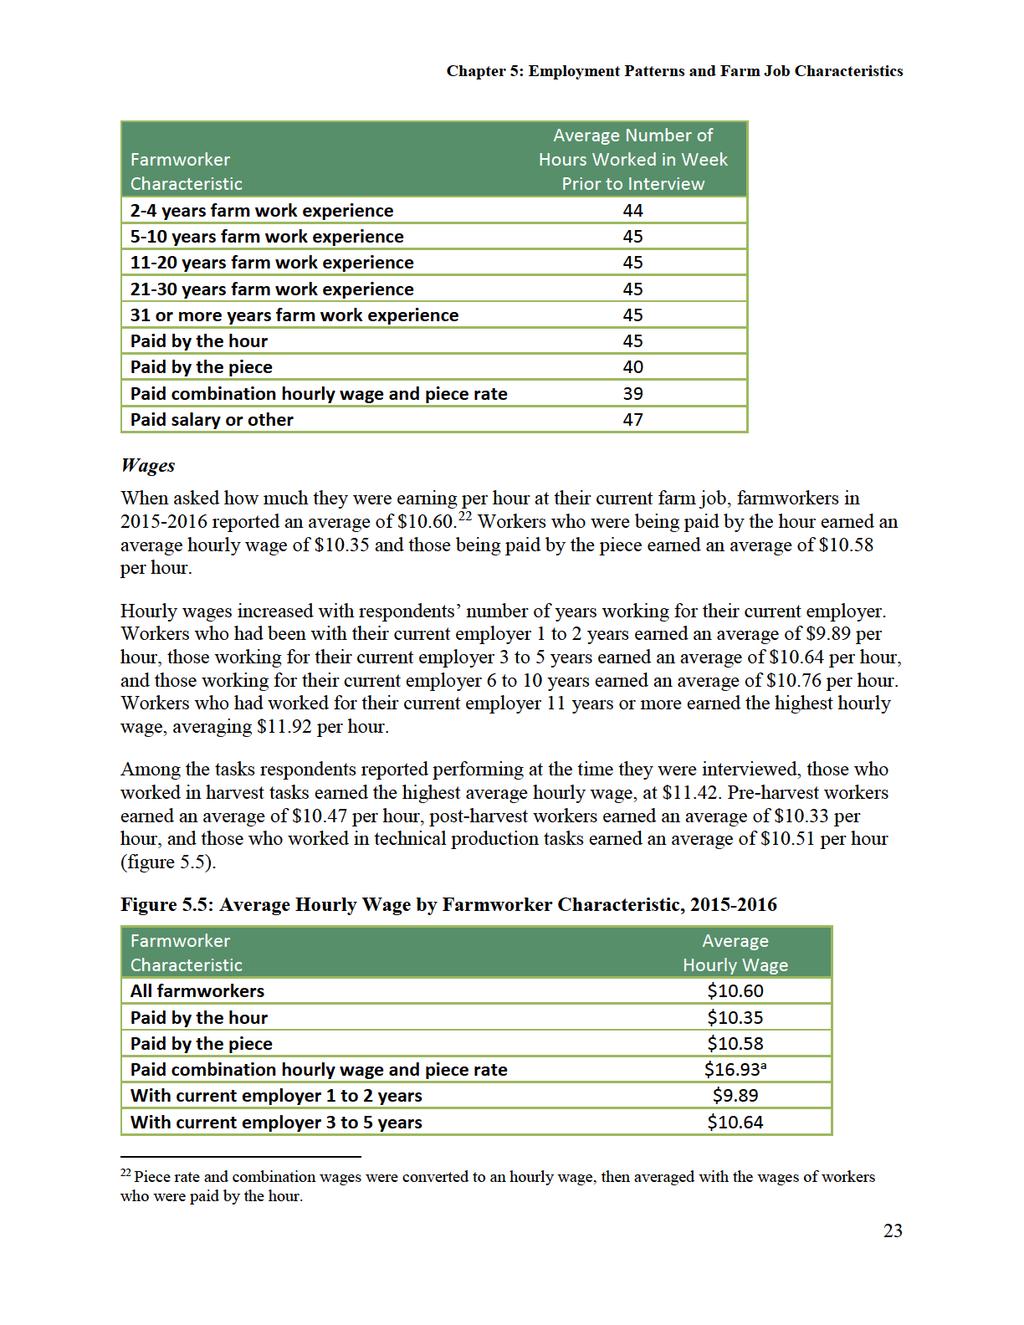
34 Chapter 5: Employment Patterns and Farm Job Characteristics CHAPTER 5: Employment Patterns and Farm Job Characteristics Summary of Findings: Eight in 10 farmworkers were employed directly by growers (80%); 20 percent were employed by farm labor contractors. At the time of interview, 32 percent of farmworkers were working in fruit and nut crops, 37 percent in vegetable crops, and 19 percent in horticulture. Ten percent were working in field crops and three percent were working in mixed crops. At the time of interview, 30 percent of farmworkers were performing pre-harvest tasks, 17 percent were harvesting crops, 25 percent were performing post-harvest activities, and 29 percent were performing technical production tasks. The majority of farmworkers reported that their basis for pay was an hourly wage (88%). Workers reported earning an average of $10.60 per hour at their current farm job. Forty-three percent of farmworkers reported that they were covered by Unemployment Insurance (UI) if they were to lose their current job, 62 percent said they would receive workers compensation if they were injured at work or became ill as a result of their work, and 18 percent reported that their employer offered health insurance for injury or illness suffered while not on the job. Type of Employer and Job Recruitment Most farmworkers in were employed directly by growers 21 (80%); farm labor contractors employed the remaining 20 percent. Nearly 7 in 10 workers reported that they found their current job via references from friends or relatives (69%) and approximately one-quarter got their job after applying for it on their own (24%). Five percent of workers were recruited by a grower, foreman, or labor contractor, and the remaining two percent were referred to their job by an employment service, or welfare office, were hired under union-employer agreements, or found their job via some other means. Primary Crops and Farm Job Tasks At the time they were interviewed in , 88 percent of farmworkers reported working in fruits, nuts, vegetables, and horticultural crops (32% in fruits and nuts, 37% in vegetables, and 19% in horticulture). Ten percent held jobs in field crops and three percent worked in mixed crops or other crops. Workers employed by farm labor contractors were nearly twice as likely as those employed directly by growers to work in vegetable crops (61% compared to 31%), and about equally as likely as directly-hired workers to work in fruit and nut crops (35% compared to 31%). Migrant farmworkers worked in vegetable crops with greater frequency than did settled workers (45% and 34% respectively), but were less likely than settled workers to have jobs in horticultural crops (14% and 20% respectively). See figure 5.1. Figure 5.1: Primary Crop at Time of Interview, Growers include owners of establishments (i.e., farms, orchards, greenhouses, and nurseries) that engage primarily in growing crops, plants, or trees, but can also include other types of crop producers, such as packers, shippers, or distributors. 20
35
36
37
38
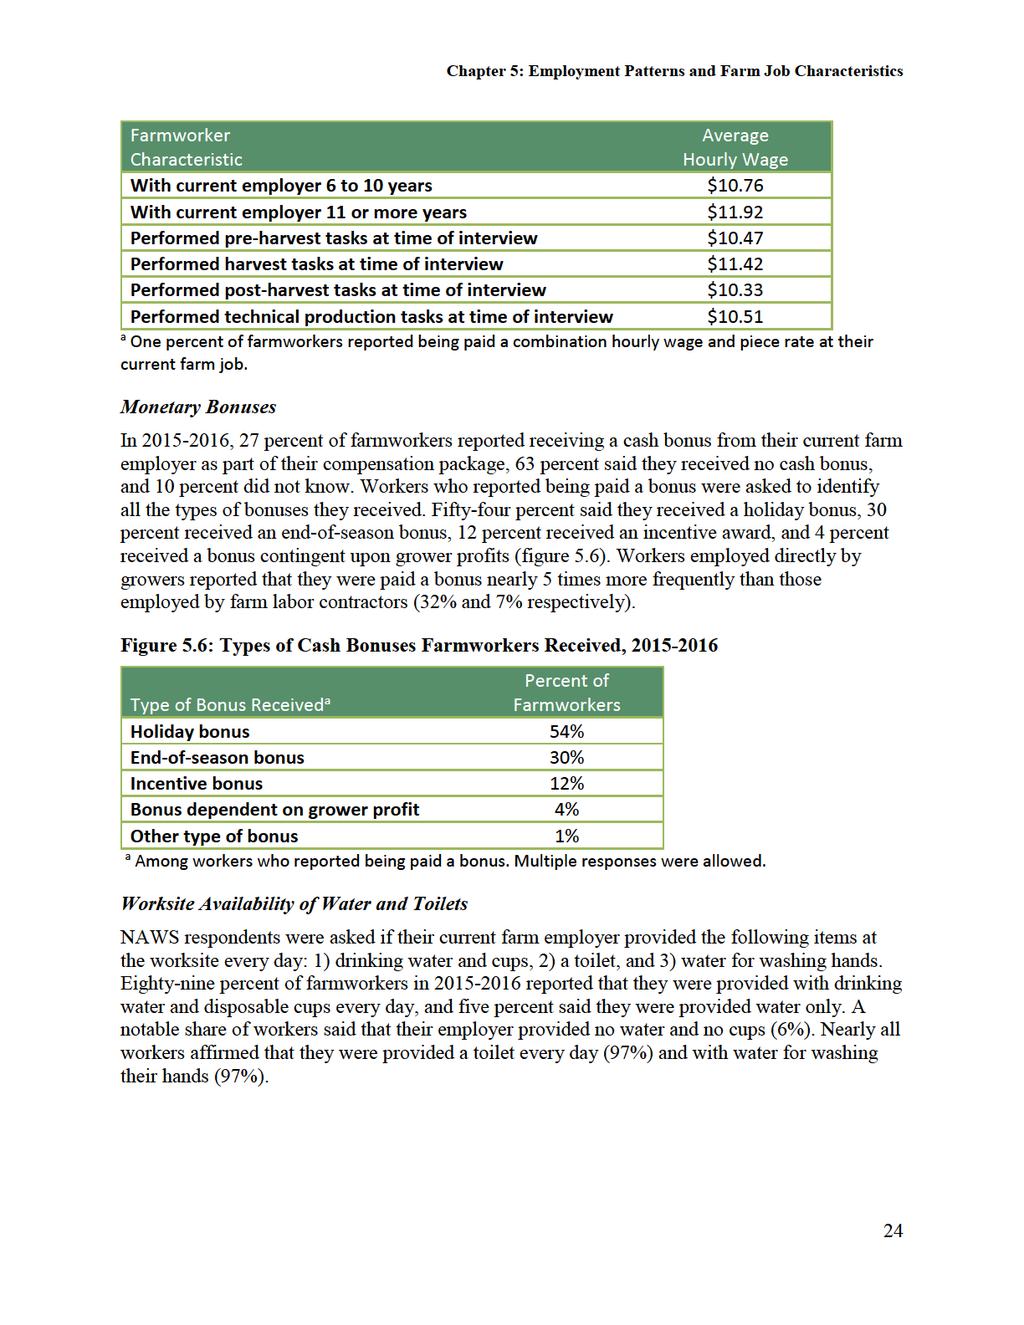
39 Chapter 5: Employment Patterns and Farm Job Characteristics Pesticide Training The NAWS asks all respondents whether, at any time in the last 12 months, their current employer provided them with training or instruction in the safe use of pesticides. In , 57 percent of farmworkers reported that they did receive this type of training. Insurance Benefits NAWS respondents were asked whether they were covered by UI if they were to lose their current job. Forty-three percent of farmworkers interviewed in said yes, 52 percent said no, and 5 percent did not know. 23 Workers with authorization to work in the United States were far more likely than unauthorized workers to report that they would be covered by UI (80% and 5% respectively). Of the 43 percent of respondents who reported that they would not be covered by UI, 88 percent were unauthorized and would not qualify for the benefit. When asked if they would receive workers compensation if they were injured at work or got sick as a result of their work, approximately 6 in 10 farmworkers said yes (62%), 16 percent said no, and 22 percent did not know. 24 Furthermore, when asked whether their employer provided health insurance or paid for medical treatment for injury or illness suffered while off the job (regardless of whether or not the worker accepted or used the insurance), 18 percent confirmed that their employer offered such a benefit, 71 percent said their employer did not, and 11 percent were unsure. Authorized workers were more likely than unauthorized workers to report that they were covered by workers compensation insurance (68% and 56% respectively) and to say that their employer offered health insurance for non-work-related injury or illness (23% and 13% respectively). See figure 5.7. A discussion of farmworkers possession of health insurance coverage for themselves and their family members can be found in chapter UI coverage varies by state. For agricultural labor in the majority of states, employers are required to pay UI taxes if they paid wages in cash of $20,000 or more for agricultural labor in any calendar quarter in the current or preceding calendar year, or who employed 10 or more workers on at least 1 day in each of 20 different weeks in the current or immediately preceding calendar year. U.S. Department of Labor, Employment and Training Administration. (2017). Comparison of State Unemployment Insurance Laws ( p. 1-2). 24 The rules for workers compensation coverage for agricultural workers vary among states. In 14 states, Puerto Rico and the Virgin Islands, rules require employers to cover seasonal agricultural workers to the same extent as all other workers. In an additional 21 states, employers provide workers compensation but coverage is limited to certain classifications of agricultural employers or workers such as the number of full-time workers employed. Fifteen states have optional coverage, allowing employers to elect to provide workers compensation coverage to their employees, though the coverage is not required by law. In many of these states, workers compensation is required for employers in other industries but optional for agriculture. A Guide to Workers' Compensation for Clinicians Serving Agricultural Workers ( Farmworker Justice and Migrant Clinicians Network (2015). 25

40 Chapter 5: Employment Patterns and Farm Job Characteristics Figure 5.7: Percent of Farmworkers Whose Employer Offers Health Insurance,
41
42
43

44 Chapter 6: Employment Experience Figure 6.5: Years U.S. Farm Work Experience, a Among workers with at least one year of U.S. farm work experience. Farmworkers with more years of experience were more likely to have authorization to work in the United States; 52 percent of workers with 10 years or more of farm work experience were work-authorized, while 46 percent of those with one to nine years of experience had work authorization. Additionally, farmworkers with more years of experience performed more days of farm work during the previous year. Respondents who had between 1 and 5 years of farm work experience worked an average of 166 days in farm work in the previous 12 months, while those with 11 years or more of experience averaged 232 days of farm work. Other Work History Farmworkers were asked to report the approximate number of years they had done non-crop work in the United States. Forty-five percent of farmworkers in reported at least 1 year of non-crop work 27 (figure 6.6), and they had an average of 8 years of non-crop work experience. 27 Any year in which 15 days of non-crop work were performed counts as one year of non-crop work. 30
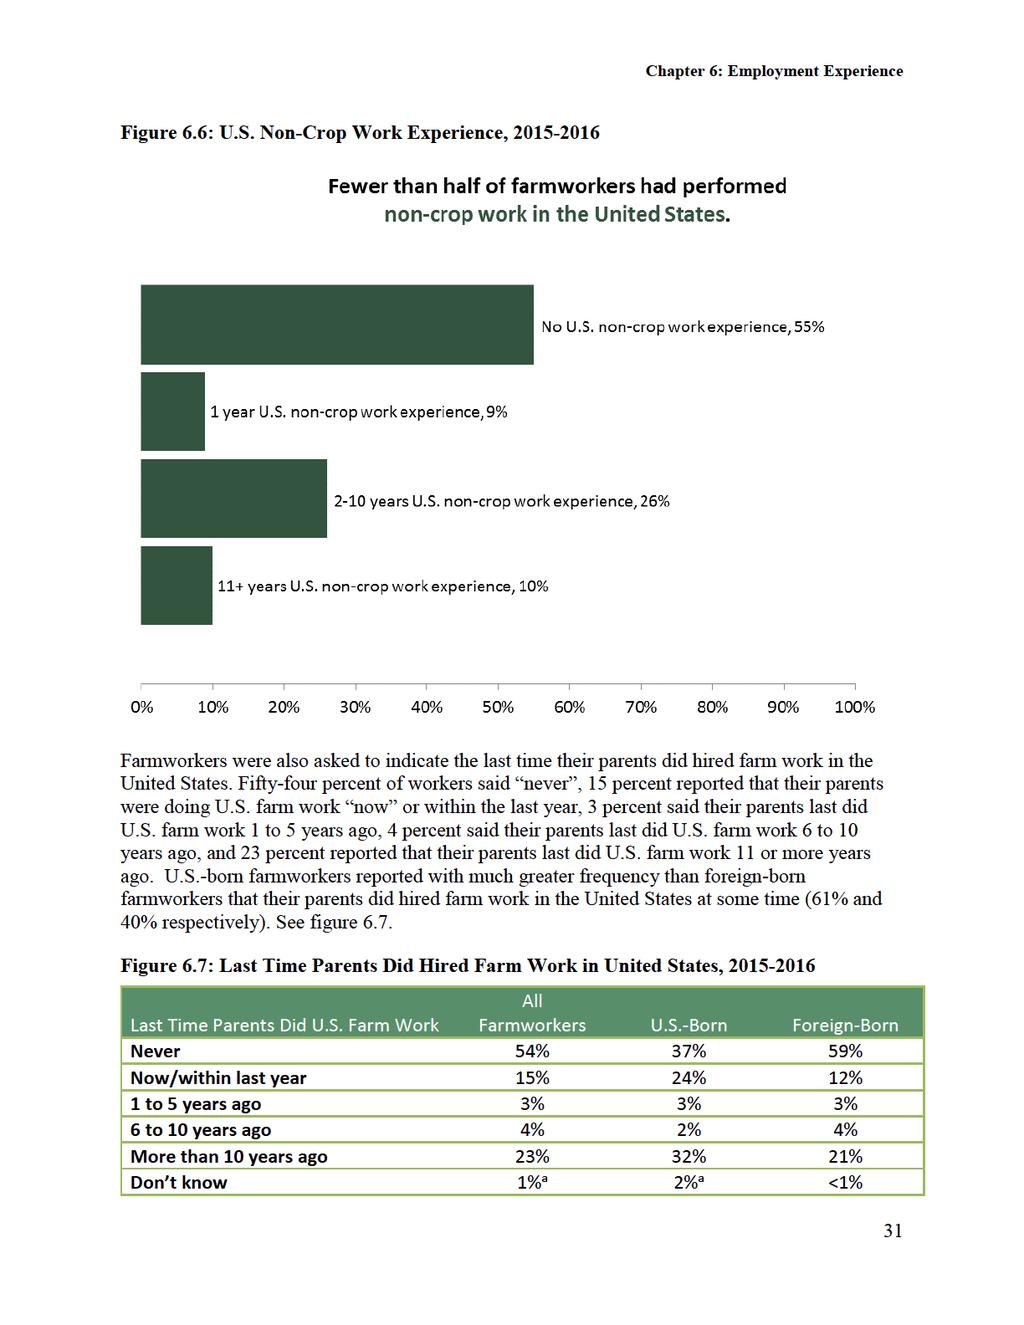
45
46 Chapter 6: Employment Experience a Estimates should be interpreted with caution because they have RSEs of 31 percent to 50 percent. Plans to Remain in Farm Work When asked how long they expected to continue to do farm work, 76 percent of workers interviewed in believed they would continue for more than 5 years, most of whom indicated further that they would continue as long as they are able to do the work (74%). Four percent of respondents stated that they would continue working in agriculture for less than one year, 12 percent planned to remain in farm work for 1 to 3 years, 4 percent stated that they would continue in farm work for 4 to 5 years, and 3 percent were unsure. 32
47

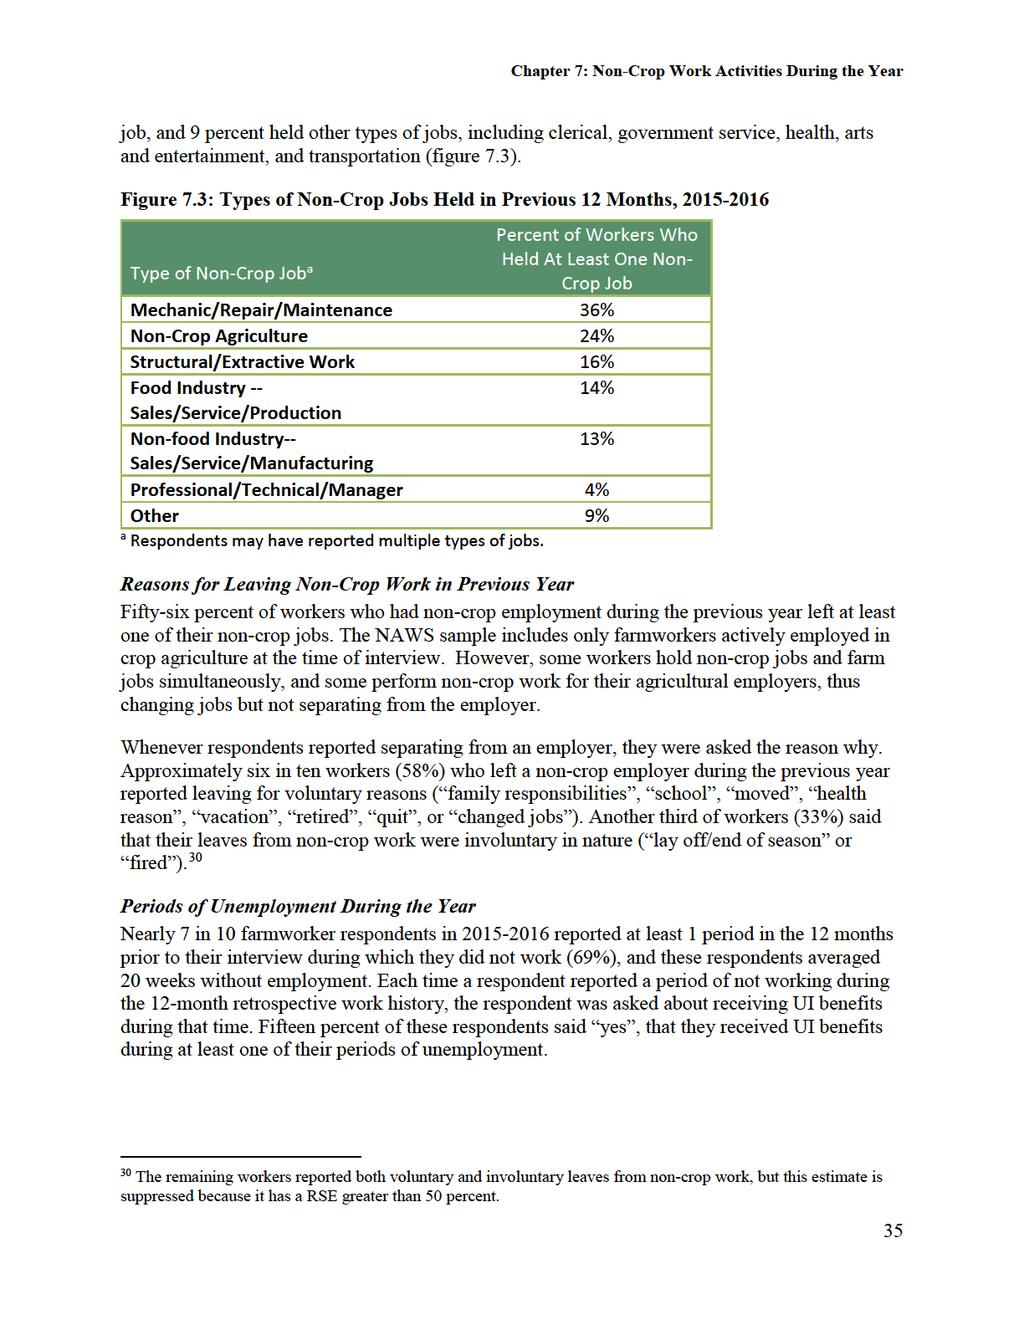
48 Chapter 7: Non-Crop Work Activities During the Year a Estimates should be interpreted with caution because they have RSEs of 31 percent to 50 percent. b Estimate is suppressed because it has a RSE greater than 50 percent. Non-Crop Work in Previous 12 Months Twenty-four percent of farmworkers reported at least one non-crop job in the United States during the previous year. U.S.-born workers were nearly 3 times more likely than foreign-born workers to have had a non-crop job in the previous 12 months (45% compared to 17%) and authorized workers were twice as likely as unauthorized workers to have had a non-crop job (31% compared to 16%). See figure 7.2. Figure 7.2: Percent of Farmworkers Who Held a Non-Crop Job the Previous Year, The 24 percent of farmworkers who reported doing non-crop work during the previous year spent an average of 25 weeks in non-crop employment and they held an average of 2 non-crop jobs. The most common types of jobs they held were mechanic, repair, or maintenance jobs (36% of workers) and other types of non-crop agricultural jobs 28 such as livestock, forestry and fisheries (24%). Sixteen percent did structural or extractive work 29, 14 percent held a sales, service, or production job in the food industry, 13 percent held a job sales, service, or manufacturing job in a non-food industry, 4 percent had a professional, technical, or managerial 28 Since the survey s inception, crop workers have been asked about jobs they ve had outside of crop agriculture. Some non-crop jobs are farm jobs in other types of agriculture. 29 Structural jobs, as coded in the NAWS, include working in construction. Extractive jobs involve the removal of raw materials from the earth. Examples of extractive processes include oil and gas extraction, mining, dredging and quarrying. html 34
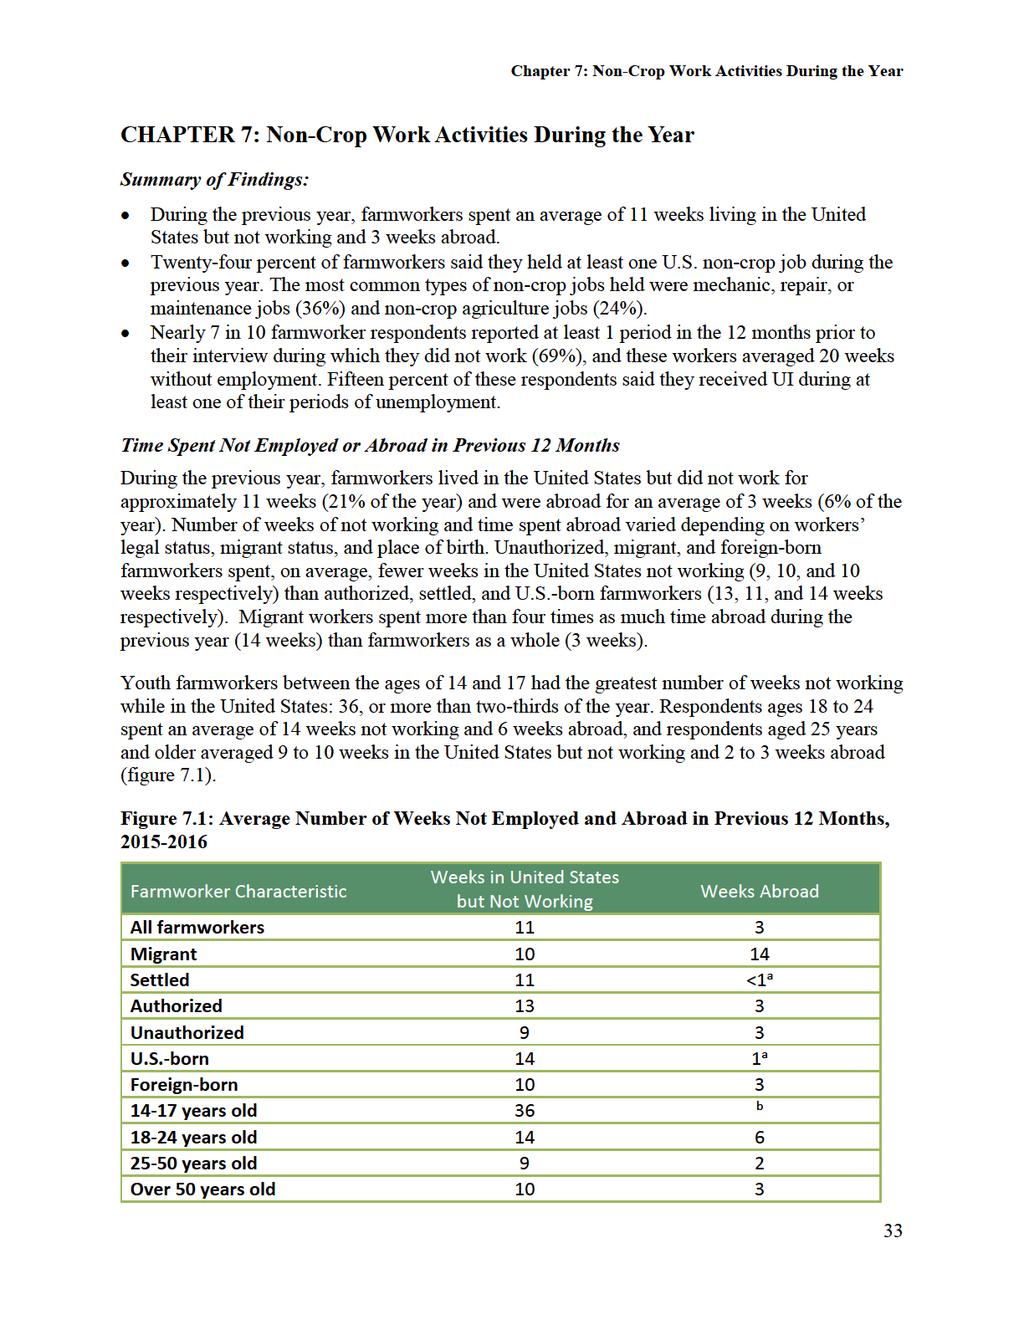
49
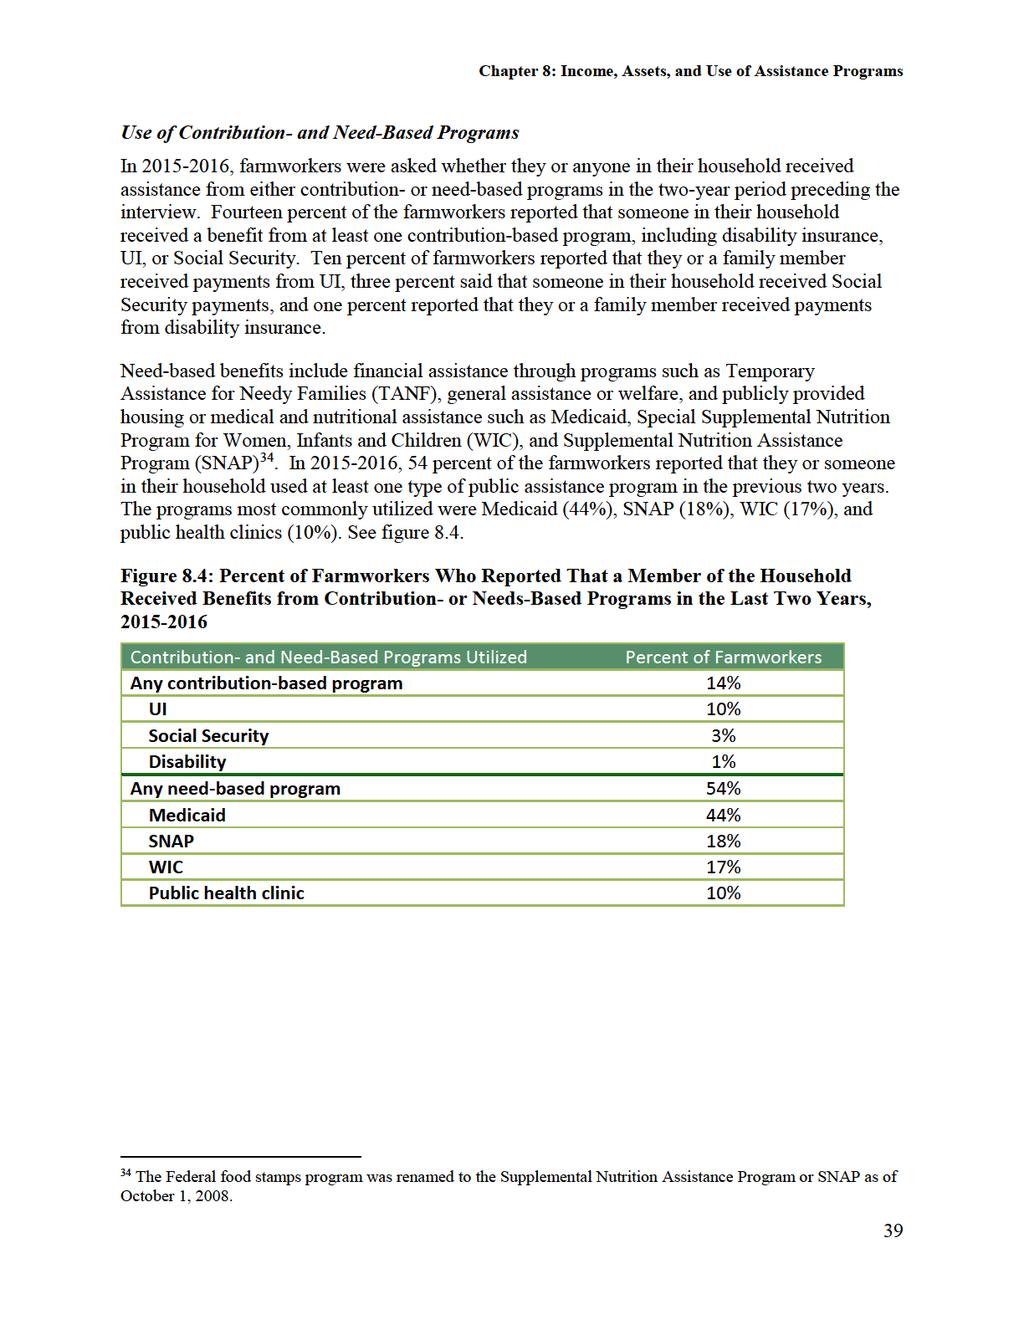
50 Chapter 8: Income, Assets, and Use of Assistance Programs CHAPTER 8: Income, Assets, and Use of Assistance Programs Summary of Findings: Farmworkers mean and median personal incomes the previous year were in the range of $17,500 to $19,999. Fourteen percent of workers earned less than $10,000; 14 percent earned $30,000 or more. Workers mean and median total family incomes the previous year were in the range of $20,000 to $24,999. Twenty-seven percent of farmworkers reported total family income of less than $20,000, another 27 percent said their family income was $20,000 to $29,999, and 32 percent had a family income of $30,000 or more. One-third of farmworkers had family incomes below poverty (33%). Sixty-eight percent of farmworkers stated that they owned or were buying at least one asset in the United States. The most common assets were a vehicle (reported by 63% of workers) or a house (18% of workers). Fourteen percent of farmworkers reported that they or someone in their household received some form of benefit from a contribution-based program in the previous two years; 54 percent said someone in their household received some form of benefit from a needs-based program in the previous two years. Income Farmworkers were asked to report their total personal income in the calendar year prior to the year in which they were interviewed. Rather than providing a specific sum, respondents answered the question by indicating a range in which their income fell. Farmworkers mean and median personal incomes the previous year were in the range of $17,500 to $19,999. Nine percent of farmworkers interviewed in reported that they did not work at all during the prior calendar year, 14 percent said their total personal income was less than $10,000, 29 percent said they had personal incomes of $10,000 to $19,999, another 29 percent had personal incomes of $20,000 to $29,999, and 14 percent reported that their total personal income was $30,000 or more. Five percent of farmworkers said they were unsure of what their personal income was the previous year. In addition to the question about personal income, workers were asked to report their total family income in the previous calendar year. For this question as well, respondents answered by indicating a range in which their income fell. Workers mean and median total family incomes the previous year were in the range of $20,000 to $24,999. Six percent of farmworkers reported that they/their family had no earned income during the previous calendar year. Eight percent of workers said that their total family income the prior year was less than $10,000, 19 percent said their family income was $10,000 to $19,999, 27 percent had a family income of $20,000 to $29,999, and 32 percent had a family income of $30,000 or more. Eight percent of farmworkers reported that they did not know their family s total income the previous year. 36

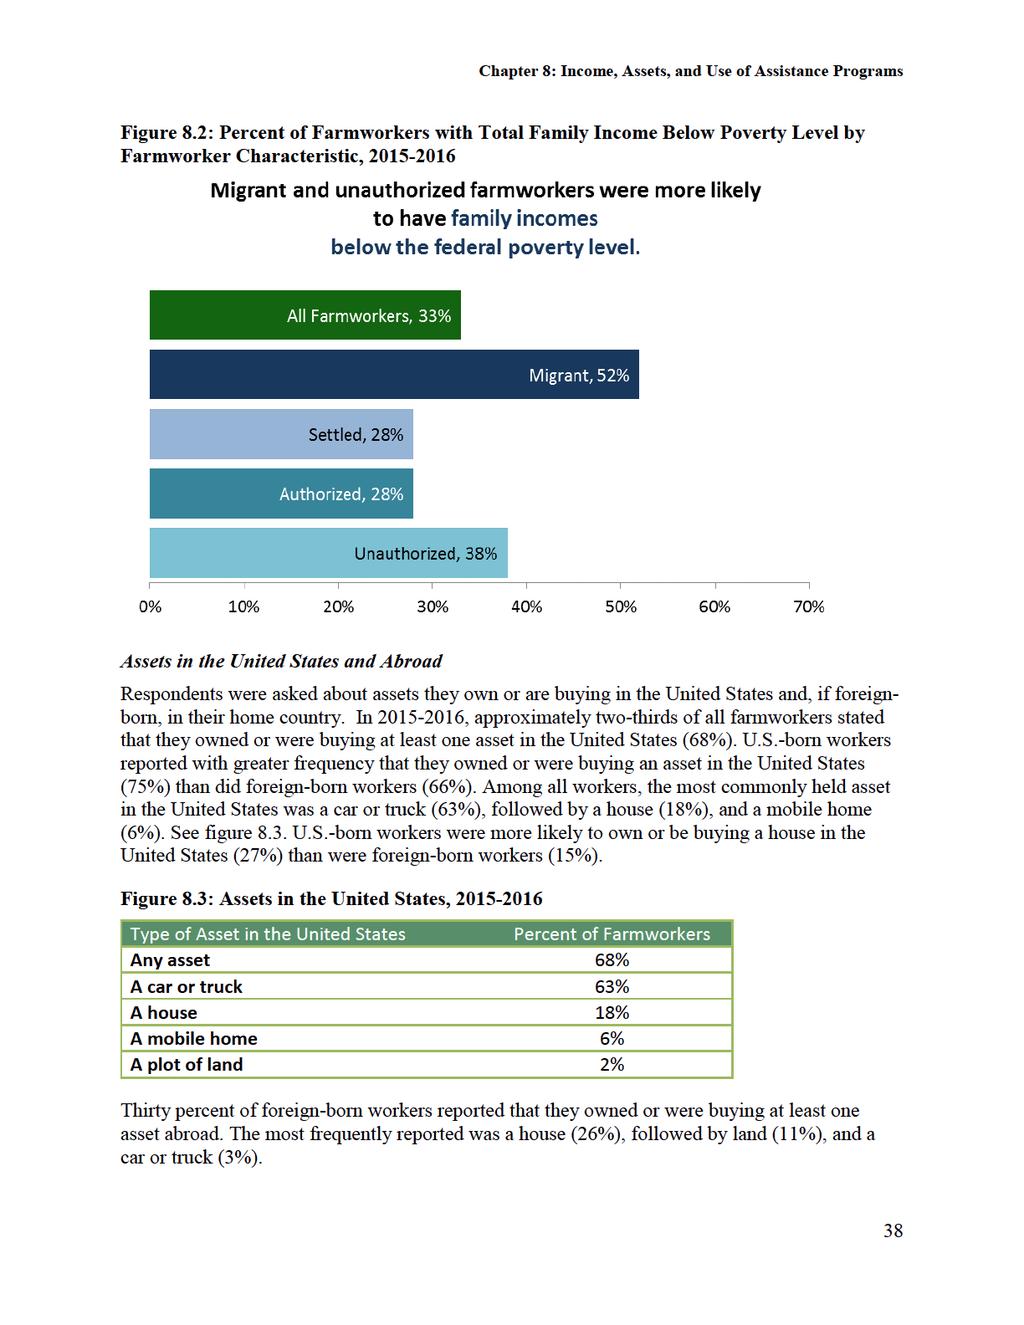
51 Chapter 8: Income, Assets, and Use of Assistance Programs To determine farmworkers poverty status, a poverty threshold was calculated for each worker based on the worker s family size 31 and the U.S. Department of Health and Human Services poverty guidelines 32 for the calendar year preceding the interview. The worker s family income was then compared to this poverty threshold 33. Using this method, 33 percent of farmworkers in were found to have family incomes below the poverty threshold. Below-poverty income was more common among farmworkers with larger families (see figure 8.1). Almost two-thirds of farmworkers with a family size of 6 or more had incomes below the poverty level (65%), compared to approximately one-third of farmworkers with a family size of 3 (36%) or 4 (34%). Likewise, migrant workers family incomes fell below poverty at a much greater rate than settled workers family incomes (52% compared to 28%), and unauthorized workers were more likely than authorized workers to have below-poverty household incomes (38% and 28% respectively). See figure 8.2. Figure 8.1: Percent of Farmworkers with Total Family Income Below Poverty Level by Family Size, Family size is defined as the number of family members who are living in the United States and who depend on the farmworker s income. 32 U.S. Department of Health and Human Services poverty guidelines ( hhs.gov/prior-hhs-povertyguidelines-and-federal-register-references). 33 Workers family income and poverty levels were based on their income in the United States, but were not adjusted for time in the United States. For additional information on the limitations of using traditional poverty statistics with migrant populations please see Pena s (2013) article on Poverty Measurement for a Binational Population. 37
52
53
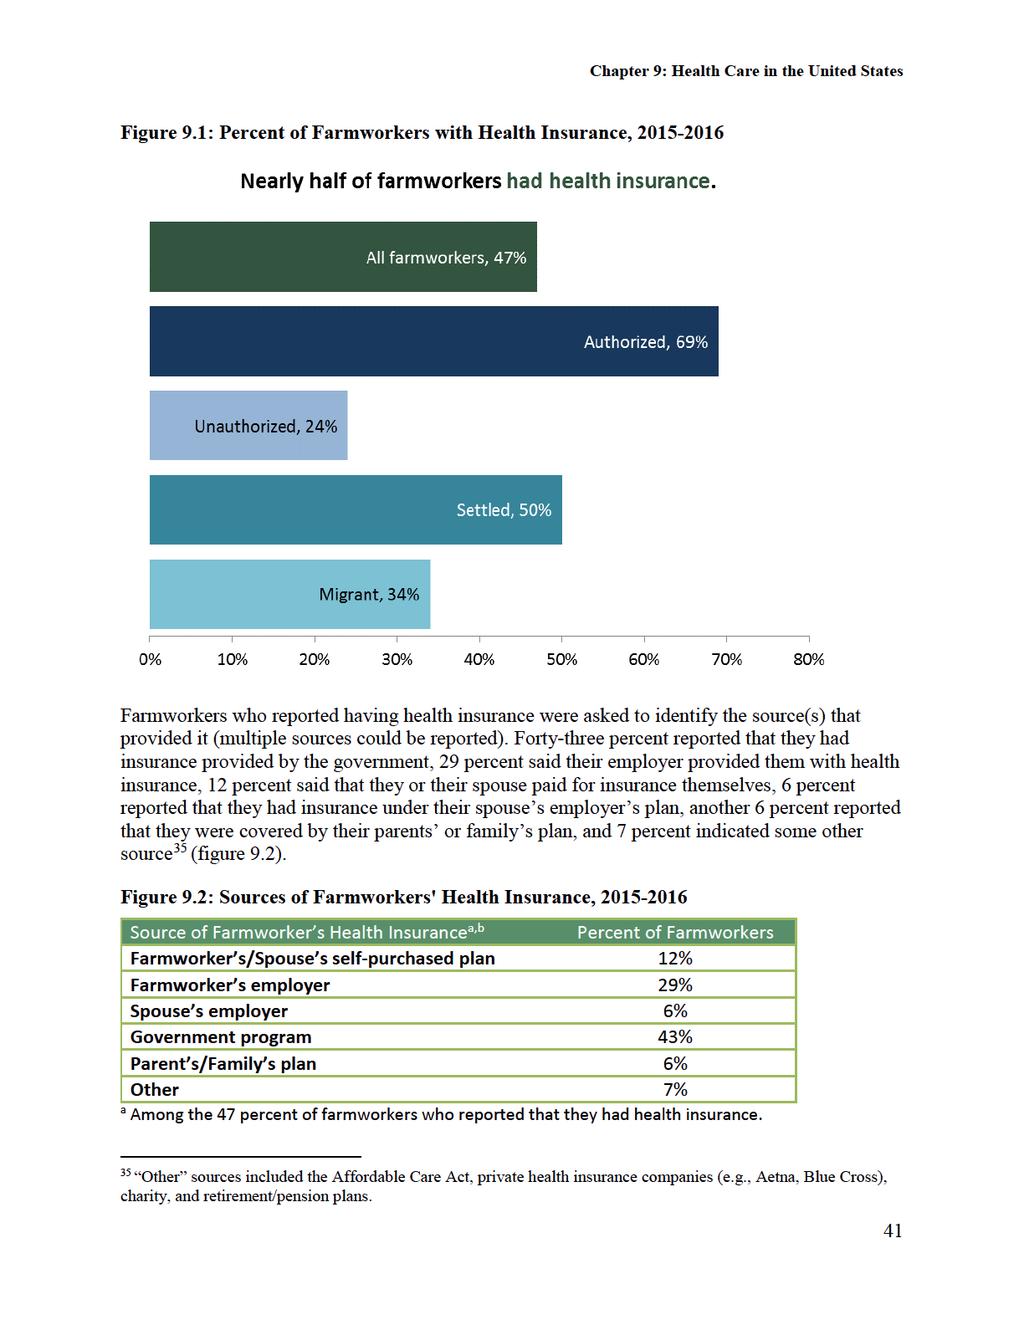
54 Chapter 9: Health Care in the United States CHAPTER 9: Health Care in the United States Summary of Findings: Forty-seven percent of farmworkers reported that they had health insurance, 56 percent said their spouse had health insurance, and 93 percent reported that all (89%) or at least some (3%) of their children had health insurance. Sixty-three percent of farmworkers used a health care provider in the United States sometime in the last two years. The last time they visited a health care provider, 40 percent went to a private medical doctor s office or private clinic, 34 percent said they visited a community health center or migrant health clinic, 12 percent saw a dentist, 11 percent went to a hospital, and 3 percent visited other providers such as a healer, chiropractor, or emergency room. Approximately one-third of farmworkers paid for their last health care visit out of their own pockets (34%): 26 percent were uninsured so they had to pay the whole fee; 8 percent had insurance so their out-of-pocket expense was likely a co-payment. The most common difficulty farmworkers faced when they needed to access health care was that health care visits were too expensive (23%). Health Insurance Coverage for Farmworkers and Family Members There were several questions on the survey about health insurance. One question asked workers to indicate who in their family had health insurance in the United States. Forty-seven percent of workers responded that they, themselves, had health insurance. Authorized workers and settled workers were much more likely to report having health insurance (69% and 50% respectively) than unauthorized workers and migrant workers (24% and 34% respectively). See figure
55
56
. Se")
57 Chapter 9: Health Care in the United States Workers who had health insurance reported more frequently that they utilized health care services (77%) than did workers who did not have health insurance (51%). See figure 9.5. Figure 9.5: Visited a U.S. Health Care Provider in the Last Two Years by Health Insurance Status, Farmworkers who reported seeking health care in the United States sometime in the last two years were asked what kind of health care provider they used the last time they saw one. Forty percent of workers who had a health care visit said that the last time they used a provider they went to a private medical doctor s office or private clinic. Thirty-four percent said they visited a community health center or migrant health clinic, 12 percent saw a dentist, and 11 percent went to a hospital. The remaining three percent of workers reportedly used another type of provider, including a healer or curandero, an emergency room, a chiropractor, or a naturopath. The type of health care provider visited depended on farmworkers health insurance status. Insured workers were more likely than uninsured workers to visit a private provider (50% compared to 27%) and less likely to visit a community health center or migrant health clinic (26% of insured workers compared to 45% of uninsured workers). See figure

58 Chapter 9: Health Care in the United States Figure 9.6: Type of U.S. Health Care Provider Visited by Health Insurance Status, Farmworkers who reported seeking health care in the United States sometime in the last two years were also asked who paid the majority of the cost for their last health care visit. Thirty-four percent of workers responded that they paid out of their own pockets: 26 percent were uninsured so they had to pay the fee in whole out of pocket; 8 percent had insurance so their out-of-pocket expense was likely a co-payment. Twenty-two percent said that they had Medicaid or Medicare, 11 percent said the majority of the cost was covered by health insurance that they or their family had purchased themselves, and 13 percent of workers reported that the cost was covered by health insurance provided by their employer. Nine percent of the workers stated that they went to a pubic clinic that did not charge for the visit, three percent reported that they used some combination of sources to pay, they were covered by worker s compensation, or that they were 44
59 Chapter 9: Health Care in the United States billed for service but did not pay, and the remaining seven percent provided a variety of other responses 36. Regardless of whether they reported having used a U.S. health care provider sometime in the last two years, farmworkers were asked to name the types of difficulties they faced when they needed to access health care in the United States. The most common response, provided by 23 percent of all farmworkers interviewed in , was that health care visits were too expensive and they had no insurance to cover the costs. Also among the most common responses were language incompatibility between farmworkers and health care providers (indicated by 1% of workers) and distance from providers or transportation difficulties (also indicated by 1% of workers). Thirteen percent of the workers were unable to name any specific barriers because they reported they had never needed health care in the United States. 36 Farmworkers who responded with other when asked who paid the majority of the cost for their last health care visit specified their response in the following ways: low income program; insurance through a former employer, other employer, labor union, or pension plan; automobile insurance; coverage through the ACA; medical coupon; military insurance or the VA; and medical insurance with no specification about whether it was self-purchased or employer provided. 45
60 Appendix A: Methodology APPENDIX A: Methodology Overview The NAWS is a nationally representative, random sample of farmworkers. During , the NAWS used stratified multi-stage sampling to account for seasonal and regional fluctuations in the level of farm employment. The stratification included three interviewing cycles per year and 12 geographic regions, resulting in 36 time-by-space strata. For each interviewing cycle, NAWS staff drew a random sample of locations for each of the 12 regions. Together, the 12 regions have a universe of 497 Farm Labor Areas (FLAs). FLAs were single- or multi-county sampling units which form the survey s primary sampling units (PSUs). Counties were the secondary level sampling units, ZIP Code regions were the third, agricultural employers were the fourth, and workers were the fifth. The number of interviews allocated to each region was based on regional farmworker employment data, the number of hired agricultural workers from the U.S. Department of Agriculture s (USDA) Farm Labor Survey (FLS) plus the number of contract workers from the Bureau of Labor Statistics (BLS) Quarterly Census of Employment and Wages (QCEW). Similarly, the number of interviews allocated to each FLA was proportional to the number of hired and contract crop workers employed at that time of the year. The FLA size measure (farm labor) was obtained by multiplying a seasonality estimate, derived primarily from the QCEW, by local farm labor expenditure data, from USDA s Census of Agriculture (CoA). The interview allocations were thus proportional to stratum size. In each FLA, county, and ZIP Code region, a simple random sample of agricultural employers was drawn from a universe list compiled mainly from public agency records. NAWS interviewers then contacted the sampled growers or farm labor contractors, arranged access to the work site, and drew a random sample of workers at the work site. Thus, the sample included only farmworkers actively employed in crop agriculture at the time of the interview. Stratification Interviewing Cycles To account for the seasonality of the industry, interviews were conducted 3 times each year, in cycles lasting 10 to 12 weeks. The cycles started in February, June and October. The number of interviews conducted in each cycle was proportional to the number of agricultural field workers employed at that time of the year. The USDA s National Agricultural Statistics Service (NASS) provided the Employment and Training Administration (ETA) with the agricultural employment figures for workers hired by agricultural producers, which came from the USDA s FLS. Figures for workers employed by farm labor contractors were obtained from the BLS QCEW. In FYs 2015 and 2016, the NAWS visited a total of 168 interviewing locations. The locations were similarly apportioned among the cycles using NASS data. Regions Regional stratification entailed defining 12 distinct agricultural regions based on the USDA s 17 agricultural regions. At the start of the survey in 1988, the 17 regions were collapsed into 12 by combining those regions that were most similar based on statistical analysis of cropping 46
61 Appendix A: Methodology patterns (e.g., Mountain I and Mountain II). In each cycle, all 12 agricultural regions were included in the sample. The number of interviews per region was proportional to the size of the seasonal farm labor force in that region at that time of the year, as determined by the NASS and BLS using information obtained from the FLS and QCEW. Sampling within Strata Farm Labor Areas Each region was composed of several single- or multi-county sampling units called FLAs. There are 497 FLAs that form a universe from which sampling locations were selected. These FLAs are aggregates of counties that have similar farm labor usage and are roughly similar in size. FLA size is more homogeneous within region than across regions. The FLA size measure is an estimate of the amount of farm labor in the FLA during a particular cycle. In this case, the measure was based on the hired and contract labor expenses from the most recent CoA available at the time the sample was drawn. The CoA labor expenses were adjusted using seasonality estimates that identified the percentage of labor expenses that fell into each of the NAWS cycles, fall, spring and summer. The seasonality estimates were based on monthly data from the QCEW, and were constructed by aggregating the reported monthly employment for each month included in the corresponding NAWS cycle (e.g., June, July, August, and September for the summer cycle). The percentage of employment corresponding to each cycle became a FLA s seasonality estimate. FLAs were selected in two stages. In the first stage, a roster of approximately 15 FLAs per cycle and region stratum was selected. In the second stage, all the FLAs on each stratum roster were assigned a random number and sorted in the order of the random numbers assigned. Counties To select counties, an iterative sampling procedure was used to ensure that an adequate number of counties was selected for each region. In most cases, interviews were completed in the first county and no additional counties were needed. However, because there was tremendous uncertainty about the number of workers in a county, additional counties were occasionally needed to complete the county allocation. Counties were selected one at a time, without replacement, using probabilities proportional to the size of each county s farm labor expenditures. Interviews began in the first selected county. If the work force within the county was depleted before all the allocated interviews in the FLA were completed, interviewing moved to the second randomly selected county on the list, and so forth, until all the allocated interviews were completed. In FLAs where farm work was sparse, interviewers may have had to travel to several counties to encounter sufficient workers to complete the FLA allocation. ZIP Code Regions Prior to generating lists of employers, sampled counties were divided into ZIP Code regions, which were smaller areas based on geographic proximity and the number of employers in the area. Some counties were comprised of a single ZIP Code region (for example, in the case of a small county) or multiple ZIP Code regions (for example, when a county is large). In a county with multiple ZIP Code regions, the regions were designed to be roughly equal in size. 47
62 Appendix A: Methodology When there were multiple ZIP Code regions in a county, the regions were randomly sorted to produce a list that determined the order in which the areas would be visited. Field staff contacted agricultural employers in the first ZIP Code region on the list and moved down the list, following the random order, until the interview allocation for the FLA was filled or the county s workforce was exhausted. Employers Within each selected ZIP Code region, interviewers received a list of randomly sorted agricultural employers. The list was compiled from marketing and administrative lists of employers in crop agriculture. An important component of the list was employer names in selected North American Industrial Classification Codes that the BLS provided directly to the contractor per the terms of an interagency agreement between the ETA and the BLS. Workers Once the randomly selected employer was located, the NAWS interviewer explained the purpose of the survey and obtained access to the work site to schedule interviews. If the employer was not familiar with his/her work force, the interviewer sought the name of the packinghouse manager, personnel manager, farm labor contractor, or crew leader who could help construct a sampling frame of the workers in the operation. Interviewers documented the number of workers employed on the day of worker selection in order to construct worker selection probabilities. When the number of workers available for interview was greater than the number of interviews allocated, the selection of workers for interview followed specific sampling instructions designed by a sampling statistician to ensure selection of a random sample of workers at each selected employer. Only workers who were employed in agriculture at the time of the interview were included in the sample. Selected workers were usually interviewed at the worksite, either before or after work or during breaks. Respondents may have also been interviewed at another location if that was more convenient for them. Respondents received a $20 honorarium for participating in the survey. Weighting The NAWS used a variety of weighting factors to construct weights for calculating unbiased population estimates: Sampling weights were calculated based on each sample member s probability of selection at the FLA, county, ZIP Code region, employer and worker level. Non-response factors were used to correct sampling weights for deviations from the sampling plan, such as discrepancies in the number of interviews planned and collected in specific locations. Post-sampling adjustment factors were used to adjust the weights given to each interview in order to compute unbiased population estimates from the sample data. A full explanation of how the weights were calculated can be found in the Statistical Methods of the National Agricultural Workers Survey available at the U.S. Department of Labor, Employment and Training Administration s National Agricultural Workers Survey website ( 48
63 Appendix A: Methodology Reliability of Estimates One measure of sampling error is the relative standard error (RSE), a measure of relative dispersion of the data. The RSE is calculated by dividing the standard error of the estimate (mean or percentage) by the estimate itself and reporting the result as a percentage. The higher the RSE, the less well the estimate represents individual items in the sample. 37 For the purpose of reporting data, the NAWS has adopted the following data suppression rules: Estimates with RSEs greater than 30 percent but no more than 50 percent are published but should be used with caution. Estimates with RSEs greater than 50 percent are considered statistically unreliable and are suppressed. 37 Sommer, J. E., Green, R, and Korb, P (1998). Structural and Financial Characteristics of U.S. Farms, 1995: 20 th Annual Family Farm Report to Congress ( Agriculture Information Bulletin No. (AIB-746), 118 pp, December 1998 (p. 62). 49

64 APPENDIX B: Map of the NAWS Migrant Streams Appendix B: Map of the NAWS Migrant Streams 50
Impact of the crisis on remittances
 The Slowdown of Remittances to Mexico and the Aftermath of the Financial Crisis Isabel Ruiz Sam Houston State University Carlos Vargas-Silva University of Oxford Impact of the crisis on remittances As
Immigration Reform and Agriculture Conference: Implications for Farmers, Farm Workers, and Communities University of California, D.C.
 Immigration Reform and Agriculture Conference: Implications for Farmers, Farm Workers, and Communities University of California, D.C. Campus 12 May 2011 Changing Characteristics of U.S. Farm Workers: 21
NAWS at 30. Changing Crop Worker Characteristics: Findings from the National Agricultural Workers Survey,
 Changing Crop Worker Characteristics: Findings from the National Agricultural Workers Survey, 1989-2014 NAWS at 30 April 12, 2018 Daniel Carroll and Susan Gabbard Davis, California Disclaimer: Views are
Remittances reached US$24.77 billion in 2015, 4.8% up on the previous year
 Migration Remittances reached US$24.77 billion in 2015, 4.8% up on the previous year Juan José Li Ng / Alfredo Salgado The total inflow of remittances to Mexico grew by 4.8% in 2015 to US$24.77 billion
Section IV A Binational Look at Household Composition, Gender and Age Distribution, and Educational Experiences. Executive Summary:
 Section IV A Binational Look at Household Composition, Gender and Age Distribution, and Educational Experiences Executive Summary: The indigenous are younger and more recently arrived than mestizos. This
8 PRIORITY CRIMES. CIDAC 2012 CRIMINAL INDEX. Facebook: /cidac.org YouTube: /CIDAC1
 8 PRIORITY CRIMES. CIDAC 2012 CRIMINAL INDEX www.cidac.org twitter: @CIDAC Facebook: /cidac.org YouTube: /CIDAC1 The current update of CIDAC Criminal Index using data from 2012 provides an insight for
California Crop Worker Characteristics:
 Employment & Training Administration Office of Policy Development and Research Division of Research and Evaluation California Crop Worker Characteristics: Preliminary 2015-2016 Findings from the National
Regional Economic Report
 Regional Economic Report April June 2016 September 14, 2016 Outline I. Regional Economic Report II. Results April June 2016 A. Economic Activity B. Inflation C. Economic Outlook III. Final Remarks Regional
Abstract. Acknowledgments
 Profile of Hired Farmworkers, 1998 Annual Averages. By Jack L. Runyan. Food and Rural Economics Division, Economic Research Service, U.S. Department of Agriculture. Agricultural Economic Report No. 790.
Return migra,on to Mexico: Policy response, measurement challenges and data needs Claudia Masferrer
 Return migra,on to Mexico: Policy response, measurement challenges and data needs Claudia Masferrer International Forum on Migration Statistics OECD-OIM, Paris, January 15th, 2017 February 21 st, 2017
The foreign born are more geographically concentrated than the native population.
 The Foreign-Born Population in the United States Population Characteristics March 1999 Issued August 2000 P20-519 This report describes the foreign-born population in the United States in 1999. It provides
[ : The National Agricultural Workers Survey, Part A] SUPPORTING STATEMENT THE NATIONAL AGRICULTURAL WORKERS SURVEY (NAWS)
![[ : The National Agricultural Workers Survey, Part A] SUPPORTING STATEMENT THE NATIONAL AGRICULTURAL WORKERS SURVEY (NAWS)](/thumbs/82/86458466.jpg "[ : The National Agricultural Workers Survey, Part A] SUPPORTING STATEMENT THE NATIONAL AGRICULTURAL WORKERS SURVEY (NAWS)") SUPPORTING STATEMENT THE NATIONAL AGRICULTURAL WORKERS SURVEY (NAWS) Introduction The Department of Labor s Employment & Training Administration (ETA) requests the Office of Management and Budget s (OMB)
SUPPORTING STATEMENT THE NATIONAL AGRICULTURAL WORKERS SURVEY (NAWS) Introduction The Department of Labor s Employment & Training Administration (ETA) requests the Office of Management and Budget s (OMB)
Characteristics of People. The Latino population has more people under the age of 18 and fewer elderly people than the non-hispanic White population.
 The Population in the United States Population Characteristics March 1998 Issued December 1999 P20-525 Introduction This report describes the characteristics of people of or Latino origin in the United
Migrants Remittances and Related Economic Flows
 Cornell University ILR School DigitalCommons@ILR Federal Publications Key Workplace Documents 2-2011 Migrants Remittances and Related Economic Flows Congressional Budget Office Follow this and additional
Characteristics of the Ethnographic Sample of First- and Second-Generation Latin American Immigrants in the New York to Philadelphia Urban Corridor
 Table 2.1 Characteristics of the Ethnographic Sample of First- and Second-Generation Latin American Immigrants in the New York to Philadelphia Urban Corridor Characteristic Females Males Total Region of
Labor Force Characteristics by Race and Ethnicity, 2015
 Cornell University ILR School DigitalCommons@ILR Federal Publications Key Workplace Documents 9-2016 Labor Force Characteristics by Race and Ethnicity, 2015 Bureau of Labor Statistics Follow this and additional
BINATIONAL EXCHANGE - STATE ATTORNEYS GENERAL AND PROSECUTORS
 FEVIMTRA Special Prosecutions Against Crimes of Violence Against Women and Human Trafficking BINATIONAL EXCHANGE - STATE ATTORNEYS GENERAL AND PROSECUTORS Human Trafficking Fourth National Conference for
NAZI VICTIMS NOW RESIDING IN THE UNITED STATES: FINDINGS FROM THE NATIONAL JEWISH POPULATION SURVEY A UNITED JEWISH COMMUNITIES REPORT
 NAZI VICTIMS NOW RESIDING IN THE UNITED STATES: FINDINGS FROM THE NATIONAL JEWISH POPULATION SURVEY 2000-01 A UNITED JEWISH COMMUNITIES REPORT December, 2003 INTRODUCTION This April marked the fifty-eighth
IRLE. A Comparison of The CPS and NAWS Surveys of Agricultural Workers. IRLE WORKING PAPER #32-91 June 1991
 IRLE IRLE WORKING PAPER #32-91 June 1991 A Comparison of The CPS and Surveys of Agricultural Workers Susan M. Gabbard, Richard Mines, and Jeffrey M. Perloff Cite as: Susan M. Gabbard, Richard Mines, and
Racial Inequities in Fairfax County
 W A S H I N G T O N A R E A R E S E A R C H I N I T I A T I V E Racial Inequities in Fairfax County Leah Hendey and Lily Posey December 2017 Fairfax County, Virginia, is an affluent jurisdiction, with
Salvadorans. in Boston
 Salvadorans in Boston Banda El Salvador at the 2013 Rose Parade in Pasadena, California. Photo by Prayitno Photography, retrieved from flickr.com/ photos/prayitnophotography (Creative Commons Attribution
People. Population size and growth. Components of population change
 The social report monitors outcomes for the New Zealand population. This section contains background information on the size and characteristics of the population to provide a context for the indicators
BIG PICTURE: CHANGING POVERTY AND EMPLOYMENT OUTCOMES IN SEATTLE
 BIG PICTURE: CHANGING POVERTY AND EMPLOYMENT OUTCOMES IN SEATTLE January 218 Author: Bryce Jones Seattle Jobs Initiative TABLE OF CONTENTS Introduction 1 Executive Summary 2 Changes in Poverty and Deep
GENERATIONAL DIFFERENCES
 S U R V E Y B R I E F GENERATIONAL DIFFERENCES March 2004 ABOUT THE 2002 NATIONAL SURVEY OF LATINOS In the 2000 Census, some 35,306,000 people living in the United States identifi ed themselves as Hispanic/Latino.
DISCUSIÓN Inequality and minimum wage policy in Mexico: A comment
 Investigación Económica, vol. LXXIV, núm. 293, julio-septiembre de 215, pp. 27-33. DISCUSIÓN Inequality and minimum wage policy in Mexico: A comment René Cabral* While its structure is not that of a typical
Racial Disparities in the Direct Care Workforce: Spotlight on Hispanic/Latino Workers
 FEBRUARY 2018 RESEARCH BRIEF Racial Disparities in the Direct Care Workforce: Spotlight on Hispanic/Latino Workers BY STEPHEN CAMPBELL The second in a three-part series focusing on racial and ethnic disparities
DATA PROFILES OF IMMIGRANTS IN THE DISTRICT OF COLUMBIA
 DATA PROFILES OF IMMIGRANTS IN THE DISTRICT OF COLUMBIA LATINO IMMIGRANTS Demographics Economic Opportunity Education Health Housing This is part of a data series on immigrants in the District of Columbia
OFFICE OF THE CONTROLLER. City Services Auditor 2005 Taxi Commission Survey Report
 OFFICE OF THE CONTROLLER City Services Auditor 2005 Taxi Commission Survey Report February 7, 2006 TABLE OF CONTENTS INTRODUCTION 3 SURVEY DATA ANALYSIS 5 I. The Survey Respondents 5 II. The Reasonableness
WHAT YOU SHOULD KNOW ABOUT THE JULY 2018 ELECTIONS IN MEXICO.
 WHAT YOU SHOULD KNOW ABOUT THE JULY 2018 ELECTIONS IN MEXICO. Galicia Abogados, S.C. G a l i c i a A b o g a d o s, S. C. B l v d. M a n u e l Á v i l a C a m a c h o N o. 2 4-7 C o l. L o m a s d e C
Latinos in Massachusetts Selected Areas: Framingham
 University of Massachusetts Boston ScholarWorks at UMass Boston Gastón Institute Publications Gastón Institute for Latino Community Development and Public Policy Publications 9-17-2010 Latinos in Massachusetts
info Poverty in the San Diego Region SANDAG December 2013
 info December 2013 SANDAG Poverty in the San Diego Region Table of Contents Overview... 3 Background... 3 Federal Poverty Measurements... 4 Poverty Status for Individuals in the San Diego Region... 6 Demographic
APPENDIX L. Characteristics of Farmworkers
 APPENDIX L Farmworker Housing Needs An excerpt from the 2001 Fresno County Regional Housing Needs Allocation Plan Prepared by the Council of Fresno County Governments Approved September 27, 2001 Characteristics
May Final Report. Public Opinions of Immigration in Florida. UF/IFAS Center for Public Issues Education. Erica Odera & Dr.
 May 2013 UF/IFAS Center for Public Issues Education Final Report Public Opinions of Immigration in Florida Erica Odera & Dr. Alexa Lamm Center for Public Issues Education IN AGRICULTURE AND NATURAL RESOURCES
 Page 1 of 5 DP02 SELECTED SOCIAL CHARACTERISTICS IN THE UNITED STATES 2013 American Community Survey 1-Year Estimates Although the American Community Survey (ACS) produces population, demographic and housing
Peruvians in the United States
 Peruvians in the United States 1980 2008 Center for Latin American, Caribbean & Latino Studies Graduate Center City University of New York 365 Fifth Avenue Room 5419 New York, New York 10016 212-817-8438
Executive Summary. Overview --Fresh Market Tomatoes in California and Baja
 Executive Summary Overview --Fresh Market Tomatoes in California and Baja This case study focuses on fresh tomato production in the Stockton, Merced, Fresno, San Diego, and San Quentin areas. California
REMITTANCE TRANSFERS TO ARMENIA: PRELIMINARY SURVEY DATA ANALYSIS
 REMITTANCE TRANSFERS TO ARMENIA: PRELIMINARY SURVEY DATA ANALYSIS microreport# 117 SEPTEMBER 2008 This publication was produced for review by the United States Agency for International Development. It
Tell us what you think. Provide feedback to help make American Community Survey data more useful for you.
 DP02 SELECTED SOCIAL CHARACTERISTICS IN THE UNITED STATES 2016 American Community Survey 1-Year Estimates Supporting documentation on code lists, subject definitions, data accuracy, and statistical testing
Illegal Immigration: How Should We Deal With It?
 Illegal Immigration: How Should We Deal With It? Polling Question 1: Providing routine healthcare services to illegal Immigrants 1. Is a moral/ethical responsibility 2. Legitimizes illegal behavior 3.
Racial Inequities in Montgomery County
 W A S H I N G T O N A R E A R E S E A R C H I N I T I A T I V E Racial Inequities in Montgomery County Leah Hendey and Lily Posey December 2017 Montgomery County, Maryland, faces a challenge in overcoming
LATINOS IN CALIFORNIA, TEXAS, NEW YORK, FLORIDA AND NEW JERSEY
 S U R V E Y B R I E F LATINOS IN CALIFORNIA, TEXAS, NEW YORK, FLORIDA AND NEW JERSEY March 2004 ABOUT THE 2002 NATIONAL SURVEY OF LATINOS CHART 1 Chart 1: The U.S. Hispanic Population by State In the 2000
ESTIMATES OF INTERGENERATIONAL LANGUAGE SHIFT: SURVEYS, MEASURES, AND DOMAINS
 ESTIMATES OF INTERGENERATIONAL LANGUAGE SHIFT: SURVEYS, MEASURES, AND DOMAINS Jennifer M. Ortman Department of Sociology University of Illinois at Urbana-Champaign Presented at the Annual Meeting of the
Far From the Commonwealth: A Report on Low- Income Asian Americans in Massachusetts
 University of Massachusetts Boston ScholarWorks at UMass Boston Institute for Asian American Studies Publications Institute for Asian American Studies 1-1-2007 Far From the Commonwealth: A Report on Low-
Institute for Public Policy and Economic Analysis
 Institute for Public Policy and Economic Analysis The Institute for Public Policy and Economic Analysis at Eastern Washington University will convey university expertise and sponsor research in social,
Elections Alberta Survey of Voters and Non-Voters
 Elections Alberta Survey of Voters and Non-Voters RESEARCH REPORT July 17, 2008 460, 10055 106 St, Edmonton, Alberta T5J 2Y2 Tel: 780.423.0708 Fax: 780.425.0400 www.legermarketing.com 1 SUMMARY AND CONCLUSIONS
ESSAYS ON MEXICAN MIGRATION. by Heriberto Gonzalez Lozano B.A., Universidad Autonóma de Nuevo León, 2005 M.A., University of Pittsburgh, 2011
 ESSAYS ON MEXICAN MIGRATION by Heriberto Gonzalez Lozano B.A., Universidad Autonóma de Nuevo León, 2005 M.A., University of Pittsburgh, 2011 Submitted to the Graduate Faculty of the Dietrich School of
POPULATION AND HOUSING ITEMS ON THE GENERAL CENSUS SCHEDULES Compiled by Grace York, Librarian Emerita, University of Michigan, August 2010
 POPULATION AND HOUSING ITEMS ON THE GENERAL CENSUS SCHEDULES 1790-2010 Compiled by Grace York, Librarian Emerita, University of Michigan, August 2010 See methodology and acknowledgements at end of table.
TERMS OF REFERENCE NATIONAL CONSULTANT ILO/UNHCR JOINT PROJECT
 TERMS OF REFERENCE NATIONAL CONSULTANT ILO/UNHCR JOINT PROJECT Project Title: ILO/UNHCR Joint Consultancy to map institutional capacity and opportunities for refugee inclusion in social protection mechanisms
Demographic, Economic and Social Transformations in Bronx Community District 4: High Bridge, Concourse and Mount Eden,
 Center for Latin American, Caribbean & Latino Studies Graduate Center City University of New York 365 Fifth Avenue Room 5419 New York, New York 10016 Demographic, Economic and Social Transformations in
TERMS OF REFERENCE NATIONAL CONSULTANT ILO/UNHCR JOINT PROJECT
 TERMS OF REFERENCE NATIONAL CONSULTANT ILO/UNHCR JOINT PROJECT Project Title: ILO/UNHCR Joint Consultancy to map institutional capacity and opportunities for refugee integration through employment in Mexico
Immigrants and the Direct Care Workforce
 JUNE 2017 RESEARCH BRIEF Immigrants and the Direct Care Workforce BY ROBERT ESPINOZA Immigrants are a significant part of the U.S. economy and the direct care workforce, providing hands-on care to older
Localization of manufacturing industries and specialization in Mexican states:
 MPRA Munich Personal RePEc Archive Localization of manufacturing industries and specialization in Mexican states: 1993 2013 Manuel Gómez-Zaldívar and Marco T. Mosqueda and Jazmin A. Duran Universidad de
UndecidedVotersinthe NovemberPresidential Election. anationalsurvey
 UndecidedVotersinthe NovemberPresidential Election anationalsurvey September2008 Undecided Voters in the November Presidential Election a national survey Report prepared by Jeffrey Love, Ph.D. Data collected
Journal of Higher Education Outreach and Engagement, Volume 7, Numbers 1&2, p. 103, ( )
") Journal of Higher Education Outreach and Engagement, Volume 7, Numbers 1&2, p. 103, (2001-02) A Community Addresses Food Security Needs Anne C. Kok and Karen Early Abstract In response both to changes
Journal of Higher Education Outreach and Engagement, Volume 7, Numbers 1&2, p. 103, (2001-02) A Community Addresses Food Security Needs Anne C. Kok and Karen Early Abstract In response both to changes
Being Latino-American: Experience of Discrimination and Oppression. Ashley O Donnell CNGC 529 Dr. Rawlins Summer Session I 2013
 Being Latino-American: Experience of Discrimination and Oppression Ashley O Donnell CNGC 529 Dr. Rawlins Summer Session I 2013 Latino or Hispanic? Hispanics or Latinos are those people who classified themselves
Immigrants are playing an increasingly
 Trends in the Low-Wage Immigrant Labor Force, 2000 2005 THE URBAN INSTITUTE March 2007 Randy Capps, Karina Fortuny The Urban Institute Immigrants are playing an increasingly important role in the U.S.
HEALTH CARE EXPERIENCES
 S U R V E Y B R I E F HEALTH CARE EXPERIENCES March 004 ABOUT THE 00 NATIONAL SURVEY OF LATINOS In the 000 Census, some,06,000 people living in the United States identifi ed themselves as Hispanic/Latino.
Farmworker Housing Needs
 Farmworker Housing Needs September 2001 Prepared for Florida Housing Finance Corporation 227 N. Bronough St., Suite 5000 Tallahassee, Florida 32301-1329 Prepared by Shimberg Center for Affordable Housing
Transitions to Work for Racial, Ethnic, and Immigrant Groups
 Transitions to Work for Racial, Ethnic, and Immigrant Groups Deborah Reed Christopher Jepsen Laura E. Hill Public Policy Institute of California Preliminary draft, comments welcome Draft date: March 1,
Understanding Racial Inequity in Alachua County
 Understanding Racial Inequity in Alachua County (January, 2018) Hector H. Sandoval (BEBR) Department of Economics College of Liberal Arts and Sciences University of Florida Understanding Racial Inequity
Online Appendix 1 Comparing migration rates: EMIF and ENOE
 1 Online Appendix 1 Comparing migration rates: EMIF and ENOE The ENOE is a nationally representative survey conducted by INEGI that measures Mexico s labor force and its employment characteristics. It
The Puebla-Durham Corridor: New Destination Migration from Pahuatlán. David Griffith East Carolina University Greenville, North Carolina
 The Puebla-Durham Corridor: New Destination Migration from Pahuatlán David Griffith East Carolina University Greenville, North Carolina North Carolina as New Destination Durham-Pahuatlán is one of three
Youth at High Risk of Disconnection
 Youth at High Risk of Disconnection A data update of Michael Wald and Tia Martinez s Connected by 25: Improving the Life Chances of the Country s Most Vulnerable 14-24 Year Olds Prepared by Jacob Rosch,
Timorese migrant workers in the Australian Seasonal Worker Program
 Timorese migrant workers in the Australian Seasonal Worker Program By Ann Wigglesworth, Research consultant Co-researcher: Abel Boavida dos Santos, National University of Timor-Leste Presentation outline
Rural Pulse 2019 RURAL PULSE RESEARCH. Rural/Urban Findings March 2019
 Rural Pulse 2019 RURAL PULSE RESEARCH Rural/Urban Findings March 2019 Contents Executive Summary 3 Project Goals and Objectives 9 Methodology 10 Demographics 12 Detailed Research Findings 18 Appendix Prepared
IMMIGRATION REFORM, JOB SELECTION AND WAGES IN THE U.S. FARM LABOR MARKET
 IMMIGRATION REFORM, JOB SELECTION AND WAGES IN THE U.S. FARM LABOR MARKET Lurleen M. Walters International Agricultural Trade & Policy Center Food and Resource Economics Department P.O. Box 040, University
Bostwick Neighbourhood Profile
 Bostwick Profile For further information contact: John-Paul Sousa Planning Research Analyst Direct: (519) 661-2500 ext. 5989 I email: jpsousa@london.ca Page 1 Page 2 Population Characteristics & Age Distribution
FIELD MANUAL FOR THE MIGRANT FOLLOW-UP DATA COLLECTION (EDITED FOR PUBLIC RELEASE)
") FIELD MANUAL FOR THE MIGRANT FOLLOW-UP DATA COLLECTION (EDITED FOR PUBLIC RELEASE) 1. INTRODUCTION This is the second phase of data collection for the 1994-95 CEP-CPC project. The entire project is a follow-up
FIELD MANUAL FOR THE MIGRANT FOLLOW-UP DATA COLLECTION (EDITED FOR PUBLIC RELEASE) 1. INTRODUCTION This is the second phase of data collection for the 1994-95 CEP-CPC project. The entire project is a follow-up
Recent Trends in the Market for Hired Farm Labor in the United States
 Recent Trends in the Market for Hired Farm Labor in the United States Steven Zahniser, U.S. Department of Agriculture, Economic Research Service, 1800 M Street NW, Rm. N5134, Washington, DC 20036-5831,
CLACLS. Demographic, Economic, and Social Transformations in Bronx Community District 5:
 CLACLS Center for Latin American, Caribbean & Latino Stud- Demographic, Economic, and Social Transformations in Bronx Community District 5: Fordham, University Heights, Morris Heights and Mount Hope, 1990
2016 Appointed Boards and Commissions Diversity Survey Report
 2016 Appointed Boards and Commissions Diversity Survey Report November 28, 2016 Neighborhood and Community Relations Department 612-673-3737 www.minneapolismn.gov/ncr Table of Contents Introduction...
Older Immigrants in the United States By Aaron Terrazas Migration Policy Institute
 Older Immigrants in the United States By Aaron Terrazas Migration Policy Institute May 2009 After declining steadily between 1960 and 1990, the number of older immigrants (those age 65 and over) in the
2. Situation: Mexican migrants in the US and
 2. Situation: Mexican migrants in the US and remittances. Changes and trends 2010-2015 This article starts with an analysis of trends and recent changes in Mexicans migration to the United States, emphasising
The Latino Population of the New York Metropolitan Area,
 The Latino Population of the New York Metropolitan Area, 2000 2008 Center for Latin American, Caribbean & Latino Studies Graduate Center City University of New York 365 Fifth Avenue Room 5419 New York,
Mémoire à l intention de la Commission sur l avenir de l agriculture et l agro-alimentaire québécois (CAAQ) Submission to the CAAQ
 Submission to the CAAQ") Mémoire à l intention de la Commission sur l avenir de l agriculture et l agro-alimentaire québécois (CAAQ) Submission to the CAAQ Name: Karen Rothschild Address: 393 Haut de la Chute, Rigaud, Qc. J0P
Mémoire à l intention de la Commission sur l avenir de l agriculture et l agro-alimentaire québécois (CAAQ) Submission to the CAAQ Name: Karen Rothschild Address: 393 Haut de la Chute, Rigaud, Qc. J0P
Fanshawe Neighbourhood Profile
 Fanshawe Profile For further information contact: John-Paul Sousa Planning Research Analyst Direct: (519) 661-2500 ext. 5989 I email: jpsousa@london.ca Page 1 Page 2 Population Characteristics & Age Distribution
Social and Demographic Trends in Burnaby and Neighbouring Communities 1981 to 2006
 Social and Demographic Trends in and Neighbouring Communities 1981 to 2006 October 2009 Table of Contents October 2009 1 Introduction... 2 2 Population... 3 Population Growth... 3 Age Structure... 4 3
The Latino Population of New York City, 2008
 The Latino Population of New York City, 2008 Center for Latin American, Caribbean & Latino Studies Graduate Center City University of New York 365 Fifth Avenue Room 5419 New York, New York 10016 Laird
Povery and Income among African Americans
 Povery and Income among African Americans Black Median Household income: $35,481 (all races $53,657) All Black Workers 2015 weekly earnings:$624 (all races $803) Black Men weekly earnings: $652 (All men
Contents. Acknowledgements...xii Leading facts and indicators...xiv Acronyms and abbreviations...xvi Map: Pacific region, Marshall Islands...
 Contents Acknowledgements...xii Leading facts and indicators...xiv Acronyms and abbreviations...xvi Map: Pacific region, Marshall Islands... xii CHAPTER 1: CENSUS ORGANIZATION AND OPERATIONS...1 CHAPTER
Brockton and Abington
 s in Massachusetts Selected Areas Brockton and Abington by Phillip Granberry, PhD and Sarah Rustan September 17, 2010 INTRODUCTION This report provides a descriptive snapshot of selected economic, social,
NBER WORKING PAPER SERIES REGIONAL ECONOMIC DEVELOPMENT AND MEXICAN OUT-MIGRATION. Kurt Unger. Working Paper
 NBER WORKING PAPER SERIES REGIONAL ECONOMIC DEVELOPMENT AND MEXICAN OUT-MIGRATION Kurt Unger Working Paper 11432 http://www.nber.org/papers/w11432 NATIONAL BUREAU OF ECONOMIC RESEARCH 1050 Massachusetts
Immigration from Latin America
 Immigration from Latin America Immigration and Nationality Act of 1965 Replaced the national-origins quota system with a preference system that prioritized skills and family relationships with US citizens
Migrant Youth: A statistical profile of recently arrived young migrants. immigration.govt.nz
 Migrant Youth: A statistical profile of recently arrived young migrants. immigration.govt.nz ABOUT THIS REPORT Published September 2017 By Ministry of Business, Innovation and Employment 15 Stout Street
ASSIMILATION AND LANGUAGE
 S U R V E Y B R I E F ASSIMILATION AND LANGUAGE March 004 ABOUT THE 00 NATIONAL SURVEY OF LATINOS In the 000 Census, some 5,06,000 people living in the United States identifi ed themselves as Hispanic/Latino.
Integrating Latino Immigrants in New Rural Destinations. Movement to Rural Areas
 ISSUE BRIEF T I M E L Y I N F O R M A T I O N F R O M M A T H E M A T I C A Mathematica strives to improve public well-being by bringing the highest standards of quality, objectivity, and excellence to
Household Income and Expenditure Survey Methodology 2013 Workers Camps
 Household Income and Expenditure Survey Methodology 2013 Workers Camps 1 Content Introduction 3 Target community: 4 Survey geographical coverage: 4 Sampling method: 4 Survey variables: 5 Survey Questionnaires:
Labor Management Standards RECRUITING, HIRING AND TERMINATION. Critical Standards for All Certifications. Critical Standards for U.S.
 RECRUITING, HIRING AND TERMINATION Ensure that the pay of all workers (including for temporary, piece rates, seasonal, and migrant workers) meet, at a minimum, national and state minimum wage requirements
KEY FINDINGS FROM THE 2016 EAST METRO PULSE SURVEY
 EAST METRO PULSE KEY FINDINGS FROM THE 2016 EAST METRO PULSE SURVEY ABOUT THE SAINT PAUL FOUNDATION The Saint Paul Foundation is a community foundation with more than 75 years of history in investing in
Hispanic Attitudes on Economy and Global Warming June 2016
 Hispanic Attitudes on Economy and Global Warming June 2016 Final Results June May June M-M Y-Y 2016 2016 2015 Change Change Index of Consumer Sentiment 105.8 93.5 98.4 +12.3 +7.4 Current Economic Conditions
Extrapolated Versus Actual Rates of Violent Crime, California and the United States, from a 1992 Vantage Point
 Figure 2.1 Extrapolated Versus Actual Rates of Violent Crime, California and the United States, from a 1992 Vantage Point Incidence per 100,000 Population 1,800 1,600 1,400 1,200 1,000 800 600 400 200
Out-of-School Youth Program Summary 2011
 Out-of-School Youth Program Summary 2011 H E N D E R S O N C O U N T Y P U B L I C S C H O O L S M I G R A N T E D U C A T I O N P R O G R A M Funded through a grant from the North Carolina Migrant Education
Immigration and Multiculturalism: Views from a Multicultural Prairie City
 Immigration and Multiculturalism: Views from a Multicultural Prairie City Paul Gingrich Department of Sociology and Social Studies University of Regina Paper presented at the annual meeting of the Canadian
Current Labor Force Survey Commonwealth of the Northern Mariana Islands Fourth Quarter, July 11, 2000
 Current Labor Force Survey Commonwealth of the Northern Mariana Islands Fourth Quarter, 1999 July 11, 2000 Department of Commerce Central Statistics Division Contents Introduction and Acknowledgments...
Statistical Brief No. 2 Cifras Breves No. 2
 Statistical Brief No. 2 Cifras Breves No. 2 MICHIGAN S FARMWORKERS: A Status Report on Employment and Housing By Refugio I. Rochín, Ph.D. Director and Professor, JSRI Marcelo E. Siles, Ph.D. Research Associate,
Forum on Global Violence Prevention May 12, 2016 Keck Center Arturo Cervantes, MD
 Forum on Global Violence Prevention May 12, 2016 Keck Center Arturo Cervantes, MD Nothing new around the sun 1. Rudolf Virchow, 1850 s 2. Universal Declaration of Human Rights, 1948 3. Health for all,
Section III. Network Analysis--The Gateway to Understanding Indigenous Farmworkers. Executive Summary:
 Section III. Network Analysis--The Gateway to Understanding Indigenous Farmworkers Executive Summary: Indigenous Mexican immigrants to California agriculture are small town individuals whose primary loyalty
New Orleans s Latinos: Growth in an uncertain destination. Elizabeth Fussell, Washington State University Mim Northcutt, Amicus
 New Orleans s Latinos: Growth in an uncertain destination Elizabeth Fussell, Washington State University Mim Northcutt, Amicus Abstract: Latino immigrants arrived in New Orleans after Hurricane Katrina
Characteristics of Poverty in Minnesota
 Characteristics of Poverty in Minnesota by Dennis A. Ahlburg P overty and rising inequality have often been seen as the necessary price of increased economic efficiency. In this view, a certain amount
THE EARNINGS AND SOCIAL SECURITY CONTRIBUTIONS OF DOCUMENTED AND UNDOCUMENTED MEXICAN IMMIGRANTS. Gary Burtless and Audrey Singer CRR-WP
 THE EARNINGS AND SOCIAL SECURITY CONTRIBUTIONS OF DOCUMENTED AND UNDOCUMENTED MEXICAN IMMIGRANTS Gary Burtless and Audrey Singer CRR-WP 2011-2 Date Released: January 2011 Date Submitted: December 2010