State of the Region Report 2005: Competitiveness and Cooperation in the Baltic Sea Region
|
|
|
- Anne Casey
- 5 years ago
- Views:
Transcription
1 State of the Region Report 2005: Competitiveness and Cooperation in the Baltic Sea Region Ketels, Christian; Sölvell, Örjan; Schwaag-Serger, Sylvia; Wise, Emily 2005 Link to publication Citation for published version (APA): Ketels, C., Sölvell, Ö., Schwaag-Serger, S., & Wise, E. (2005). State of the Region Report 2005: Competitiveness and Cooperation in the Baltic Sea Region. (Baltic Development Forum State of the Region Reports). [Publisher information missing]. General rights Copyright and moral rights for the publications made accessible in the public portal are retained by the authors and/or other copyright owners and it is a condition of accessing publications that users recognise and abide by the legal requirements associated with these rights. Users may download and print one copy of any publication from the public portal for the purpose of private study or research. You may not further distribute the material or use it for any profit-making activity or commercial gain You may freely distribute the URL identifying the publication in the public portal Take down policy If you believe that this document breaches copyright please contact us providing details, and we will remove access to the work immediately and investigate your claim. L UNDUNI VERS I TY PO Box L und

2 STATE OF THE REGION REPORT 2005 Competitiveness and Cooperation in the Baltic Sea Region Dr. Christian Ketels, Professor Örjan Sölvell, With Contributions from Dr. Sylvia Schwaag- Serger and Emily Wise Hansson Center for Strategy and Competitiveness
3 The State of the Region Report 2005 in the Baltic Sea Re Dr. Christian Ketels * and Professor Örjan Sölvell ** Prepared on behalf of VINNOVA and TEKES for the Baltic Development Forum Annual Summit 2005 With Contributions from Dr. Sylvia Schwaag-Serger and Emily Wise Hansson * Institute for Strategy and Competitiveness, Harvard Business School, and Center for Strategy and Competitiveness, Stockholm School of Economics (cketels@hbs.edu) ** Institute for International Business and Center for Strategy and Competitiveness, Stockholm School of Economics (Orjan.Solvell@hhs.se) The authors would like to thank the Institute for Strategy and Competitiveness, Harvard Business School, and the World Economic Forum for providing access to their data. We would also like to thank Josef Skoldeberg, Anna Brattström, and Torbjörn Folkesson for their competent research assistance. 1
4 State of the Region Report This is the second State of Region Report presented at the Baltic Development Forum Annual Summit (Hamburg 2004, Stockholm 2005). Foreword The authors of the State of the Region Report 2005 conclude that the Baltic Sea Region performs well on the Lisbon Agenda indicators. The region is among the best, particularly based on strengths in employment, environment and last but not least, innovation. However as the authors document it the region s competitive advantage in terms of innovation input is comparably higher than its innovation output. This indicates existing and unused potentials, which being employed would have a positive influence on the already high prosperity growth of our region. The Report documents nicely the strong cluster base of the region with a rich portfolio of regional clusters and overlaps in cluster export specialization across countries. Certainly, the authors proposals of further cooperation between related clusters, benchmarks of cluster policies, and the creation of consistent data on clusters and cluster policies across the region are highly valued from an innovation system point of view. A variety of networks and activities have emerged or have further grown over the last year. It demonstrates a strong decentralized ownership and supportable commitment to innovative regional processes from enterprises, academia and public actors. Of course, the research and conclusions of the report are done by the authors and reflects not necessarily in all details the views and commitments of our organizations. However, we are very happy to provide the report to be used as an important knowledge tool in analyses and innovative actions driving further regional developments. Heikki Kotilainen Deputy Director General TEKES Finland Karin Markides Deputy Director General VINNOVA Sweden
5 Executive Summary SECTION A: Competitiveness in the Baltic Sea Region Economic performance Prosperity growth remains high; labor productivity growth is strong and above EU and Central European levels; employment is growing again but less than in peer regions Export market shares in goods and FDI attraction are on a downward trend; the Region is loosing ground relative to its peers Business environment quality Overall business environment quality is still high but on a negative trajectory and weaker than in peer countries and regions Lower evaluations occurred across the board, notably also in areas of traditional strength such as skills and administrative capacity Innovation performance and capacity The region s competitive advantage in terms of innovation input (such as R&D investments and a strong human capital base) is comparably higher than its innovation output Eastern rim countries continue to make strong improvements in innovation performance, but convergence is not on the horizon Lisbon Agenda The Baltic Sea Region performs well on the Lisbon Agenda indicators, based on strengths in employment, environment, and innovation; others are catching up SECTION B: Towards an Action Agenda Cluster development The Baltic Sea Region has a strong cluster base with a rich portfolio of regional clusters and overlaps in cluster-export specialization across countries in the Region We suggest more cooperation between related clusters, benchmarking of cluster policies, and the creation of consistent data on clusters and cluster policies across the Region Baltic Sea Research & Education Region One of the Baltic Sea Region s key assets is its highly-educated population, including a comparatively high number of researchers and scientific and technical workers We suggest more analysis of knowledge flows and barriers to regional integration, and incentive schemes for student exchanges and research collaboration Entrepreneurship Entrepreneurship, perceived as too low, is the object of many policy efforts. Clarity is lacking on what entrepreneurship is and which specific factors are holding it back We suggest more analysis of barriers to entrepreneurship, more benchmarking of entrepreneurship policies, and more information on entrepreneurial opportunities Russia in the Baltic Sea Region Economic integration with Russia is the biggest economic opportunity for the Region, but also the most challenging to realize We suggest to base all efforts on the notion of Russia as a part of the Region, not a partner; focus on projects with direct benefits for both sides to enable long-term change Positioning the Baltic Sea Region The Baltic Sea Region needs to become visible to achieve impact; activities alone are not enough but need to be communicated and put in a broader context We suggest to provide better information about regional cooperation efforts, move towards a single voice in EU institutions, and cooperate on FDI attraction 3
6 The State of the Region Report 2005 An Assessment of Competitiveness in the Baltic Sea Region Table of Contents Introduction 6 Setting the Stage: Definition of the Region in this Report 8 SECTION A: COMPETITIVENESS IN THE BALTIC SEA REGION The Economic Performance of the Baltic Sea Region 9 Current prosperity and its drivers 9 Other indicators of economic performance 12 Overall assessment 15 The Microeconomic Foundations for Prosperity in the Baltic Sea Region 16 Overall competitive position 16 Company sophistication 18 Business environment quality 19 Overall assessment 24 The Innovative Performance and Capacity of the Baltic Sea Region 25 Innovative capacity and performance 25 Convergence in innovative performance within the Region 31 Innovation systems: governance and integration 34 Overall assessment 35 The Baltic Sea Region and the Lisbon Agenda 36 Overall performance 37 Performance in specific dimensions of the Lisbon Agenda 38 Overall assessment 39 4
7 Table of Contents nts (continued) SECTION B: TOWARDS AN ACTION AGENDA Prioritizing areas for regional action 40 Cluster Development Cluster, cluster development, and competitiveness 43 Conclusion: Proposal for Action 48 Baltic Sea Research & Education Region Education and research frameworks in the Baltic Sea Region 49 Conclusion: Proposal for Action 53 Entrepreneurship Entrepreneurship across the Baltic Sea Region 54 Conclusion: Proposal for Action 58 Russia in the Baltic Sea Region Russia s Northwestern District: Performance and Integration 60 Kaliningrad 62 Conclusion: Proposal for Action 62 Positioning the Baltic Sea Region: At home, in Brussels, and globally Coordinating Baltic Sea Co-operation 63 The Baltic Sea Region in EU institutions 64 Attracting FDI to the Baltic Sea Region 65 Outlook: The State of the Region in Appendix 68 List of Figures 70 List of Tables 71 Key sources 72 About the authors 73 5
8 Introduction Co-operation within the Baltic Sea Region continues to attract strong interest. EU extension has changed the Region for the better but has not made regional co-operation less important. The State of the Region-Report 2005 aims to provide an objective fact-driven foundation for such co-operation. It updates the assessment of Baltic Sea Region competitiveness presented last year and provides more detail on specific action areas identified by regional stakeholders since the 2004 Baltic Development Forum Summit. The Baltic Sea Region in 2005 The last twelve months have been an important phase in the development of the Baltic Sea Region. Regional co-operation has been intense on many levels and the effects of EU accession have become more visible. Estonia, Latvia, Lithuania, and Poland have now been EU members for more than a year. With the everyday experience of membership many of the exaggerated expectations about its effects have been proven wrong: In old member countries like Sweden some sectors, for example building services, have been exposed to more competition from the new member countries. But overall these effects have been limited in size and there was no rush by citizens of the new member countries to take advantage of western social systems. In new member countries like Poland the level of bureaucracy associated with EU regulations has been more limited than feared by some, and financial transfers to some sectors, especially agriculture, have had an impact on general attitudes towards the EU. The broader concerns about the EU s long-term direction have also been felt in the Region: Germany, Lithuania, and Latvia had ratified the EU Constitution already before the referenda in France and the Netherlands took place, all based on a vote in their respective parliaments. Estonia, Finland, and Sweden had planned parliamentary ratification as well, but have now postponed the process. Denmark has postponed a referendum planned for September 27 th, 2005 and Poland has not taken a decision on which process to adopt. To the West, Iceland and Norway are an important part of the countries collaborating in the Baltic Sea Region. Iceland in particular has decided to forge closer ties with this Region at a time when companies from Iceland have become increasingly active players here as well as in other parts of Europe. Norway has been a core part of the Region and continues its deep involvement. An important forum for both countries is the cooperation within the Nordic Council that has for many years provided a platform for cross-national cooperation and is in its activities now increasingly reaching out to the Baltics. To the East, Russia s position in the Baltic Sea Region remains of crucial importance. The discussions around the 60 th anniversary of the end of World War II were a vivid reminder of the Region s challenging past and of the different views of history that remain. For the future more important, however, are the economic changes in Russia. Many companies from other parts of the Baltic Sea Region are active in Russia, especially the Northwestern Region, and many Russian companies and institutions work successfully with their peers in the Region. EU membership of most countries in the Baltic Sea Region is and will be an important factor shaping the Region. But there is an increasing realization that it will not be sufficient as an answer to globalization and to the economic aspirations of the people in the Region. Co-operation in a cross-national region of more limited dimensions is one possible answer. 6
9 And it is one important reason why EU extension and tighter relations between the EU and its neighbors have made the Baltic Sea Region more and not less attractive. The STATE OF THE REGION REPORT and beyond Effective regional cooperation needs to grow out of an in-depth assessment of where we are as a region. Only then can we effectively decide what action to take, and which of these actions we want to approach together in this cross-national region. This remains the underlying motivation for the State of the Region-Report that aims to provide such an assessment for the Baltic Sea Region. The 2004 STATE OF THE REGION-REPORT was launched last September at the Baltic Development Forum Annual Summit in Hamburg. Its focus was to provide an initial base assessment of Baltic Sea Region competitiveness. At the Hamburg Summit, there was a clear message from political and business leaders to draw on this data in preparing a competitiveness strategy for the Region. Since then, a wide group of stakeholders from across the Baltic Sea Region has met a number of times to discuss how to move from this initial assessment to action. Two tasks were identified as critical to ensure action: First, we need to develop concrete action recommendations that set out clear priorities for what needs to be done to raise competitiveness across the Region and by whom. Second, we need an organizational structure to support and manage this process and the activities of different groups in different fields that it will encompass. The 2005 STATE OF THE REGION-REPORT will be launched at the 2005 Baltic Development Forum Annual Summit in Stockholm, October In its first part, the focus will be to provide an updated assessment of competitiveness across the Baltic Sea Region. And in its new second part, the focus will be to provide more in-depth data and discussion on a number of action areas that were identified by the group of stakeholders from the Region in the course of the last twelve months. The Report aims to be as concrete as is possible in discussing where we are and what needs to be done in these action areas. But the experience from comparable projects has been that researchers should limit their role: The detailed insight of the people working in the specific areas discusses will be necessary to move to fully actionable proposals. And their support to implement these proposals will need to be based on a view that all available knowledge has been used to identify them. After the Stockholm Summit the mobilization of the relevant groups in the Region most involved in the specific action areas will be the critical task to achieve real progress for competitiveness in the Baltic Sea Region. 7
10 Setting the stage: The T definition of the Baltic Sea Region in this report For the purpose of this assessment, we have defined the Baltic Sea Region to include the Baltic countries (Estonia, Latvia, and Lithuania), the Nordic countries (Denmark, Finland, Iceland, Norway, and Sweden), northern Germany (Hansestadt Hamburg, Mecklenburg- Vorpommern, and Schleswig-Holstein), northern Poland (Pomorskie, Warminsko- Mazurskie, and Zachodnio-Pomorskie), and Russia s Northwestern region. Compared to the 2004 State of the Region-Report, we have added Iceland to the definition of the Region. This reflects a stronger involvement of Iceland in regional cooperation, not any fundamental change in the way that we see the economics of the Region. In our analysis, we present data at three levels of geography: First, we look at the Baltic Sea Region as defined above and compare it to the Central European Region (Austria, Czech Republic, Hungary, Slovak Republic, Slovenia, southeastern Germany (Bavaria, Saxony, and Thuringia), and southern Poland (Dolnoslaskie, Malopolskie, Opolskie, Podkarpackie, and Slaskie). These two cross-national regions are comparable in economic size and population, and combine both old and new EU members. They share similar challenges in terms of leveraging the level of the cross-national regions to improve competitiveness. The Baltic Sea Region as defined for our report is home to 64 million people, slightly more than 1% of the world population. Its share of world GDP is about three times as high at 3.4% in 2004 (up from 2.9% in 2000). Russia s northwestern region accounts for about 1/3 of the Region s population, followed by Sweden (14%), and northern Germany (10%). The population continues to drop in the eastern and southern parts of the Region while increasing in the northern parts; overall population growth is flat. Measured by real GDP, Sweden accounts for more than 25% of the Region, followed by northern Germany, Demark, and Norway with between 17% and 15%. The Central European Region, as defined for our Report, has a population of 69 million. Southeastern Germany (28%) and southern Poland (21%) are the most populous regions, followed by the Czech Republic (15%) and Hungary (14%). Austria and the Slovak Republic register population growth, while Hungary is loosing population; overall population growth is flat. Southeastern Germany accounts for more than 50% of this region s economic size, followed by Austria with another 25%. Second, we look at individual nations within the Baltic Sea Regions and compare them to other nations in Europe as well as North America and Asia. While national economies are not the primary focus of our analysis, the majority of policies that affect competitiveness are set at the national level. For international performance comparisons data availability is best at the national level, and therefore we present more national data than in last year s report. Third, we look at sub-national regions within the Baltic Sea Region at the level of NUTS 2 1 regions, focusing on EU members. Sub-national regions are most closely related to the geographic units that matter most to companies present in a specific location. Cluster effects, for example, take place on the sub-national level, not across nations or cross-national regions. 1 NUTS 2 regions are defined by Eurostat and cover smaller nations or subnational regions with between and inhabitants. The European Union is divided into 254 NUTS 2 regions. The Baltic Sea Region has 41 regions, 23 of which are in EU member countries (8 in Sweden, 5 in Finland, 3 in Germany, 3 in Poland; Estonia, Denmark, Latvia, and Lithuania are each one region; Denmark could be divided into four regions as a result of upcoming territorial reforms). Northwestern Russia is divided into 10 regions (not necessarily matching the NUTS 2 criteria), Norway into 7 regions, and Iceland is treated as one region. 8
11 The Economic performance of the Baltic Sea Region The Baltic Sea Region continues to register strong prosperity growth, outpacing the Central European Region and the EU-25, and continues its catch-up to the EU-25 Relative to the European average the Baltic Sea Region registers a higher level of employment, while relative to non-european OECD countries labor productivity is a more important strength The traditionally strong position of the Baltic Sea Region on both exports and inward investment attraction is slowly deteriorating relative to peers; the number of headquarters that have their home base in the Region, however, still remains high The heterogeneity in performance and performance drivers across the Baltic Sea Regions remains significant; the analysis of sub-national regions in particular reveals that differences are not simply a result of the stage of economic development A high and sustainable level of prosperity, here measured by GDP per capita adjusted by domestic purchasing power, is the ultimate measure of economic performance. In an accounting sense prosperity can be decomposed into three factors: labor productivity (real GDP per hour worked), labor utilization (hours worked per capita), and domestic purchasing power of income (PPP adjustment factor). Over time, productivity and thus prosperity is driven by the level of innovation; especially important in advanced economies such as the Nordic countries and Germany. Figure 1: Growth of real gross domestic product (GDP), Baltic Sea Region countries Current prosperity and its drivers The Baltic Sea Region continues to report strong prosperity growth. In 2004, it has continued to outpace both the Central European Region and the European Union at large. Based on this solid growth, the Baltic Sea Region 9
12 has extended its slight prosperity lead versus the Central European Region from 1.4% to 2%. The prosperity gap to the EU-25 has dropped further; the Region is now 20% below the EU- 25 average versus 24% five years ago. These trends are in line with the medium-term trajectories reported in last year s Report. Countries across the Baltic Sea Region continue to report a heterogeneous growth performance, although all countries improved growth rates between 2004 and Latvia, Lithuania, Estonia, Poland, and Iceland topped the list of OECD and EU countries on GDP per capita growth in Especially Poland and Iceland have registered an impressive uptake of prosperity growth since Comparing countries in the Baltic Sea Region to an international sample of peers, they fit quite well into a broad band of countries on a convergence path. Germany, Poland, and Russia, however, have been falling behind over time. Figure 2: Prosperity, selected countries and regions Prosperity depends on three elements: The productivity of labor (measured by real GDP per hour worked, the amount of employment activity (hours worked per capita), and the cost level (PPP adjustment factor). The Baltic Sea Region has a 10% advantage on both the level of productivity and the level of employment compared to the Central European Region. Higher prices, however, wipe out almost all of these advantages. Compared to the EU-25, the Baltic Sea Region is ahead only on the level of employment, while it suffers from higher prices and even more drastically lower productivity. On employment, all regions registered positive growth in 2004 after a few years of activity falls. The Baltic Sea Region, traditionally ahead on this measure, had the lowest growth of employment activity last year and has seen EU-25 average come closer over time. On productivity, all regions posted strong growth that in 2004 has been slightly below the average of the last few years. The Baltic Sea Region had higher growth than Central Europe and the EU-25 since 1999 and could increase this gap in 2004 relative to 10

13 the average of previous years. On local price levels, prices in both the Baltic Sea Region and Central Europe have dropped somewhat relative to the EU-25, with the speed of price adjustment increasing slightly in Figure 3: Prosperity drivers, selected countries and regions Countries across the Baltic Sea Region differ significantly in the elements most important for their prosperity. NORWAY benefits from high productivity driven strongly by the effect of high oil prices on overall GDP that compensates for high local prices and the second lowest level of employment activity among countries in our sample. Over time, the country has lost ground to its peers on employment and, to a lower degree, productivity, despite the rise in oil prices and thus total GDP. ICELAND is exceptional in scoring well on both productivity and employment activity; despite relatively high prices it reaches high prosperity. The country registers a high share of employees in its population and, despite a significant drop since 2000, still the highest number of hours worked per employee in our sample. Employment has dropped over time, driven by the fall in hours worked, while productivity increased especially in SWEDEN and DENMARK register high productivity, average employment activity, and high local prices. Sweden dropped on employment in 2004 but did somewhat better on productivity. The country has fallen behind its peers on hours worked per employee and on the share of employees in the available labor force. Denmark had fallen in employment already in previous years and dropped less than Sweden in The country has registered lower productivity growth then Sweden both last year and for the last five-year period. FINLAND and GERMANY follow with somewhat lower prices but also lower employment activity. Finnish productivity is surprisingly low compared to its leading peers and its employment level continues to drop relative to peers. Germany seems to stabilize on the relative level of employment but is falling behind on productivity growth. 11
14 ESTONIA, LATVIA, and LITHUANIA have low prices and high employment activity but all suffer from low productivity. Their high level of employment is driven almost entirely by high hours worked per employee, while the share of employees in the population is low. RUSSIA looks similar but has even lower productivity. POLAND, finally, has somewhat higher productivity than this group but also higher prices and significantly lower employment activity. Productivity growth has been between the less prosperous Baltic countries and the more advanced western neighbors. The country s biggest challenge has been the drop in employment over time; encouragingly, 2004 was the first year with growth in the employment level since Sub-national regions across the Baltic Sea Region report register significant heterogeneity along many of these dimensions as well. Unfortunately, the data readily available covers only the regions in EU countries and ends in In terms of overall prosperity and prosperity growth since 1995, it is interesting to note that a few prosperous regions registered much stronger growth than expected given the pattern of overall catch-up visible across countries: Åland, Etelä-Suomi, Stockholm, and Hamburg achieved high growth rates despite their already high level of prosperity. In terms of prosperity drivers, there is a relatively strong correlation between high productivity (here measured by real GDP per employee) and high employment activity (here measured by employees as share of population). Deviations from this general relationship are Hamburg (much higher productivity than expected) and the three Baltic countries (higher employment activity than expected). Figure 4: Prosperity, EU NUTS-2 subregions Other indicators of economic performance A country s world export position, its ability to attract foreign investment, and its role as a home base for multinational companies are useful indicators of competitiveness. Performance in these dimensions can, however, also result from policies unrelated or even opposed to competitiveness as defined here, 12
15 for example devaluation or an explicit low-wage policy. They should thus be viewed in the context of the other indicators discussed in this report. In terms of exports, the Baltic Sea Region has slightly increased its total world export market share in 2004, continuing the positive trend that started in The growth in the Region s overall market share was based entirely on services, while world market shares in goods declined. Overall, the Baltic Sea Region has in the last two years been firmly surpassed by the Central European Region in terms of world export market share; a reversal of previous relationships. The differences over time were driven by goods exports, which have increased significantly for the Central European Region since 2000 while having been stagnant for the Baltic Sea Region. The Baltic Sea Region s share of world exports is more than 50% higher than its share of world GDP. This ratio has dropped slightly over time; relative to the world average GDP in the Region has grown more quickly than exports. Figure 5: World export market shares, selected European regions Among the countries in the Baltic Sea Region SWEDEN, the largest exporter, registered solid market share growth in 2004, continuing a positive trend that started in However, the country is still below the level of the market share it had in the 1990s. Since then, the share of services in total exports has grown from 16% (1995) to 24%. DENMARK and NORWAY vie for the place as the second largest exporter in the Region. Denmark dropped in market share in 2004 after improvements since Services are growing more strongly than overall exports and now account for 33% of all exports. Norway registered strong market share growth in 2004, based on a rising world oil price. Over the longer-term, however, market shares have been flat with services accounting for about a quarter of total exports. NORTHERN GERMANY and FINLAND follow in terms of total exports. Germany (export data on the sub-national level was not available) has registered stable growth in market shares since Finland registered an opposite trend with export market shares falling 13
16 since 1999 (except 2003), now reaching the level of the early 1990s. Both countries have a stable low share of services in total exports. NORTHWESTERN RUSSIA has the largest exports of the group of economically smaller parts of the Baltic Sea Region. Russian export market shares have grown since the Russian crisis and currency devaluation in 2000, with recent market shares gains based on the rising world oil price. LITHUANIA, NORTHERN POLAND, ESTONIA, and LATVIA follow: All report increasing overall market shares (except Estonia in 2004) since the early 1990s (Poland since 1999) and a falling role of service exports (except Estonia which now has the highest service share of this group at 33%). ICELAND has the smallest export volumes with stable world market shares since the 1990s and a stable, high service share of 35% of exports. In terms of foreign direct investment (FDI), the Baltic Sea Region registers a stock of inward FDI relative to GDP that is relatively high, in Europe only below Ireland, the Netherlands, the UK, and Portugal, and significantly above the Central European Region. FDI inflows relative to gross domestic investment to the Baltic Sea Region have been more volatile then in the European Union and the Central European Region: Inflows have reached higher relative levels in 2000 but have by 2004 dropped lower than elsewhere. Figure 6: FDI inflows, selected world regions Among countries in the Baltic Sea Region, ESTONIA now has the highest share of foreign FDI relative to GDP after strong growth over the last decade. Inflows occurred especially in the financial sector, now dominated by Swedish companies. SWEDEN and DENMARK follow in terms of relative FDI share, but have started to drop from their highest values in 2000 (Denmark) and 2002 (Sweden). LATVIA has, after a decade of growth, now caught up to them and reached Danish levels in In next group of countries FINLAND, LITHUANIA, and POLAND all registered moderate but quite stable growth over time. NORTHERN GERMANY and NORWAY have fallen behind these countries after flat or even decreasing 14

17 levels of relative inward FDI stocks. RUSSIA and ICELAND have the smallest penetration of FDI, with slow growth that has turned negative in 2001 (Iceland) and 2002 (Russia). In terms of headquarters of multinational companies, the Baltic Sea Region continues to register slightly more companies than the Region s share in world GDP suggests. The region registers 30 companies in the Business Week 1000 (ranked by market value) and 16 companies in the Fortune 500 (ranked by revenue, see table below). On both rankings, it has more than double the number of companies than the Central Europe Region. Table 1: Location of company headquarters, European regions The list of company headquarters in the Baltic Sea Region is clearly dominated by Stockholm, home to a number of multinational companies in industrial sectors but also services. All other countries have a much smaller presence, each focused on quite different sectors of the economy. The eastern parts of the Region as well as Iceland are not present. Overall assessment The Baltic Sea Region is home to a strong and prosperous economy. First, last year s report pointed out that relative to other European countries it is especially strong on the level of economic activity; driven by the 25% share of Russia in the Region s workforce, but is still remarkable. This year s report adds that relative to other non- European OECD or emerging economies, it is the Region s labor productivity that sticks out as a relative strength. Second, last year s report pointed out the heterogeneity in terms of prosperity and prosperity drivers across the Baltic Sea Region. This year s report adds that, while these differences are roughly consistent with the catch-up from different stages of economic development, there are some sub-national regions that stick out in terms of performance. Third, last year s report suggested that export ability and investment attraction have been additional signs of success. This year s report includes data that leaves room for some skepticism on both indicators; performance has been stagnant or even falling. 15
18 The Quality of the Microeconomic Foundations in the Baltic Sea Region The Baltic Sea Region still ranks high on overall competitiveness but is on a negative trajectory, falling behind a number of European and international peers The profile of competitive strengths for the Region is consistent with a focus on science-driven innovation and high-value activities The level of productivity, and thus the level of sustainable prosperity, that companies can reach at a given location is driven by conditions both at the macro- and microeconomic level. 2 The macroeconomic, political, legal, and social context creates the potential for competitiveness, but is in itself not sufficient to generate prosperity. The Baltic Sea Region tends to rank high on these context dimensions. This Report focuses on the Region s microeconomic foundations that ultimately determine competitiveness and prosperity. Overall competitive position The Baltic Sea Region continues to score quite well on the aggregate measure of business competitiveness that is used to rank countries in the Global Competitiveness Report. 3 However, its rank has dropped considerably over the last few years and it is now only slightly ahead of the Central European Region. The relative loss in rank occurred in both business environment quality (mostly in 2004) and company sophistication (mostly in 2005). A closer analysis of the data suggests that the changes are not the result of lower absolute values for the Region but of improvements in absolute values being less significant than in other advanced economies. Figure 7: GCR Business Competitiveness ranking, selected European Regions 2 For the methodology see Michael E. Porter, The Competitive Advantage of Nations, The Free Press (1990), and Building the Microeconomic Foundations of Competitiveness, in: The Global Competitiveness Report , World Economic Forum (2003) available at 3 We have adjusted our methodology for calculating regional averages slightly. We re-calculate our previous results based on this approach and find that it has no effect on the relative position of regions to each other; data is reported for the past years as well were possible. 16
19 The Baltic Sea Region continues to rank slightly lower on business environment quality than on company sophistication; a gap that closed again somewhat after widening last year. A closer analysis of the data reveals that in terms of the absolute values company sophistication actually seemed stronger, although the advantage has fallen since However, more countries rank even higher on company sophistication than the Baltic Sea Region, while the pattern for business environment quality is opposite: Company sophistication seems to be more equalized among advanced economies than business environment quality. Figure 8: GCR Business Competitiveness over time, selected countries Among the countries in the Baltic Sea Region, FINLAND,GERMANY, and DENMARK register the highest business competitiveness ranking. Finland remains strong overall, especially in business environment quality, but company sophistication has been dropping over time. Germany is improving at a moderate pace, especially in the business environment, but remains relatively stronger on company sophistication. Denmark returned to the 2003 level after dropping last year due to weaker company assessment. SWEDEN, traditionally also in the leading group of countries, has suffered across the board deteriorations, most pronounced in the business environment, already before weaker than company sophistication. It is too early to say if the 2005 data signals a general shift in perception or was a one-time result of negative sentiment in the business community. ICELAND and, some more ranks down, NORWAY follow. Iceland is stable but has a slight downward trend since Norway remains stable and could not retain the business improvements registered last year. ESTONIA leads the Region s southeastern countries with moderate rank gains over time. LITHUANIA, POLAND, and LATVIA follow in close proximity, all reporting some volatility in rankings that could indicate that the business community is still getting a better sense of how their local conditions compare to peer locations. Lithuania dropped after a massive improvement in 2004, while Poland and Latvia improved after equally strong drops one year ago. Finally, RUSSIA has lost its gains from last year and fell behind the 2003 level. 17
20 The Baltic Sea Region continues to register an overall prosperity level that is above the quality of microeconomic foundations. However, this is almost entirely driven by the natural-resource exporters NORWAY and RUSSIA, both benefiting from high oil prices since ICELAND seems to benefit from its access to rich fishing grounds. Other parts of the Region stay below the level of prosperity that they should be able to enjoy. In GERMANY and FINLAND barriers on the labor market are the leading candidates to explain the gap, in ESTONIA the time it will take for actual economic activity to fully leverage the opportunities created by recent reforms. Other countries in the Region register prosperity relatively close to the predicted level given their underlying microeconomic competitiveness. Figure 9: Sustainability of current prosperity, selected countries and regions Company sophistication Companies in the Baltic Sea Region continue to score high on many dimensions of company sophistication, ranking between rank 10 and 28. Particular strengths are modern management structures and the capacity for innovation, especially technological innovation. The Region s strengths and weaknesses set it clearly apart from the Central Europe Region which has a profile that reflects quite clearly its position as a manufacturing platform for the European market. Compared to last year, the Baltic Sea Region gained position only on the extent of regional sales, while it dropped in rank on some of its most pronounced strengths (R&D spending, innovative capacity, and staff training) and weaknesses (marketing, incentive compensation). 18

21 Figure 10: GCR Company sophistication ranking, selected European regions Among the countries in the Baltic Sea Region, GERMANY (rank 2 globally) and DENMARK (4) register the highest company sophistication. Germany is particularly strong on the breadth of international markets and the nature of competitive advantages but shares also the Region s strengths in innovation; the country registers relative weaknesses in customer orientation and the willingness to delegate. Denmark scores well across the board, reflecting the relative strengths and weaknesses of the Region at large. SWEDEN (7) and FINLAND (9) follow. Sweden registers strengths in the nature of competitive advantages, value chain presence, the willingness to delegate and in international market breadth but is weaker on regional sales. Finland shares the strengths in the nature of competitive advantages and value chain presence while ranking lower on customer orientation and marketing. ICELAND (15) is relatively strong on customer orientation and the control of international distribution but registers weaknesses on the nature of competitive advantages, value chain presence, the willingness to delegate, and the breadth of international markets. NORWAY (22) has a relative strength in the willingness to delegate but is weak on R&D and the breadth of international markets. ESTONIA (33) ranks highest among the eastern economies in the Region; it is relatively stronger on marketing, customer orientation, and incentive compensation, while lagging most on the nature of competitive advantages, innovative capacity, and R&D spending,. LITHUANIA (40) and LATVIA (49) have a similar profile. POLAND (42) is also somewhat stronger on marketing while lagging behind on the nature of competitive advantages and the willingness to delegate. RUSSIA (67), finally, struggles most with the presence across the value chain and, as the other eastern countries, the nature of competitive advantages. Business environment quality The business environment is shaped by the numerous microeconomic factors that shape the ability of companies to operate with high levels of productivity and innovation. In 1990, Michael Porter introduced the diamond as a tool to organize this complexity and represent those factors most critical for a specific location. 19

22 The Baltic Sea Region continues to be strong in the sophistication of local demand, the depth of its clusters, the skill base of employees, the quality of the infrastructure, and the quality and accessibility of the science system. Weaknesses include the low level of domestic rivalry, concerns about the education system, perceived barriers to trade in a few countries, and a high level of bureaucracy. In line with the Region s overall trend there are slight rank losses in most of the measures. Exceptional drops were recorded in the quality of math & science education, the prevalence of trade barriers, and judicial independence. Exceptional improvements were registered in the extent of bureaucratic red tape and foreign ownership restrictions. Figure 11: The 2005 Baltic Sea Region diamond Compared to the Central European Region, a number of differences emerge even though the two regions now rank at the same overall level of business environment quality. Central Europe ranks higher on local competition, registers lower barriers to trade (note that Central Europe now consists entirely of EU member countries while the Baltic Sea Region does not), and is seen as stronger on the number of suppliers, especially in the area of process machinery. The Baltic Sea Region is ahead on financial market quality, different measures related to innovative capacity (quality of research institutions, ease of collaboration between universities and companies, and government procurement of advanced products). Last year s Report has presented data from different sources on all elements of the business environment across the Baltic Sea Region. Because the assessment of business environment quality tends to be stable in the short term, we focus this year on data from the Global Competitiveness Report survey and on areas with specific importance for the Region. We also discuss in more detail country-specific strengths and weaknesses. 20

23 A key strength of the Baltic Sea Region remains its well-developed physical infrastructure. Especially the transportation infrastructure is rated high while the telecommunication infrastructure is seen as only in line with the overall quality of the Region s business environment, driven by the large differences across the Region. Overall, the relative advantage in this dimension versus the Central European Region is shrinking, even though ranks compared to all countries are quite stable. Among the countries in the Baltic Sea Region, DENMARK and GERMANY score exceptionally high on overall infrastructure quality, while SWEDEN sticks out on cell phone penetration. GERMANY, FINLAND, and DENMARK also score high on telecommunication infrastructure; ICELAND on the quality of electricity supply. POLAND ranks low on overall infrastructure quality and, together with RUSSIA, on telecommunication infrastructure. DENMARK scores surprisingly low on the quality of electricity supply. Other countries in the Region are ranked in line with their overall position. Skills and education are often considered a strength of the Baltic Sea Region. The data, especially the assessments made by business executives in the Region, provide a more textured view: The existing skill base, especially the share of the labor force with higher education, indeed remains a relative advantage of the Region. Education, however, tends to be seen as weaker, only the rank for the overall quality of the education system remains slightly above the Region s overall business environment quality. Last year s Report already noted that while educational spending in the Region is very high, educational attainment as measured by the OECD s PISA study is only average. Figure 12: GCR Education ranking, selected European regions Among the countries in the Baltic Sea Region, FINLAND gets consistently high rankings on all education-related indicators. RUSSIA and POLAND get marks significantly above their overall ranking for the availability of scientists and engineers and the quality of math and science education. GERMANY, NORWAY and SWEDEN register relative weaknesses in the quality of math and science education, GERMANY in the overall quality of its educational system. GERMANY, NORWAY, and the three BALTIC COUNTRIES all record problems with the 21

24 availability of scientists and engineers. Looking at sub-national regions (unfortunately data is available from Eurostat only for regions in the EU-15 countries) significant differences emerge. Some, for example the low position of regions in western Germany are related to different education systems. But others, for example the significant differences between Stockholm and other Swedish regions, are driven by other factors. Figure 13: Educational attainment, EU-15 NUTS-2 subregions The quality of demand in the Baltic Sea Region is a further area often cited as an advantage. Environmental and consumer protection laws are, indeed, seen as strong. The regional average on other dimensions of demand quality is, however, ranked below the Region s overall position. For government procurement of advanced technology products this affects the entire Region, while for others the low average is driven by significant differences across the Region. Among the countries in the Baltic Sea Region, GERMANY registers an especially stringent regulatory environment and sophisticated buyers. Financial markets continue to be solid in the Baltic Sea Region, with significant advantages relative to the Central European Region. Across the Region, ease of access to loans is widely especially positive while equity market access is seen as relatively more problematic. Among the countries in the Baltic Sea Region, ICELAND sticks out with an exceptionally positive assessment of equity market access, most likely reflecting the significant liquidity also shown in recent acquisitions in the Baltic Sea Region and the UK. Equity market access is otherwise an issue for most NORDIC and BALTIC COUNTRIES. It will be interesting to see whether the recent consolidation of equity markets will reduce this issue. GERMANY and RUSSIA rank overall relatively low on indicators of financial market strengths. 22

25 Administrative capacity, the efficiency and impartiality of public services is another important dimension. The Baltic Sea Region ranks well on neutrality and corruption but business executives worry about bureaucracy and judicial independence. In terms of government efficiency the Region still ranks high, despite a slight deterioration in the last two years. Figure 14: GCR Administrative Capacity ranking, selected European regions Among the countries in the Baltic Sea Region, business executives in GERMANY and DENMARK are most concerned about the high level of bureaucracy, while the BALTIC COUNTRIES, POLAND, and RUSSIA report problems in the legal system. Figure 15: Government efficiency, selected countries 23

26 A final area is the context for rivalry and strategy. The Baltic Sea Region ranks high on the relationship between capital owners, employees, and business executives. The legal context in terms of antitrust legislation and foreign ownership restrictions are in line with the Region s good overall ranking. The intensity of location competition, however, remains low and the Region has dropped considerably in the level of barriers to trade that business executives perceive. Figure 16: GCR Context for Strategy and Rivalry ranking, selected European regions Among the countries in the Baltic Sea Region, all NORDIC COUNTRIES suffer from low levels of local competition. POLAND is, despite EU membership, viewed to have still quite restrictive rules on foreign ownership. And trade barriers are seen as relatively most problematic in the non-eu member countries NORWAY, ICELAND, and RUSSIA. Overall assessment The Baltic Sea Region continues to provide strong overall microeconomic foundations for companies to reach high levels of productivity. However, the data shown in this section gives ground for concerns: the Region is making little progress on its relative weaknesses and it seems to be loosing ground on its strengths. There are a number of different reasons that could explain the data. First, business executives might have become more pessimistic about the conditions they face, even though there has been no real deterioration of underlying competitiveness. Second, the underlying conditions in the Region might have been stable or have improved, but other countries and world regions have improved even faster. Third, the underlying conditions in the Region have deteriorated in an absolute sense. The last scenario seems unlikely. But a relative deterioration is already more than the Region can afford to sustain its economic ambitions. And even if the slight deterioration is only the reflection of unfounded changes in business executives sentiments that can be reversed, these sentiments will have a real impact on their willingness to invest and take risk. 24
27 The Innovative Performance of the Baltic Sea Region The Baltic Sea Region continues to have an extremely strong human capital base, yet there appears to be room for improvement when it comes to using these assets for the benefit of economic growth and welfare There is a significant gap in innovative performance between the Nordic countries and Germany and the Eastern Baltic Rim countries, particularly when it comes to R&D investments, but also in patenting and scientific publications Innovation and innovation policy is very much at the forefront of public debate throughout the Baltic Sea Region Scientific and technical skills are the current focus of innovation in the region; nontechnical innovation and developing business, design and other market-focused skills are receiving increasing attention Linkages within and between innovation systems in the region are strengthening both on a policy and a practical level at a moderate pace Innovation in its broadest perspective is a new idea turned into commercial benefit. New ideas encompass scientific or technical discovery, as well as improvements to processes, changes to organizations, or adjustments to methods of marketing and selling a product or service. Innovation is a priority to economic competitiveness not only because it affects micro-level costs, productivity and sales, but also because it provides a critical source for longer-term economic growth. Governments around the globe in countries at many levels of economic development are increasingly recognizing the importance of innovation, and are intensifying efforts to support and catalyze innovation in their economies. Innovation encompasses the creation, diffusion, absorption, and transformation of knowledge. For countries, the key to innovative strength lies in a strong human capital base, combined with the ability to diffuse knowledge among and between various stakeholder groups, and the presence of framework conditions, governance and skills which are conducive to and facilitate turning ideas into economic prosperity. Innovation capacity and performance Innovation capacity and performance is generally measured as a compilation of various indicators: of macroeconomic stability and rule of law, of human resources and education, of the ability to share knowledge through ICT, and of the ability to cooperate and conduct work in an integrated innovation system. Different organizations have developed various innovation indices and scoreboards 4. It is difficult to get an accurate and comparable picture of innovation in an economy. Currently available innovation indicators are still far from satisfactory for assessing countries innovative capacity and potential. One way to understand relative performance, strengths and improvement areas is to benchmark against others. In general, the Baltic Sea Region clearly outperforms Central Europe and the EU-25 on innovation input factors. However, in benchmarks of innovation output (e.g. numbers of patents and publications, percent of high-tech exports, ratio of professional and technical workers) the region s advantage is not as pronounced. This section was written by Sylvia Schwaag-Serger (sylvia.schwaagserger@itps.se) and Emily Wise Hansson (emily.hansson@fpi.lu.se), Research Policy Institute, Lund University 4 World Bank Knowledge Assessment Methodology (KAM), OECD Science, Technology and Industry Scoreboard, the European Innovation Scoreboard, and the Global Competitiveness Report. 25
28 Figure 17: Measurements of innovation capacity Western Europe/ EU25=100 GERD Researchers in R&D Tertiary enrollment S&E enrollment ratio Source: Eurostat (2005), UNESCO (2005), World Bank KAM (2005), author s analysis. Notes: Data year for GERD (2003), researchers (2002), tertiary enrollment (2001), S&E enrollment ratio (2002) Baltic Sea Region Central European Region One of the most widely used proxies for innovative capacity (or input) is investment in R&D as a percent of GDP (GERD). Other indicators include education levels and numbers of researchers. As illustrated in Figure 17 above, the region outperforms both Central Europe and the European average for all of these indicators. The region shows particularly strong performance in national R&D investments and numbers of researchers (with average rates of 2.5% GERD and 3833 researchers in R&D per million), with a nearly 40% higher share of R&D expenditure, and almost twice as many researchers per inhabitants. This is largely due to the fact that the Baltic Sea Region is home to the global leaders in these indicators. SWEDEN,FINLAND,ICELAND,DENMARK and GERMANY all have GERD levels above the EU-25 average of 1.9 percent and above the OECD average of 2.2 percent. In addition, R&D expenditures in many BSR countries are growing at a fairly rapid pace. ICELAND (14.5%), ESTONIA (11.6%), LITHUANIA (9.4%), FINLAND (6.9%), DENMARK (6.6%), SWEDEN (5%) and LATVIA (4.9%) have all exceeded the EU s (4%) average annual growth rate for GERD during the five-year period (see figure 18). It is important to note, however, that some countries are not able to maintain high growth rates. ICELAND has been illustrating strong R&D intensity and growth trends. But GERD growth rates have been tapering off in FINLAND, GERMANY, DENMARK and SWEDEN. Of the countries with low R&D intensity, ESTONIA and LITHUANIA are exhibiting strong growth rates. However, the catching-up process has slowed in LATVIA and ceased in POLAND (where there are negative growth rates). Taking a broader global perspective, China has been experiencing GERD growth rates in excess of 10% since the late 1990 s. The EU s DG Research recently reported that if R&D intensity growth continues at the same pace (+0.7% per year for Europe on average), China will have caught up with the EU by 2010: both will have reached a 2.2% R&D intensity. This level is far short of the 3% Lisbon objective, and highlights a significant competitive threat to the EU. 26
29 Figure 18: R&D Investment and Growth In terms of human capital, the Baltic Sea Region has an average of 3833 researchers in R&D per million inhabitants, compared to a Central European average of 2100 per million inhabitants and a European average of 3246 per million inhabitants. ICELAND (8592), FINLAND (7431), SWEDEN (5171), and DENMARK (4822) stand out with research assets exceeding both the European average, and the USA (with 4048 researchers per million inhabitants). In addition, science and engineering enrollment ratio in the region (39%) is above average levels in Europe (33%), as well as in the USA (19%) and Japan (21%). A concern, however, is how these human capital assets are used. Are these highly-qualified research assets finding opportunities to make use of their skills, thus helping improve innovative performance and economic competitiveness, and, ultimately, turning knowledge into growth and prosperity? Innovative performance (or output) is often measured by indicators such as scientific and technical journal articles and patents (per million population), proportion of professional and technical workers (as a percent of the labor force), and levels of high-tech exports (as a percent of manufacturing exports). 5 As illustrated in Figure 19 below, the region consistently exhibits higher performance than Central Europe, but underperforms the wider European average on patents granted both in Europe and the USA. 6 These output indicators 5 These indicators are primarily focused on tracking technology-focused innovation, leading to a skewed measurement of innovation in countries where innovation activities and investments are focused on more traditional sectors or functional capabilities. The Nordic Innovation Center (among others) is interested in developing new ways of measuring innovation performance indicators which capture not only research-driven innovation, but also innovation in design, processes, marketing, etc. 6 The patent data analyzed in this report is based on patent applications granted at both the EPO and USPTO, by date of grant for This method was chosen in order to present the most recent data. It is recommended, however, that analysis of patent data should be based on triadic patent families (Europe, USA and Japan) in order to avoid a data bias (e.g. the US has a higher number of patents with the USPTO), and by priority date (date of the 27
30 primarily reflect research results and do not capture broader economic impact. Although the Baltic Sea Region has 33% more scientific articles and 12% more EPO patent applications granted than Central Europe, the region s competitive advantage in terms of innovation output is smaller than its competitive advantage in terms of innovation input (discussed in the section above). From these indicators, it appears that the region is not making the most efficient use of its strong advantage in research investments and human capital. Figure 19: Measurements of innovation performance Western Europe/ EU25=100 Scientific and technical journal articles EPO patent applications granted USPTO patent applications granted Professional and technical workers ratio High-tech exports Source: DG Research (2005), Thomson ISI, OECD (2005), World Bank KAM (2005), author s analysis. Notes: Data year for scientific articles (2003 and 2002), for EPO patents (2003), USPTO patents (2003), professional and technical workers (2002), high-tech exports (2002) Baltic Sea Region Central European Region In a recently published report 7, DG Research illustrates that there is a strong positive relationship between public expenditure on R&D and publications, and a strong positive relationship between business expenditure on R&D and patents (see figures below). In these comparisons, the Nordic countries and Germany position themselves clearly in the upper range with both high public and private expenditure on R&D and high publication and patenting activity. Furthermore, these countries seem to reap more patents and publications for the money they invest than the European average. The Eastern Rim countries of the Baltic Sea Region, on average, can be found towards the other end of the spectrum, with low investments in R&D and, comparatively, low returns on those investments in terms of patenting and publications. It must be stressed, however, that there is no formula for innovation, nor, more importantly, for turning innovation into economic prosperity. Although there is a correlation between innovation input (such as R&D investment) and innovation output (such as publications and patents), there is currently no satisfactory method for determining which input levels will yield which output results nor for judging how efficient or inefficient national innovation policy choices have been. 8 One can only compare first filing worldwide) in order to represent the date closest to actual invention. Using this methodology, the latest available data is for European Commission, DG Research (2005), Key Figures 2005 on Science, Technology and Innovation, Brussels. 8 It is for this reason that policy learning and policy evaluation is becoming increasingly important. Countries are working to establish methodologies and measurements to determine the success of policy initiatives. 28
31 with other countries, and keep in mind that each policy or investment decision has an impact on a range of indicators. There are no independent variables in innovation systems. Figure 20: Publications and triadic patents in relation to expenditures in R&D SE Publications per million population, 2003 (3) SK IE ES EL CZ EE HU PT PL BE US UK AT SI EU-25 IT DK DE JP NL FR FI 200 MT (4) LU CY LV LT Public expenditure on R&D as % of GDP, 2001 (2) JP FI SE Triadic patent families per million population, 2000 (2) NL AT UK FR EU-25 DK LU BE DE US 10 IT IE CY EE LV HU PT ES SI 0 SK CZ LT EL PL 0,0 0,5 1,0 1,5 2,0 2,5 3,0 Source: DG Research (2005) BERD as % of GDP, 2000 (2) Given the correlation between R&D investment and output indicators such as articles and patents, it is not surprising to see that those countries with highest R&D intensity are the same countries that have the highest number of publications and patents per million inhabitants (see figures below). SWEDEN, ICELAND, DENMARK, FINLAND, and NORWAY all have a higher number of publications per million than the USA. Yet the regional average (754 publications per million) is below the USA (809 publications per million), as the larger countries (GERMANY,POLAND and RUSSIA) have lower publication rates. It is interesting to note, however, that the region produces far more scientific publications than patents (in relative terms). There is a noticeable difference in the leading producers of patents when compared to the leading producers of publications. There are a number of factors that can explain this: the different national levels of private sector R&D investment (relative to public sector investments), differences in propensity to patent across different sectors and countries, the varying structures and incentives for inventors to patent in the different countries, language preferences in international publications, and the limitations and comparability of the available data. 29
32 Figure 21: National statistics for scientific publications and triadic patents Scientific Publications Triadic patent families (per million inhabitants, 2003) (per million inhabitants, 2000) Sweden Iceland Denmark Finland Norway Austria Slovenia USA Germany EU- 25 Japan Czech Rep Hungary Est onia Slovak Rep Poland Russia Lit huania Lat via China Japan Germany USA Finland Sweden Austria Denmark Iceland EU- 25 Norway Slovenia Hungary Est onia Czech Rep Lit huania Russia Lat via Poland Slovak Rep China - 10,00 20,00 30,00 40,00 50,00 60,00 70,00 80,00 Source: DG Research (2005), Thomson ISI (for Iceland, Norway and Russia) Note: data for Iceland, Norway and Russia from 2002 Source: OECD, author s analysis Note: data by priority year and inventor s country of residence When looking at innovation input and output indicators on a sub-national level, the same relationship between R&D intensity and patenting is evident. The same four regions in Sweden (Västverige, Stockholm, Sydsverige and Östra Mellansverige) and three regions in Finland (Pohjois-Suomi, Uusimaa and Etalä-Suomi) lead both R&D investments and patents per million. Figure 22: R&D expenditure, EU NUTS-2 subregions Total R&D expenditure in % of GDP, % Baltic Sea Region Central European Region 6% Other EU regions EU-15 Västsverige 5% 4% 3% 2% 1% Estonia Pomorskie Latvia Warminsko-Mazurskie Zachodniopomorskie Norra Mellansverige Övre Norrland Hamburg Mellersta Norrland Småland Itä-Suomi Mecklenburg-Vorpommern Schleswig-Holstein Stockholm Uusimaa Pohjois-Suomi Sydsverige Östra Mellansverige Etelä-Suomi Denmark Väli-Suomi EU-15 Åland 0% 0% 10% 20% 30% 40% 50% 60% 70% 80% 90% 100% Share of R&D expenditure financed by business, 2002 Note: No data available for Lithuania Source: European Union (2005), authors calculations 30
33 Figure 23: Patenting performance, EU NUTS-2 subregions Patents per Mio. Capita, Stockholm Östra Mellansverige Uusimaa Västsverige Etelä-Suomi Pohjois-Suomi Sydsverige Övre Norrland Hamburg Denmark Norra Mellansverige Baltic Sea Region Central European Region Other EU regions Väli-Suomi Schleswig-Holstein Åland Mellersta Norrland Småland EU-15 Itä-Suomi Mecklenburg- Vorpommern 0 European NUTS 2 Regions (EU-15 Countries) Note: 41 further regions with less than 25 patent applications per mio. Capita not shown Source: Eurostat, 2005 Convergence in innovation performance within the region In order to get a better understanding of individual country performance and trends, a more detailed look at national innovation indicators is needed. The Summary Innovation Index of the European Innovation Scoreboard presents an overall view of how various individual countries are positioned against each other (see Figure 24 below). Russia is not included in this index. Figure 24: European Summary Innovation Index-2 (SII-2) Source: European Innovation Scoreboard (2004) According to the 2004 Scoreboard, SWEDEN and FINLAND confirm their sustained leadership in terms of innovation performance, but are tapering-off in their performance trend. GERMANY, DENMARK and ICELAND, however are maintaining both above-average performance and above-average improvement trends. ICELAND S improvements have been driven 31
34 most by a strong rise in business and public R&D spending, a growth in employment in high-tech sectors, and increases in tertiary education and lifelong learning. DENMARK has made notable improvements in the % of S&E graduates and the number of EPO patents. NORWAY, LITHUANIA, LATVIA and POLAND have all made stronger-than-average improvements in their performance trend, but they all remain below the European average performance. LITHUANIA has experienced the largest performance jump in the area of ICT expenditures, ranking 6 th among the EU-25 in this indicator. LATVIA S performance improvements have been driven by large jumps in EPO patents and business R&D expenditures. POLAND S position is explained by a combination of increases in the number of EPO patents, the level of ICT expenditures, and the level of public R&D expenditures. ESTONIA is the only country falling behind, with negative trends in the percentage of science and engineering graduates, percentages of high-tech employment, reductions in business R&D and the number of patents. One must remember, however, that all new-member countries have started from very low levels of performance, which means that even minor increases or decreases in absolute terms may show up as major swings in performance trends. Table 2: Selected innovation indicators for Baltic Sea Region (highest shaded, lowest in bold) Variable Denmark Estonia Finland Germany Iceland Latvia Lithuania Norway Poland Russia Sweden Europe 4 Average Annual GDP Growth ( ) Government Effectiveness Index (2002) 1 1,99 0,78 2,01 1,76 1,98 0,67 0,61 1,84 0,61-0,4 1,84 1,72 Public R&D Expenditure (% GDP, 2003) Business R&D Expenditure (% GDP, 2003) Researchers in R&D (per million population, 2002) Tertiary Enrollment (% of population, 2001) S&E Graduates (% of age class, 2002) ICT Expenditure (%GDP, 2003) Mobile Phone Subscriptions (per 100 inhabitants, 2004) Internet Users (per inhabitants, 2004) EPO Patent Applications (per million population, 2002) Employment in Hi-tech Manftg (% of total workforce, 2003) Employment in Hi-tech Services (% of total workforce, 2003) Early Stage VC (% GDP, 02/03) Sources: 1 World Bank KAM (multiple sources); 2 European Innovation Scoreboard 2004; 3 UNESCO; 4 ITU 4 Europe refers to Western Europe (for World Bank), EU-15 (for European Commission) and Europe (for ITU) Some changes in performance from the 2003 EIS and last year s report on innovation performance in the region are noteworthy: Tertiary enrollment and/or S&E graduates as a share of population have increased in DENMARK, FINLAND, LATVIA, LITHUANIA, POLAND, RUSSIA and SWEDEN. InESTONIA, both of these shares have decreased since last year Business R&D expenditure is up in DENMARK and LATVIA, but down in POLAND ICT expenditures as % of GDP in ESTONIA, LATVIA and LITHUANIA have markedly increased 32
35 Higher education, in particular tertiary enrollment, is a strength for this region as a whole. The prevalence of science and engineering graduates and researchers in R&D is also generally high throughout the region. The NORDIC COUNTRIES and GERMANY invest more than their eastern rim counterparts in R&D particularly R&D from the private sector (BERD). ICT proliferation is highest in SWEDEN and ICELAND, but impressive performance improvements in the BALTIC COUNTRIES in mobile proliferation and internet usage are pointing towards convergence in this area. Government effectiveness is markedly stronger in the NORDIC COUNTRIES and GERMANY (as one might expect from countries with a longer tradition of market economics). 9 Patent applications and employment in high-tech sectors are lower in the BALTIC COUNTRIES, POLAND and RUSSIA than in the NORDIC COUNTRIES and GERMANY. The availability of early stage venture capital (seed financing) is an issue for all of the countries in the region. The BALTIC COUNTRIES, POLAND and RUSSIA rank much lower on international indicators of competitiveness, political and economic stability than their western rim neighbors. These countries are still completing the transition from planned to market economies having to completely restructure financial systems, re-vamp educational structures, build-up infrastructure and ICT systems, and privatize a large majority of companies. Despite the major changes and strains of the last decade, these countries are showing impressive performance with annual GDP growth rates in excess of 6-7% in the past decade, major improvements in ICT usage, and continued strength in their scientific and research assets. Yet, there is still a long way to go before these countries reach prosperity levels equivalent to their other European neighbors. Table 3: Indicators of convergence in innovation performance, selected countries GERD Scientific Publications EPO Patent Applications Mobile Subscriptions (% of GDP, Eurostat) (total, Thomson ISI) (total by application date, Eurostat) (thousands, ITU) AAGR AAGR AAGR CAGR Denmark Estonia Finland Germany Iceland * Latvia Lithuania Norway 1.65** Poland Russia n.a n.a Sweden EU-25*** * 4.0 n.a. n.a. n.a *2002 **1999 ***Europe for ITU mobile subscriptions Policymakers are concerned over the ability of their countries to continue the dynamism and momentum of the past decade maintaining the growth and structural changes as they approach convergence, or catch-up, with the older EU Member States. As illustrated in the table above, none of the eastern rim countries seems to be on a smooth path to convergence with their western rim neighbors. ESTONIA and LITHUANIA are exhibiting the highest growth in R&D investments, but even if current growth rates are maintained until 2010, they will both fall far short of the 3% Lisbon objective (with 1.66% and 1.28% GERD rates respectively). LITHUANIA also leads growth in scientific publications and EPO patent appli- 9 Government effectiveness is measured by an index which combines into one grouping perceptions of the quality of public service provision, the quality of the bureaucracy, the competence of civil servants, the independence of the civil service from political pressures, and the credibility of the government's commitment to policies. 33
36 cations, but even if this strong growth continues, LITHUANIA will not come close to catchingup to current European or Nordic levels in these indicators by ICT (including indicators such as mobile penetration and internet usage) is the only area where convergence appears possible. Both ESTONIA and LITHUANIA already have mobile penetration levels comparable to the Nordic countries. ESTONIA and LATVIA currently outperform the broader European average in regard to internet usage. It is unwise, however, to leave the subject of performance measurements without first issuing a warning about taking these indicators at face value. 10 It is always necessary to consider both the sources and time periods for the data, as well as the situational factors at the root of the measurements. In the case of the new-member countries and RUSSIA, percentage changes can appear noteworthy simply because absolute values are so low. Also, situational factors (such as large investment inflows from structural funds or foreign investment) can have a significant, if temporary, impact on indicators. In the BALTIC COUNTRIES, for instance, the development of ICT (to support access to and the spread of information) had strategic priority and received considerable investment. These targeted investments had a direct impact on the improved performance for this specific indicator. In addition, national industrial structure and strategic priorities may drive a different approach to improving innovation than is measured by the current indicators. DENMARK and NORWAY are prime examples of countries where small businesses, rather than large multinationals, are the backbone of their economy and main source of innovation. Given that small companies seldom have the financial resources to invest in basic research, the investments are instead targeted at applied research and market-driven innovation, rather than technology-driven innovation, measures. Current indicators are primarily focused on tracking technology-focused innovation (e.g. percent employment in high-technology manufacturing and services), leading to a skewed measurement of innovation in countries where innovation activities and investments are focused on more traditional sectors or functional capabilities. Innovation systems: governance and integration As innovation is spread over various functional and policy realms (education, ICT, business, science, etc.), success is determined by the ability of the various stakeholder groups to collaborate and complement each other in their innovation processes. On a national level, the increasing importance assigned to interaction and linkages, for economic performance, is captured in the notion of the innovation system, governed by innovation policy. In line with an increasing number of nations around the globe, countries of the Baltic Sea Region are focusing on innovation policy and implementing so-called innovation strategies realizing that in order to ensure long-term economic growth and competitiveness, they will need to establish the appropriate educational and technological foundations, ensure conducive framework conditions, and facilitate effective and productive interactions and linkages between actors within their borders as well as with other countries in the region. National choices concerning governance of innovation policy play a key role in determining the effectiveness of policy in enabling and strengthening innovation in an economy. Lately, increasing attention has been focused on the importance of high-level coordination of innovation, both at regional, national, and supranational level. 10 For a discussion of the problems with indicators, see also Schwaag Serger and Wise Hansson (2004), Competing in the Single Market SMEs and Innovation in the Baltic Countries and Poland, IKED, Malmö. 34
37 Table A-1 in the appendix provides an attempt to summarize some key elements of innovation policy and governance in the Northern Dimension countries. This table is intended to serve as a basis for comparison and discussion. Some of the issues that are depicted here are: who is in charge of innovation, whether there are national strategies or policies for innovation, to what extent other stakeholders, aside from the government, are included in the policy formation process, whether there is an agency in charge of innovation, and whether there is a high-level policy council for science and technology policy or innovation. 11 One of the conclusions to be drawn from this table is that whether countries have a national innovation strategy, council or agency, or whether policymaking is designed to include relevant stakeholders, is not dependent on the level of economic development. Another observation is that while most countries now have national innovation strategy documents, these tend to be very new, that is, around 2-3 years on average. Over the past year, innovation policymakers in the eleven countries of the Baltic Sea region have formed a working group under the leadership of the Nordic Council of Ministers the Northern Dimension Working Group on Innovation (NDWGI). The objectives of this group have been to establish a network and forum for policy learning, to raise awareness and competency levels on innovation policy through the structured presentation and discussion of issues in the Northern Dimension area, and to strengthen regional cooperation and build the foundation for coordinated/joint action in the realm of innovation policy. Working group discussions focused on policy learning through case studies where it became evident that this region is very aware of the importance of evaluation. In order to determine the success of policy initiatives and better understand what works in different situations, policymakers need both quantitative and qualitative measurements and methodologies. Innovation policymakers in the Baltic Sea Region are considering ways of standardizing evaluation procedures and forming teams of innovation policy evaluators to help each other. As a result of working group discussions, the region s innovation policymakers have agreed on two priority areas for continued joint work and policy action: promoting marketdriven innovation and supporting cluster development. Members of the working group have agreed on trying to find a platform for future inter-governmental cooperation in these two areas. Overall assessment The Baltic Sea Region maintains a competitive strength in its human capital base and other innovation input factors, yet the region continues to exhibit a relatively lower ability to turn these human capital assets into innovative outputs and economic prosperity. Although the eastern rim countries continue to exhibit strong GDP growth and positive trends in tertiary enrollment and ICT investments, there is still a large performance gap in primary innovation input and output indicators. Furthermore, there are indications that only a limited number of countries are showing significant increases in R&D expenditure (and other investments in knowledge), an important factor in future innovation potential. The latest data does not, however, capture the results of more recent initiatives to link students, researchers, businesses, and clusters at national and Baltic Sea regional levels. Policymakers across the region have jointly prioritized several areas of action and plan to do more together in the coming years. 11 A very useful comparison and assessment of high-level policy councils and their role in national policymaking in the EU can be found in Boekholt (2004), Ensuring Policy Coherence by Improving the Governance of Innovation Policy, Background Paper, Trend Chart Policy Workshop, Brussels. 35

38 The Baltic Sea Region and the Lisbon Agenda The Baltic Sea Region performs strongly on many dimensions of the Lisbon Agenda; countries from the Region take the top position in the national ranking The Baltic Sea Region has a particular profile of strengths and weaknesses that should give it a strong voice in policy areas related to employment, social cohesion, and innovation On 24 th March 2000 the European Council committed itself to what has become known as the Lisbon Agenda, an effort to make the European Union the most competitive and knowledge-based economy in the world economy by Only a few weeks later the IT/Technology-boom collapsed world-wide and the European ambitions met a much more challenging environment than had been previously assumed. The mid-term assessments prepared in 2005 indicate that the European Union has made little progress on the goals set out in Lisbon and has on many dimensions fallen behind key global competitors. Others were much better in dealing with the global economic environment. In February 2005 the European Commission presented a plan to reenergize the effort, focusing on economic growth and employment as key priorities and streamlining the political process to achieve change. This new process is now getting under way, with fully implementation in The broad ambition of the Lisbon Agenda can be broken down into three areas: Increase productivity, increase the level of economic activity, and do both consistently with social cohesion and environmental sustainability. The European Commission has developed a system of indicators organized into six groups to track progress in these areas. In terms of this Report s methodology, one of these groups measures economic outcomes, three measure business environment conditions, and two the broad context. Table n below presents the groups and the respective indicators used in the analysis. The EU publishes data on more indicators, but complete data is most readily available on the ones we use here, that are also generally considered to be central in their area. Table 4: Lisbon Agenda indicators 36

39 Overall performance EU member countries from the Baltic Sea Region, especially the Nordic countries, have been consistently singled out as the best Lisbon Agendaperformers. To better understand the relative strengths and weaknesses of the Region across the different dimensions of the Lisbon Agenda, and see how the picture has changed over time, we have created summary indicators of performance. 12 We also include Norway and Iceland, two non-eu members still included in the relevant statistics. The Baltic Sea Region is ahead of the EU-25 in terms of overall achievement on the Lisbon Agenda objectives. It is also ahead of the Central European Region, which slightly trails the EU average. The advantage of the Baltic Sea Region towards of the European average has slightly decreased since 1999; the Central European Region slipped even more, although the absolute changes are small. It is interesting to note that the two European regions report quite different patterns of performance. The Baltic Sea Region is particularly strong in employment (see the discussion of economic activity earlier in Section A), social cohesion, and innovation and research; the Central European Region excels in economic reform. Figure 25: Lisbon Agenda performance of European regions Individual countries across the Baltic Sea Region differ quite widely in their Lisbon Agenda-performance. SWEDEN, NORWAY, DENMARK, and FINLAND lead overall, with ICELAND following closely after. Norway has dropped somewhat due to lower performance on economic reform (private sector investment and rising domestic price levels), while all other four countries have increased their lead versus the EU-25 average. GERMANY follows, still ahead of the EU-25 average, despite falling behind on a weakening overall economic background and lower performance on economic reform. The three BALTIC COUNTRIES are 12 We have proceeded in three steps: First, we have normalized the actual data for each indicator such that the best performer was given a 10 and the worst performer a 1. This normalization avoids indicators with very large dispersion to receive a larger weight; the actual impact on the rankings turns out to be minimal. Second, we calculated a simple average per country across indicators for the area score and then across areas for the overall national score. Third, for figure 25 we expressed each data point relative to the EU-25 average on a given indictor. 37
40 somewhat below the EU-25 average but have gained ground recently, especially Estonia and Latvia. POLAND has dropped significantly, and is now only ahead of Malta. Figure 26: Lisbon Agenda performance of European countries Performance in specific areas The performance measures for each of the six dimensions of the Lisbon Agenda where derived from data on two or three indicators each. On employment, the Baltic Sea Region ranks slightly better on the employment rate among the 55 to 64 year old than on the employment rate for 15 to 64 year olds. The difference is mainly driven by the three Baltic countries that all score relatively high on employment in the older age group. Iceland is the top performer on both categories, followed by the other Nordic countries. Only the Netherlands break into this group, ranking 4 th on the employment rate for workers aged 15 to 64. Spain, Latvia, Finland, and Hungary improved most between 1999 and 2004, while Poland, Norway, Iceland, and Austria dropped. On social cohesion, the Baltic Sea Region ranks better on the dispersion of regional unemployment rates it has fewer local pockets of very high unemployment and on the share of people at risk-of-poverty (disposable income after transfers below 60% of the median level) than on the share of long-term (>12 months) unemployed. Sweden, Denmark, and Norway are the three leading countries in this category. Germany and Finland suffer from high longterm unemployment rates. Poland, Hungary, and the Czech Republic report low shares of people at risk-of-poverty, presumably driven by still relatively low median income levels. On innovation and research, the Baltic Sea Region excels in R&D spending while its ranking on the share of 20 to 24 year old with at least upper secondary education completed is significantly lower. Sweden, Finland, and Norway rank overall on top, followed by Austria and Belgium. Denmark, Iceland, and Germany suffer from lower youth education levels, while Poland and the Baltic countries show the opposite pattern with high ranks on education but low ranks on R&D spending. Norway, too, records relatively weak R&D spending. 38
 bias their ranks.")
41 On the general economic background, the Baltic Sea Region ranks quite similar on productivity (GDP per employee) and prosperity (GRP per capita). Luxembourg, Norway, Ireland, and Belgium rank highest overall, although external factors (large number of cross-border commuters, high oil prices, and high inward FDI stock) bias their ranks. Denmark records relatively low labor productivity, Finland relatively low prosperity. On the environment, the Baltic Sea Region records high energy intensity but ranks better on transport intensity and reduction of greenhouse gas emissions. The United Kingdom (low transport intensity) and Germany (low energy intensity and falling greenhouse gas emissions) rank best overall, followed by Denmark and Sweden. Eastern European countries benefit from reducing emissions from high initial levels, while the Nordic countries find it harder to reduce relatively low levels further. Iceland, Finland, and Sweden also get weighted down due to high energy intensity, Norway for high transport intensity. On economic reform, the Baltic Sea Region suffers equally from low business investment rates and high domestic prices. Estonia, Latvia, Slovakia, and the Czech Republic are overall ahead on these measures, followed by Spain as the first old EU member country. High prices in the Nordic countries hurt their ranking most, although business investment rates also tend to be low. Sweden suffers from particularly low business investment rates. Finally, countries from the Baltic Sea Region have been quicker than many of their peers in transposing EU-directives related to the Lisbon Agenda into national law. Denmark and Finland rank best, while Germany and Sweden are below the EU average. Figure 27: Transposition of Lisbon Agenda EU-directives Overall assessment The Baltic Sea Region performs strongly on many dimensions of the Lisbon Agenda and the development in many parts of the Region is positive. This should give weight to the Region s voice in discussion necessary changes to ensure the success of the Lisbon Agenda in providing the ground for higher European competitiveness. 39
42 SECTION B: TOWARDS Prioritizing areas for regional action OWARDS AN ACTION AGENDA The assessment of Baltic Sea Region competitiveness identifies what needs to be done to achieve higher prosperity and productivity, not at which geographic level Cooperation at the Baltic Sea Region-level is no substitute for sound national policies, but it can mobilize additional resources in three areas: o Benchmarking national policies o Cooperation in areas with significant cross-border spill-overs, such as infrastructure, environmental protection, cluster development, and rules and regulations surrounding the movement of capital, goods, services, people, and ideas o Joint representation of the Region internationally The Baltic Sea Initiative of different institutions across the Region with a stake in regional competitiveness has identified six issues for further activities The assessment of competitiveness across the Baltic Sea Region suggests overall policy priorities for the Region. The assessment does not, however, identify at which geographic level, from the sub-national region to the country to the Baltic Sea Region, action should be taken. There is a tendency to assign issues that are being perceived as important to a higher geographic level. Instead, specific policy areas need to be assigned to the geographic level that can address them most effectively. Our focus is on action areas where the regional level is the most appropriate one. We hope, however, that the Report s country-specific data will also be useful for decision-making at the national level. Regional cooperation and competitiveness Cooperation among neighboring countries and sub-national regions adds to the tool kit that policy makers can rely on when launching efforts to improve competitiveness. Regional cooperation can never be a substitute for sound national policy choices, but it can improve their quality and impact. We see mainly four areas in which regional cooperation can play a role: First, regional networks can be used to benchmark and learn from the experience of other countries in the region in many different policy areas addressed on the national and subnational level. Geographic and cultural proximity can make it much easier to learn from such examples. Such cooperation can occur in all combinations of actors from parts or the entire region. It tends to be relatively easy, as there is no need for joint decision making and all parties are free to use the new knowledge in whatever way they see fit. Given the significant differences across the Baltic Sea Region in policy areas that affect competitiveness there is clear room to continue such activities across the Region. Second, neighboring countries can work together in areas where cross-border spillovers are significant. Infrastructure investments, rules that affect regional trade, migration, capital, and knowledge flows, cluster development, dispute resolution, and environmental protection are typical examples. Such efforts are somewhat more complex because they require joint decision-making and commitment from all parties. The countries or sub-regions included, however, can vary from project to project. Given the considerable economic linkages, spill-overs, and cluster overlaps there is clear room to continue and step-up such activities across the Baltic Sea Region. 40
43 Third, politicians in neighboring countries can use regional agreements as a way to change to political balance on economic issues on the respective national level. Tying a policy choice to a regional agreement can increase its credibility over time. It can also make policy choices feasible in a package with other activities, for example market access or support for economic development that would be hard to achieve on their own. For these complex political considerations to be sustainable, the regional level needs to be perceived as politically powerful. This role has in the past been played very successfully by the European Union. However, its recent experience also shows the danger of taking too many decisions under the cover of alleged EU necessity rather than arguing them nationally. We see it as a less important motivation for regional cooperation in the Baltic Sea Region. Fourth, countries can work together as a regional bloc in order to increase their impact on the international scene by increasing size. One important arena is that of the international institutions, in the case of the Baltic Sea Region especially the European Union. Working together, countries from the Region can increase visibility but more importantly also increase their impact on decision taken at the EU level. This requires countries to form a common opinion shared across the Region and then to take a stand for this opinion at the EU level. Other possible audiences are international investors, tourists, or consumers. The Baltic Sea Initiative: Towards an Action Agenda The 2004 Baltic Development Forum Summit in Hamburg gave, based on the initial assessment of the 2004 State of the Region-Report, a mandate to identify priority action areas for regional cooperation to strengthen competitiveness across the Baltic Sea Region. Since then, a group of 50+ individuals representing institutions and companies from across the Region with a stake in regional competitiveness has met a number of times to discuss such action areas. The group s aim was to prepare the ground for a more informed decision on action priorities, not to take the decision themselves. Many of the stakeholders involved would also be the natural candidates for taking the lead on these actions. More information about the Baltic Sea Initiative (BSI) and its participants is available at Section B of this Report will in the following pages provided data and ideas on five action areas discussed in the BSI stakeholder group. Although informed by the work in that group, the decisions about which areas to cover and what data and ideas to present were deliberately left to the authors of the Report. The action areas discussed in this Report fall into two categories: Efforts directed at specific dimensions of the Baltic Sea Region business environment, and efforts directed at crosscutting issues affected by all dimensions of the business environment. In the first category, we look at cluster development, entrepreneurship, and research. Cluster development is a relatively new policy approach focused on organizing a modern dialogue between government, companies, and other institutions like universities to enable higher productivity and innovation. Benchmarking these practices across the Baltic Sea Region and mobilizing linkages between cluster locations throughout the Region promises significant economic returns. Entrepreneurship has been identified as a critical issue everywhere in the Baltic Sea Region, even though the barriers to entrepreneurship differ significantly across countries. Benchmarking the different policy approaches taken should help improve their efficiency considerably. Research, finally, is a clear strength of the Baltic Sea Region. Finding ways to learn from each other and integrate capabilities across borders can contribute to lifting this competitive advantage to the next level. 41

44 Figure 28: Action priorities for regional co-operation In the second category, we look at the role of Russia in the Baltic Sea Region and at the potential for positioning the Region towards different audiences. Russia provides an enormous economic opportunity to the other parts of the Baltic Sea Region, but it is an opportunity that is hard to realize. Working on concrete cross-border projects and jointly with Russia s Northwestern District to fully integrate them in the Region is worthwhile given the potential pay-offs. A clear positioning of the Baltic Sea Region can significantly improve the impact of policy action by changing the way in which different audiences perceive them. Defining clear target characteristics for the Region puts the investments in cluster development, entrepreneurship, and research in a context that indicates the linkages between them. The material presented in this section is intended to motivate and inform further work in the action areas after the 2005 Baltic Development Forum Summit in Stockholm, not to provide an exhaustive discussion of the areas covered. At the Summit, two decisions will have to be taken to allow this work to start: First, there needs to be a decision about the organizational structure to steer and co-ordinate activities. Second, there needs to be a decision about which activities to start with and the responsibilities for pursuing them. 42
45 Cluster Development Cluster specialization becomes an increasingly important driver of economic success, and cluster-based efforts have moved into the mainstream of economic policies The Baltic Sea Region s cluster export profile reveals a number of opportunities for cross-regional co-operation between regional clusters; the identification of top clusters throughout the Region can help to identify potential partners The presence of related and supporting industries is an overall strength of the Region, but the differences across countries are large. The southeastern parts of the Region still suffer from the anti-cluster legacy of the planned economy era Many cluster initiatives have over the last few years developed across the Baltic Sea Region, making it one of the most active user of this policy tool globally Cluster, cluster development, and competitiveness Cluster, geographically co-located groups of companies and other related institutions active in a specific economic field, are critical elements of regional economies. In clusters, companies can reach higher levels of productivity and innovation because they benefit from the proximity to ideas, skills, and ideas particularly relevant for their activities. Regions with a higher share of employment in their strongest clusters reach higher wage levels; this finding from the U.S. has recently been confirmed in European research. 13 Somewhat paradoxically, clusters are becoming increasingly important as globalization removes many barriers for trade and investment: Competition among location increases, locations become more and more specialized in specific clusters, and the access to local clusters becomes one of the few remaining sources of differentiation for companies that competitors cannot easily copy. Regions increasing their level of cluster specialization over time have achieved higher wage growth. Cluster initiatives, joint efforts of the private and public sector to increase the competitiveness of a specific cluster in a given location, have in the last few years become increasingly popular policy tools. This new level of co-operation between companies, government agencies, and other institutions like universities, research laboratories, and trade associations enables policy decisions to be directly linked to the competitive reality companies face in their respective markets. In the Nordic countries, this co-operation has sometimes been characterized as a triple helix of business, government, and academia. Cluster and cluster development in the Baltic Sea Region The Baltic Sea Region is home to a number of strong clusters and it has become one of the global leaders in launching cluster efforts to achieve economic development. At the same time there is a strong sense that cluster specialization across sub-national regions around the Baltic Sea still has a long way to go. While individual clusters are always limited to a specific region that is much smaller than the Baltic Sea Region and often smaller than a country, there is an opportunity for co-operation among all such clusters in a given field, for example of all biopharmaceutical (also called Life Sciences) clusters located in the Baltic Sea Region. We provide data on the cluster composition of exports by Baltic Sea Region countries, on employment patterns by cluster across sub-national regions and countries in the Region, on cluster environments, and on current cluster-based policies. 13 Michael Porter, The Economic Performance of Regions, Regional Studies, Vol. 37 (2003) 43
46 First, we look at the cluster composition of goods exports from the Baltic Sea Region (data for service exports is unfortunately not available at this detailed level), using a new data set generated by Michael Porter at the Institute for Strategy and Competitiveness, Harvard Business School: 14 About 2/3s of all goods exports from the Baltic Sea Region in 2002, the latest year for which this data is available, were recorded in the 15 clusters in which the Region had a revealed comparative advantage (RCA), i.e. a world market share above its world export market share across all goods exports. In nine of these, accounting for about 40% of the Region s total goods exports, the Region gained market share, with the largest gains in marine equipment and prefabricated enclosures (includes different types of metal-based structures from refrigerators to mobile homes and train cars). In six, accounting for about 25% of all goods exports, it lost position. The automotive cluster is the only one among the largest exporters from the Region that has a market share below the Region s average. A comparison to the Central European Region s export cluster composition suggests that the Baltic Sea Region has a higher level of cluster specialization but that the Central European Region is currently in the process of specializing much more. Both regions have about 2/3s of exports in clusters in which they have a RCA. However, the Baltic Sea Region s top clusters in terms of market share, forest products and fishing products, have a much stronger position than the top clusters in the Central European Region, building fixtures (includes different types of products used for home improvement and decoration), prefabricated enclosures, power generation equipment, and automotive. But almost all Central European Clusters with RCA are gaining world market share, while this is not the case for the Baltic Sea Region. Figure 29: Baltic Sea Region World Export Market Share by Cluster 14 Compared to last year, a more detailed cluster structure and market share data have become available. 44

47 Among the countries in the Baltic Sea Region, SWEDEN, the Region s largest exporter, is more specialized in aerospace engines, biopharmaceuticals, automotive, and forest products relative to the Region s average. NORWAY is strong in oil and gas products, fishing products, and marine equipment. DENMARK has its relative strengths compared to the Region in food products, biopharmaceuticals, power generation (wind energy), and footwear. GERMANY is, on the national level, strong in automotive, aerospace vehicles, and IT. FINLAND has its strengths in forest products, communication equipment, and marine equipment. RUSSIA is nationally strong in exports of oil & gas as well as coal. POLAND, too, is nationally strong in coal exports but also in marine equipment. The three BALTIC COUNTRIES are all relatively specialized in apparel. ICELAND, finally, is strong on fishing products and aluminum. There are a number of clusters where the export pattern alone suggests the potential to cooperate on the level of the cross-national region. These are all clusters in which the Region overall has a significant position and where this position is based on a number of countries in the Region with a revealed comparative advantage in the cluster s products. While Sweden, Finland, and Denmark have a position in many of these clusters, the specific composition of countries clearly differs from cluster to cluster. Figure 30: Share of cluster exports from countries with RCA>1 Second, we look at top clusters across sub-national regions and smaller countries across the Baltic Sea Region. We use a translation of the cluster codes developed by Michael Porter in the Cluster Mapping Project in the United States and applied to a European data set in a project on clusters in the new EU member countries under the leadership of the two main authors of this Report. Sufficiently detailed data was unfortunately only available for Germany, Poland, Sweden, Norway, Finland, and the three Baltic countries. Industries in the cluster-part of the economy account for one third of all jobs in this part of the Baltic Sea Region, between 26% in Övre Norrland and 57% in Länsi-Suomi. 50% of all 45

48 jobs in the cluster part of the economy are concentrated in six clusters: Transportation and Logistics, Heavy Construction Services, Financial Services, Processed Food, Education and Knowledge Creation, and Hospitality and Tourism. About jobs are located in the Region s top 16 regional clusters. We call these clusters 3 STAR because they meet three tests: They each account for at least jobs, at least 10% of regional cluster employment, and its share of regional employment is at least twice of what is expected from the average across all Baltic Sea regions (specialization quotient SQ > 2). Six of these clusters are in Sweden, three in northern Germany, two in Finland, in Norway, and in northern Poland, and one in Iceland. 15 Table 5: 3 STAR cluster in the Baltic Sea Region* Third, we look at the presence of related and supporting industries in the Baltic Sea Region, using the survey data from the Global Competitiveness Report. The cluster environment is an area of relative strength for the Region. The comparison with the Central European Region, which is also strong overall on this dimension, reveals clear differences in the positioning of the two regions. The Baltic Sea Region is ahead or only slightly below Central Europe on specialized research and training services and supplier quality, indicating the focus on high value development activities. Central Europe s profile is in contrast strongly shaped by the region s position as a manufacturing hub. 15 An upcoming report for the European Union by the authors presents the list of 3 STAR clusters across all ten new EU member countries. Sölvell/Ketels/Folkesson (2005 forthcoming), Regional Clusters in the EU-10, European Commission DG Enterprise, Brussels. 46


49 Figure 31: Related and Supporting Industries, Baltic Sea Region and Central European Region Among the countries in the Baltic Sea Region, GERMANY ranks highest in overall cluster strengths, reflecting a long tradition of Mittelstand -clusters. DENMARK and FINLAND, both countries that in recent years have made a strong push for cluster development, are also in among the leading countries on this summary measure. SWEDEN, a more recent adopter of cluster-based economic development follows, ahead of a number of Asian countries. NORWAY and ICELAND follow at a considerable distance. All countries in the southeast of the Region rank far lower, at least in part a legacy of the anti-cluster policies applied in the plan economy era. Table 6: Related and Supporting Industries Ranking, Selected countries 47

50 Fourth, we look at the presence of cluster initiatives in the Baltic Sea Region, drawing on a recent global survey of cluster initiatives. Of the literally hundreds of such initiatives identified, 112 participated in our survey. Other efforts to map cluster initiatives in the Region, for example by the NORDIC CLUSTER ALLIANCE network launched last year, indicate as well that this Region has become one of the globally most active in cluster efforts. The Life Sciences in particular are an area in which many cluster initiatives have been launched and where some cooperation among them exists through SCANBALT. Figure 32: Selected Cluster Initiatives across the Baltic Sea Region in Life Sciences Conclusion: Proposal for Action We recommend that the Baltic Sea Initiative considers three specific types of activities to improve cluster development in the Region: First, a number of clusters have a presence in different parts of the Region. For these clusters, cross-regional efforts like SCANBALT can improve linkages, help to spread knowledge about activities undertaken in individual regional clusters, and strengthen their efforts to gain global visibility. Second, cluster initiatives are used in many parts of the Baltic Sea Region. There is ample scope for structured benchmarking and learning among these cluster initiatives, drawing on the example of the NORDIC CLUSTER ALLIANCE launched last years. More co-operation along these lines could increase the effectiveness of the many investments currently made in cluster projects throughout the Region. Third, while there is much activity in clusters around the Region, there is currently a clear lack of systematic data on clusters, cluster environments, and the effectiveness of cluster-based policies. A neutral research institution could develop such a data infrastructure and provide more effective support for cluster policy choices. 48
51 Baltic Sea Research & Education Region A strong human capital base is essential for innovation-driven growth; skilled resources must be available to attract firms, and professional opportunities must be available to put knowledge capital to work One of the Baltic Sea Region s key assets and common strengths is its highlyeducated population, including a comparatively high number of researchers So far, the human capital and knowledge flows between the countries are relatively small and regional cooperation on education and research is limited As presented in Section A of this report, the Baltic Sea Region has an internationallyleading research and human capital base. Research intensity, levels of tertiary education, proportion of science and engineering students, and numbers of researchers in R&D are among the highest in the world. However, cross-border collaboration between individual researchers, research institutions and universities within the region is developing at a very moderate pace. Each country places increasing focus on knowledge. So far however, regional cooperation, which could play a critical role in further strengthening the supply and utilization of the region s human capital base, is limited. Given limited national resources and the relatively small size of many of the countries in the region, it is difficult if not impossible for each of the countries in the region to create globally-recognized universities and research centers. Joint initiatives can play a critical role in putting the region s universities and research resources on the map. Even though newly-formed regional organizations and networks have made strides towards more integrated activities, levels of student exchanges, transnational education programs, intraregional publications and patents are increasing at a moderate pace. The Baltic Sea Region has the opportunity to build on its existing, strong assets and make research and education a globally-known and marketable competitive advantage. In order to do this, however, national decision-makers need to identify common priorities and a set of actions to ensure that these priorities are followed to fruition. Education and research frameworks in the Baltic Sea Region Education and research systems are developed and financed nationally. Currently, the output from these human resources is also strongly linked to individual countries. One of the goals of EU countries is to move towards a common market for education and research. As an intermediate step towards this goal, certain regions of Europe are working to integrate their resources more effectively. The Baltic Sea region is already viewed by many multinational companies as one market. When asked about their strategies, companies state their wish to establish themselves anywhere in the region and have access to the highly-skilled human capital in all of the eleven countries. In order for this to be feasible, students must feel that it is both possible and beneficial to study in countries other than their own, and researchers must be able to more easily collaborate with and find job opportunities in other countries in the region. In order to contribute to the realization of the Lisbon strategy, Ministers of Education adopted Education and Training 2010 in 2001 a set of shared goals and a work program to be implemented through an open method of coordination. An integrated part of these goals This section was written by Sylvia Schwaag-Serger (sylvia.schwaagserger@itps.se) and Emily Wise Hansson (emily.hansson@fpi.lu.se), Research Policy Institute, Lund University 49

52 is the European Higher Education Area (as set out in the Bologna process). The Bologna process aims at making the higher education systems in Europe converge towards a more transparent system whereby the different national systems use a common framework for Bachelor, Master and Doctorate levels. Specifically, the aim is to have a standard framework for academic grades/diplomas, required numbers of years for each degree, a system for accumulating and transferring credits in different countries, and a method for ensuring mobility of students, teachers and researchers. Although progress has been made, students are still finding it difficult to study in other countries. Course work (and credits) are not easily transferable; the course breadth is more narrow (due to different languages); and there are not enough scholarships or other financial mechanisms to cover the costs of studying abroad. Figure 33: Student flows within and outside the Baltic Sea Region As shown in the figures above, student flows within the Baltic Sea Region are lower in comparison to the flows to other European countries and to the USA. On the whole, students studied outside of the Region in 1998/1999 (of which studied in Austria, France, Netherlands, Spain or the UK, and studied in the USA). The figure was almost 10% higher in 2002/2003, when students studied outside of the Region, with similar proportions traveling to other European countries and the USA. The total number of students studying in other countries within the Region almost doubled between 1998/1999 and 2002/2003 from to As a percentage of the total number of students in the region studying abroad, the flows within the Region have increased from 18.8% to 27.7% of the total. There is a clear indication of significant and growing integration of knowledge and human capital in the Baltic Sea Region as measured by the destinations chosen by pupils wishing to study abroad. A more detailed analysis shows that the share of outbound students choosing a destination within the Baltic Sea Region for foreign study, as a percentage of total students studying abroad, has increased in all the Nordic countries and Germany, with the exception of Norway. Swedish, Danish and Finnish students are increasingly choosing to study in other Nordic countries and Germany, but also Estonia, Latvia, Lithuania and Poland. This increase, both in absolute and relative terms (when looking at the share of total outbound students) is occurring at a time when the number of Nordic and German students in the US and the UK, while still large in absolute numbers, is falling In 2002/2003, between 33%-50% of all outbound Nordic and German students studied in the US or UK. 50
53 An increasing number of Nordic/German students (24% increase) have chosen Estonia, Latvia, Lithuania and Poland as study destinations over the U.S. (increasing by only 6.8%) between 1998/99 and 2002/2003. In 2002/2003, more than half of Finnish, Icelandic and Polish students studying abroad students were doing so in one of other Baltic Sea Region countries. Flows from east to west that is to say the number of students from Estonia, Latvia, Lithuania, Poland and Russia have grown between % in the past 5 years. 17 Between 1998/1999 and 2002/2003, the number of students from Estonia, Latvia, Lithuania, Poland and Russia increased by 85% to Nordic countries/germany, by 21% increase to U.S. and by 42% to other European countries (UK, France, Spain, Netherlands, Austria). In Estonia, Latvia and Lithuania, 8 out of 10 students studying abroad chose a country within the Region. This is an indication of a shift in geographic preference for foreign study away from traditional destinations, such as the US and UK, as well as other European countries outside the Region (e.g. Spain, France, and Netherlands) and towards countries within the BSR region. Table 7: Numbers of students studying abroad total 1998/ /2003 of which in BSR BSR share total of which in BSR BSR share Denmark ,3% ,5% Estonia ,1% ,2% Finland ,3% ,1% Germany ,4% ,5% Iceland ,0% ,6% Latvia ,2% ,0% Lithuania ,2% ,6% Norway ,6% ,0% Poland ,9% ,4% Russia ,4% ,9% Sweden ,6% ,9% Source: UNESCO Institute for Statistics (UIS), author s analysis Note: data does not include foreign students in Canada and Nordic/German students in Russia; calculations for total foreign students includes only countries which host at least 1000 foreign students (with the exception of Iceland and Lithuania, which are included) In order to help encourage students to study abroad within neighboring countries, rather than travel to the USA, universities within the region must be an attractive choice. According to the Institute of Higher Education of Shanghai Jiao Tong University s Academic Ranking of World Universities, only 7 universities in the Baltic Sea Region ranked in the top 100 worldwide (Karolinska Institute 45, University of Copenhagen 57, Uppsala University 60, University of Oslo 69, University of Helsinki 76, Stockholm University 93 and Lund University 99). 17 Estonia constitutes an exception in this context, with a mere increase of 15% of students studying abroad between 1998/1999 and 2002/2003. The relatively small increase can be explained by a decline in the large number of Estonians studying in Russia. In 1998/1999 nearly half of all Estonians studying abroad could be found in Russia. Since then, this number has declined significantly. The number of Estonians studying abroad, and not in Russia, has increased by 60% in the past five years. 51
54 Specific educational and research opportunities within the region must exist if the BSR is to maintain its strong human capital base. Several transnational university programs are playing a role in strengthening integration in the region: The Baltic University Programme is a network of more than 180 universities and other institutes of higher learning throughout the region. The network is coordinated by Uppsala University ( The Finnish-Russian Cross-Border University (CBU) was launched in 2004 as a consortium of universities offering a Master s degree in six study fields in order to improve concrete expertise between Finland and Russia ( The Stockholm School of Economics has established business and executive management programs in Riga (1993), St. Petersburg (1997) and Moscow (2003); its institute for transition economics (SITE) also maintains a network of independent think tanks in emerging markets (in Moscow, Riga and Warsaw), aimed at strengthening the link between high-quality research and policymaking Within research, the situation is slightly different. The Baltic Sea Region has a strong human capital base in the individual countries, exemplified by its high number of researchers per inhabitant exceeding the European average (as discussed in Section A). Yet cooperation among researchers from different countries within the region is still relatively limited. As illustrated in the tables below, between 30-56% of scientific articles are copublished with authors in another country. Of these, rates of co-publication within the region vary widely: larger countries have lower rates, and smaller countries have higher rates, in general. Furthermore, while rates of co-publication are increasing (with the exception of the Baltic countries and Poland), levels of co-publication within the Region are not. While only Estonia, Latvia and Russia have a neighbor in the region as their top partner for collaboration on scientific publications, all of the countries have one or two Baltic Sea neighbors among the top three partners (with the exception of Germany). Table 8: International co-publications 1998 # Articles # Co-published % within BSR % Top 5 partners Denmark ,9% ,2% USA (1141), Germany (671), England (661), Sweden (596), France (407) Estonia ,7% ,7% Sweden (82), Finland (64), USA (51), Germany (49), Russia (26) Finland ,4% ,7% USA (822), Sweden (520), Germany (434), England (337), Russia (279) Germany ,8% ,0% USA (7326), England (2647), France (2586), Russia (1987), Switzerland (1945) Iceland ,6% ,3% USA (54), Sweden (53), Norway (45), Denmark (43), England (41) Latvia ,7% ,2% Germany (73), Sweden (52), USA (25), Russia (22), France (15) Lithuania ,2% ,9% Sweden (48), Germany (36), USA (33), Russia (28), France (25) Norway ,4% ,6% USA (646), Sweden (489), England (340), Germany (316), Denmark (300) Poland ,0% ,1% USA (927), Germany (856), France (572), England (359), Russia (324) Russia ,4% ,2% Germany (1987), USA (1944), France (1013), England (627), Italy (615) Sweden ,4% ,0% USA (1889), Germany (868), England (867), Denmark (596), France (559) 2002 # Articles # Co-published % within BSR % Top 5 partners Denmark ,8% ,9% USA (1399), Germany (784), Sweden (700), England (697), France (485) Estonia ,6% ,4% Sweden (93), Germany (70), Finland (62), USA (54), Russia (31) Finland ,9% ,0% USA (1074), Sweden (702), Germany (606), England (531), France (304) Germany ,7% ,1% USA (9872), England (3623), France (3398), Russia (2583), Switzerland (2522) Iceland ,9% ,2% USA (73), Sweden (59), Denmark (59), England (53), Norway (34) Latvia ,0% ,5% Germany (62), Sweden (35), USA (28), Russia (24), France (16) Lithuania ,8% ,1% USA (61), Sweden (51), Germany (51), France (42), Poland (28) Norway ,9% ,8% USA (811), Sweden (584), England (427), Germany (386), Denmark (373) Poland ,2% ,4% USA (1274), Germany (1118), France (750), Russia (493), England (460) Russia ,9% ,1% Germany (2583), USA (2351), France (1153), England (821), Japan/Italy (748) Sweden ,4% ,9% USA (2375), Germany (1233), England (1200), France (782), Finland (702) Source: Thomson/ISI, author s analysis. Note: This information was made possible by collaboration with VINNOVA s analysis department. Certain data included herein are derived from the Web of Science prepared by Thomson Scientific, Inc. (ISI), Philadelphia, Pennsylvania, USA. Copyright Thomson Scientific Inc All rights reserved. 52
55 As with patenting, there are many drivers that affect the level and international linkages in scientific publications (including research and publishing traditions, language, financing, etc). Yet if this region wishes to market itself to multinational businesses as the global leader in research and education where companies have access to the most-skilled research resources in the world, then much more must be done to operate as one resource base. NordForsk, Nordic Research Board, is a new independent Nordic research institution (established January ) with just this goal. NordForsk operates under the Nordic Council of Ministers and is responsible for Nordic cooperation within research and research training. During 2005, NordForsk is expected to distribute grants of NOK million for Nordic cooperation in research and research training, including activities earlier funded by NorFA. Grants distributed so far have included projects focusing on networks, research training courses and mobility scholarships within all disciplines, as well as Nordic research schools within specific disciplines (e.g. Biosphere-Carbon-Aerosol-Cloud-Climate Interactions, five graduate schools within the humanities and social sciences, and the Nordic Marine Academy within fisheries research). Many NordForsk activities are open to all countries in the Nordic region, which in addition to the Nordic countries includes the adjacent areas Estonia, Latvia, Lithuania and North-Western Russia. Conclusion: Proposal for Action The priority that research and education have in driving innovation and economic prosperity is recognized by all countries in the region. In fact, combined national strengths in this area lift the Baltic Sea Region to the top of the list of appealing locations to access skilled resources. However, if the region is to be successful in leveraging these resources, it is necessary to establish research and education goals, make common investments and undertake other joint activities. More specifically, countries in the region should work together to get increased visibility of universities and programs developing regional university rankings or prizes for work from the Baltic Sea Region which gets global recognition. There should also be greater efforts made to increase student and doctoral exchanges and develop programs to fund students or doctoral candidates in other countries. Increased focus should be placed on transforming the region s vast scientific research output to economic innovation and value. Recommended actions include joint investments in prioritized research areas, highlighted cases of successful efforts to bridge science and business, and job placement support for technically-skilled graduates within the region in order to prevent brain drain and secure innovative output in the long-term. 53
56 Entrepreneurship Entrepreneurship is important across all countries of the Baltic Sea Region; it is more than starting a business and is at play when companies structurally change through growth or restructuring Effective entrepreneurship policy needs to start with identifying the most important barriers that hold back entrepreneurship in a specific country; a one-size fits all approach is unlikely to be effective The Baltic Sea Region can benefit from benchmarking the different approaches to entrepreneurship policies across the countries of the Region, and informing entrepreneurs about business opportunities across the Region Entrepreneurship has become one of the central themes in the economic policy debates across the Baltic Sea Region. In the northwestern parts of the Region, entrepreneurship is seen as the missing link to overcome the low level of economic activity reported in section A and fully mobilize the potential for prosperity and innovation that many years of investment in skills and infrastructure have created. In the southeastern parts, it is seen as the critical engine in the development of a vibrant and increasingly globally competitive private sector to raise the low level of productivity registered in section A. While there is wide agreement on the importance of entrepreneurship, there is much less consensus about how this term should be understood. Consequently, there is also little consistency around the actions proposed to improve entrepreneurship across the Baltic Sea Region. Entrepreneurship is often connected with the creation of new businesses. But entrepreneurship is equally important when existing companies grow substantially, or when they restructure their operations significantly. There are many factors that generally affect the willingness and ability of individuals to behave entrepreneurial, most of them not different from the ones affecting company productivity and innovativeness more generally that were discussed in section A. Here, we focus on those factors that are considered to be especially important for entrepreneurship. Entrepreneurship in the Baltic Sea Region There is a strong sense in the public discussion that entrepreneurship is too low at least in the northwestern parts of the Baltic Sea Region. And there is a sense that few people in the Region consider starting a business an alternative to employment. Unfortunately there is little comparable data across a wider sample of countries, also driven by the vagueness of the definition of entrepreneurship. The data available broadly confirms a low level of entrepreneurship, although there are clear differences across countries in the Region. On the share of entrepreneurs in the population countries like SWEDEN rank low while ICELAND ranks very high. SWEDEN, DENMARK, NORWAY, and POLAND all report entrepreneurship numbers below what would be expected given their level of prosperity. Alarmingly, the trend seems to go down for all the Nordic countries except Iceland. On entry rates, NORWAY and DENMARK rate high while SWEDEN and FINLAND rank low. SWEDEN in particular has traditionally a much more large-company dominated industry structure than the other countries. On the share of high growth entrants, the NORDIC COUNTRIES rank below the best performers (US, UK, and Netherlands) but ahead of many continental European countries. 54

57 Figure 34: Rates of entrepreneurship across countries The data available also broadly confirms a low level of interest in entrepreneurship, although important nuances emerge. The countries in the northwest of the Baltic Sea Region have the highest share of people responding that they have a low preference of selfemployment; the countries in the southeast, however, report a much higher interest in entrepreneurship. Asked whether becoming self-employed would be feasible, the picture Figure 35: Entrepreneurship attitudes 55

58 changes remarkably: The highest share of positive responses is recorded in the Nordic countries. And on the share of people that are or plan to be self-employed and are or have been thinking about self-employment, only NORWAY and SWEDEN rank far below the EU average, while the other Baltic Sea Region countries rank higher, some significantly so. The data presented sheds light on the incidence of small business start-ups. There is much less evidence on the relative performance of countries as far as company expansion and restructuring is concerned. Entrepreneurship environment and policy in the Baltic Sea Region The policy responses to the perceived lack of entrepreneurship in the Baltic Sea Region are based on different hypotheses about the factors that drive this behavior. We want to discuss a number of areas most frequent in the policy debate. First, entrepreneurship might be low because there are heavy administrative barriers to setting up, growing, or restructuring a business. This is the argument made for the simplification of administrative procedures. The evidence suggests that the importance of such barriers in the Baltic Sea Region differs across different types of entrepreneurship. The Region registers very low formal barriers to registering a business, with the NORDIC COUN- TRIES ranking close to the global leaders Australia, Singapore, and the United States. The picture becomes more heterogeneous and, on average, more problematic when looking at the flexibility of labor laws, a critical factor for companies that grow or restructure. A number of countries, GERMANY, FINLAND, SWEDEN, and the three BALTIC COUNTRIES in particular, register low flexibility, increasing the barriers for companies to add employment. Removing administrative barriers, on labor markets as well as in bureaucratic processes, is a topic that clearly needs to be considered when looking at the root causes for low entrepreneurship. Figure 36: Barriers to Entrepreneurship Labor market flexibility 56

59 Second, entrepreneurship might be low because the incentives are low relative to other occupations. This is the argument made for a review of tax policies in the NORDIC COUNTRIES and GERMANY. ICELAND and ESTONIA are already perceived by business executives in these countries to provide a tax structure that provides strong incentives for economic activity. There is evidence that the tax structure and level affects the willingness to invest and take risks. One issue is the absolute level of taxes and social contributions in an economy. For a given level of business environment quality, lower taxes will provide higher incentives. But if tax revenues are used to upgrade business environment quality, for example the quality of the physical infrastructure, labor force skills, and university research, the costs of higher taxes have to be weighted against the benefits of a better infrastructure. In the NORDIC COUNTRIES, the gains from lower taxes are likely to outweigh the costs of fewer public investments in infrastructure and policy programs. In the BALTIC COUNTRIES the situation seems opposite; it is unclear whether their current tax level is sustainable given the need to upgrade infrastructure over time. EU structural funds can help close the gap for some time but are not a long-term answer, for economic as well as political reasons. The other issue is the complexity of the tax system, which especially in GERMANY (as in the United States) is perceived to be an additional burden for tax payers. The impact of taxes needs to be considered in the overall assessment of the prime causes of low entrepreneurship. Figure 37: Barriers to Entrepreneurship taxation Third, entrepreneurship might be low because of cultural attitudes and lack of knowledge about entrepreneurship. This is the argument that underlies many of the recent efforts on entrepreneurship education in schools and universities, especially across the northwestern part of the Baltic Sea Region. There is evidence that entrepreneurship was a less frequent topic in schools and universities of the Region than in other countries, especially the United States. The evidence on cultural factors is less clear cut. SWEDEN is a good example: The country registers the highest share of people that report a low preference for selfemployment. But it also is and has been the home of many of Europe s most prominent 57
60 entrepreneurs, from Wallenberg to Kamprad and Stenbeck, and saw a surge of entrepreneurial energy during the internet boom. It seems at least quite likely that factors other than culture or knowledge are more important in holding back potential entrepreneurs. Better coverage of entrepreneurship in schools and universities as well as a more positive attitude towards entrepreneurs are beneficial but it is not obvious that this is the main factor holding back entrepreneurship in the Region. Fourth, entrepreneurship might be low because there is little access to capital for entrepreneurs. This is the argument behind recent efforts to launch government-backed venture capital funds. There is widespread evidence that access to capital is a problem for entrepreneurs in many countries. In the U.S., start-ups profit from a more active business angle community and the well established financing instruments of the U.S. Small Business Administration. Compared to countries outside the U.S., however, the situation in the NORDIC COUNTRIES hardly looks worse than elsewhere. Financial markets are generally well developed, an advantage the BALTIC COUNTRIES can now draw on due to their full integration into the Nordic banking industry. Improvements in access to capital are beneficial but it is again not obvious that this is the main factor holding back entrepreneurship. Conclusion: Proposal for Action Most of the action needed to remove existing barriers to entrepreneurship across the Baltic Sea Region will need to be taken at the national level. But cooperation at the Baltic Sea Region level can play an important supportive role to enable more effective national policies. We recommend the following areas for action: First, countries across the Baltic Sea Region can cooperate in developing the analytical tools to identify the root causes of insufficient entrepreneurship in their respective countries. These tools can be used to base policy choices on fact-driven review of the factors that hinder entrepreneurs most. One option is to have these discussions on the level of specific clusters instead of economy-wide. The experience in other regions has been that this can broaden the debate beyond tax and labor market issues without sidelining them, and reduce the level of ideological positioning. Second, countries across the Region can benchmark and improve specific policies and tools in areas such as financing and entrepreneurship training. Many countries are currently trying to develop a new solution for problems that others have already faced before. Third, countries across the Region can work together to create more transparency for entrepreneurs about cross-regional business opportunities. By increasing their potential markets, this can make it more attractive for entrepreneurs to start, expand, or restructure a business. 58
61 Russia in the Baltic Sea Region Russia provides a huge opportunity for the rest of the Baltic Sea Region but also a large challenge in realizing it Northwestern Russia has registered strong economic growth after the 1998 Russian crisis, but serious weaknesses in the business environment and substantial barriers to trade and investment restrain integration with other Baltic Sea Region economies Projects with Russian involvement should concentrate on concrete opportunities for tangible benefits for both sides in specific clusters or in creating R&D linkages to leverage the St. Petersburg science base. Russia is probably both the largest opportunity and the largest challenge that the Baltic Sea Region is facing. Russia provides a huge market with high growth rates. St. Petersburg, the main city in Russia s Northwestern District, is by far the most populous metropolitan area in the Region. The relative small size of the Baltic Sea Region market and its peripheral location versus other main regions in the world economy reported earlier make these factors critical assets for the Region. But Russia is also the least prosperous country of the Baltic Sea Region, the country with the weakest overall business environment quality, and with continued high barriers to trade and investment with the other parts of the Region. If the Baltic Sea Region can fully participate in Russia s future economic development and maybe even make a contribution to improve the trajectory, the benefits for Russia, for its Northwestern District, and for the rest of the Baltic Sea Region would be substantial. Figure 38: Prosperity over time, Russian regions 59

62 Russia s Northwestern District: Performance and integration into the Baltic Sea Region The Russian Federation s Northwestern District accounts for roughly 10% of the country s population and economy. The prosperity of the District dropped significantly during the Russian crisis, but since 2002 growth has been strong, even outpacing the national average. Differences in prosperity and business environment quality across the Northwestern District are substantial, with St. Petersburg city by far the most developed sub-region. Unfortunately there is very little data available on business environment quality across Russian regions. One indication is given by work on the innovative potential of Russian regions that the UNDP has done. Their analysis unfortunately based on data from 2000 underlines the huge potential in St. Petersburg but also the significantly different conditions in other parts of the Northwestern District. Figure 39: Innovative capacity, Russian regions A number of other sources provide additional insights into the opportunities and challenges the companies in the Northwestern District face. A survey of Swedish companies active in Russia done by the Swedish Trade Council indicates that bureaucracy remains a central concern, including the practices of the Russian tax authorities that many companies view as not transparent. However, improvements are reported in the quality of the financial system. The Global Competitiveness Report registers falling ranks for Russia on the national level; the Northwestern District is unlikely to be excluded from this deterioration on the national level. Not surprisingly, FDI inflows continue to be low and concentrated on the natural-resource driven parts of the economy. All of the weaknesses in business environment quality discussed above affect companies located in the Northwestern District, whether they have linkages with companies active in the rest of the Baltic Sea Region or not. The barriers for trade, travel, and investment that still exist towards these neighboring locations have an additional negative effect on the ability to take advantage of the economic opportunities for co-operation in the Region. The visa regime continues to be criticized and tariffs and investment rules remain problematic. 60
63 An analysis of logistical costs for getting goods into and out of Russia indicates that St. Petersburg is at a serious cost disadvantage to other locations in the Baltic Sea Region. What is worse, the gap versus other locations seems to have increased since Figure 40: Importance of Baltic Sea Region trade by country The overall weaknesses in the business environment as well as the specific barriers to trade have held back the economic integration of Northwestern Russia with the rest of the Baltic Sea Region. This is the impression from looking at the direction of trade to and from Russia: The country has the lowest level of trade with other Baltic Sea Region of all countries in the Region. 18 And the importance of exports to other Baltic Sea Region countries has decreased over the last few years, despite the overall gain of Russia in terms of world export market share driven by higher prices for oil and other commodity exports dominating the Russian trade profile. Studies that predict the level of trade based on the geographic distance and the stage of economic development come to the same conclusion: While the trade among other Baltic Sea Region countries is roughly at the level expected, trade with Russia still falls significantly short of the target level. The experience of foreign companies, too, fits into this pattern of large remaining barriers to trade: Most foreign companies invest to serve the growing domestic market or tap into natural resource deposits, not to create a production base for exports to the global markets. While the evidence of the last few years indicates the clear challenges that lie ahead, there is also some recent evidence that shows the potential. St. Petersburg has in 2004 re- 18 It is likely that the assumption of a 10% share of the Northwestern District in total Russian exports is too high. Data from six larger subregions of the District indicates a share of between 5% and 6.2% of national exports, with a positive trend. 61
64 ported an increase of exports by almost 50%. Foreign direct investment inflows were also up by 40%, after declining for a number of years. And Russian companies have started to make more investments in the Baltic countries and Poland. Kaliningrad The Kaliningrad region with its geographic location as a Russian enclave among Baltic Sea Region EU-member countries in many ways exemplifies the so far unfulfilled potential of Russia s role in the Region. Already in 1991 the Free Economic Zone Yantar (Amber) was established to attract investment to Kaliningrad. Five years later the Federal Law on the Special Economic Zone was adopted. The Law exempted operations located in Kaliningrad from import tariffs, custom duties, and VAT, creating a significant cost advantage relative to other parts of Russia. The ambition was for Kaliningrad to become dynamic, export-driven economy, a Singapore of the Baltic. Reality has been different. There was more success than is sometimes realized: In the aftermath of the Russian crisis in 1998 economic growth has consistently been above the Russian average. However, growth was driven mainly by exports to Russia, not to the global markets. Companies, many of them Russian, imported foreign goods for assembly in Kaliningrad and shipped them on to Russia. Exports to locations other than Russia remained flat. Confusion about the legal status of the Special Economic Zones given conflicting rules at different geographic levels within Russia were one reason, together with concerns that the Special Economic Zone would need to be scrapped as part of Russia s WTO accession. A relatively weak local business environment was the other, in the longterm more important reason: Preferential trade and tax rules create private incentives to relocate economic activity but they do not improve competitiveness in terms of raising the level of productivity and innovation companies can achieve at the location. A parallel strategy for upgrading the business environment is critical to enable Kaliningrad to take advantage of the short-term opportunity that the Special Economic Zone status provides. Conclusion: Proposal for Action Russia wants to be treated as a part of the Region, not a partner. This will be successful, if focus is put on joint projects that create immediate value for both parts, not on lecturing the Russian side about necessary changes in their business environment. Those changes are clearly the most important drivers for higher prosperity and economic performance in Russia s Northwestern District. But Russia will have to and want to make the necessary domestic reforms based on its own decisions, most of which will be taken at the Federal level. We recommend to focus on the following three types of activities: First, the Russian side should be invited to participate in all projects that are going on in the Baltic Sea Region. Even though financial or administrative reasons might not allow them to participate in all, it is important to signal that Russia is a welcome part of the Region. Second, in a bottom-up approach projects should be identified and supported that are likely to generate direct value. Examples are joint projects in specific clusters, for example pulp & paper, and in specific activities, for example efforts to link the research and development capabilities in St. Petersburg with companies in other parts of the Baltic Sea Region. Third, explore the interest in setting up company networks that could together offer international investors the tools to enter the Russian market, based on established logistical networks, sales channels, as well as headquarter and finance functions in other parts of the Baltic Sea Region. 62
65 Positioning the Baltic Sea Region: At home, in Brussels, and globally The Baltic Sea Region needs to become visible to achieve impact; activities alone are not enough but need to be communicated and put in a broader context We recommend activities to provide a central information platform about on-going regional cooperation efforts, to establish a single voice in EU institutions, and to add a coordinated regional approach to national FDI attraction and Over time, these individual activities could become the nuclei of a broader Baltic Sea Region branding effort The Baltic Sea Region can not rely solely on the specific action areas discussed so far to upgrade its competitiveness it also needs to change the way it is perceived at home and abroad. Only then will the Region be able to benefit from fundamental changes in the behavior of decision makers in governments and companies. The more results regional cooperation for competitiveness can deliver, the easier it will be to achieve these changes in perception and behavior. A change in the behavior of decision makers will happen if they are getting informed about the positive things in the Baltic Sea Region and if they receive this information in a positive context that motivates them to act. The first challenge is to provide accurate, relevant, and up-date information about the Baltic Sea Region for different constituencies. The task is to help these audiences to rationally understand the Region. The second challenge is to work towards creating a positive and distinguishable brand image for the Region that communicates an overarching direction across the dimensions that matter for different constituencies. The task is to allow these audiences to also emotionally connect to the Region, creating a more positive context in which they can process the factual information. We discuss the need for positioning in three different contexts: the co-ordination across the many cross-regional efforts already under way, the co-ordination of policy positions taken by Baltic Sea Region countries in the European Union, and the co-ordination of efforts to attract foreign direct investment to the Region, one of the core examples of where concrete cooperation is helping to shape the international positioning of the Region. Coordinating Baltic Sea Region co-operation Last year s STATE OF THE REGION- REPORT noted the large number of organizations, networks, and individual projects working on regional cooperation across the Baltic Sea Region that have developed since the early 1990s. This institutional capacity is a clear strength of the Region. It does, however, also pose the clear challenge of how to ensure that these largely independent activities are mutually supportive instead of creating duplication and confusion. For the first decade of Baltic Sea Region cooperation the strategic goal of helping the former communist countries in the Region to become fully integrated market economies and democracies provided a clear strategic direction across all efforts. Now, however, it is for many much less obvious what the new strategic goal of regional cooperation will be. The danger is that regional cooperation will loose direction, effectiveness, and ultimately political support. The first task is to provide the institutions engaged in cross-regional activities with upto-date information on the efforts underway or planned by others. Technology can play an important role in offering access to this information. The secretariat of the Council of Baltic Sea States (CBSS) has recently launched a new web site that is intended to aggregate infor- 63

66 mation about Baltic Sea Region cooperation efforts. But technology alone will most likely not be enough: The discussion of individual action plans needs to become a task for all institutions working on Baltic Sea Region co-operation. The second task is to provide institutions with a sense of overall strategic direction for Baltic Sea Region co-operation in the post EU-accession era. Such strategic direction can help ensure that individual efforts add up to progress towards a common goal, even if there is no direct co-ordination or joint decision making. The work in the BALTIC SEA INITIATIVE (see section B introduction) is intended to be the first step towards creating a forum to discuss such an overarching strategic direction. Figure 41: The BalticSea.net web site We recommend to continue the development of a joint information platform for cooperation efforts in the Baltic Sea Region and to organize an annual workshop for institutions active in regional projects to inform each other about their work, agree on joint activities, and ultimately create a consensus about an overall strategy for the Region. The Baltic Sea Region in EU institutions Decisions by EU institutions have a major impact on the competitiveness of the Baltic Sea Region. Making sure that these decisions are informed by the experience of the Baltic Sea Region and take account of its needs is an important task for politicians from the Region. The heterogeneous nature of the Region significantly complicates this task: Three countries (ICELAND, NORWAY, and RUSSIA) are not members of the European Union and two countries (GERMANY and POLAND) are represented in key EU institutions by national governments that have to pursue a much broader agenda than that of its subnational regions neighboring the Baltic Sea. 64

67 The first task is to create visibility within EU institutions for the Baltic Sea Region and its efforts on cross-regional co-operation. There is clear interest in the EU Parliament and there are more opportunities in other EU bodies as well. The strong position of the Baltic Sea Region with regards to the Lisbon Agenda (see section A) provides a clear opportunity to leverage the Region s experience in the EU decision process. The second task is to define which positions EU member countries from the Baltic Sea Region want to pursue jointly. The BALTIC SEA INITIATIVE again can hopefully provide valuable input into this discussion. There is a sense that so far the objective of communicating the economic strength of the Region has been limited to be recognized by other EU members as a good performer; there was no clear political agenda attached in terms of specific decisions that the Baltic Sea Region is asking the EU institutions to take. Figure 42: The Baltic Sea Region in EU institutions We recommend to analyze in more detail the impact that EU policies, including structural funds and other instruments, have on Baltic Sea Region competitiveness and to start a dialogue among governments of EU members in the Region about their willingness to influence EU decisions in specific policy areas through joint Baltic Sea Region initiatives. Attracting FDI to the Baltic Sea Region The Baltic Sea Region has traditionally a high stock of foreign-owned companies relative to peer countries but the trends in FDI flows reported in section A indicate that there is no room for complacency. Positioning the Baltic Sea Region as an attractive location for international investors is a critical test for regional cooperation. Raising the level of FDI into the Region would both be an indication of and a contribution to high competitiveness. But FDI attraction is also a very competitive market that puts the national and subnational investment attraction agencies in the Region directly against each other. The work within BALTIC INVESTMENT PROMOTION AGENCIES (BIPA) is an encouraging sign of the will to do meet this test. 65
68 The first task is to strike a balance between cooperation and competition that is acceptable for participating investment attraction agencies in the Baltic Region. A feasible option could be for all agencies to add the Baltic Sea Region dimension to the arguments for their respective location, not put the Baltic Sea Region ahead of national or subnational locations. Each location would become a window to the Baltic Sea Region with easy access to all of its competitive capabilities and assets in addition to providing its individual profile. Competition would remain in place but all locations in the Region would have access to an additional argument versus competitors elsewhere. The second task is to define specifically what characteristics of the Baltic Sea Region should be promoted and strengthened. The STATE OF THE REGION-REPORT and more broadly the BALTIC SEA INITIATIVE are intended to provide input to this discussion as well. We recommend for the BIPA member organizations to cooperate on the general marketing of the Region, launch joint efforts in specific clusters with a presence across the Region (see section B cluster development), and continue their involvement in regional efforts to upgrade the competitiveness of the Region. The work done by BIPA is a perfect example of the type of activities that can define and develop the positioning of the Baltic Sea Region in the world economy. Other efforts are already under way, for example in tourism (see the activities of the Baltic Sea Tourism Commission) or have been discussed elsewhere in this Report, for example in the area of research and education. Creating of a Baltic Sea Region brand The individual activities focused on actors engaged in regional efforts in the Region, on policy makers in Brussels, and on foreign investors from outside the Region could over time become the nuclei of a Baltic Sea Region brand. Such a brand would have clear advantages by increasing the effectiveness of individual messages for specific audiences. But the challenges for shaping such a Baltic Sea Region brand are, at least in the short run, formidable: The Region s name is confused with subregions or entirely other regions; the heterogeneity across the Region, a major theme of last year s STATE OF THE REGION-REPORT, limits the set of shared attributes, and with the established notions of the Nordic countries and the Baltic countries there are strong contenders for dominating brand carriers, even among cross-national regions. These short-term challenges should not become an excuse for not thinking about the content of the Baltic Sea Region brand. Such an exercise would be valuable for institutions and individuals active in regional cooperation to start developing a shared understanding what they and their colleagues associate with the term Baltic Sea Region. 66
69 Outlook: The State of the Region in 2006 The next twelve months will pose a critical test to the Baltic Sea Region s willingness and ability to mount an effective cross-national campaign to enhance competitiveness and innovation. This year s STATE OF THE REGION-REPORT has laid out the foundations of an action agenda that could be at the core of such a campaign. The challenge will now be for political and business leaders to take the decision to purse this agenda and create an organizational structure able to turn ideas into concrete activities that together can develop a consistent overall positioning of the Region in the world economy. Economically, the Region needs to avoid getting stuck in what is still a generally weak macroeconomic climate. International organizations like the IMF see economic growth globally on track after a period of weakness in the first half of But the rise in oil prices has significantly increased the level of overall risk in the world economy. In the Baltic Sea Region growth is expected to slow down in 2005 with a slightly better but also uncertain outlook for While a macroeconomic crisis does not seem to be on the horizon, the overall economic climate will still provide only limit help in moving the Region forward. Politically, the Region is facing significant challenges as well. Recent elections have delivered new governments in Norway and Poland and a complicated political situation in Germany. Swedes will be going to the polls next year and the election campaign is already getting under way. National elections, even more when they lead to a change in government, tend to lead to a more inward-focused policy agenda. In this context it will require exceptional energy to sustain political support for meaningful cross-national cooperation in the Baltic Sea Region. The economic and political context the Baltic Sea Region is facing includes many challenges. But these challenges also provide clear opportunities: The economic slow-down is a reminder that the strong growth we have gotten accustomed to in the Baltic Sea Region will not automatically continue; it will need to be earned anew every year and regional cooperation can help doing just that. The political changes are an indication that cross-regional cooperation cannot be based on political decisions alone; it will require the strong engagement of many leaders from business and other institutions, for example from the research community, with a planning horizon beyond the next electoral cycle. The Baltic Sea Region has already come a long way in organizing effective cross-regional cooperation; there are few regions around the globe that come even close to what has been achieved. Based on these foundations the Region is well placed to overcome the challenges it is facing and realize the significant opportunities laid out in this Report. 67
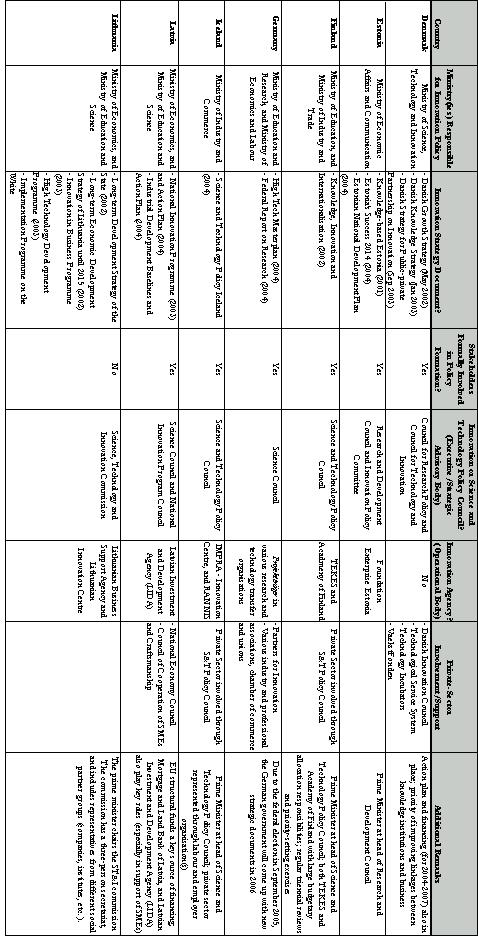
70
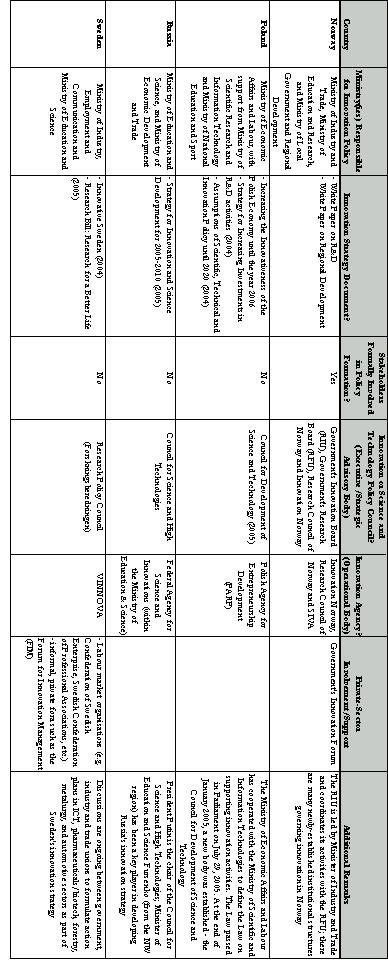
71
72 Figures Figure 1: Growth of real gross domestic product (GDP), Baltic Sea Region countries 9 Figure 2: Prosperity, selected countries and regions 10 Figure 3: Prosperity drivers, selected countries and regions 11 Figure 4: Prosperity, EU-25 NUTS-2 subregions 12 Figure 5: World export market shares, selected European regions 13 Figure 6: FDI inflows, selected world regions 14 Figure 7: GCR Business competitiveness ranking, selected European regions 16 Figure 8: GCR Business competitiveness over time, selected countries 17 Figure 10: GCR Company Sophistication ranking, selected European regions 19 Figure 11: The 2005 Baltic Sea Region diamond 20 Figure 12: GCR Education ranking, selected European regions 21 Figure 13: Educational attainment, EU-15 NUTS-2 subregions 22 Figure 14: GCR Administrative Capacity ranking, selected European regions 23 Figure 15: Government efficiency, selected countries 23 Figure 16: GCR Context for Strategy and Rivalry ranking, selected European regions 24 Figure 17: Innovative capacity, selected countries and regions 26 Figure 18: R&D spending, selected countries and regions 27 Figure 19: Innovative performance, selected countries and regions 28 Figure 20: Publications and patenting relative to R&D expenditure, selected countries 29 Figure 21: Publications and patenting, selected countries 30 Figure 22: R&D spending, EU-25 NUTS-2 subregions 30 Figure 23: Patenting applications, EU-25 NUTS-2 subregions 31 Figure 24: European Summary Innovation Index, selected countries 31 Figure 25: Lisbon Agenda performance, selected European regions 37 Figure 26: Lisbon Agenda overall performance over time, European countries 38 Figure 27: Transposition of Lisbon Agenda EU-directives, European countries 39 Figure 28: Action priorities for co-operation in the Baltic Sea Region 42 Figure 29: World export market share by cluster, Baltic Sea Region 44 Figure 30: Share of exports by cluster from countries with RCA > 1, Baltic Sea Region 45 Figure 31: GCR Related and Supporting Industries, selected European regions 47 Figure 32: Selected cluster initiatives in Life Sciences, Baltic Sea Region 48 Figure 33: Student flows within and outside the Baltic Sea Region 50 Figure 34: Rates of entrepreneurship, selected countries 55 Figure 35: Entrepreneurship attitudes, European countries 55 Figure 36: Barriers to entrepreneurship labor market flexibility, selected countries 56 Figure 37: Barriers to entrepreneurship taxation, selected countries 57 Figure 38: Prosperity over time, Russian regions 59 Figure 39: Innovative capacity, Russian regions 60 Figure 40: Trade integration within the Baltic Sea Region 61 Figure 41: BalticSea.net website 64 Figure 42: The Baltic Sea Region in EU institutions 65 70
73 Tables Table 1: Location of company headquarters, European regions 15 Table 2: Selected innovation indicators, selected countries 32 Table 3: Indicators of convergence in innovative capacity, selected countries 33 Table 4: Lisbon Agenda-indicators 36 Table 5: 3 STAR cluster in the Baltic Sea Region 46 Table 6: GCR Related and Supporting Industries ranking, selected countries 47 Table 7: Number of students from the Baltic Sea Region studying abroad 51 Table 8: International co-publications in science, Baltic Sea Region countries 52 Table A-1: Innovation Governance and Policy Formulation in the Northern 68 Dimension, Summary 71
74 Key Sources Doing Business, World Bank, Washington DC: 2005 Global Competitiveness Report, World Economic Forum, Geneva: 2005 Governance & Anti-Corruption, World Bank, Washington DC: 2005 Information Technology Indicators, ITU, Geneva: 2005 Innovation Scoreboard, European Commission, Brussels: 2004 Institute for Strategy and Competitiveness, Harvard Business School, Boston: 2005 International Trade Statistics, WTO, Geneva: 2005 Key Figures on Science, Technology and Innovation, European Commission, DG Research, Brussels: 2005 Knowledge Assessment Methodology, World Bank, Washington DC: 2005 Patent Database, OECD, Paris: 2005 Research and Development in the EU, Eurostat news release, Luxembourg: 2005 Science and Technology Indicators, UNESCO, Paris: 2005 Structural Indicators, Eurostat, Brussels: 2005 Thomson ISI Database, Thomson Scientific, Philadelphia: 2005 Total Economy Database, Groningen Growth and Development, Groningen: 2005 World Investment Report, Unctad, Geneva: 2004 Further Reading Business Clusters, OECD, 2005 Competitiveness Assessment of Kaliningrad, SSE Stockholm, 2004 Entrepreneurship Index, Danish Ministry of Industry and Labor, 2004 EU Enlargement, SITE, 2003 Global Entrepreneurship Monitor, GEM Network, 2005 Kooperation im Ostseeraum (in German), Universität Rostock, 2005 Micro-Policies for Growth and Productivity, OECD, 2005 Towards An Entrepreneurship Policy, Nordic Innovation Center, 2003 The Baltic Sea Region: A dynamic third of Europe, City of Turku, 2004 The Baltic Sea Region Yesterday, Today, and Tomorrow, Nordregio, 2000 The Cluster Initiative Greenbook, Ivory Tower,
75 About the authors Dr. Christian Ketels is a member of the faculty at Harvard Business School and Principal Associate at Professor Michael E. Porter s Institute for Strategy and Competitiveness. He holds a PhD (Econ) from the London School of Economics and further degrees in economics from the Kiel Institute for World Economics (IfW) and the University of Cologne. He is also a Senior Research Fellow at the Center for Strategy and Competitiveness at the Stockholm School of Economics. Dr. Ketels serves as the Executive Director of the foundation Clusters and Competitiveness, a not-for-profit organization located in Barcelona, Spain and is member of a number of policy advisory groups in Europe and the Americas. He has led many initiatives and research projects on competitiveness issues, has written widely on economic policy issues, and has been a speaker at events in Europe, the United States, and Asia on country competitiveness and company strategy. Dr. Örjan Sölvell is Professor of International Business at the Stockholm School of Economics, Institute of International Business (IIB), and Dean of the Stockholm School of Economics MBA Program. He is also a Senior Institute Associate at the Institute of Strategy and Competitiveness at Harvard Business School. Dr Sölvell has published extensively in the areas of Clusters, Competitiveness and Multinational corporations. The concept of clusters and the diamond model was launched in Sweden in 1991 through Advantage Sweden (Norstedts) written together with Michael E. Porter and Ivo Zander. Recent publications include Microcompetitiveness of Wireless Valley, published with Michael E Porter and Ivo Zander (Invest in Sweden Agency, ISA, 2000), and kluster.se (SNS 2001). In 1987, Dr Sölvell cofounded the consulting group Ivory Tower. 73

76 Tekes Kyllikinportti 2, PL 69, SF Helsinki Finland Phone Fax tekes@tekes.fi VINNOVA - Swedish Agency for InnoVation Systems SE Stockholm Sweden Offi ce: Mäster Samuelsgatan 56 Phone: Fax VINNOVA@VINNOVA.se
STATE OF THE REGION REPORT An Assessment of Competitiveness in the Baltic Sea Region. Dr. Christian Ketels and Professor Örjan Sölvell
 STATE OF THE REGION REPORT 2004 An Assessment of Competitiveness in the Dr. Christian Ketels and Professor Örjan Sölvell The State of the Region Report 2004 An Assessment of Competitiveness in the Prepared
HIGHLIGHTS. There is a clear trend in the OECD area towards. which is reflected in the economic and innovative performance of certain OECD countries.
 HIGHLIGHTS The ability to create, distribute and exploit knowledge is increasingly central to competitive advantage, wealth creation and better standards of living. The STI Scoreboard 2001 presents the
ARTICLES. European Union: Innovation Activity and Competitiveness. Realities and Perspectives
 ARTICLES European Union: Innovation Activity and Competitiveness. Realities and Perspectives ECATERINA STǍNCULESCU Ph.D., Institute for World Economy Romanian Academy, Bucharest ROMANIA estanculescu@yahoo.com
Cii Crisis Impact on Regions Recovery Prospects in G 7. Prospects for World Trade. Competitiveness What Next?
 Crisis i Without t a Sense of Crisis i GlobalCrisis Crisis, Recovery and Finnish Regions Dan Steinbock Research Director of International Business India, China and America Institute dsteinbock@gmail.com
The Competitiveness Institute 9 th Annual Global Conference, Lyon. BSR InnoNet Baltic Sea Region Innovation Network
 The Competitiveness Institute 9 th Annual Global Conference, Lyon BSR InnoNet Baltic Sea Region Innovation Network www.proinno.net Real GDP, PPP-adjusted, 1993 = 100 180% Real GDP Development Over Time
Economic Growth, Foreign Investments and Economic Freedom: A Case of Transition Economy Kaja Lutsoja
 Economic Growth, Foreign Investments and Economic Freedom: A Case of Transition Economy Kaja Lutsoja Tallinn School of Economics and Business Administration of Tallinn University of Technology The main
Miracle of Estonia Entrepreneurship and Competitiveness Policy in Estonia
 Miracle of Estonia Entrepreneurship and Competitiveness Policy in Estonia Signe Ratso Deputy Secretary General of EU and International Co-operation Ministry of Economic Affairs and Communications of Estonia
European Parliament Eurobarometer (EB79.5) ONE YEAR TO GO UNTIL THE 2014 EUROPEAN ELECTIONS Institutional Part ANALYTICAL OVERVIEW
 ONE YEAR TO GO UNTIL THE 2014 EUROPEAN ELECTIONS Institutional Part ANALYTICAL OVERVIEW") Directorate-General for Communication Public Opinion Monitoring Unit Brussels, 21 August 2013. European Parliament Eurobarometer (EB79.5) ONE YEAR TO GO UNTIL THE 2014 EUROPEAN ELECTIONS Institutional
Directorate-General for Communication Public Opinion Monitoring Unit Brussels, 21 August 2013. European Parliament Eurobarometer (EB79.5) ONE YEAR TO GO UNTIL THE 2014 EUROPEAN ELECTIONS Institutional
Gender pay gap in public services: an initial report
 Introduction This report 1 examines the gender pay gap, the difference between what men and women earn, in public services. Drawing on figures from both Eurostat, the statistical office of the European
DELOCALISATION OF PRODUCTION: THREATS AND OPPORTUNITIES FOR ESTONIA Abstract
 DELOCALISATION OF PRODUCTION: THREATS AND OPPORTUNITIES FOR ESTONIA Abstract Prof. Dr. Kaarel Kilvits Professor and Director of School of Economics and Business, Department of Public Economy, Tallinn University
International investment resumes retreat
 FDI IN FIGURES October 213 International investment resumes retreat 213 FDI flows fall back to crisis levels Preliminary data for 213 show that global FDI activity declined by 28% (to USD 256 billion)
Letter prices in Europe. Up-to-date international letter price survey. March th edition
 Letter prices in Europe Up-to-date international letter price survey. March 2014 13th edition 1 Summary This is the thirteenth time Deutsche Post has carried out a study, drawing a comparison between letter
Appendix The Nordic Growth Entrepreneurship Review 2012
 NORDIC INNOVATION REPORT 2012:25 // DECEMBER 2012 Appendix The Nordic Growth Entrepreneurship Review 2012 Final report The Nordic Growth Entrepreneurship Review 2012 Final report Authors: Glenda Napier
Context Indicator 17: Population density
 3.2. Socio-economic situation of rural areas 3.2.1. Predominantly rural regions are more densely populated in the EU-N12 than in the EU-15 Context Indicator 17: Population density In 2011, predominantly
The United Kingdom in the European context top-line reflections from the European Social Survey
 The United Kingdom in the European context top-line reflections from the European Social Survey Rory Fitzgerald and Elissa Sibley 1 With the forthcoming referendum on Britain s membership of the European
Andrew Wyckoff, OECD ITIF Innovation Forum Washington, DC 21 July 2010
 OECD s Innovation Strategy: Getting a Head Start on Tomorrow Andrew Wyckoff, OECD ITIF Innovation Forum Washington, DC 21 July 2010 www.oecd.org/innovation/strategy 1 Overview What is OECD s Innovation
GDP Per Capita. Constant 2000 US$
 GDP Per Capita Constant 2000 US$ Country US$ Japan 38,609 United States 36,655 United Kingdom 26,363 Canada 24,688 Germany 23,705 France 23,432 Mexico 5,968 Russian Federation 2,286 China 1,323 India 538
Knowledge-based Estonia. Kristi Hakkaja Secretariat of Estonian R&D Council
 Knowledge-based Estonia Kristi Hakkaja Secretariat of Estonian R&D Council 1 General data about Estonia Population: less than 1.4 million GDP (2002): 6.5 billion USD GDP per capita (2002): 4785 USD GDP
Fieldwork: January 2007 Report: April 2007
 Flash Eurobarometer European Commission Entrepreneurship Survey of the EU ( Member States), United States, Iceland and Norway Summary Fieldwork: January 00 Report: April 00 Flash Eurobarometer The Gallup
Options for Romanian and Bulgarian migrants in 2014
 Briefing Paper 4.27 www.migrationwatchuk.com Summary 1. The UK, Germany, France and the Netherlands are the four major countries opening their labour markets in January 2014. All four are likely to be
Comparative Economic Geography
 Comparative Economic Geography 1 WORLD POPULATION gross world product (GWP) The GWP Global GDP In 2012: GWP totalled approximately US $83.12 trillion in terms of PPP while the per capita GWP was approx.
Ilze JUREVIČA Ministry of Environmental Protection and Regional Development Regional Policy Department
 Role of small and medium sized urban areas in territorial development: Latvian experience and plans for the upcoming Latvian presidency of the Council of the EU Ilze JUREVIČA Ministry of Environmental
WEF GLOBAL COMPETITIVENESS REPORT: GEORGIA
 2011-2012 WEF GLOBAL COMPETITIVENESS REPORT: GEORGIA FINAL Tuesday, July 03, 2012 This publication was produced for review by the United States Agency for International Development. It was prepared by
BELARUS. INTERNATIONAL RATINGS
 BELARUS. INTERNATIONAL RATINGS June 2016 In May 2016 the Fitch Ratings report The Republic of Belarus 2016: review of the macroeconomic situation and the banking sector was presented at a conference in
The case of Poland. Michał Górzyński CASE
 Economic transformation and evolution of industrial policy - examples of a highly and less successful policies and main challenges in the context of Lisbon strategy. The case of Poland. Michał Górzyński
Stimulating Investment in the Western Balkans. Ellen Goldstein World Bank Country Director for Southeast Europe
 Stimulating Investment in the Western Balkans Ellen Goldstein World Bank Country Director for Southeast Europe February 24, 2014 Key Messages Location, human capital and labor costs make investing in the
Bahrain Telecom Pricing International Benchmarking. December 2018
 Bahrain Telecom Pricing International Benchmarking December 2018 1 CONTENTS OF THIS REPORT Report overview 3 PSTN basket results for GCC countries, including time series 4 Mobile basket results for GCC
Curing Europe s Growing Pains: Which Reforms?
 Curing Europe s Growing Pains: Which Reforms? Luc Everaert Assistant Director European Department International Monetary Fund Brussels, 21 November Copyright rests with the author. All rights reserved.
American International Journal of Contemporary Research Vol. 4 No. 1; January 2014
 Labour Productivity of Transportation Enterprises by Turnover per Person Employed Before and After the Economic Crisis: Economic Crisis Lessons from Europe Dr. Lembo Tanning TTK University of Applied Sciences
EUROPEAN COMMISSION DIRECTORATE-GENERAL FOR AGRICULTURE AND RURAL DEVELOPMENT
 EUROPEAN COMMISSION DIRECTORATE-GENERAL FOR AGRICULTURE AND RURAL DEVELOPMENT Direcrate L. Economic analysis, perspectives and evaluations L.2. Economic analysis of EU agriculture Brussels, 5 NOV. 21 D(21)
CO3.6: Percentage of immigrant children and their educational outcomes
 CO3.6: Percentage of immigrant children and their educational outcomes Definitions and methodology This indicator presents estimates of the proportion of children with immigrant background as well as their
THE NOWADAYS CRISIS IMPACT ON THE ECONOMIC PERFORMANCES OF EU COUNTRIES
 THE NOWADAYS CRISIS IMPACT ON THE ECONOMIC PERFORMANCES OF EU COUNTRIES Laura Diaconu Maxim Abstract The crisis underlines a significant disequilibrium in the economic balance between production and consumption,
Study. Importance of the German Economy for Europe. A vbw study, prepared by Prognos AG Last update: February 2018
 Study Importance of the German Economy for Europe A vbw study, prepared by Prognos AG Last update: February 2018 www.vbw-bayern.de vbw Study February 2018 Preface A strong German economy creates added
The Human Dimension of Globalizing Mid-Caps - as Seen by their Leaders. Welcome to the Flight Deck»
 Welcome to the Flight Deck A Global C-Suite Study The Human Dimension of Globalizing Mid-Caps - as Seen by their Leaders Chapter 6 Becoming the Carrier of Choice A Culture of Innovation Introduction This
EUROBAROMETER 72 PUBLIC OPINION IN THE EUROPEAN UNION
 Standard Eurobarometer European Commission EUROBAROMETER 72 PUBLIC OPINION IN THE EUROPEAN UNION AUTUMN 2009 COUNTRY REPORT SUMMARY Standard Eurobarometer 72 / Autumn 2009 TNS Opinion & Social 09 TNS Opinion
Conference Resolution
 28/08/2018/ Conference Resolution Adopted by the 27 th Baltic Sea Parliamentary Conference (BSPC) The participants, elected representatives from the Baltic Sea Region States*, assembling in Mariehamn,
Standard Note: SN/SG/6077 Last updated: 25 April 2014 Author: Oliver Hawkins Section Social and General Statistics
 Migration Statistics Standard Note: SN/SG/6077 Last updated: 25 April 2014 Author: Oliver Hawkins Section Social and General Statistics The number of people migrating to the UK has been greater than the
UK Productivity Gap: Skills, management and innovation
 UK Productivity Gap: Skills, management and innovation March 2005 Professor John Van Reenen Director, Centre for Economic Performance, LSE 1 1. Overview The Productivity Gap (output per hour) What is it
A GAtewAy to A Bet ter Life Education aspirations around the World September 2013
 A Gateway to a Better Life Education Aspirations Around the World September 2013 Education Is an Investment in the Future RESOLUTE AGREEMENT AROUND THE WORLD ON THE VALUE OF HIGHER EDUCATION HALF OF ALL
7 Economic consequences of Brexit strategy for Hungary
 7 Economic consequences of Brexit strategy for Hungary CERS-HAS and CEPR Potential effects of Brexit on the Hungarian economy Direct trade between Hungary and the UK has been quite modest, which means
Government Online. an international perspective ANNUAL GLOBAL REPORT. Global Report
 Government Online an international perspective ANNUAL GLOBAL REPORT 2002 Australia, Canada, Czech Republic, Denmark, Estonia, Faroe Islands, Finland, France, Germany, Great Britain, Hong Kong, Hungary,
A COMPARISON OF ARIZONA TO NATIONS OF COMPARABLE SIZE
 A COMPARISON OF ARIZONA TO NATIONS OF COMPARABLE SIZE A Report from the Office of the University Economist July 2009 Dennis Hoffman, Ph.D. Professor of Economics, University Economist, and Director, L.
BULGARIA AND ROMANIA IN THE EU: ECONOMIC PROGRESS IN COMPARATIVE PERSPECTIVE
 BULGARIA AND ROMANIA IN THE EU: ECONOMIC PROGRESS IN COMPARATIVE PERSPECTIVE Abstract Rossitsa RANGELOVA, D.Ec.Sc 1 Grigor SARIISKI, PhD 2 Bulgaria and Romania are two neighboring Eastern European countries.
Migrant population of the UK
 BRIEFING PAPER Number CBP8070, 3 August 2017 Migrant population of the UK By Vyara Apostolova & Oliver Hawkins Contents: 1. Who counts as a migrant? 2. Migrant population in the UK 3. Migrant population
The State of Foreign Companies in Denmark
 The State of Foreign Companies in Denmark Consolidated Survey Results the voice of foreign companies October 23, 2008 1 2 Executive Summary This document contains the key findings from two independent
Bulletin. Networking Skills Shortages in EMEA. Networking Labour Market Dynamics. May Analyst: Andrew Milroy
 May 2001 Bulletin Networking Skills Shortages in EMEA Analyst: Andrew Milroy In recent months there have been signs of an economic slowdown in North America and in Western Europe. Additionally, many technology
"Can RDI policies cross borders? The case of Nordic-Baltic region"
 "Can RDI policies cross borders? The case of Nordic-Baltic region" Piret Tõnurist Ragnar Nurkse School of Innovation and Governance Methodology Review of academic work concerning RDI internationalization
Introduction to the European Agency. Cor J.W. Meijer, Director. European Agency for Development in Special Needs Education
 Introduction to the European Agency Cor J.W. Meijer, Director European Agency for Development in Special Needs Education The Agency 17th year of operations 1996 - established as an initiative of the Danish
EUROPEAN ECONOMY VS THE TRAP OF THE EUROPE 2020 STRATEGY
 EUROPEAN ECONOMY VS THE TRAP OF THE EUROPE 2020 STRATEGY Romeo-Victor IONESCU * Abstract: The paper deals to the analysis of Europe 2020 Strategy goals viability under the new global socio-economic context.
Russian Federation. OECD average. Portugal. United States. Estonia. New Zealand. Slovak Republic. Latvia. Poland
 INDICATOR TRANSITION FROM EDUCATION TO WORK: WHERE ARE TODAY S YOUTH? On average across OECD countries, 6 of -19 year-olds are neither employed nor in education or training (NEET), and this percentage
What can we learn from productivity dynamics over the crisis episode in the EU?
 What can we learn from productivity dynamics over the crisis episode in the EU? By Klaus S. Friesenbichler and Christian Glocker Vienna, 02 May 2018 ISSN 2305-2635 Policy Recommendations 1. Macroeconomic
Trends in inequality worldwide (Gini coefficients)
") Section 2 Impact of trade on income inequality As described above, it has been theoretically and empirically proved that the progress of globalization as represented by trade brings benefits in the form
Section 2 Impact of trade on income inequality As described above, it has been theoretically and empirically proved that the progress of globalization as represented by trade brings benefits in the form
A2 Economics. Enlargement Countries and the Euro. tutor2u Supporting Teachers: Inspiring Students. Economics Revision Focus: 2004
 Supporting Teachers: Inspiring Students Economics Revision Focus: 2004 A2 Economics tutor2u (www.tutor2u.net) is the leading free online resource for Economics, Business Studies, ICT and Politics. Don
Objective Indicator 27: Farmers with other gainful activity
 3.5. Diversification and quality of life in rural areas 3.5.1. Roughly one out of three farmers is engaged in gainful activities other than farm work on the holding For most of these farmers, other gainful
Recent trends in the internationalisation of R&D in the enterprise sector. Thomas Hatzichronoglou
 Recent trends in the internationalisation of R&D in the enterprise sector Thomas Hatzichronoglou 1 Introduction 1. Main Forms of internationalisation of industrial R&D 2. Trends in R&D activities by multinationals
STATE OF THE REGION REPORT TM
 STATE OF THE REGION REPORT TM [2006] The Baltic Sea Region Top of Europe in Global Competition Key messages The Baltic Sea Region has been particularly well placed to benefit from globalization but this
EUROBAROMETER 62 PUBLIC OPINION IN THE EUROPEAN UNION
 Standard Eurobarometer European Commission EUROBAROMETER 62 PUBLIC OPINION IN THE EUROPEAN UNION AUTUMN 2004 NATIONAL REPORT Standard Eurobarometer 62 / Autumn 2004 TNS Opinion & Social IRELAND The survey
The Israeli Economy: Current Trends, Strength and Challenges
 The Israeli Economy: Current Trends, Strength and Challenges Dr. Karnit Flug Governor of the Bank of Israel 30.06.2017 1 GDP per capita Growth Rates 8 GDP per capita annual % change (2000-2018F) 6 4 2
Making use of the potential of the Baltic Sea Region. Vesa Vihriälä Economic Council of Finland 23 October 2009
 Making use of the potential of the Baltic Sea Region Vesa Vihriälä Economic Council of Finland 23 October 2009 Economic Council of Finland A forum for policy discussion between the government, central
An introduction to inequality in Europe
 An introduction to inequality in Europe Tackling inequalities in Europe: the role of social investment Disclaimer The findings, interpretations and conclusions expressed here are those of the authors and
EU Innovation strategy
 EU Innovation strategy In principle fine, in particular recognising EU s limited powers Much is left to Member States, but they disappointed in Finland Good points: Links between research and markets Education
STATISTICS BRIEF URBAN PUBLIC TRANSPORT IN THE 21 ST CENTURY
 STATISTICS BRIEF URBAN PUBLIC TRANSPORT IN THE 21 ST CENTURY This Statistics Brief is an abridged version of the extensive report, Urban Public Transport in the 21 st Century, available on the UITP MyLibrary
NATIONAL INTEGRITY SYSTEM ASSESSMENT ROMANIA. Atlantic Ocean. North Sea. Mediterranean Sea. Baltic Sea.
 Atlantic Ocean Baltic Sea North Sea Bay of Biscay NATIONAL INTEGRITY SYSTEM ASSESSMENT ROMANIA Black Sea Mediterranean Sea www.transparency.org.ro With financial support from the Prevention of and Fight
INTERNAL SECURITY. Publication: November 2011
 Special Eurobarometer 371 European Commission INTERNAL SECURITY REPORT Special Eurobarometer 371 / Wave TNS opinion & social Fieldwork: June 2011 Publication: November 2011 This survey has been requested
An Index of Social and Economic Well-being across 32 OECD countries to 2016!
 An Index of Social and Economic Well-being across 32 OECD countries - 2006 to 2016 (including England, Scotland, Wales and Northern Ireland) John McLaren Scottish Trends September 2017 1 Index of Social
Can Russia Compete? Enhancing Productivity and Innovation in a Globalizing World. Raj M. Desai The Brookings Institution
 Can Russia Compete? Enhancing Productivity and Innovation in a Globalizing World Raj M. Desai The Brookings Institution Itzhak Goldberg The World Bank October 15, 2008, The World Bank Outline Introduction
Migration and the European Job Market Rapporto Europa 2016
 Migration and the European Job Market Rapporto Europa 2016 1 Table of content Table of Content Output 11 Employment 11 Europena migration and the job market 63 Box 1. Estimates of VAR system for Labor
Quantitative evidence of post-crisis structural macroeconomic changes
 Quantitative evidence of post-crisis structural macroeconomic changes Roberto Camagni, Roberta Capello, Andrea Caragliu, Barbara Chizzolini Politecnico di Milano To be discussed at the Advisory Board Forum,
Labour market of the new Central and Eastern European member states of the EU in the first decade of membership 125
 Labour market of the new Central and Eastern European member states of the EU in the first decade of membership 125 Annamária Artner Introduction The Central and Eastern European countries that accessed
The Extraordinary Extent of Cultural Consumption in Iceland
 1 Culture and Business Conference in Iceland February 18 2011 Prof. Dr. Ágúst Einarsson Bifröst University PP 1 The Extraordinary Extent of Cultural Consumption in Iceland Prof. Dr. Ágúst Einarsson, Bifröst
It s Time to Begin An Adult Conversation on PISA. CTF Research and Information December 2013
 It s Time to Begin An Adult Conversation on PISA CTF Research and Information December 2013 1 It s Time to Begin an Adult Conversation about PISA Myles Ellis, Acting Deputy Secretary General Another round
ERGP REPORT ON CORE INDICATORS FOR MONITORING THE EUROPEAN POSTAL MARKET
 ERGP (15) 27 Report on core indicators for monitoring the European postal market ERGP REPORT ON CORE INDICATORS FOR MONITORING THE EUROPEAN POSTAL MARKET 3 December 2015 CONTENTS 1. EXECUTIVE SUMMARY...
Central and Eastern European Countries : their progress toward accession to the European Union
 www.asmp.fr - Académie des Sciences morales et politiques Discours de M. Jacques de Larosière en date du 15 octobre 2002 Central and Eastern European Countries : their progress toward accession to the
Bahrain Telecom Pricing International Benchmarking. April 2017
 Bahrain Telecom Pricing International Benchmarking April 2017 Disclaimer This benchmarking report contains information collected by an independent consultant commissioned by the Telecommunications Regulatory
Is this the worst crisis in European public opinion?
 EFFECTS OF THE ECONOMIC AND FINANCIAL CRISIS ON EUROPEAN PUBLIC OPINION Is this the worst crisis in European public opinion? Since 1973, Europeans have held consistently positive views about their country
Challenges to researchers mobility in the Baltic Sea Region
 Challenges to researchers mobility in the Baltic Sea Region Further details on the publication Name of the project Baltic Science Network Affiliation of the project Title of the publication Interreg Baltic
Economics Department. X PLICIT. CEEReport. The Competitiveness of CEE in a Global Context
 CEEReport Economics Department http://economicresearch-e.ba-ca.com X PLICIT The Competitiveness of CEE in a Global Context May 26 Wiener Institut für Internationale Wirtschaftsvergleiche The Vienna Institute
Russia and the EU s need for each other
 SPEECH/08/300 Benita Ferrero-Waldner European Commissioner for External Relations and European Neighbourhood Policy Russia and the EU s need for each other Speech at the European Club, State Duma Moscow,
THE DEVELOPMENT OF ECONOMIES OF THE EUROPEAN UNION MEMBER STATES IN THE PERIOD OF
 THE DEVELOPMENT OF ECONOMIES OF THE EUROPEAN UNION MEMBER STATES IN THE PERIOD OF 2003-2014. Mariusz Rogalski Maria Curie-Sklodowska University, Poland mariusz.rogalski@poczta.umcs.lublin.pl Abstract:
Industrial Relations in Europe 2010 report
 MEMO/11/134 Brussels, 3 March 2011 Industrial Relations in Europe 2010 report What is the 'Industrial Relations in Europe' report? The Industrial Relations in Europe report provides an overview of major
"Science, Research and Innovation Performance of the EU 2018"
 "Science, Research and Innovation Performance of the EU 2018" Innovation, Productivity, Jobs and Inequality ERAC Workshop Brussels, 4 October 2017 DG RTD, Unit A4 Key messages More robust economic growth
OECD ECONOMIC SURVEY OF LITHUANIA 2018 Promoting inclusive growth
 OECD ECONOMIC SURVEY OF LITHUANIA 218 Promoting inclusive growth Vilnius, 5 July 218 http://www.oecd.org/eco/surveys/economic-survey-lithuania.htm @OECDeconomy @OECD 2 21 22 23 24 25 26 27 28 29 21 211
THE ENTREPRENEURISM MEASURE
 1 CONTENTS EXECUTIVE SUMMARY 3 THE ENTREPRENEURISM MEASURE 3 HEADLINE DATA FOR SELECTED COUNTRIES 4 KEY RESULTS 5 Standard of Living 5 Credit and Investment 5 Home Ownership 5 National Support for Entrepreneurship
The statistical regions of Europe as delineated by the United Nations as: Northern, Western,
 Regional Economy Paper: Geography The statistical regions of Europe as delineated by the United Nations as: Northern, Western, Eastern and Southern Europe. Western Europe has a long history of trade, free
European Parliament Elections: Turnout trends,
 European Parliament Elections: Turnout trends, 1979-2009 Standard Note: SN06865 Last updated: 03 April 2014 Author: Section Steven Ayres Social & General Statistics Section As time has passed and the EU
Italian Report / Executive Summary
 EUROBAROMETER SPECIAL BUREAUX (2002) Italian Report / Executive Summary Survey carried out for the European Commission s Representation in ITALY «This document does not reflect the views of the European
Widening of Inequality in Japan: Its Implications
 Widening of Inequality in Japan: Its Implications Jun Saito, Senior Research Fellow Japan Center for Economic Research December 11, 2017 Is inequality widening in Japan? Since the publication of Thomas
Prosperity in Central and Eastern Europe A Legatum Institute Prosperity Report
 Prosperity in Central and Eastern Europe 2016 A Legatum Institute Prosperity Report The Legatum Institute The Legatum Institute is an international think tank and educational charity focused on understanding
Jens Thomsen: The global economy in the years ahead
 Jens Thomsen: The global economy in the years ahead Statement by Mr Jens Thomsen, Governor of the National Bank of Denmark, at the Indo- Danish Business Association, Delhi, 9 October 2007. Introduction
Belgium s foreign trade
 Belgium s FIRST 9 months Belgium s BELGIAN FOREIGN TRADE AFTER THE FIRST 9 MONTHS OF Analysis of the figures for (first 9 months) (Source: eurostat - community concept*) After the first nine months of,
EDUCATION OUTCOMES EXPENDITURE ON EDUCATION INTERNATIONAL STUDENT ASSESSMENT TERTIARY ATTAINMENT
 EDUCATION OUTCOMES INTERNATIONAL STUDENT ASSESSMENT TERTIARY ATTAINMENT EXPENDITURE ON EDUCATION EXPENDITURE ON TERTIARY EDUCATION PUBLIC AND PRIVATE EDUCATION EXPENDITURE EDUCATION OUTCOMES INTERNATIONAL
Eastern Europe: Economic Developments and Outlook. Miroslav Singer
 Eastern Europe: Economic Developments and Outlook Miroslav Singer Governor, Czech National Bank Distinguished Speakers Seminar European Economics & Financial Centre London, 22 July 2014 Miroslav Význam
Looking Through the Crystal Ball: For Growth and Productivity, Can Central Europe be of Service?
 Looking Through the Crystal Ball: For Growth and Productivity, Can Central Europe be of Service? ARUP BANERJI REGIONAL DIRECTOR FOR EUROPEAN UNION MEMBER STATES THE WORLD BANK 6 th Annual NBP Conference
Intellectual Property Rights Intensive Industries and Economic Performance in the European Union
 Intellectual Property Rights Intensive Industries and Economic Performance in the European Union Paul Maier Director, European Observatory on Infringements of Intellectual Property Rights Presentation
Gender, economics and the crisis: lessons from E. Europe, C. Asia and the Caucasus Ewa Ruminska-Zimny, PhD Warsaw School of Economics, Poland
 Gender, economics and the crisis: lessons from E. Europe, C. Asia and the Caucasus Ewa Ruminska-Zimny, PhD Warsaw School of Economics, Poland GEM-IWG Workshop, The Levy Institute, 30 June 2009 Summary
Analysis of EU Member States strengths and weaknesses in the 2016 SMEs scoreboard
 Analysis of EU Member States strengths and weaknesses in the 2016 SMEs scoreboard Analysis based on robust clustering Ghisetti, C. Stano, P. Ferent-Pipas, M. 2018 EUR 28557 EN This publication is a Technical
The EU ETS: From Two Perspectives
 The EU ETS: From Two Perspectives A. Denny Ellerman Massachusetts Institute of Technology EPRI Global Climate Change Research Seminar Washington, D.C. May 20, 2009 The Two Perspectives A Single-state Cap
EU Regulatory Developments
 EU Regulatory Developments Robert Pochmarski Postal and Online Services CERP Plenary, 24/25 May 2012, Beograd/Београд Implementation Market Monitoring Green Paper International Dimension 23/05/2012 Reminder
GDP per capita was lowest in the Czech Republic and the Republic of Korea. For more details, see page 3.
 International Comparisons of GDP per Capita and per Hour, 1960 9 Division of International Labor Comparisons October 21, 2010 Table of Contents Introduction.2 Charts...3 Tables...9 Technical Notes.. 18
Executive summary. Strong records of economic growth in the Asia-Pacific region have benefited many workers.
 Executive summary Strong records of economic growth in the Asia-Pacific region have benefited many workers. In many ways, these are exciting times for Asia and the Pacific as a region. Dynamic growth and