General Election 2005
|
|
|
- Donald Hall
- 5 years ago
- Views:
Transcription

1 RESEARCH PAPER 05/33 17 MAY 2005 General Election 2005 This paper presents a summary of the results of the United Kingdom General Election held on 5 May It provides an analysis of voting nationally and by country, region, county and constituency. The paper will be republished once full, validated, results are available, including those for the delayed contest in South Staffordshire. Labour won 355 of the 645 seats contested. The Conservatives won 197 seats and the Liberal Democrats 62. Labour polled 35.2% of the vote, the Conservatives 32.3% and the Liberal Democrats 22.1%. Turnout was 61.5%. Further analysis at constituency level will be available in a forthcoming supplement. Results of the 2001 General Election are available in RP 01/54, General Election results, 7 June Further historical election statistics are available in RP 04/61, UK Election Statistics It will be updated once full, validated, results of the 2005 General Election are available. Adam Mellows-Facer, Ross Young and Richard Cracknell SOCIAL AND GENERAL STATISTICS SECTION HOUSE OF COMMONS LIBRARY
2 RESEARCH PAPER 05/33 Recent Library Research Papers include: 05/18 Health and Safety (Directors duties) Bill [Bill 22 of ] /19 The Sexual Offences Act 2003 (Amendment) Bill [Bill 26 of ] /20 The Education Bill [HL] [Bill 77 of ] /21 The Inquiries Bill [HL] [Bill 70 of ] /22 The Smoking in Public Places (Wales) Bill [Bill 23 of ] /23 Unemployment by Constituency, February /24 The Caspian Basin, energy reserves and potential conflicts /25 The Disability Discrimination Bill [HL] [Bill 71 of ] /26 The Public Services Ombudsman (Wales) Bill [HL] [Bill 76 of ] /27 Direct taxes: rates and allowances /28 The Equality Bill [Bill 72 of ] /29 The Middle East Peace Process: prospects after the Palestinian Presidential Elections 05/30 The Quango Debate /31 The International Organisations Bill [HL] [HL Bill 2 of ; HC Bill 69 of ] /32 Unemployment by Constituency, March Research Papers are available as PDF files: to members of the general public on the Parliamentary web site, URL: within Parliament to users of the Parliamentary Intranet, URL: Library Research Papers are compiled for the benefit of Members of Parliament and their personal staff. Authors are available to discuss the contents of these papers with Members and their staff but cannot advise members of the general public. Any comments on Research Papers should be sent to the Research Publications Officer, Room 407, 1 Derby Gate, London, SW1A 2DG or ed to PAPERS@parliament.uk ISSN
3 3 RESEARCH PAPER 05/33
4 RESEARCH PAPER 05/33 Contents I Summary 8 II Analysis of the results 9 A. National and regional summary pages 9 Map: General Election 2005 seat winners 10 Map: General Election 2001 seat winners United Kingdom Great Britain England Wales Scotland Northern Ireland North East North West Yorkshire & The Humber East Midlands West Midlands Eastern London South East South West 26 B. Party summary pages Conservative 28 Map: Share of the vote: Conservative 29 Map: Change in share of the vote, : Conservative Labour 31 Map: Share of the vote: Labour 32 Map: Change in share of the vote, : Labour Liberal Democrats 34 Map: Share of the vote: Liberal Democrat 35 Map: Change in share of the vote, : Liberal Democrat Plaid Cymru Scottish National Party 37 Map: Share of the vote: Plaid Cymru 38 4
5 RESEARCH PAPER 05/33 Map: Share of the vote: Scottish National Party Democratic Unionist Party Sinn Féin 40 Map: Share of the vote: Democratic Unionist Party 41 Map: Share of the vote: Sinn Féin Social Democratic & Labour Party Ulster Unionist 42 Map: Share of the vote: Social Democratic & Labour Party 43 Map: Share of the vote: Ulster Unionist Party British National Party Green Party Scottish Socialist Party Socialist Labour Party UK Independence Party Respect the Unity Coalition Veritas 46 C. Seats changing hands Great Britain Northern Ireland 50 D. The electorate and turnout The electorate Turnout Map: turnout 54 E. Borough and county constituencies 55 F. Changes in share by 2001 placings and result 56 G. Candidates Candidates by party and sex Candidates by party and finishing position by country 58 H. Who voted for which party? 59 I. Analysis by constituency characteristics 61 J. Characteristics of MPs elected 64 K. Miscellany Records 65 5
6 RESEARCH PAPER 05/33 2. Family ties Political connections 65 L. MPs who did not stand for re-election 66 M. Incumbent MPs who were defeated 68 III Reference Tables 70 A. National tables United Kingdom Great Britain England Wales Scotland Northern Ireland 79 B. Summary table for English regions 80 C. County tables Seats won and change in seats won Votes and share of the vote Change in share of the vote, electorate and turnout 84 D. Constituency tables England Wales Scotland Northern Ireland 100 E. Minor party and independent candidates who saved deposits 101 F. Seats by majority and MP Conservative Labour Liberal Democrat Other 117 IV Background to the election 118 A. The campaign Timetable and news events Opinion polls 119 6
7 RESEARCH PAPER 05/33 3. Selected newspaper and magazine editorial comment 123 B. Polling day Local elections The weather Declaration times 126 C. By-elections and changes of allegiance By-elections Changes of party allegiance 128 V Technical notes, sources and abbreviations 129 A. Sources of data 129 B. Electorates and turnout 129 C. New constituency boundaries in Scotland 129 D. By-elections, defections and the Speaker 130 E. South Staffordshire 130 F. Party codes and colours 130 7
8 RESEARCH PAPER 05/33 I Summary A UK General Election was held on 5 May Labour won 355 of the 645 seats contested, a majority of 65 over all the other parties combined. The Conservatives won 197 seats and the Liberal Democrats 62. Labour polled 9.5 million votes. That is equivalent to 35.2% of the total, the lowest share of the vote ever recorded for a winning party at a UK General Election and 5.5% points lower than in It is equivalent to 21.6% of the electorate, again a record low for a winning party. The Conservatives took 8.8 million votes, 32.3% of the total, up 0.6% points on The Liberal Democrats polled 6.0 million votes, 22.1% of the total, up 3.8% points on Compared with the results of the 2001 election, Labour lost 47 seats; the Conservatives made a net gain of 33 seats; the Liberal Democrats, a net gain of 11; and other parties, a net gain of three. These comparisons use notional 2001 results for new boundaries in Scotland. Plaid Cymru s share of the vote fell relative to They won three seats, down one. The SNP share of the vote also fell, but they won six seats, a notional gain of two. The Democratic Unionists won nine of the 18 seats in Northern Ireland, gaining four seats. They polled more votes in Northern Ireland than any other party. Sinn Féin won five seats, up one on The SDLP won three seats, unchanged in net terms, while the Ulster Unionists were left with one seat, down five on their 2001 performance. Four other candidates won seats: George Galloway, for Respect in Bethnal Green & Bow; Peter Law, an independent, in Blaenau Gwent; the Speaker, Michael Martin, in Glasgow North East; and Richard Taylor, for Independent Kidderminster Hospital and Health Concern, in Wyre Forest. Turnout was 61.5%, 2.1% points higher than in Share of the vote by party, UK Share of the seats won by party, UK Others 10.4% LD 9.6% Others 4.8% LD 22.1% LAB 35.2% CON 30.5% LAB 55.0% CON 32.3% 8
9 RESEARCH PAPER 05/33 II Analysis of results A. National and regional summary pages Map: General Election 2005 seat winners 10 Map: General Election 2001 seat winners 11 United Kingdom 12 Great Britain 13 England 14 Wales 15 Scotland 16 Northern Ireland 17 North East 18 North West 19 Yorkshire and The Humber 20 East Midlands 21 West Midlands 22 Eastern 23 London 24 South East 25 South West 26 9
10
11
12 United Kingdom Summary: 2005 and changes Share of the vote: 2005 CON LAB LD Other Total Seats won Change Votes (000s) 8,773 9,548 5,982 2,821 27,124 % vote 32.3% 35.2% 22.1% 10.4% 100% Change +0.6% -5.5% +3.8% +1.0% 0% Candidates ,669 3,552 Deposits lost ,376 1,382 Labour was returned in 355 seats, 65 more seats than the other parties combined, with one seat remaining to be contested. That is 55% of the total number of seats and 47 down on their notional 2001 total. Labour s vote share across the United Kingdom was 35.2%, down 5.5% points compared with This is the lowest ever share of the vote won by a winning party at a UK General Election. Labour s 9.5 million votes is equivalent to 21.6% of the electorate, again a record low for a winning party. The Conservatives won 197 seats, a net gain of 33 seats compared with their notional 2001 total. Their vote share rose 0.6% points to 32.3%. The Liberal Democrats won 62 seats, the highest total for the Party or any Liberal Party since 1923, and an increase of 11 on their notional 2001 position. They won 22.1% of the vote, up 3.8% points. Other parties, independents and the Speaker won 31 seats, up 2. They won 10.4% of the UK vote, up 1.0% points. UK turnout was 61.5%, an increase of 2.1% points compared with Share of the vote by party: Seats won by party: 2001 (notional) % 45% 40% 35% 30% 25% 20% 15% 10% 5% 0% Highest and lowest: Largest % pt increases in % of vote (main parties) Largest % pt falls in % of vote (main parties) 1 Lagan Valley +41.3% 1 Blaenau Gwent -39.7% 2 Brent East +36.9% 2 Lagan Valley -35.0% 3 North Down +8.4% 3 West Tyrone -23.6% Safest seats by majority (% pts) Most marginal seats by majority (% pts) 1 Bootle 63.8% 1 Crawley 0.1% 2 Easington 58.5% 2 Croydon Central 0.2% 3 Liverpool, Walton 57.1% 3 Sittingbourne & Sheppey 0.2% Highest % share of vote Highest % turnout 1 Bootle 75.5% 1 West Tyrone 80.2% 2 Liverpool, Walton 72.8% Lowest % turnout 3 Easington 71.4% 1 Liverpool, Riverside 41.4% Electorate 44,110,782 Turnout 61.5% 12
13 Great Britain Summary: 2005 and changes Share of the vote: 2005 CON LAB LD Other Total Seats won Change Votes (000s) 8,770 9,548 5,982 2,106 26,406 % vote 33.2% 36.2% 22.7% 8.0% 100% Change +0.5% -5.8% +3.8% +1.5% 0% Candidates ,567 3,447 Deposits lost ,346 1,349 Labour won 355 seats In Great Britain, down 47 on their notional 2001 total of 402, and 57% of the total number of seats contested. They won 36.2% of the vote, down 5.8% points on The Conservatives won 197 seats, a net gain of 33 seats compared with their notional 2001 total, comprising 36 gains and 3 losses. Their share of the vote rose fractionally, up 0.5% points to 33.2%. The Liberal Democrats won 62 seats, the highest total for any the Party or its predecessors since This was an increase of 11 on their notional 2001 position, comprising 16 gains and five losses. They won slightly fewer votes than in 1992, but the highest share of the total number of votes, 22.7%, since the Liberal/SDP Alliance in The Party s vote share rose 3.8% points relative to Turnout across Great Britain was 61.3%, an increase of 2.2% points compared with Share of the vote by party: Seats won by party: 2001 (notional) % 45% 40% 35% 30% 25% 20% 15% 10% 5% 0% Highest and lowest: 2005 Largest % pt increases in % of vote (main parties) Largest % pt falls in % of vote (main parties) 1 Brent East +36.9% 1 Blaenau Gwent -39.7% 2 Birmingham, Ladywood +23.3% 2 Birmingham, Sparkbrook & Small Heath -21.4% 3 Birmingham, Hodge Hill +21.4% 3 Poplar & Canning Town -21.1% Safest seats by majority (% pts) Most marginal seats by majority (% pts) 1 Bootle 63.8% 1 Crawley 0.1% 2 Easington 58.5% 2 Croydon Central 0.2% 3 Liverpool, Walton 57.1% 3 Sittingbourne & Sheppey 0.2% Highest % share of vote Highest % turnout 1 Bootle 75.5% 1 West Dorset 76.2% 2 Liverpool, Walton 72.8% Lowest % turnout 3 Easington 71.4% 1 Liverpool, Riverside 41.4% Electorate 43,065,245 Turnout 61.3% 13
14 England Summary: 2005 and changes Share of the vote: 2005 CON LAB LD Other Total Seats won Change Votes (000s) 8,103 8,046 5,198 1,333 22,679 % vote 35.7% 35.5% 22.9% 5.9% 100% Change +0.5% -5.9% +3.5% +1.9% 0% Candidates ,229 2,815 Deposits lost ,109 1,109 The Conservatives polled almost 57,000 more votes than Labour across England. Labour won 286 seats, 54% of the total. They lost 37 seats in England relative to 2001, including 11 in London and seven in the Eastern region. Labour s share of the vote fell by 5.9% points. The Conservatives made a net gain of 29 seats relative to 2001, comprising 32 gains and three losses. Their share of the vote rose by 0.5% points. The Liberal Democrats made a net gain of seven seats in England compared with 2001, comprising 12 gains and five losses. Their share of the vote rose by 3.5% points. Share of the vote by party: % 45% 40% 35% 30% 25% 20% 15% 10% 5% 0% Seats won by party: 1992 (notional) Highest and lowest: 2005 Largest % pt increases in % of vote (main parties) Largest % pt falls in % of vote (main parties) 1 Brent East +36.9% 1 Brent East -24.4% 2 Birmingham, Ladywood +23.3% 2 Birmingham, Sparkbrook & Small Heath -21.4% 3 Birmingham, Hodge Hill +21.4% 3 Poplar & Canning Town -21.1% Safest seats by majority (% pts) Most marginal seats by majority (% pts) 1 Bootle 63.8% 1 Crawley 0.1% 2 Easington 58.5% 2 Croydon Central 0.2% 3 Liverpool, Walton 57.1% 3 Sittingbourne & Sheppey 0.2% Highest % share of vote Highest % turnout 1 Bootle 75.5% 1 West Dorset 76.2% 2 Liverpool, Walton 72.8% Lowest % turnout 3 Easington 71.4% 1 Liverpool, Riverside 41.4% Electorate 36,974,147 Turnout 61.3% 14
15 Wales Summary: 2005 and changes Share of the vote: 2005 CON LAB LD PC Other Total Seats won Change Votes (000s) ,393 % vote 21.4% 42.7% 18.4% 12.6% 5.0% 100% Change +0.4% -5.9% +4.6% -1.7% +2.7% 0% Candidates Deposits lost The Conservatives won three seats in Wales, Clwyd West, Monmouth and Preseli Pembrokeshire. These were all gains from Labour, and followed two consecutive General Elections where they won no seats in Wales. The Liberal Democrats gained Cardiff Central from Labour and Ceredigion from Plaid Cymru. They were second in Wales in terms of seats won and third in terms of votes. Having lost a seat to the Liberal Democrats, Plaid Cymru failed to take Ynys Mon, their top target seat, from Labour, and were left with three seats. Peter Law, previously a Labour Welsh Assembly Member, won Blaenau Gwent from Labour, standing as an independent candidate. Labour lost five seats in Wales overall. However, they are still the largest party in Wales in terms of both seats and votes won. Share of the vote by party: % 50% 40% 30% 20% 10% 0% Seats won by party: 1992 (notional) Highest and lowest: 2005 Largest % pt increases in % of vote (main parties) Largest % pt falls in % of vote (main parties) 1 Cardiff Central +13.1% 1 Blaenau Gwent -39.7% 2 Swansea West +12.4% 2 Ynys Mon -11.5% 3 Swansea East +9.9% 3 Newport East -9.5% Safest seats by majority (% pts) Most marginal seats by majority (% pts) 1 Rhondda 52.1% 1 Clwyd West 0.4% 2 Islwyn 51.0% 2 Ceredigion 0.6% 3 Cynon Valley 49.8% 3 Preseli Pembrokeshire 1.6% Highest % share of vote Highest % turnout 1 Rhondda 68.1% 1 Monmouth 73.3% 2 Cynon Valley 64.1% Lowest % turnout 3 Islwyn 63.8% 1 Swansea East 53.1% Electorate 2,233,467 Turnout 62.4% 15
16 Scotland Summary: 2005 and changes Share of the vote: 2005 CON LAB LD SNP Other Total Seats won Change Votes (000s) ,334 % vote 15.8% 38.9% 22.6% 17.7% 5.0% 100% Change +0.2% -4.4% +6.3% -2.4% +0.3% 0% Candidates Deposits lost The 2005 General Election was contested on new boundaries in Scotland, which now has 59 seats rather than 72 at Westminster. Comparisons with 2001 are on the basis of notional 2001 results. The Liberal Democrats came second in Scotland in terms of seats won and votes. They gained East Dunbartonshire and Inverness, Nairn, Badenoch & Strathspey, which were notionally Labour seats. The SNP gained two notional Labour seats, Dundee East and Na h-eileanan an lar, but their share of the vote fell across Scotland as a whole. The Conservatives won Dumfriesshire, Clydesdale & Tweedale, notionally a seat gained from Labour. Labour lost five seats in Scotland relative to their notional 2001 position, but still hold almost two-thirds of the total. The Speaker won Glasgow North East, unopposed by the Conservatives, Labour or the Liberal Democrats. Share of the vote by party: % 45% 40% 35% 30% 25% 20% 15% 10% 5% 0% Seats won by party: 2001 (notional) Highest and lowest: 2005 Largest % pt increases in % of vote (main parties) Largest % pt falls in % of vote (main parties) 1 East Dunbartonshire +14.8% 1 Dumfries & Galloway -12.9% 2 Ross, Skye & Lochaber +14.4% 2 West Dunbartonshire -11.5% 3 West Dunbartonshire +12.0% 3 Na h-eileanan an Iar -10.5% Safest seats by majority (% pts) Most marginal seats by majority (% pts) 1 Coatbridge, Chryston & Bellshill 50.9% 1 Edinburgh South 0.9% 2 Glasgow South West 44.9% 2 Dundee East 1.0% 3 Ross, Skye & Lochaber 43.8% 3 Ochil & South Perthshire 1.5% Highest % share of vote Highest % turnout 1 Coatbridge, Chryston & Bellshill 62.5% 1 East Dunbartonshire 72.4% 2 Glasgow East 60.7% Lowest % turnout 3 Glasgow South West 60.2% 1 Glasgow Central 44.1% Electorate 3,857,631 Turnout 60.5% 16
17 Northern Ireland Summary: 2005 and changes Share of the vote: 2005 DUP SF SDLP UUP Other Total Seats won Change Votes (000s) % vote 33.7% 24.3% 17.5% 17.8% 6.7% 100% Change +11.2% +2.6% -3.5% -9.0% -1.3% 0% Candidates Deposits lost The Democratic Unionists won nine seats, half of the Northern Ireland total. They gained four seats from the Ulster Unionists: East Antrim, Lagan Valley, South Antrim and Upper Bann. Their share of the vote increased by 11.2% points to 33.7%, and the DUP received more votes than any other party in Northern Ireland for the first time at a General Election. Sinn Fein also increased their share of the vote, and took Newry & Armagh from the SDLP. They came second in Northern Ireland in terms of both seats and votes won, both for the first time at a General Election. The SDLP gained South Belfast from the Ulster Unionists, leaving them unchanged in total seat numbers. Their share of the vote fell and they came fourth in terms of votes received. The Ulster Unionists lost five of their six seats and their vote share fell by 9.0% points. Turnout in Northern Ireland was 68.6%, the highest of all UK regions. Share of the vote by party: Seats won by party: 1992 (notional) % 35% 30% 25% 20% 15% 10% 5% 0% Highest and lowest: 2005 Largest % pt increases in % of vote (main parties) Largest % pt falls in % of vote (main parties) 1 Lagan Valley +41.3% 1 Lagan Valley -35.0% 2 North Down +35.1% 2 West Tyrone -23.6% 3 Fermanagh & South Tyrone +28.8% 3 Belfast South -22.7% Safest seats by majority (% pts) Most marginal seats by majority (% pts) 1 Belfast West 55.9% 1 Belfast South 3.9% 2 North Antrim 39.1% 2 South Antrim 9.1% 3 Strangford 35.2% 3 Fermanagh & South Tyrone 9.4% Highest % share of vote Highest % turnout 1 Belfast West 70.5% 1 West Tyrone 80.2% 2 Strangford 56.5% Lowest % turnout 3 North Antrim 54.8% 1 Strangford 58.1% Electorate 1,045,537 Turnout 68.6% 17
18 North East Cleveland Durham Northumberland Tyne and Wear Summary: 2005 and changes Share of the vote: 2005 CON LAB LD Other Total Seats won Change Votes (000s) ,098 % vote 19.5% 52.9% 23.3% 4.3% 100% Change -1.8% -6.6% +6.7% +1.7% 0% Candidates Deposits lost No seats changed hands in the North East region for the second consecutive General Election. Labour again won 28 of the 30 seats, the Conservatives retained Hexham and the Liberal Democrats retained Berwick-upon-Tweed. Labour won more than half of all votes in the North East, although their share of the vote fell by 6.6% points. The Liberal Democrat share of the vote rose by 6.7% points. They won more votes in the region than the Conservatives. The Conservative share of the vote fell by 1.8% points. Turnout in the region was 57.2%, the lowest of all UK regions. Chris Mullin s victory for Labour in Sunderland South was the first result in the UK to be declared. Share of the vote by party: Seats won by party: 1992 (notional) % 60% 50% 40% 30% 20% 10% 0% Highest and lowest: 2005 Largest % pt increases in % of vote (main parties) Largest % pt falls in % of vote (main parties) 1 Durham, City of +16.1% 1 Newcastle upon Tyne North -10.1% 2 Hartlepool +15.4% 2 Newcastle upon Tyne Central -9.8% 3 Newcastle upon Tyne Central +12.4% 3 Middlesborough -9.8% Safest seats by majority (% pts) Most marginal seats by majority (% pts) 1 Easington 58.5% 1 Durham, City of 7.9% 2 Houghton & Washington East 46.3% 2 Tynemouth 9.7% 3 North Durham 44.9% 3 Newcastle upon Tyne Central 11.1% Highest % share of vote Highest % turnout 1 Easington 71.4% 1 Hexham 72.1% 2 Houghton & Washington East 64.3% Lowest % turnout 3 North Durham 64.1% 1 Tyne Bridge 48.7% Electorate 1,920,378 Turnout 57.2% 18
19 North West Cheshire Cumbria Greater Manchester Lancashire Merseyside Summary: 2005 and changes Share of the vote: 2005 CON LAB LD Other Total Seats won Change Votes (000s) 846 1, ,946 % vote 28.7% 45.1% 21.4% 4.8% 100% Change -0.6% -5.6% +4.6% +1.5% 0% Candidates Deposits lost The Liberal Democrats gained three seats in the North West: Manchester Withington and Rochdale from Labour, and Westmorland & Lonsdale, the seat of the former Conservative Shadow Education Secretary Tim Collins. This was the first post-war General Election in which the Liberal Democrats or predecessor party has won a seat in Manchester. The Conservatives won Lancaster & Wyre from Labour, leaving them net unchanged in terms of numbers of seats. Labour s share of the vote in the region fell by 5.6% points compared to The Conservative vote share also fell. The Liberal Democrats increased their share of the vote by 4.6% points. Labour s Joe Benton won 75.5% of the vote in Bootle, the highest share of the vote for any candidate in the UK. It is also the safest seat in the country in percentage terms. Share of the vote by party: Seats won by party: 1992 (notional) % 50% 40% 30% 20% 10% 0% Highest and lowest: 2005 Largest % pt increases in % of vote (main parties) Largest % pt falls in % of vote (main parties) 1 Manchester, Withington +20.4% 1 Manchester, Withington -14.3% 2 Liverpool Wavertree +13.3% 2 Liverpool, Riverside -13.8% 3 Blackburn +12.5% 3 Blackburn -12.1% Safest seats by majority (% pts) Most marginal seats by majority (% pts) 1 Bootle 63.8% 1 Westmorland & Lonsdale 0.5% 2 Liverpool, Walton 57.1% 2 Rochdale 1.1% 3 Makerfield 51.0% 3 Manchester, Withington 1.8% Highest % share of vote Highest % turnout 1 Bootle 75.5% 1 Westmorland & Lonsdale 71.1% 2 Liverpool, Walton 72.8% Lowest % turnout 3 Knowsley South 68.1% 1 Liverpool, Riverside 41.4% Electorate 5,134,365 Turnout 57.4% 19
20 Yorkshire and The Humber Humberside North Yorkshire South Yorkshire West Yorkshire Summary: 2005 and changes Share of the vote: 2005 CON LAB LD Other Total Seats won Change Votes (000s) ,199 % vote 29.1% 43.6% 20.7% 6.6% 100% Change -1.1% -5.0% +3.5% +2.6% 0% Candidates Deposits lost Labour lost three seats in Yorkshire and The Humber to leave them with 44. The Conservatives gained Scarborough & Whitby and Shipley, the seat of the former minister Chris Leslie, from Labour. The Liberal Democrats gained Leeds North West, also from Labour, which has the highest proportion of full-time students of any constituency in the UK. Labour s share of the vote in the region fell by 5.0% points. The Conservative share of the vote fell by 1.1% points. The Liberal Democrat share of the vote rose sharply in both Bradford North and Bradford West, both of which have large Muslim populations. David Blunkett received the highest share of the constituency vote and highest percentage majority in the region in Sheffield, Brightside. Share of the vote by party: Seats won by party: 1992 (notional) % 50 50% 40% 30% 20% 10% 0% Highest and lowest: 2005 Largest % pt increases in % of vote (main parties) Largest % pt falls in % of vote (main parties) 1 Bradford North +12.5% 1 Ryedale -11.6% 2 Bradford West +11.9% 2 Sheffield Central -11.6% 3 Leeds North West +10.2% 3 Rotherham -11.1% Safest seats by majority (% pts) Most marginal seats by majority (% pts) 1 Sheffield, Brightside 55.4% 1 Shipley 0.9% 2 Pontefract & Castleford 46.3% 2 Selby 0.9% 3 Barnsley Central 44.5% 3 Scarborough & Whitby 2.7% Highest % share of vote Highest % turnout 1 Sheffield, Brightside 68.5% 1 Haltemprice & Howden 69.7% 2 Pontefract & Castleford 63.7% Lowest % turnout 3 Barnsley East & Mexborough 62.9% 1 Kingston upon Hull West & Hessle 45.0% Electorate 3,731,575 Turnout 58.9% 20
21 East Midlands Derbyshire Leicestershire Lincolnshire Northamptonshire Nottinghamshire Summary: 2005 and changes Share of the vote: 2005 CON LAB LD Other Total Seats won Change Votes (000s) ,014 % vote 37.1% 39.0% 18.5% 5.4% 100% Change -0.2% -6.1% +3.1% +3.2% 0% Candidates Deposits lost The Conservatives gained three seats in the East Midlands from Labour: Kettering, Northampton South and Wellingborough. Labour s share of the vote in the East Midlands fell by 6.1% points compared to However, they still polled more votes and won more seats than any other party in the region. The Conservative share of the vote fell slightly. The Liberal Democrat share of the vote in the East Midlands rose by 3.1% points. They retained Chesterfield, the only seat in the region they won in However, Parmjit Singh Gill failed to retain Leicester South, which he won from Labour at a by-election in July 2004, despite increasing the Liberal Democrat share of the vote by 13.4% points relative to UKIP won 9.6% of the vote in Boston & Skegness, their best result in the UK. Share of the vote by party: Seats won by party: 1992 (notional) % 40 50% 40% 30% % 10% 0% Highest and lowest: 2005 Largest % pt increases in % of vote (main parties) Largest % pt falls in % of vote (main parties) 1 Leicester South +13.4% 1 Leicester South -15.4% 2 Derby South +13.0% 2 Nottingham East -13.1% 3 Nottingham East +9.7% 3 Derby South -13.0% Safest seats by majority (% pts) Most marginal seats by majority (% pts) 1 Bolsover 47.6% 1 Wellingborough 1.3% 2 Nottingham North 40.1% 2 High Peak 1.5% 3 Leicester East 38.4% 3 Corby 3.2% Highest % share of vote Highest % turnout 1 Bolsover 65.2% 1 Rushcliffe 70.3% 2 Nottingham North 58.7% Lowest % turnout 3 Leicester East 58.1% 1 Nottingham North 48.9% Electorate 3,218,197 Turnout 62.6% 21
22 West Midlands Hereford and Worcester Shropshire Staffordshire Warwickshire West Midlands Summary: 2005 and changes Share of the vote: 2005 CON LAB LD Other Total Seats won Change Votes (000s) ,398 % vote 34.8% 38.9% 18.6% 7.6% 100% Change -0.1% -5.9% +3.9% +2.1% 0% Candidates Deposits lost The Conservatives made a net gain of three seats in the West Midlands, gaining Shrewsbury & Atcham, The Wrekin and Rugby & Kenilworth from Labour, as well as gaining Ludlow from the Liberal Democrats but losing Solihull to the Liberal Democrats. The Liberal Democrats also won Birmingham, Yardley from Labour to leave them with a net gain of one seat. Labour s share of the vote in West Midlands fell by 5.9% points compared to The Conservative vote share fell fractionally, while the Liberal Democrats increased their share of the vote by 3.9%. Richard Taylor held Wyre Forest for Independent Kidderminster Hospital and Health Concern. The election in South Staffordshire was postponed until 23 June following the death of Jo Harrison, the Liberal Democrat candidate. Share of the vote by party: % 45% 40% 35% 30% 25% 20% 15% 10% 5% 0% Seats won by party: 1992 (notional) Highest and lowest: 2005 Largest % pt increases in % of vote (main parties) Largest % pt falls in % of vote (main parties) 1 Birmingham, Ladywood +23.3% 1 Birmingham, Sparkbrook & Small Heath -21.4% 2 Birmingham, Hodge Hill +21.4% 2 Birmingham, Ladywood -17.0% 3 Solihull +14.0% 3 Birmingham, Hodge Hill -15.2% Safest seats by majority (% pts) Most marginal seats by majority (% pts) 1 Coventry North East 38.2% 1 Warwick & Leamington 0.5% 2 Wolverhampton South East 37.1% 2 Solihull 0.5% 3 Stoke-on-Trent Central 35.0% 3 Stourbridge 1.0% Highest % share of vote Highest % turnout 1 Wolverhampton South East 59.4% 1 Ludlow 71.7% 2 Coventry North East 56.9% Lowest % turnout 3 West Bromwich East 55.6% 1 Birmingham, Ladywood 46.8% Electorate 3,934,873 Turnout 60.9% 22
23 Eastern Bedfordshire Cambridgeshire Essex Hertfordshire Norfolk Suffolk Summary: 2005 and changes Share of the vote: 2005 CON LAB LD Other Total Seats won Change Votes (000s) 1, ,650 % vote 43.3% 29.8% 21.8% 5.0% 100% Change +1.5% -6.9% +4.4% +1.1% 0% Candidates Deposits lost The Conservatives gained six seats in the Eastern region from Labour: Braintree, Harwich, Hemel Hempstead, Peterborough, St Albans and Welwyn Hatfield, the seat of the former Labour minister Melanie Johnson. They are the largest party in the Eastern region, both in terms of vote share and the number of seats won. The Conservative s share of the vote increased by 1.5% points compared to The Liberal Democrats gained Cambridge from Labour. Their share of the vote across the region increased by 4.4% points relative to Labour s share of the vote in the Eastern region fell by 6.9 percentage points. They lost seven of the 20 seats they won in Bill Rammell s victory for Labour in Harlow was the last result in the UK to be declared. Share of the vote by party: Seats won by party: 1992 (notional) % 50% 40% 30% 20% 10% 0% Highest and lowest: 2005 Largest % pt increases in % of vote (main parties) Largest % pt falls in % of vote (main parties) 1 Cambridge +18.9% 1 Luton South -12.5% 2 Brentwood & Ongar +15.5% 2 Castle Point -11.7% 3 Watford +13.8% 3 Watford -11.7% Safest seats by majority (% pts) Most marginal seats by majority (% pts) 1 Epping Forest 32.0% 1 Harlow 0.2% 2 Rayleigh 31.9% 2 Hemel Hempstead 1.1% 3 Broxbourne 28.3% 3 Harwich 1.8% Highest % share of vote Highest % turnout 1 Rayleigh 55.4% 1 North Norfolk 72.5% 2 Broxbourne 53.8% Lowest % turnout 3 Brentwood & Ongar 53.5% 1 Luton South 53.9% Electorate 4,146,513 Turnout 63.9% 23
24 London Summary: 2005 and changes Share of the vote: 2005 CON LAB LD Other Total Seats won Change Votes (000s) 932 1, ,919 % vote 31.9% 38.9% 21.9% 7.3% 100% Change +1.4% -8.4% +4.4% +2.6% 0% Candidates Deposits lost The Conservatives gained eight seats from Labour in London. These included Putney, the first Conservative victory declared, and Enfield, Southgate from the former minister, Stephen Twigg. The Liberal Democrats made two gains from Labour relative to 2001, Brent East, which Sarah Teather first won at a September 2003 by-election, and Hornsey & Wood Green, defeating the former Home Office minister Barbara Roche. George Galloway won Bethnal Green & Bow for Respect from Labour. Labour lost 11 of the 55 London seats they won at the 2001 General Election. Their share of the vote in the capital fell by 8.4% points, their largest regional fall. However, Labour were still the largest party in London in terms of both seats and votes won. Share of the vote by party: Seats won by party: 1992 (notional) % 50% 40% 30% 20% 10% 0% Highest and lowest: 2005 Largest % pt increases in % of vote (main parties) Largest % pt falls in % of vote (main parties) 1 Brent East +36.9% 1 Brent East -24.4% 2 Hornsey & Wood Green +17.6% 2 Poplar & Canning Town -21.1% 3 Ealing, Southall +14.4% 3 East Ham -19.2% Safest seats by majority (% pts) Most marginal seats by majority (% pts) 1 Camberwell & Peckham 46.5% 1 Croydon Central 0.2% 2 Tottenham 41.2% 2 Battersea 0.4% 3 Kensington & Chelsea 39.6% 3 Hornchurch 1.3% Highest % share of vote Highest % turnout 1 Camberwell & Peckham 65.3% 1 Richmond Park 74.4% 2 Romford 59.1% Lowest % turnout 3 Brent South 58.8% 1 Feltham & Heston 46.3% Electorate 5,021,532 Turnout 58.1% 24
25 South East Berkshire Buckinghamshire East Sussex Hampshire Isle of Wight Kent Oxfordshire Surrey West Sussex Summary: 2005 and changes Share of the vote: 2005 CON LAB LD Other Total Seats won Change Votes (000s) 1, ,902 % vote 45.0% 24.4% 25.4% 5.3% 100% Change +2.1% -5.0% +1.7% +1.2% 0% Candidates Deposits lost The Conservatives gained five seats in the South East: Gravesham, Milton Keynes North East and Reading East from Labour, and Guildford and Newbury from the Liberal Democrats. Their share of the vote increased by 2.1% points, their largest regional increase. The Liberal Democrats won more votes in the region than Labour, and increased their vote share by 1.2% points. Labour remained second in the region in terms of seats won, retaining 19. These included Crawley, now the most marginal seat in the country, won by Laura Moffatt with a majority of 37 votes, 0.1% of the total. The Green Party won 21.9% of the vote in Brighton, Pavillion, their best result. The South East has the largest electorate and the highest number of seats of any UK region. Share of the vote by party: % 50% 40% 30% 20% 10% 0% Seats won by party: 1992 (notional) Highest and lowest: 2005 Largest % pt increases in % of vote (main parties) Largest % pt falls in % of vote (main parties) 1 Oxford East +11.1% 1 Brighton, Pavillion -13.3% 2 Isle of Wight +9.2% 2 Oxford East -12.5% 3 Folkestone & Hythe +8.9% 3 Slough -11.0% Safest seats by majority (% pts) Most marginal seats by majority (% pts) 1 Buckingham 37.5% 1 Crawley 0.1% 2 New Forest West 37.5% 2 Sittingbourne & Sheppey 0.2% 3 Beaconsfield 35.0% 3 Romsey 0.2% Highest % share of vote Highest % turnout 1 Buckingham 57.4% 1 Winchester 73.1% 2 New Forest West 56.4% Lowest % turnout 3 East Surrey 56.2% 1 Slough 53.7% Electorate 6,023,650 Turnout 64.8% 25
26 South West Avon Cornwall Devon Dorset Gloucestershire Somerset Wiltshire Summary: 2005 and changes Share of the vote: 2005 CON LAB LD Other Total Seats won Change Votes (000s) ,553 % vote 38.6% 22.8% 32.6% 6.0% 100% Change +0.1% -3.4% +1.4% +2.0% 0% Candidates Deposits lost The Conservatives made a net gain of two seats in the South West, winning Forest of Dean from Labour and Torridge & West Devon and Weston-Super-Mare from the Liberal Democrats, but losing Taunton to the Liberal Democrats. The Conservative share of the vote was almost unchanged. The Liberal Democrats also gained Bristol West and Falmouth & Cambourne from Labour, leaving them with a net gain of one South West seat. They are now second to the Conservatives in terms of seats as well as votes, the only region in England where this is the case. The Liberal Democrat share of the vote rose by 1.4% points relative to 2001, their lowest regional increase. Labour s loss of three seats in the region left them placed third, the only region where this is the case. However, the 3.4% point fall in their share of the vote is their smallest regional fall. Share of the vote by party: % 45% 40% 35% 30% 25% 20% 15% 10% 5% 0% Seats won by party: 1992 (notional) Highest and lowest: 2005 Largest % pt increases in % of vote (main parties) Largest % pt falls in % of vote (main parties) 1 Falmouth & Cambourne +10.4% 1 Plymouth, Devonport -14.0% 2 Bristol West +9.4% 2 South Swindon -11.0% 3 Plymouth, Sutton +8.4% 3 Plymouth, Sutton -10.2% Safest seats by majority (% pts) Most marginal seats by majority (% pts) 1 Christchurch 30.2% 1 Stroud 0.6% 2 Bristol South 26.3% 2 Taunton 1.0% 3 Devizes 23.5% 3 Somerton & Frome 1.5% Highest % share of vote Highest % turnout 1 Christchurch 54.7% 1 West Dorset 76.2% 2 Northavon 52.3% Lowest % turnout 3 Yeovil 51.4% 1 Bournemouth West 53.4% Electorate 3,843,064 Turnout 66.4% 26
27 RESEARCH PAPER 05/33 B. Party summary pages Conservative 28 Map: Share of the vote: Conservative 29 Map: Change in share of the vote, : Conservative 30 Labour 31 Map: Share of the vote: Labour 32 Map: Change in share of the vote, : Labour 33 Liberal Democrat 34 Map: Share of the vote: Liberal Democrat 35 Map: Change in share of the vote, : Liberal Democrat 36 Plaid Cymru 37 Scottish National Party 37 Map: Share of the vote: Plaid Cymru 38 Map: Share of the vote: Scottish National Party 39 Democratic Unionist Party 40 Sinn Féin 40 Map: Share of the vote: Democratic Unionist Party 41 Map: Share of the vote: Sinn Féin 41 Social Democratic & Labour Party 42 Ulster Unionist Party 42 Map: Share of the vote: Social Democratic & Labour Party 43 Map: Share of the vote: Ulster Unionist Party 43 British National Party 44 Green Party 44 Scottish Socialist Party 45 Socialist Labour Party 45 UK Independence Party 46 Respect the Unity Coalition 46 Veritas 46 27

28 Conservative The Conservatives won 197 seats, 31% of the total. That is an increase of 33 on their notional 2001 position, comprising 36 gains and 3 losses. The Conservatives polled 32.3% of the UK vote, an increase of 0.6% points. The Conservative share of the vote fell in the five northernmost regions of England. The Conservatives won more votes in England than any other party. The Conservatives won fewer votes in 2005 than in any post -war election, except % of Conservative seats are in England. The number of Conservative women MPs rose from 14 to 17. They are now 9% of the party total. Two minority ethnic Conservative MPs were elected, Adam Afriyie (Windsor) and Shailesh Vara (NW Cambridgeshire). Summary: 2005 and changes Seats won (a) Votes Number Change 000s % Change UK , % 0.0% +0.6% Great Britain , % +0.5% England , % +0.5% Wales % +0.4% Scotland % +0.2% N Ireland % +0.1% North East % -1.8% North West % -0.6% Yorks & Humb % -1.1% East Midlands % -0.2% West Midlands % -0.1% Eastern , % +1.5% London % +1.4% South East , % +2.1% South West % +0.1% 70% 60% 50% % votes % seats (a) Based on notional 2001 results for new Scottish constituencies, excludes South Staffordshire Trends: UK % 30% 20% 10% 0% Conservative: Highest and lowest: 2005 Votes (millions) % vote 43.9% 42.4% 42.2% 41.9% 30.7% 31.7% 32.3% Seats won % seats won 53.4% 61.1% 57.7% 51.6% 25.0% 25.2% 30.5% Candidates Deposits lost (b) (b) The deposit retention threshold was 12.5% of the vote prior to 1985 and 5% subsequently Safest seats by majority (000s) Safest seats by majority (% pts) 1 Buckingham 18,129 1 Kensington & Chelsea 39.6% 2 Richmond (Yorks) 17,807 2 Richmond (Yorks) 39.4% 3 New Forest West 17,285 3 Buckingham 37.5% Most marginal seats by majority (000s) Most marginal seats by majority (% pts) 1 Croydon Central 75 1 Croydon Central 0.2% 2 Clwyd West Clwyd West 0.4% 3 Guildford Guildford 0.7% Largest increases in % share of vote from 2001 (% pts) Largest falls in % share of vote from 2001 (% pts) 1 Brentwood & Ongar +15.5% 1 Ynys Môn -11.5% 2 Dumfriesshire, Clydesdale & Tweeddale +11.4% 2 Bethnal Green & Bow -10.1% 3 Wyre Forest +9.7% 3 Burnley -10.1% Highest % share of vote Lowest % share of vote (GB only, in seats contested) 1 Richmond (Yorks) 59.1% 1 Blaenau Gwent 2.3% 2 Romford 59.1% 2 Na h-eileanan an Iar 4.4% 3 Kensington & Chelsea 57.9% 3 Rhondda 5.6% 28

29
30

31 Labour Labour won 355 seats in 2005, 55% of the total. That is a fall of 47 relative to their notional 2001 total. Labour polled 35.2% of UK votes, a fall of 5.5% points. Labour s share is lower than in 1979, an election they lost. It is also the lowest share of the vote ever won by the leading party at a UK General Election. Labour won 54% of seats in England, 73% in Wales and 68% in Scotland. Labour s 9.6 million votes was lower than in any post-war election except 1983, when it polled 8.5 million. 98 Labour women MPs were elected, three more than in 2001 and 28% of the party total. 13 minority ethnic Labour MPs were elected, one more than in Summary: 2005 and changes Seats won (a) Votes Number Change 000s % Change UK , % % Great Britain , % -5.8% England , % -5.9% Wales % -5.9% Scotland % -4.4% N Ireland North East % -6.6% North West , % -5.6% Yorks & Humb % -5.0% East Midlands % -6.1% West Midlands % -5.9% Eastern % -6.9% London , % -8.4% South East % -5.0% South West % -3.4% 70% 60% 50% % votes % seats (a) Based on notional 2001 results for new Scottish constituencies, excludes South Staffordshire Trends: UK % 30% 20% 10% 0% Labour: Highest and lowest: 2005 Votes (millions) % vote 36.9% 27.6% 30.8% 34.4% 43.2% 40.7% 35.2% Seats won % seats won 42.2% 32.2% 35.2% 41.6% 63.4% 62.5% 55.2% Candidates Deposits lost (b) (b) The deposit retention threshold was 12.5% of the vote prior to 1985 and 5% subsequently Safest seats by majority (000s) Safest seats by majority (% pts) 1 Coatbridge, Chryston & Bellshill 19,519 1 Bootle 63.8% 2 Easington 18,636 2 Easington 58.5% 3 Sedgefield 18,457 3 Liverpool, Walton 57.1% Most marginal seats by majority (000s) Most marginal seats by majority (% pts) 1 Crawley 37 1 Crawley 0.1% 2 Sittingbourne & Sheppey 79 2 Sittingbourne & Sheppey 0.2% 3 Harlow 97 3 Harlow 0.2% Largest increases in % share of vote from 2001 (% pts) Largest falls in % share of vote from 2001 (% pts) 1 Dumfries & Galloway +8.8% 1 Blaenau Gwent -39.7% 2 Ryedale +6.0% 2 Brent East -24.4% 3 Torbay +5.3% 3 Birmingham, Sparkbrook & Small Heath -21.4% Highest % share of vote Lowest % share of vote (in seats contested) 1 Bootle 75.5% 1 Newbury 5.9% 2 Liverpool, Walton 72.8% 2 Westmorland & Lonsdale 7.6% 3 Easington 71.4% 3 West Dorset 7.7% 31

32
33

34 Liberal Democrats The Liberal Democrats won 62 seats, 10% of the total. That is an increase of 11 on their notional 2001 total, comprising 16 gains and 5 losses. 62 is the highest total for them or their predecessor parties since The Liberal Democrats won 22.1% of the UK vote, their highest since 1987 when the Liberal/SDP Alliance polled 23.1%. They won marginally fewer votes than in The Liberal Democrats were second to Labour in terms of seats won in both Wales and Scotland. The ten women Liberal Democrat MPs elected in 2005 is double that in 2001; 16% of Liberal Democrat MPs are now women. There are no minority ethnic Liberal Democrat MPs. Summary: 2005 and changes Seats won (a) Votes Number Change 000s % Change UK , % % Great Britain , % +3.8% England , % +3.5% Wales % +4.6% Scotland % +6.3% N Ireland North East % +6.7% North West % +4.6% Yorks & Humb % +3.5% East Midlands % +3.1% West Midlands % +3.9% Eastern % +4.4% London % +4.4% South East % +1.7% South West % +1.4% 70% 60% 50% % votes % seats (a) Based on notional 2001 results for new Scottish constituencies, excludes South Staffordshire Trends: UK % 30% 20% 10% 0% Liberal Democrats: Highest and lowest: 2005 Votes (millions) % vote 13.8% 25.4% 22.6% 17.8% 16.8% 18.3% 22.1% Seats won % seats won 1.7% 3.5% 3.4% 3.1% 7.0% 7.9% 9.6% Candidates Deposits lost (b) (b) The deposit retention threshold was 12.5% of the vote prior to 1985 and 5% subsequently Safest seats by majority (000s) Safest seats by majority (% pts) 1 Ross, Skye & Lochaber 14,249 1 Ross, Skye & Lochaber 43.8% 2 Edinburgh West 13,600 2 Orkney & Shetland 37.4% 3 North East Fife 12,571 3 North East Fife 32.6% Most marginal seats by majority (000s) Most marginal seats by majority (% pts) 1 Romsey Romsey 0.2% 2 Ceredigion Solihull 0.5% 3 Westmorland & Lonsdale Westmorland & Lonsdale 0.5% Largest increases in % share of vote from 2001 (% pts) Largest falls in % share of vote from 2001 (% pts) 1 Brent East +36.9% 1 Ryedale -11.6% 2 Birmingham, Ladywood +23.3% 2 North Southwark & Bermondsey -9.9% 3 Birmingham, Hodge Hill +21.4% 3 Torbay -9.6% Highest % share of vote Lowest % share of vote (in seats contested) 1 Ross, Skye & Lochaber 58.7% 1 Blaenau Gwent 4.3% 2 Harrogate & Knaresborough 56.3% 2 Ynys Môn 6.8% 3 North Norfolk 53.4% 3 Hornchurch 7.6% 34
35
36


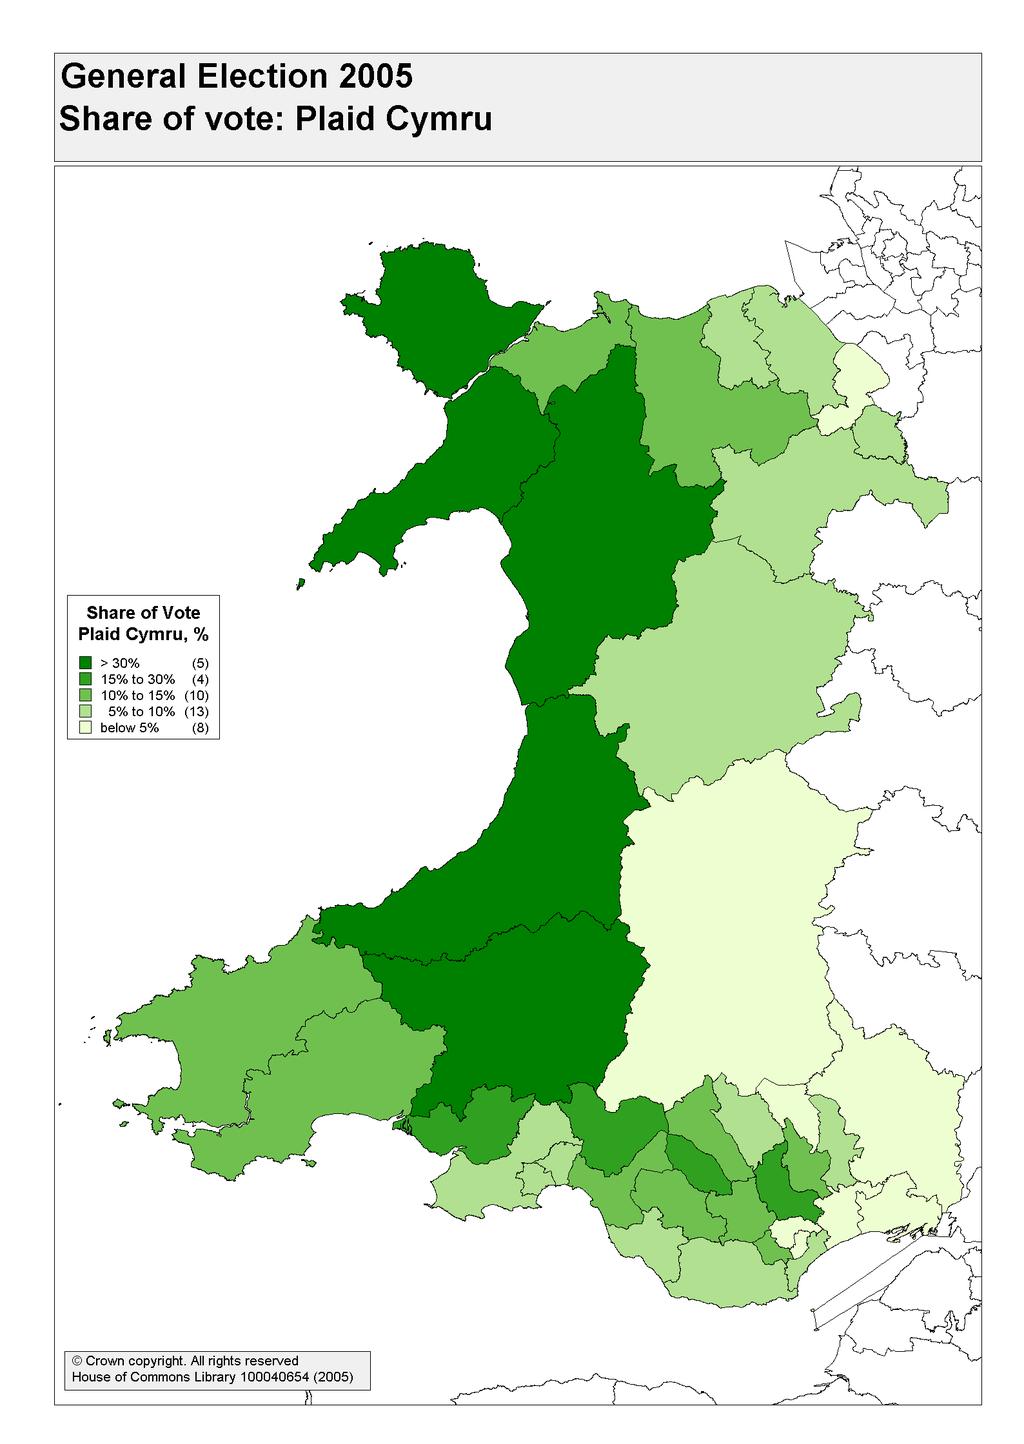
37 Plaid Cymru Plaid Cymru won three seats, Caernarfon, Carmarthen West & Dinefwr and Meirionnydd Nant Conwy. This total was one fewer than in 2001, after they lost Ceredigion to the Liberal Democrats. Plaid won just under 175,000 votes, their third highest total in General Election history, after 1970 and This was 12.6% of the vote in Wales, 1.7% down on 2001 but their second highest ever. Plaid Cymru are the fourth party in Wales in terms of votes behind Labour, the Conservatives, and Liberal Democrats, and joint third with the Liberal Democrats in terms of seats. Their highest constituency share of the vote was 51.3%, for leader Elfyn Llwyd in Meirionnydd Nant Conwy. It is also their safest seat, with a majority over Labour of 6,614, 32.0%. Their share of the vote fell in 29 of the 40 constituencies in Wales. The largest fall in their share of the vote was 8.8% points in Blaenau Gwent, which was won by Peter Law, an independent. The largest increase was 3.5% points in Carmarthen West & Dinefwr. Trends: Wales % % vote % seats won Votes (thousands) % vote 8.1% 7.8% 7.3% 8.9% 9.9% 14.3% 12.6% Seats won % seats won 5.6% 5.3% 7.9% 10.5% 10.0% 10.0% 7.5% Candidates Deposits lost (b) (b) The deposit retention threshold was 12.5% of the vote prior to 1985 and 5% subsequently 20% 15% 10% 5% 0% Scottish National Party The SNP won six seats. These were the four seats they notionally won in 2001: Angus; Banff and Buchan; Moray and Perth & North Perthshire; and two gains of notional Labour seats: Dundee East and Na h-eileanan an lar. They won 412,000 votes, their lowest total since Their share of the total poll in Scotland was 17.7%, down 2.4% points on 2001 and their lowest since The SNP were the third party in Scotland in terms of both votes and seats. Leader Alex Salmond won more than half the vote, 51.2%, in Banff & Buchan. It is also the SNP s safest seat, with a majority of 11,837, 31.8%, over the Conservatives. The SNP share of the vote rose 8.0% points in Na h-eileanan an lar but notionally fell by 12.9% points in Dumfries & Galloway. Overall, their share of the vote notionally fell in 49 of the 59 constituencies in Scotland. Trends: Scotland % % vote % seats won Votes (thousands) % vote 17.3% 11.8% 14.0% 21.5% 22.1% 20.1% 17.7% Seats won % seats won 2.8% 2.8% 4.2% 4.2% 8.3% 6.9% 10.2% Candidates Deposits lost (b) (b) The deposit retention threshold was 12.5% of the vote prior to 1985 and 5% subsequently 20% 15% 10% 5% 0%
38

39


40 Democratic Unionist Party The Democratic Unionist Party won nine seats. These were the five seats they won in 2001: Belfast East; Belfast North; East Londonderry; North Antrim; and Strangford; and four gains from the Ulster Unionists: East Antrim; Lagan Valley; South Antrim; and Upper Bann. The DUP now hold half of all Northern Ireland s Westminster seats. The DUP won 242,000 votes, 33.7% of the Northern Ireland total, their highest ever at a General Election, and more than any other party in Northern Ireland. The DUP share of the vote was up 11.2% points on Leader Ian Paisley has their safest seat, North Antrim, where the majority over Sinn Féin is 17,965, 39.1%. Their highest share of the vote was 56.5% in Strangford. The DUP had several notable results in terms of increases in their share of the vote. The highest was 41.3% points in Lagan Valley, which was won for the DUP by Jeffrey Donaldson, who defected from the UUP in The DUP share of the vote fell in three constituencies, including a 7.7% point fall in Mid Ulster. Trends: Northern Ireland Votes (thousands) % vote 10.2% 20.0% 11.7% 13.1% 13.6% 22.5% 33.7% Seats won % seats won 25.0% 17.6% 17.6% 17.6% 11.1% 27.8% 50.0% Candidates Deposits lost (b) (b) The deposit retention threshold was 12.5% of the vote prior to 1985 and 5% subsequently 70% 60% 50% 40% 30% 20% 10% 0% % vote % seats won Sinn Féin Sinn Féin won five seats in Northern Ireland, their highest ever at a General Election. They held the four seats they won in 2001: Belfast West; Fermanagh & South Tyrone; Mid Ulster; and West Tyrone; and gained Newry & Armagh from the SDLP. Sinn Féin came second in Northern Ireland in terms of seats won for the first time in their history. Sinn Féin won 175,000 votes, marginally fewer than in 2001, but won a higher share of the vote in Northern Ireland, 24.3%, than at any previous General Election. Sinn Féin were also second in Northern Ireland in terms of votes won for the first time and their share of the total vote in Northern Ireland was 2.6% points higher than in Leader Gerry Adams seat is the safest of all 18 seats in Northern Ireland: he has a majority of 19,315, 55.9%. He also won the highest share of the constituency vote of any candidate in Northern Ireland, 70.5%. Sinn Féin s share of the vote rose relative to 2001 in 13 constituencies, including a 10.4% point increase in Newry & Armagh. The Party s vote share fell in five, including a fall of 3.4% points in Mid Ulster. Trends: Northern Ireland Votes (thousands) % vote 13.4% 11.4% 10.0% 16.1% 21.7% 24.3% Seats won % seats won 5.9% 5.9% 0.0% 11.1% 22.2% 27.8% Candidates Deposits lost (b) (b) The deposit retention threshold was 12.5% of the vote prior to 1985 and 5% subsequently 70% 60% 50% 40% 30% 20% 10% 0% % vote % seats won
41


42 Social Democratic & Labour Party The SDLP won three seats, the same number as in both 1997 and They held Foyle and South Down, and won Belfast South from the Ulster Unionists. However, they lost Newry & Armagh to Sinn Féin. They won 126,000 votes, 17.5% of the Northern Ireland total, both the lowest recorded by the party at General Elections. Their vote was down 3.5% points on The SDLP came third in Northern Ireland in terms of seats won and fourth in terms of votes. Their safest seat is South Down, where Eddie McGrady has a majority of 9,140, 19%, over Sinn Fein. Their share of the vote rose in 5 seats, the largest increase being 1.7% points in Belfast South. It fell in the other 13 Northern Ireland seats, including a 12.2% point fall in Newry & Armagh. Trends: Northern Ireland Votes (thousands) % vote 18.2% 17.9% 21.1% 19.7% 24.1% 21.0% 17.5% Seats won % seats won 8.3% 5.9% 17.6% 23.5% 16.7% 16.7% 16.7% Candidates Deposits lost (b) (b) The deposit retention threshold was 12.5% of the vote prior to 1985 and 5% subsequently 70% 60% 50% 40% 30% 20% 10% 0% % vote % seats won Ulster Unionist Party The Ulster Unionists won a solitary seat, North Down. They lost East Antrim, Lagan Valley, South Antrim, and Upper Bann to the Democratic Unionists and lost South Belfast to the SDLP. This left them five down on their 2001 total and nine down on the ten they won in Leader David Trimble lost his Upper Bann seat. This was their worst General Election performance ever in terms of seats won, votes and share of the vote. Their share of the vote fell 9.0% points relative to 2001 to 17.8%. Lady Sylvia Hermon won over half the vote, 50.4%, in North Down. She has a majority of 4,944, 15.3%. Their share of the vote rose in two constituencies, Mid Ulster, where it rose by 10.7% points, and Belfast East, where it rose by 6.9% points. It fell in the remaining 16 constituencies in Northern Ireland, including a fall of 35.0% points in Lagan Valley, which was won by former UUP MP Jeffrey Donaldson. Trends: Northern Ireland Votes (thousands) % vote 36.6% 34.0% 37.8% 34.5% 32.7% 26.8% 17.8% Seats won % seats won 41.7% 64.7% 52.9% 52.9% 55.6% 33.3% 5.6% Candidates Deposits lost (b) (b) The deposit retention threshold was 12.5% of the vote prior to 1985 and 5% subsequently 70% 60% 50% 40% 30% 20% 10% 0% % vote % seats won

43

 - - - 7.0 35.8 47.1 192.7 % vote - - - 0.0% 0.1% 0.2% 0.")
44 British National Party The BNP polled almost 193,000 votes, 0.7% of the UK total and over four times the number at the 2001 general Election. Their average share of the vote in seats they contested was 4.3%, marginally higher than in The BNP polled 4,916 votes in Barking, 16.9% of the total, their best result across the UK. Candidate Richard Barnbrook came third, 27 votes behind the Conservative candidate. The Party also won shares of over 10% in Dewsbury and Burnley. In total, the BNP saved 34 candidate deposits. Leader Nick Griffin won 9.2% of the vote in Keighley Trends: UK Votes (thousands) % vote % 0.1% 0.2% 0.7% Seats won Candidates Deposits lost (b) (b) The deposit retention threshold was 12.5% of the vote prior to 1985 and 5% subsequently 5% 4% 3% 2% 1% 0% % vote Green Party Green The Party Green Party polled almost 258,000 votes, 1.0% of the UK total and their highest total ever. They Green were Party ranked Green sixth Party of all Green parties Party in the Green UK in terms Party of Green the total Party number Green of votes. Party Green Party Green Party Green Party Green Party Green Party Green Party Green Party Green Party On average the Green Party won 3.4% of the vote in seats they contested, compared with 2.8% in Green Party Their best result was in Brighton, Pavillion, where Keith Taylor came third, winning 9,530 votes, 21.9% of the total. Darren Green Johnson Party also polled more than 10% of the vote for the Greens in Lewisham, Deptford. The Green Party Party saved 19 candidate deposits. The Green Green Party Party were known as the Ecology Party until The Scottish Green Party is a separate party and is not Green included Party in these figures. Trends: UK Votes (thousands) % vote 0.1% 0.2% 0.3% 0.5% 0.2% 0.6% 1.0% Seats won Candidates Deposits lost (b) (b) The deposit retention threshold was 12.5% of the vote prior to 1985 and 5% subsequently 5% 4% 3% 2% 1% 0% % vote

 - - - - - 72.5 43.5 % vote - - - - - 3.1% 1.")
45 Scottish Socialist Party The Scottish Socialists polled almost 44,000 votes, 1.9% of the total in Scotland, and 0.2% of the total votes across the UK. Their share of the vote in Scotland was down 1.3% points on their performance in 2001, the only other General Election the Party has contested. The SSP averaged 2.0% of the vote in seats they contested, compared with 3.3% in The Party retained two deposits: John Aberdein won 992 votes, 5.6% of the total, in Orkney & Shetland, and Keith Baldassara won 1,666 votes, 5.4%, in Glasgow South West. Trends: Scotland Votes (thousands) % vote % 1.9% Seats won Candidates Deposits lost (b) (b) The deposit retention threshold was 12.5% of the vote prior to 1985 and 5% subsequently 5% 4% 3% 2% 1% 0% % vote Socialist Labour Party The Socialist Labour Party won just over 20,000 votes, 0.1% of the UK total and significantly down on their 1997 and 2001 performances. The SLP averaged 1.2% of the vote in seats they contested. Doris Kelly was the only SLP candidate to retain a deposit. She won 4,036 votes, 14.2% of the constituency total, against the Speaker in Glasgow North East. She was third behind the Speaker and the SNP candidate. The Conservatives, Labour and the Liberal Democrats did not contest the seat. Trends: UK Votes (thousands) % vote % 0.2% 0.1% Seats won Candidates Deposits lost (b) (b) The deposit retention threshold was 12.5% of the vote prior to 1985 and 5% subsequently 5% 4% 3% 2% 1% 0% % vote


 - - - - 192 422 458 (b) The deposit retention threshold was 12.")
46 UK Independence Party UKIP won 602,000 votes, placing them fourth of all parties contesting the election. It is equivalent to 2.2% of the vote, 0.7% points more than they won in UKIP averaged 2.8% of the vote in the constituencies they contested, compared with 2.1% in The Party s highest share of the vote was 9.6% in Boston & Skegness, where Richard Horsnell came third with 4,024 votes. Leader Roger Knapman received UKIP s sixth highest constituency share of the vote, 7.7% in Totnes. 37 of UKIP s 495 candidates retained their deposits. UKIP lost 458 deposits, the highest of any party and would have cost UKIP 228,500. Trends: UK Votes (thousands) % vote % 1.5% 2.2% Seats won Candidates Deposits lost (b) (b) The deposit retention threshold was 12.5% of the vote prior to 1985 and 5% subsequently 5% 4% 3% 2% 1% 0% % vote Respect - the Unity Coalition Respect won 68,000 votes, 0.3% of the UK total, and averaged 6.8% in seats they contested. Leader and former Labour MP George Galloway won Bethnal Green & Bow from Labour, where he received 15,801 votes, 35.9% of the total to defeat the sitting Labour MP, Oona King. Respect came second in Brimingham, Sparkbrook & Small Heath; East Ham; and West Ham. Nine of their 26 candidates retained their deposits. Veritas Veritas won 40,000 votes, 0.1% of the UK total, and averaged 1.5% in seats they contested. Party leader, former Labour MP and current MEP, Robert Kilroy-Silk, was the only one of 66 Veritas candidates to retain their deposit. He came fourth in Erewash with 2,957 votes, 5.8% of the total. Veritas won more votes than UKIP in 4 of the 49 constituencies that both parties contested. 46
General Election 2005 [Final edition 10 March 2006]
![General Election 2005 [Final edition 10 March 2006]](/thumbs/89/99580820.jpg "General Election 2005 [Final edition 10 March 2006]") RESEARCH PAPER 05/33 17 MAY 2005 General Election 2005 [Final edition 10 March 2006] This paper presents a summary of the results of the United Kingdom General Election held on 5 May 2005. It provides
RESEARCH PAPER 05/33 17 MAY 2005 General Election 2005 [Final edition 10 March 2006] This paper presents a summary of the results of the United Kingdom General Election held on 5 May 2005. It provides
Postal votes, proxy votes and spoilt ballot papers at the 2001 general election
 Postal votes, proxy votes and spoilt ballot papers at the 2001 general election Contents Summary 2 Introduction 2 Postal votes 3 Proxy votes 5 Spoilt ballot papers 6 January 2002 Summary This report gives
Researching the age demographics of the new parliamentary constituencies
 Quantifying the Changing Age Structure of he British Electorate 2005-2025 2025 Researching the age demographics of the new parliamentary constituencies Prepared for Age Concern By Dr Scott Davidson De
Welsh Assembly. Elections: 6 May MAY 1999
 Welsh Assembly 12 MAY 1999 Elections: 6 May 1999 This paper presents a summary of the results of the first elections to the Welsh Assembly which took place on 6 May 1999. The paper gives information on
Election Statistics: UK
 1 FEBRUARY 2008 Election Statistics: UK 1918-2007 This paper summarises the results of UK elections since 1918. It focuses on elections to Westminster and includes statistics on voting at general and by-elections,
THE COST OF CRIME Matthew Sinclair and Corin Taylor
 www.taxpayersalliance.com THE COST OF CRIME Matthew Sinclair and Corin Taylor Contents EMBARGOED UNTIL 00.01AM FRIDAY JULY 4 2008 Executive Summary 3 1. Method 6 2. The cost of crime in each police force
This research is funded by the UK Economic and Social Research Council and is a part of UPTAP programme
 Understanding Immigration Labour Market Impact in Britain Marina Shapira Centre for Educational Sociology University of Edinburgh This research is funded by the UK Economic and Social Research Council
The UK General Election 2010 In-depth
 House of Commons The UK General Election 2010 In-depth Report and Analysis The UK General Election 2010 In-depth Report and Analysis Foreword This report has been produced by the Electoral Reform Society
General Election 2015
 General Election 2015 Voter Registration, Campaigns, and Turnout Alex Jones, NUS 674 days until general election 2015 Challenges Electoral Landscape Public Opinion Policy Context Student Vote Responses
I want to appeal - what should I do? For people who want to appeal against a court decision in civil and family appeals
 EX340 I want to appeal - what should I do? For people who want to appeal against a court decision in civil and family appeals About this leaflet This leaflet will help you if you want to appeal against
BRIGADE REGULATIONS. Registered Company: Registered Charity:
 Registered Company: 145122 Registered Charity: 305969 Date of Version: 15 September 2012 This page is intentionally blank Page 2 TABLE OF CONTENTS Regulation Section Introduction 1 Mission Statement 2
BRIGADE REGULATIONS. Registered Company: Registered Charity:
 Registered Company: 145122 Registered Charity: 305969 Version: 1.2 September 2018 NB: Amendments The following amendments to were agreed at Brigade Council in Edinburgh on 1 st September 2018. (i) (ii)
Election 2010: Where the Women Candidates Are
 Election 2010: Where the Women Candidates Are A Report from the Centre for Women & Democracy April 2010 Election 2010: Where the Women Candidates Are This report looks at the numbers and percentages of
Arrests for Notifiable Offences and the Operation of Certain Police Powers under PACE 12/02 England and Wales, 2001/02
 Arrests for Notifiable Offences and the Operation of Certain Police Powers under PACE 12/02 England and Wales, 2001/02 Margaret Ayres, Dave Perry and Paul Hayward 7 November 2002 MAIN POINTS Arrests Around
Conservative and Unionist Central Office
 Conservative and Unionist Central Office 32 Smith Square Westminster SW IP 3HH Telephone 01-222 9000 Telegrams Constitute London swl Chairman of the Party: THE RT HON THE LORD THORNEYCROFT CH Vice Chairmen:
2017 general election Urban-Rural differences
 2017 general election Urban-Rural differences THE POLITICAL GEOGRAPHY OF THE 2017 GENERAL ELECTION 1 Table of Contents I. Urban-Rural classifications... 3 II. Vote share patterns by Rural-Urban ype...
Police service strength
 Police service strength Standard Note: SN00634 Last updated: 10 September 2012 Author: Gavin Berman Section Social and General Statistics This note summarises police service strength data from the Home
The mountain to climb: Labour s 2020 challenge
 The mountain to climb: Labour s 2020 challenge Andrew Harrop May 2015 Fabian Society 61 Petty France London SW1H 9EU www.fabians.org.uk This paper, like all publications of the Fabian Society, represents
The Rules May Lawn Tennis Association Limited The Rules Effective 17 May 2018
 Lawn Tennis Association Limited The Rules Effective 7 May 208 Lawn Tennis Association Limited INTERPRETATION The Rules. Defined Terms and Interpretation. In the Articles and these Rules, unless the context
SCHEDULED MONUMENT CONSENT (SMC)
") SCHEDULED MONUMENT CONSENT (SMC) NOTES FOR APPLICANTS On 1 st October 2009 the procedure for applying for Scheduled Monument Consent changed. Scheduled Monument Consent (SMC) applications are still decided
SCHEDULED MONUMENT CONSENT (SMC) NOTES FOR APPLICANTS On 1 st October 2009 the procedure for applying for Scheduled Monument Consent changed. Scheduled Monument Consent (SMC) applications are still decided
National Assembly for Wales Elections: 2011
 National Assembly for Wales Elections: 2011 RESEARCH PAPER 11/40 19 May 2011 This Research Paper provides summary and detailed results of the fourth elections to the National Assembly for Wales, which
Standard Note: SN/SG/1467 Last updated: 3 July 2013 Author: Aliyah Dar Section Social and General Statistics
 Elections: Turnout Standard Note: SN/SG/1467 Last updated: 3 July 2013 Author: Aliyah Dar Section Social and General Statistics This note looks at turnout in UK elections. The extent to which voters turnout
The British Parliamentary Constituency Database,
 The British Parliamentary Constituency Database, 1992-2001 Release 1: June 11, 2001 Pippa Norris Publications using the database should reference the source as: Pippa Norris. The British Parliamentary
Firearm crime statistics
 Firearm crime statistics Standard Note: SN/SG/1940 Last updated: 30 January 2012 Author: Gavin Berman Section Social and General Statistics This Standard Note summarises statistics relating to crimes recorded
POLICE SPORT (UK) (Founded 1928 as the Police Athletic Association) CONSTITUTION AND RULES POLICE SPORT (UK) Patron: HER MAJESTY THE QUEEN
 (Founded 1928 as the Police Athletic Association) CONSTITUTION AND RULES POLICE SPORT (UK) Patron: HER MAJESTY THE QUEEN") POLICE SPORT (UK) (Founded 1928 as the Police Athletic Association) CONSTITUTION AND RULES POLICE SPORT (UK) Patron: HER MAJESTY THE QUEEN Joint Presidents: The Rt. Hon. The Secretary of State for Home
POLICE SPORT (UK) (Founded 1928 as the Police Athletic Association) CONSTITUTION AND RULES POLICE SPORT (UK) Patron: HER MAJESTY THE QUEEN Joint Presidents: The Rt. Hon. The Secretary of State for Home
The Supreme Court of the United Kingdom Practice Direction 13 Costs
 The Supreme Court of the United Kingdom Practice Direction 13 Costs Note: enquiries about costs should be made to the Costs Clerk (tel: 020-7960 1990). Enquiries about fees should be made to the Registry
Understanding General Election Prof Roger Scully 5 th July 2017
 Understanding General Election 2017 Prof Roger Scully 5 th July 2017 Outline of Session 1. Introduction: What We Know About Elections 2. General Election 2017: the Results 3. The Parties in Wales 4. Why?
Sentence THE SENTENCING GUIDELINES NEWSLETTER MAY 2005 ISSUE 02
 the Sentencing Guidelines Council MAY 2005 ISSUE 02 The Sentencing Guidelines Council is acutely aware of the growing need for research and statistical information about sentencing as sentencers and local
Home Office Statistical Bulletin
 Home Office Statistical Bulletin Statistical Bulletins ar e prepared by staff in Home Office Statistics under the National Statistics Code of Practice and can be downloaded from both the UK Statistics
Increasing disenchantment with the European Union and tip-toeing to the right in the UK ( )
") Dorling, D. (2018) Increasing disenchantment with the European Union and tip-toeing to the right in the UK (1979-2014), Regional Studies Association Blog post, August 15 th, http://blog.regionalstudies.org/increasingdisenchantment-european-union-tip-toeing-right-uk-1979-2014/
Dorling, D. (2018) Increasing disenchantment with the European Union and tip-toeing to the right in the UK (1979-2014), Regional Studies Association Blog post, August 15 th, http://blog.regionalstudies.org/increasingdisenchantment-european-union-tip-toeing-right-uk-1979-2014/
Race Disproportionality in Stops and Searches,
 Equality and Human Rights Commission Briefing paper 7 Race Disproportionality in Stops and Searches, 2011-12 Karen Hurrell Equality and Human Rights Commission 2013 First published Autumn 2013 ISBN 978-1-84206-491-7
European Parliament. Elections 1979 to JUNE 1999
 European Parliament 2 JUNE 1999 Elections 1979 to 1994 This paper presents a summary of direct elections to the European Parliament since 1979, in advance of elections in June 1999. It concentrates on
EX107GN Guidance Notes Request for Transcription of Court or Tribunal proceedings
 EX107GN Guidance Notes Request for Transcription of or Tribunal proceedings If you want a transcript of proceedings in any court or tribunal (except the of Appeal Criminal Division or the Administrative
Introduction The Third Blair Victory: How and Why?
 Parliamentary Affairs Vol. 58 No. 4, 2005, 657 683 Introduction The Third Blair Victory: How and Why? BY PIPPA NORRIS AND CHRISTOPHER WLEZIEN THE results of the 5 May 2005 UK general election produced
Voting at the Northern Ireland Assembly Election, 2003.
 Voting at the Northern Ireland Assembly Election, 2003. Colin Rallings and Michael Thrasher Local Government Chronicle Elections Centre University of Plymouth This report for the Electoral Commission considers
Of the 73 MEPs elected on 22 May in Great Britain and Northern Ireland 30 (41 percent) are women.
 are women.") Centre for Women & Democracy Women in the 2014 European Elections 1. Headline Figures Of the 73 MEPs elected on 22 May in Great Britain and Northern Ireland 30 (41 percent) are women. This represents a
Centre for Women & Democracy Women in the 2014 European Elections 1. Headline Figures Of the 73 MEPs elected on 22 May in Great Britain and Northern Ireland 30 (41 percent) are women. This represents a
Missing Persons: Data and Analysis 2011/2012
 Missing Persons: Data and Analysis 2011/2012 This document can be provided in alternative formats. Please contact missingpersonsbureau@soca.x.gsi.gov.uk if you require an alternative format. - SOCA (Serious
Police complaints. Statistics for England and Wales 2015/16
 Police complaints Statistics for England and Wales 2015/16 Acknowledgements The IPCC would like to thank staff from police force professional standards departments across England and Wales and their IT
Freedom of Information Report 2011
 Freedom of Information Report 2011 2 Contents Executive Summary 3 Question 1 Analysis 4 Question 2 Analysis 5 Question 3 Analysis 6 Question 4 Analysis 7 Question 5 Analysis 8 Summary of Responses 11 3
Home Office Statistical Bulletin
 Home Office Statistical Bulletin Motoring Offences and Breath Test Statistics 05/06 England and Wales 2004 Ransford Fiti and Liza Murray 30 March 2006 The Research, Development and Statistics Directorate
Power of the Black Vote in 2017
 Power of the Black Vote in 2017 Contents 3 Foreword - Simon Woolley 4 The Black Vote 5 How Influential is the Black Vote? 6 Challenge for the parties 8 Where is the Black Vote? Operation Black Vote May
MIGRATION IN CAMBRIDGESHIRE: 2011 CENSUS MARCH 2015
 MIGRATION IN CAMBRIDGESHIRE: 2011 CENSUS MARCH 2015 Cambridgeshire Research Group is the brand name for Cambridgeshire County Council s Research & Performance Function. As well as supporting the County
Missing persons: Data and analysis 2009/2010
 Missing persons: Data and analysis 2009/2010 NPIA (National Policing Improvement Agency) 2010 This document can be provided in alternative formats. Please contact missingpersonsbureau@npia.pnn.police.uk
Analysis of cases of alleged electoral fraud in the UK in 2017
 Analysis of cases of alleged electoral fraud in the UK in 2017 Summary of data recorded by police forces 2018 1 Translations and other formats For information on obtaining this publication in another language
Home Office Statistical Bulletin
 Home Office Statistical Bulletin Motoring Offences and Breath Test Statistics 06/05 England and Wales 2003 Ransford Fiti, Dave Perry & Liza Murray 26 April 2005 The Research, Development and Statistics
The Local Elections. Media Briefing Pack. 18 th April, 2012
 The Local Elections Media Briefing Pack 18 th April, 2012 Colin Rallings and Michael Thrasher, Professors of Politics, Elections Centre, University of Plymouth John Curtice, Professor of Politics, University
The sure bet by Theresa May ends up in a hung Parliament
 The sure bet by Theresa May ends up in a hung Parliament Vincenzo Emanuele and Bruno Marino June 9, 2017 The decision by the British Prime Minister, Theresa May, to call a snap election to reinforce her
Local Election Results 2008 (updated)
") Local Election Results 2008 (updated) This paper presents the results of the local elections held on 1 May 2008. Figures are provided on overall control of councils and the number of seats won by each
Local Election Results 2008 (updated) This paper presents the results of the local elections held on 1 May 2008. Figures are provided on overall control of councils and the number of seats won by each
Local Elections 2009
 Local Elections 2009 Colin Rallings and Michael Thrasher September 2009 LGC Elections Centre University of Plymouth Drake Circus Plymouth PL4 8AA Introduction Local elections took place in 34 local authorities
Automatic Number Plate Recognition (ANPR) Approved Law Enforcement Agencies (Approved LEA)
 Approved Law Enforcement Agencies (Approved LEA)") Automatic Number Plate Recognition (ANPR) Approved Law Enforcement Agencies (Approved LEA) July 2016 1 Introduction 1.1 National ANPR Standards for Policing (NASP) provide the standards that apply to all
Automatic Number Plate Recognition (ANPR) Approved Law Enforcement Agencies (Approved LEA) July 2016 1 Introduction 1.1 National ANPR Standards for Policing (NASP) provide the standards that apply to all
NATIONAL OFFICERS AND EXECUTIVE MEMBERS. Annual Conference. Brighton
 NATIONAL OFFICERS AND EXECUTIVE MEMBERS 2014 2016 Annual Conference Brighton National Officers President Max Hyde Senior Vice-President Philipa Harvey Junior Vice-President Anne Swift Treasurer Ian Murch
White Rose Research Online URL for this paper: Version: Accepted Version
 This is a repository copy of Representing People and Representing Places: Community, Continuity and the Current Redistribution of Parliamentary Constituencies in the UK. White Rose Research Online URL
NHS England funding for women from Northern Ireland seeking abortion services
 The Rt Hon Jeremy Hunt MP Department of Health Richmond House 79 Whitehall Westminster London SW1A 2NS c/o FPA 23-28 Penn Street Hackney London N1 5DL laurar@fpa.org.uk 27 th June 2017 Dear Secretary of
Total. British Transport Police Yes Yes Cambridgeshire Constabulary Yes Yes 2 per car. Derbyshire Constabulary Yes Yes Hampshire Constabulary Yes
 APHSA Survey of use of spit guards/hoods Questionnaire sent out to 49 forces. Which Force Do you use spit hoods If not, why not? Make and type Supplier Date Started Individual issue yes/no Cars yes/no
General Election The Election Results Guide
 General Election 2017 The Election Results Guide Contents 1. Overview 2. What It Means 3. Electoral Map 4. Meet the New MPs Overview 320 318 261 Conservatives 270 Labour SNP 220 Liberal Democrats 170 DUP
Scheduled Monuments. A Guide for Owners and Occupiers
 Scheduled Monuments A Guide for Owners and Occupiers This guide explains what scheduling means for you as the owner or occupier of a scheduled monument and summarizes the main provisions of the Ancient
EX107 Request for transcription of Court or Tribunal proceedings
 EX107 Request for transcription of or Tribunal proceedings Please refer to the Guidance tes (EX107GN) before completing this form. If completing this form by hand please use BLOCK CAPITAL letters. Once
International Migration Using administrative datasets for migration analysis and estimation
 International Migration Using administrative datasets for migration analysis and estimation Peter Boden ONS Centre for Demography Titchfield May 2009 This work is part of ESRC Research Award RES-165-25-0032
Proportional representation and local government Lessons from Europe. Colin Rallings, Michael Thrasher and Gerry Stoker
 Proportional representation and local government Lessons from Europe Colin Rallings, Michael Thrasher and Gerry Stoker The Joseph Rowntree Foundation has supported this project as part of its programme
Police Complaints: Statistics for England and Wales 2005/06
 Police Complaints: Statistics for England and Wales 2005/06 Emily Gleeson and Helen Dady IPCC Research and Statistics Series: Paper 5 Police Complaints: Statistics for England and Wales 2005/06 Emily Gleeson
SPICe briefing REJECTED BALLOT PAPERS. 26 June /36
 REJECTED BALLOT PAPERS STEPHEN HERBERT AND TOM EDWARDS This paper summarises what constituted a ballot paper at the elections in May and then details the level of ballot at the 2007 Scottish Parliament
Local Government Elections 2017
 SPICe Briefing Pàipear-ullachaidh SPICe Local Government Elections 2017 Andrew Aiton and Anouk Berthier This briefing looks at the 2017 local government elections including turnout, results, the gender
How Labour s position on a People s Vote affects its support in Leave-voting marginals. Analysis from Represent Us based on polling from ICM
 How Labour s position on a People s Vote affects its support in Leave-voting marginals Analysis from Represent Us based on polling from ICM Labour will vote against the Prime Minister s deal but its stance
Have women born outside the UK driven the rise in UK births since 2001?
 Have women born outside the UK driven the rise in UK births since 2001? Nicola Tromans, Eva Natamba, Julie Jefferies The number of births 1 in the UK has increased each year since 2001. This article examines
UK Election Statistics:
 1 JULY 2003 UK Election Statistics: 1945-2003 This paper summarises the results of UK elections since 1945. It focuses on elections to Westminster and includes statistics on voting at general and by-elections,
freshwater Local election May 2017 results
 freshwater May 2017 Local election results www.freshwater-uk.com @FWpublicaffairs Introduction While the results of local elections do not directly transfer to the same results in a general election, the
 www.labourroadmap.org.uk CONTENT INTRODUCTION 2 SOURCES 2 EXECUTIVE SUMMARY 3 ABOUT LABOUR ROADMAP 4 RESULT SUMMARY 5 GEOGRAPHY 6 TRANSITIONS BETWEEN PARTIES 8 HOW WAS LABOUR AFFECTED BY THE BREXIT DIVIDE
Analysis of local election results data for Wales 2004 (including turnout and extent of postal voting)
") Analysis of local election results data for Wales 2004 (including turnout and extent of postal voting) By Professors Michael Thrasher and Colin Rallings of the University of Plymouth Elections Centre Introduction
Analysis of local election results data for Wales 2004 (including turnout and extent of postal voting) By Professors Michael Thrasher and Colin Rallings of the University of Plymouth Elections Centre Introduction
Exploring Local Areas, Skills and Unemployment
 Exploring Local Areas, Skills and Unemployment Exploratory Data Analysis at Local Area Level Anne E. Green David Owen Anne E. Green Institute for Employment Research University of Warwick Coventry CV4
CONSTITUTION OF THE NATIONAL FRONT
 CONSTITUTION OF THE NATIONAL FRONT 24th Nov 07 (Minor revision 2009) This Constitution completely replaces and supersedes all earlier Constitutions (revised Jan 2002 also includes amendment to 4A passed
Q4 Statistical Report 2018 Summary
 f Q Statistical Report 8 Summary Overall Quarter Observations October yielded the highest number monthly calls to the Helpline to date. Quarter four shows a 9% increase in calls in comparison to the previous
2011 Census Snapshot: Ethnic Diversity Indices
 Update CIS2012-04 2011 Census Snapshot: Ethnic Diversity Indices December 2012 On 11 th December 2012 ONS released the first topic based results from the 2011 Census for England and Wales. This paper sets
SPICe Briefing European Parliament Election 2014
 The Scottish Parliament and Scottish Parliament Infor mation C entre l ogos. SPICe Briefing European Parliament Election 2014 Andrew Aiton and Iain McIver 30 May 2014 This briefing provides details of
Disproportionality and bias in the results of the 2005 general election in Great Britain: evaluating the electoral system s impact
 Disproportionality and bias in the results of the 2005 general election in Great Britain: evaluating the electoral system s impact Ron Johnston School of Geographical Sciences, University of Bristol David
Local institutions and local economic growth: the state of the LEPs in England
 Local institutions and local economic growth: the state of the LEPs in England Andy Pike, Anja McCarthy, Peter O Brien (all CURDS, Newcastle University), David Marlow (Third Life Economics and CURDS, Newcastle
Local Elections 2007
 Local Elections 2007 Colin Rallings and Michael Thrasher August 2007 LGC Elections Centre University of Plymouth Drake Circus Plymouth PL4 8AA Introduction Local elections took place in England and Scotland
Regional Policy post BREXIT
 Regional Policy post BREXIT David Bell, Stirling Management School University of Stirling Email: dnfb1@stir.ac.uk Twitter: @DavidNFBell UK regional policy a historical perspective "UK regional policy has
Towards a hung Parliament? The battleground of the 2017 UK general election
 Towards a hung Parliament? The battleground of the 2017 UK general election June 5, 2017 On the next 8 th June, UK voters will be faced with a decisive election, which could have a profound impact not
Questions for oral answer on a future day
 Published: Monday 21 January 2019 Questions for oral answer on a future day (Future Day Orals) Questions for oral answer on a future day as of Monday 21 January 2019. T Indicates a topical question. Members
After the Scotland Act (1998) new institutions were set up to enable devolution in Scotland.
 new institutions were set up to enable devolution in Scotland.") How does devolution work in Scotland? After the Scotland Act (1998) new institutions were set up to enable devolution in Scotland. The Scottish Parliament The Scottish Parliament is made up of 73 MSPs
How does devolution work in Scotland? After the Scotland Act (1998) new institutions were set up to enable devolution in Scotland. The Scottish Parliament The Scottish Parliament is made up of 73 MSPs
BRIEFING. West Midlands: Census Profile. AUTHOR: ANNA KRAUSOVA DR CARLOS VARGAS-SILVA PUBLISHED: 15/08/2013
 BRIEFING West Midlands: Census Profile AUTHOR: ANNA KRAUSOVA DR CARLOS VARGAS-SILVA PUBLISHED: 15/08/2013 www.migrationobservatory.ox.ac.uk This briefing summarises key statistics from the 2011 Census
The South West contest by contest
 The South West contest by contest blogs.lse.ac.uk /politicsandpolicy/the-south-west/ Throughout the short campaign, this blog will be publishing a series of posts that focus on each of the electoral regions
Police Complaints: statistics for England and Wales 2010/11. IPCC Research and Statistics Series: Paper 22
 Police Complaints: statistics for England and Wales 2010/11 IPCC Research and Statistics Series: Paper 22 Acknowledgements The IPCC would like to thank staff from police Professional Standards Departments
The May 2016 Police and Crime Commissioner elections
 The May 2016 Police and Crime Commissioner elections Report on the administration of the 5 May 2016 Police and Crime Commissioner elections in England and Wales, including the local government elections
From Minority Vote to Majority Challenge. How closing the ethnic gap would deliver a Conservative majority
 From Minority Vote to Majority Challenge How closing the ethnic gap would deliver a Conservative majority From Minority Vote to Majority Challenge David Cameron could have secured an extra 500,000 votes
The General Election 2005
 The General Election 2005 Campaign Analysis Produced for the Electoral Commission by: Dr Justin Fisher (Brunel University) Prof. Edward Fieldhouse (University of Manchester) Prof. David Denver (Lancaster
Findings from the UK National Problem Profile UNRESTRICTED. Commercial Cultivation of Cannabis. Three years on July 2010 UNRESTRICTED
 Findings from the UK National Problem Profile UNRESTRICTED Commercial Cultivation of Cannabis Three years on July 2010 UNRESTRICTED 1 Introduction The 2010 UK National Problem Profile was commissioned
Summary of GB political parties donations and borrowing for quarter two 2018 (April to June)
") Summary of GB political parties donations and borrowing for quarter two 2018 (April to June) The Electoral Commission is the independent body which oversees elections and regulates political finance in
Summary of GB political parties donations and borrowing for quarter two 2018 (April to June) The Electoral Commission is the independent body which oversees elections and regulates political finance in
Peter Boden. GRO Scotland February 12 th 2009
 Peter Boden GRO Scotland February 12 th 2009 This work is part of ESRC Research Award RES-165-25-0032 (1/10/07 to 30/9/09) What happens when international migrants settle? Ethnic group population trends
Q2 Statistical Report 2017
 Q Statistical Report 17 Summary Overall Quarter Observations During this quarter, the Helpline saw a steady increase in number calls rising from 163 in January to 6 in June. Calls were received from all
Results of the National Assembly for Wales Referendum 2011
 Results of the National Assembly for Wales Referendum 2011 March 2011 This paper provides the results of the National Assembly for Wales Referendum 2011. Including comparisons with results from the 1997
Maitland Political Insight General Election January 2015
 Maitland Political Insight General Election January 2015 General Election 2015 Contents Introduction..3 Election Roadmap......4 Polling...5 Party Platforms....6 Marginal Seats.7 Marginal Seat Profiles.8
Elections in Britain
 Elections in Britain Also by Dick Leonard THE BACKBENCHER AND PARLIAMENT (co-editor with Valentine Herman) CROSLAND AND NEW LABOUR (editor) THE ECONOMIST GUIDE TO THE EUROPEAN UNION GUIDE TO THE GENERAL
BRIEFING. Yorkshire and the Humber: Census Profile.
 BRIEFING Yorkshire and the Humber: Census Profile AUTHOR: ANNA KRAUSOVA DR CARLOS VARGAS-SILVA PUBLISHED: 12/06/2013 www.migrationobservatory.ox.ac.uk This briefing summarises key statistics from the 2011
Research Report local elections postpolling. research. Prepared for: Electoral Commission
 Research Report 2013 local elections postpolling public opinion research Prepared for: Electoral Commission 2013 local elections post-polling public opinion research Prepared for: Electoral Commission
BBR08 Miscellaneous information
 BBR08 Miscellaneous information Cases in which magistrates convicted persons of unlawfully obstructing a path by causing crops to grow on it 2 Performance indicator data for condition of rights of way
Dispersal notices the crime of being in a public place
 Dispersal notices the crime of being in a public place A Manifesto Club briefing document By Josie Appleton www.manifestoclub.com The new dispersal powers From 20 October 2014, the Anti-Social Behaviour,
The Local Elections Media Briefing. Wednesday 18 th April
 The Local Elections Media Briefing Wednesday 18 th April English Local Elections 2012 Colin Rallings & Michael Thrasher The Elections Centre University of Plymouth 2011 Outcome 1 Con Lab LD 2007 National
Analysis of cases of alleged electoral fraud in 2012
 Analysis of cases of alleged electoral fraud in 2012 Summary of data recorded by police forces May 2013 Introduction 1.1 We have worked with the UK s Associations of Chief Police Officers to collect data
FOCUS ON. People and Migration. Population movement within the UK. Chapter 6. Tony Champion
 FOCUS ON People and Migration Population movement within the UK Tony Champion Chapter 6 Chapter 6: Population movement within the UK Focus on People and Migration: 2005 Introduction This chapter and Chapter