LONDON S ANTI-POVERTY STRATEGY: LITERATURE REVIEW
|
|
|
- Domenic Stewart Rose
- 5 years ago
- Views:
Transcription
1 LONDON S ANTI-POVERTY STRATEGY: LITERATURE REVIEW Prepared by: Social Research and Planning for Discussion Purposes April 17,
2 EXECUTIVE SUMMARY London, like Ontario, is embarking on a formal poverty reduction strategy. Poverty levels in Ontario and London, as measured by low-income, are of significant concern: Ontario is known as the child poverty capital of Canada with a before-tax low-income rate of 17%. The low-income rate for children in London is higher than Ontario s at 20%. Children and youth in London are more likely than any other age group to live with low-income. London s recent immigrants, Aboriginal people, people with disabilities, visible minorities, and lone parents have higher low-income rates. Women in London particularly single senior women and women in other vulnerable groups, are more likely than men to live with low-income. Child and family poverty affects everyone. The harm done to children living in poverty, with insufficient food, shelter, clothing and supports, has lifelong consequences for them with respect to their health and future economic prospects. The research on every front is clear and compelling. Dollars invested in children to provide the conditions for healthy development save us huge social and economic costs later. In order for our children, youth and families who are struggling with poverty, to have a sense of belonging in our community, relationships need to be developed through employment, skill development, volunteer opportunities, recreation, leisure and cultural activities, child care and early learning opportunities. Meeting children s fundamental needs is not a choice; it is a community responsibility which has tremendous rewards for all concerned. As we begin the community dialogue on an anti-poverty strategy for London, one of the first matters we will have to agree on is how we are going to measure poverty. This decision will establish our strategic framework for the development of an action plan. Traditionally, income measures like the Low Income Cut-Off and market basket measures against income have been most commonly used. While effective as economic measures, actions become limited, and measures like increasing the availability of safe, affordable housing fall outside this measurement system. To accommodate for this shortcoming, England and Ireland have made great progress through the use of indices of deprivation. Finally, the social determinants of health have been used as a broad lens for looking at the social and health impacts of poverty and marginalization. While poverty is thought of only in terms of financial resources, financial resources alone do not explain why some individuals may achieve success in exiting poverty, where others do not. In reality, there are a number of other resources that support people leaving poverty. These include emotional, mental, spiritual and physical resources, as well as support systems, relationships and role models, knowledge of hidden social rules, and coping strategies. Bridges Out of Poverty: Strategies for Professionals and Communities, The development of London s anti-poverty strategy may be guided by our Social Policy Framework. The social policy framework is central to the City of London's success in achieving our strategic priorities of economic prosperity, enriched cultural identity, and community vitality. For example, the work of Richard Florida (2000) highlights that amenities and the environment are vital to attracting knowledge workers and supporting leading-edge technology firms and industries to a community. As London faces new demands to attract investment and the creative class," we must pay more attention to social factors in promoting our community as a business and quality of life destination. Our Social Policy Framework is based on the guiding principles of equity and inclusion, dignity and self-sufficiency, and partnerships and accountability. For further details on these principles, please see Appendix Two. 1 1
3 City of London Social Policy Framework Social Inclusion Community & Neighborhood Capacity Building Safety Net Income security Continuum of affordable housing Food security Sense of belonging/ social relationships developed through: Employment, skill development, and volunteer opportunities Child care and early learning opportunities Recreation, leisure, and cultural opportunities Engaging neighborhoods to build on their capacities and increase their quality of life To aid in the development of a local definition of poverty, determine the most appropriate means for measuring progress, and to identify strategic actions in which the community can engage, this literature review: discusses the different ways that poverty may be and is being defined, conceptualized and measured; provides a profile of low-income in London that identifies groups and neighbourhoods that are particularly vulnerable to low-income; presents the causes and effects of living with low-income; and summarizes anti-poverty strategies being used by other jurisdictions. This paper is to be used as a discussion tool, providing the community with the foundational information needed to move forward in developing, implementing and monitoring London s antipoverty strategy. 2 2
4 SECTION 1: INTRODUCTION With its anti-poverty platform and the formation of a Provincial committee to develop a strategy to reduce poverty, Ontario has officially recognized the significance of the incidence, depth and persistence of poverty on individuals, communities and the Province. Ontario is the child poverty capital of Canada 1 : Ontario has an after-tax child low-income rate of 12.6% and a before-tax child low-income rate of 17%); and is home to 44% of Canada s low-income children. There are 16% of Ontario families with children living with low-income, and, as a community, 14% of Ontario s population has low-income. The research is clear that living with low-income has negative impacts on individual and community health and the ability for all people to participate in society equally. These negative impacts have tremendous economic and social costs, For example, the cost of treating the illnesses caused by poverty is huge to our health system and much more serious when combined with the broader costs caused by disability. Parts of these costs are in lost productivity, support time from caregivers and the burden on our disability assistance system. 2 Historically, London has been active on this issue for many years, and has made significant investments in discretionary programs for social assistance recipients and the working poor as well as supporting affordable housing initiatives. Recently, segments of the London community have been advocating for an anti-poverty strategy for London, including the community advocates group and the London Homeless Coalition. A community forum on poverty in 2007 attracted close to 300 individuals. In December, 2007, the Community Services Department received direction from the London City Council Community and Protective Services Committee to move forward with an anti-poverty strategy for London. The intent of this literature review is to provide an overview of poverty for the purposes of providing stakeholders who will be involved in the development of a local anti-poverty strategy with a foundational understanding of poverty in London. Specifically, this paper will discuss the various ways that poverty can be defined, conceptualized and measured. It will provide a profile of poverty in London, including key facts and figures and will describe its causes and the impacts it has on individuals and communities. The literature review documents what can be done to address poverty and provides specific examples of strategic approaches that are currently being implemented in other jurisdictions, including the United Kingdom and Ireland. It is intended that, with the information contained in this report, the community will be able to develop a London definition of poverty, and will have the information needed to begin to identify specific actions that can be taken. This literature review is by no means exhaustive as the volume of work on poverty is extensive and time consuming. Despite this limitation, we are confident that the contents of this review are comprehensive and that a fuller review would not change much of our understanding of poverty to a great extent. 1 Campaign Report Card on Child and Family Poverty in Canada. It Takes a Nation to Raise a Generation: Time for a National Poverty Reduction Strategy 2 Bloch, G, Member of the steering committee of Health Providers Against Poverty. Poverty Takes a Huge Toll on Health. Toronto Star. September 10,
5 SECTION 2: WHAT IS POVERTY? Defining Poverty: In the absence of a national definition of poverty for Canada, definitions from the literature and from various jurisdictions are summarized below: Jurisdiction Lambton County Hamilton Niagara Bedford, United Kingdom Canadian Council on Social Development Ireland Quebec Definition of Poverty Poverty is when a person or a community is deprived of, or lacks the essential resources required, for a minimum standard of well-being. These resources include the necessities of daily living such as food, safe drinking water, clothing, shelter, health care, access to information, education, social status, political power or the opportunity excludes them from taking part in activities which are an accepted part of daily life in society. Individuals and families experiencing poverty lack the adequate resources to maintain a decent standard of living, and to participate fully in the life of the community. While poverty is not only an income issue, it is always related to income and access to resources. No specific definition. The literature review report defines poverty based on the following four aspects: 1. monetary measure (i.e. living below the LICO or MBM) 2. social determinants of health framework (i.e. impact of poverty on health, wellbeing and outcomes) 3. individual s experience of powerlessness, voicelessness and social exclusion 4. broader impacts of poverty for the community. Is a life situation people may find themselves in, if their income and resources are not enough to allow a standard of living, which is relative to, customary, widely encouraged and approved in the societies in which they belong. To be poor is to be distant from the mainstream of society and to be excluded from the resources, opportunities and sources of subjective and objective well-being which are readily available to others. Poverty is deprivation due to a lack of resources, both material and non-material, e.g. income, housing, health, education, knowledge and culture. It requires a threshold to measure it. The condition of a human being who is deprived of the resources, means, choices and power necessary to acquire and maintain economic self sufficiency or to facilitate integration and participation in society. Our definition of poverty will shape our understanding of the problem, who is affected, the required interventions and the determination of potential beneficiaries for any anti-poverty strategy. For Mendelson (2005), it is critical to have a clear Canadian definition for us to tackle the problem and that we can not fully address poverty until we have defined poverty as a country. Understanding the relevant issues is also critical for policy and administrative practice and for determination of appropriate poverty measure(s) rather than blindly adopting a single poverty line. There is no one measure that is useful in all contexts. It is not even clear that a line is the best concept to use as a poverty measure. 4
6 SECTION 2: WHAT IS POVERTY? Theories of Poverty A review of concepts and theories of poverty may be helpful in understanding the relationship between public policies and poverty. Such policies and programs are often associated with robust theories for understanding causes and effects if they are to attain their objectives and goals. Public policies on social issues like poverty are often based on faulty premises and erroneous causal reasoning (Rein and Winship: 1999). For useful conclusions to be made, theories and policies have to be bridged by appropriate concepts and operational measures. These concepts and measures may be biased by the quantifiable indicators chosen to represent the key variables (Streeten 1998). Empirical research could also deviate significantly from theoretical reasoning (Foster 1994: 365), making research results less reliable and difficult to explain (Bradshaw, 2007). There are many competing anti-poverty theories in the literature, but it is important to choose what is relevant and believed to be responsible for the problem being addressed. Here, five theories of poverty are discussed including the following: Figure 1. Five Theories of Poverty and Community Anti-Poverty Programs Theory What causes Poverty? How does it work? Potential Community Development responses 1. Individual Individual laziness, bad choice, incompetence, inherent disabilities 2. Cultural Subculture adopts values that are nonproductive and are contrary to norms of success 3. Politicaleconomic structure Systematic barriers prevent poor from access and accomplishment in key social institutions including jobs, education, housing, health care, safety, political representation, etc. Competition rewards winners and punishes those who do not work hard and make bad choices Use community to the advantage of the poor; value diverse cultures, acculturation, and community building; alternative socialization through forming new peer groups Selection criteria directly or indirectly exclude some groups of persons based on inappropriate criteria Avoid and counter efforts to individualize poverty, provide assistance and safety net Head Start, after school, leadership development within subcultures, assetbased community development Community organizing and advocacy to gain political and economic power to achieve change; create alternative organizations Community examples to reduce poverty Drug rehabilitation, second chance programs, making safety net easier to access, use training and counseling to help poor individuals overcome problems Head Start, after-school leadership development within subcultures, assetbased community Policies to force inclusion and enforcement 5
7 SECTION 2: WHAT IS POVERTY? Theory What causes Poverty? How does it work? Potential Community Development responses Community examples to reduce poverty 4. Geographic Social advantages and disadvantages concentrate in separate areas 5. Cumulative and cyclical Spirals of poverty, problems for individuals (earnings, housing, health, education, self confidence) are interdependent and strongly linked to community deficiencies (loss of business and jobs, inadequate schools, inability to provide social services), etc. Source: Bradshaw (2007:10-11) Agglomeration, distance,economies of scale, and resource distributions reinforce differences Factors interact in complex ways. Community level crises lead to Individual crises and vice versa, and each cumulate to cause spirals of poverty National redistributions, concentration of development on local assets Breaking the spiral of poverty with a spiral of success through a comprehensive program that addresses both individual and community issues Redevelopment areas, downtowns, rural networking, urban revitalization Comprehensive CDC programs that build selfsufficiency in a community reinforced environment, programs that link individual and community organizations, asset-based approaches Measuring Poverty According to Sweetman (2008), Canada does not have an official Poverty Line, but it has a number of related statistical indicators which are sometimes informally called poverty lines. The most popular of the measures used is probably Statistics Canada s Low Income Cut-Off (LICO). Sweetman (2008) has classified poverty measures into absolute and relative measures. Absolute measures are fixed in real terms over time and they are constant after adjustment for inflation. The threshold is unresponsive to changes in living standards and to income growth. An example of an absolute measure is the Market Basket Measure (MBM) that was first developed by Human Resources and Social Development Canada (HRSDC) in The MBM measures the cost of purchasing a pre-determined basket of goods and services in specific places (markets). The basket is first defined for a reference family of four (two adults between the ages of 25-49, one girl aged 9, and one boy aged 13). The basket is calculated to allow the reference family to achieve an acceptable standard of living in accordance with the community. The basket includes: food from Health Canada s Nutrition Food Basket; shelter cost estimated as median rent (including utilities) for two- and three- bedroom apartments. transport costs; clothing and footwear costs estimated by Winnipeg Social Planning Council; and allowances for other expenses (personal, educational supplies, recreation and others) 6
8 SECTION 2: WHAT IS POVERTY? The income required to buy all items in the basket is disposable income net of required expenditures and deductions (such as mandatory payroll deductions, out of pocket spending for child care, out of pocket medical and health care expenses, alimony and child support). A relative situation exists if the basket is adjusted over time. In 2006, HRSDC released an updated MBM reflecting 2002 costs. The US official poverty line is also absolute with subsistence food budgets, but the basket has not been adjusted since inception in 1961 (using 1955 data). Market Basket Measure amounts for different family sizes for London are provided in the chart below. These figures have been calculated by applying annual inflation rates 3 to the 2002 figures released by HRSDC in Figure 2: Monthly Cost of Living Dollars 4,000 3,000 2,000 1, ,525 3,172 2,820 2,115 2,350 1,645 1, Family Size Relative Measures are responsive to economic inequality and /or polarization. Relative measures move 1-to-1 with income growth and are more concerned with income inequality & social inclusion. An example of a relative measure is Statistics Canada s Low Income Measure (LIM) which considers 50% of the after-tax annual income of the median family. As compared to the Common European Measure, the European Union, (EU) uses 60% and the Organization for Economic Co-Operation and Development (OECD) uses 70%, of the median. The LIM is not adjusted for different community sizes. LIM is often used for international comparisons. Figure 3: Annual Low Income Measures, 2005 number of children number of adults After Tax 1 14,604 20,446 24,827 29,208 33,589 37, ,446 24,827 29,208 33,589 37,970 42, ,287 30,668 35,050 39,431 43,812 48, ,129 36,510 40,891 45,272 49,654 54,035 Before Tax 1 16,734 23,428 28,448 33,468 38,488 43, ,428 28,448 33,468 38,488 43,508 48, ,121 35,141 40,162 45,182 50,202 55, ,815 41,835 46,855 51,875 56,896 61,916 3 Ministry of Finance. Ontario Budget March 25,
9 SECTION 2: WHAT IS POVERTY? A Mixture of absolute and relative elements is Statistics Canada s (Statcan) Low Income Cut-off (LICO). Here, the amount that an average family spends on food, clothing and shelter, plus 20% is adjusted. There is also low level adjustment for single, rural (2004) of $11,025 and a high level adjustment of 7 or more, major city (2004) of $44,197. The Cut-offs were most recently set in 1992 (key relative element), and then updated annually for inflation (absolute element). Statistics Canada has both Before Tax and After Tax LICO figures. Before tax figures reflect total income including government transfers, before the deduction of income taxes. After tax figures are preferred by Statcan because (1) they more fully reflect the redistributive impact of Canada's tax/transfer system and (2) since the purchase of necessities is made with after-tax dollars, it is logical to use people's after tax income to draw conclusions about their overall economic well-being. Sweetman (2008) had cautioned that the relative and absolute elements could go in opposite directions as in the case of Ireland being cited as experiencing income increases at all income levels while earnings inequality is increasing. While poverty is decreasing by absolute measures in Ireland, it is also increasing by relative terms. According to Sweetman, an equity-efficiency trade-off and substantial redistribution may reduce relative poverty, but could increase absolute poverty as well. It is much harder to reduce relative poverty than absolute poverty. Figure 4: Low Income Cut offs for London 2006 Annual Monthly 2006 Before Tax After Tax Before Tax After Tax 1 person $18,260 $14,859 $1,522 $1,238 2 persons $22,731 $18,085 $1,894 $1,507 3 persons $27,945 $22,519 $2,329 $1,877 4 persons $33,930 $28,095 $2,828 $2,341 5 persons $38,482 $31,992 $3,207 $2,666 6 persons $43,402 $35,480 $3,617 $2,957 7 or more persons $48,322 $38,967 $4,027 $3,247 Index of Deprivation The measures above focus on income (or the lack thereof), but definitions of poverty are broader than income. For this reason, many jurisdictions have developed measures that include measures of health, social participation, housing and access to basic goods and service in addition to income. These indices of deprivation are combined to arrive at a single value that can be compared over time. Items included in a deprivation index are those which have been empirically shown to have a correlation to low-income. For example, living in poor housing is correlated to having low-income. Therefore, quality of housing is an item to be included in the index of deprivation. Our review of jurisdictions using indices of deprivation to measure poverty identifies that a typical index would have eight to eleven items. Appendix 1 details the specific items used by Ireland to measure poverty. Canada does not currently have a standard index of deprivation, however, HRSDC has developed Indicators of Well Being that include measures related to health, social participation, leisure, family life, housing, work, learning, financial security, environment and security. The Federation of Canadian Municipalities has developed Quality of Life indicators that include many of these same indicators. 8
10 SECTION 2: WHAT IS POVERTY? Social Determinants of Health Measures associated with the social determinants of health respond to the fact that major health disparities persist between various groups in Canadian society and that to improve the health status of vulnerable groups, we need to address the root causes of health problems. These root causes are the social conditions in which people live and work, referred to as the social determinants of health. Evidence shows that most of the burden of disease and the bulk of health inequalities are caused by social determinants. These measures reflect a population health approach that recognizes that health is a capacity or resource rather than a state, a definition which corresponds more to the notion of being able to pursue one's goals, to acquire skills and education, and to grow. This broader notion of health recognizes the range of social, economic and physical environmental factors that contribute to health. The best articulation of this concept of health is "the capacity of people to adapt to, respond to, or control life's challenges and changes". 4 The social determinants of health include: income inequality (poverty); social inclusion and exclusion; employment and job security; working conditions; contribution of the social economy; early childhood care; education; food security and housing. Apart from those mentioned above, there are also other measures that are not called poverty lines, but they serve as indicators to measure the level of poverty. These include the Provincial cut-offs for social assistance receipt, cut-offs for the Goods and Services Tax rebate, National Child Tax Benefit, and Working Income Tax Benefit eligibility et cetera. 4 Public Health Agency of Canada. Population Health. What is the Population Health Approach. Pulled from the World Wide Web. April 11,
11 SECTION 3: INDICATORS OF POVERTY IN LONDON This profile of poverty in London is based on selected indicators that have historically been used to measure poverty in our community, including the number of people living below Statistic Canada s Low Income Cut Off (LICO), social assistance caseloads, food bank use, shelter use, and bankruptcy rates. While the numbers here identify how many people live with a lack of financial resources, the numbers also signify a population that could experience a social poverty as a result of being marginalized from mainstream society due to their economic class. Social Assistance Caseloads Due to low benefit levels, individuals and families relying on social assistance live with incomes that are inadequate to cover the cost of living in London (and elsewhere in Ontario and Canada). 5 These families have little to no savings from which to supplement social assistance, employment, child benefit and any other income they may receive. The total social assistance caseload (including both Ontario Works and Ontario Disability Support Program) has increased over the last four years, primarily due to the growing number of people with disabilities in London relying on the Ontario Disability Support Program. The number of individuals and families relying on this program has been increasing at a rate of about 3% per year for the past number of years and is projected to continue to increase. In 2007, an average of 8% 6 of London s population were in receipt of social assistance. In 2007, just over 4,500 families with children received social assistance through Ontario Works or the Ontario Disability Support Program. Just over 700 of families of these families were working. There are approximately 8,000 children under the age of 18 living in families receiving social assistance. For many, relying on social assistance is not just a financial burden, it sets them apart from mainstream society. Individuals and families relying on social assistance may have difficulty obtaining and maintaining work that pays enough to become self sufficient, finding and maintaining adequate housing, and participating in educational, recreational and leisure activities that are enjoyed by individuals with adequate income. Food Bank Use Individuals with inadequate incomes to cover the cost of living must often choose to pay the rent or purchase food. The choice to pay rent in order to avoid eviction results in individuals and families turning to food banks in order to feed their families. In 2006, 2,347 families visited the London food bank each month; 40% of the people served were children and youth. Families visited an average of 3.4 times per year. One quarter of these families had no source of income. 7 The Ontario Hunger Report (2007) records an even higher number of people visiting food banks in London. According to this report, 15,000 Londoners were served by food banks each month in Social Research and Planning, Community Services Department. City of London Social Policy Framework: Income Security Policy Paper. Draft. October, Calculation: 29,209 Ontario Works and Ontario Disability Support Program beneficiaries / 355,604 people 7 London Food Bank. Statistics. Pulled from the World Wide Web on March 20,
12 SECTION 3: INDICATORS OF POVERTY IN LONDON Emergency Shelter Use For the most part, individuals staying in emergency shelters have little or no income. Not only do most have little access to income, many may have significant personal challenges such as addictions or mental health issues that further marginalize them. Many may have experienced abuse in their formative years. Some may have grown up with little stability, such as children who were crown wards. As such, we are now seeing second and third generations of shelter users as frequent occupiers. Individuals and families fleeing domestic violence (primarily women and children) may need to stay in emergency housing (second stage housing or transitional housing). Many of these individuals and families are left with little to no financial resources. In 2007, an average of 934 individuals stayed in emergency shelters in London each month. This includes 827 adults and 107 children. 8 Bankruptcy Rates In 2007 the rate of personal bankruptcy and consumer proposal filing increased by 8.2%. Consumer bankruptcies increased from 29,851 in 2006 to 31,409 in 2007 for an increased of 5.2%. The total number of personal bankruptcies and consumer proposal 9 filings increased from 1,967 in 2006 to 2,196 in Low Income Rates The remainder of this section provides a profile of the different dimensions of low-income in London using before-tax low-income cut off (LICO) data provided by the Urban Poverty Project The Urban Poverty Project explores the dimensions of low-income using 2000 income data reported in the 2001 census. The most recent LICO figures for London are based on 2001 census data; 2006 census income data will be released in May, According to Sweetman, Canadian taxes are probably roughly proportional, with about the same percentage paid at all income levels, therefore, taking into account taxes and transfers has a very modest impact on relative poverty measures. London s figures are compared to Canada s, Ontario s and selected southern Ontario cities, including: Hamilton, St. Catherines, Kitchener, and Windsor. By comparing these four cities with London, we are comparing urban centres that are the core cities for their Census Metropolitan Areas (CMAs) and excludes the influence of suburban and rural areas. Focusing the comparison on southern Ontario cities ensures that factors such as proximity to the border, and the economic profile (particularly industry mix) are reasonably similar. Unless otherwise indicated, the data and the charts included in this section are created using data provided in the Urban Poverty Project 2007 reports. 8 Internal statistics based on Hostel Billings received from emergency shelters. 9 Consumer proposal definition: a deal that individuals who are unable to pay their debts may be able to make with their creditors as an alternative to filing for bankruptcy 10 Office of the Superintendent of Bankruptcy Canada. Insolvency Statistics and Economic Analysis. Consumer and Proposals, Division
13 SECTION 3: INDICATORS OF POVERTY IN LONDON In 2000, 17% of all Londoners living in private households had incomes below the LICO. London s low-income rate is higher than both Ontario and Canada (14.4% and 16%, respectively). 11 London s status as a large urban centre and core city of the Census Metropolitan Area (CMA) are factors contributing to this higher low-income rate. The impact of geography will be further explored later in this section. Certain groups in London are more likely to live with low-income. Children and youth age 0 to 24, recent immigrants, visible minorities, aboriginal identity people, individuals with disabilities, unattached individuals, people with lower education, and people with no or part-time employment have higher low-income rates than others. A few neighourhoods in London have high low-income rates (i.e. low-income rates of 30% or higher). The following sections delve into London s data to provide a better understanding of who is particularly vulnerable to living with low-income, the possible contributing reasons, and demographic trends that point to growing areas of concern. With a deeper understanding, it is hoped that the community will be able to strategically respond. Low Income by Geography People with low-income are more likely to live in Canada s largest cities (of which London is one) than they are to live in rural areas or urban areas outside of the largest cities. In 2001, 56% of individuals with low-income lived in Canada s 46 large urban cities (Census Subdivision CSD). Canada s largest cities have higher low-income rates than do rural and urban areas just outside the largest cities. The low-income rate among residents of large cities was 19.3% compared to a lowincome rate of 12.8% among Canadians living outside of these cities. 12 In light of the fact that low-income rates tend to be higher in larger core cities, London s low-income rate is not out of line. This is not to say that London s low-income rate is acceptable, but only that compares reasonably with other municipalities: London s population ranks as the 12 th largest of the 46 CSDs included in the Urban Poverty Project; 22 CSD s have higher low-income rates; Compared to CSDs in Southern Ontario, London s low-income rate is the same as Windsor s, lower than Hamilton s and higher than Kitchener s and St. Catherines rates. London s rank as the city with the second highest low-income rate is consistent with having the second highest population among these five southern Ontario cities. 11 Canadian Council of Social Development. Urban Poverty Project. 12 Canadian Council on Social Development. Urban Poverty Project Poverty by Geography. 12
14 SECTION 3: INDICATORS OF POVERTY IN LONDON Figure 5: Comparing Low-Income Rates in Select Southern Ontario CSDs Population population low-income rate Low-Income Rate 0 Kitchener St. Catherines Windsor London Hamilton CSD 0 In cities across Canada, there is evidence that individuals and families with low-incomes may be concentrated in certain neighbourhoods 13 within the city. The evidence of this concentration varies largely across cities. The Urban Poverty Project categorized neighbourhoods into five different groups based on low-income rates. Figure 6: Classification of Neighbourhoods based on Low-Income Rate Neighbourhood Classification Definition Low poverty low-income rate of less than 10% Moderate poverty low-income rate of 10% to 19.9% Moderately high poverty low-income rate of 20% to 29.9% High poverty low income rate of 30% to 39.9% Very high poverty low-income rate of 40% or over Compared to other central cities 14, London has fewer neighbourhoods that are classified as being moderately high to very high low-income neighbourhoods: Approximately 30% of London s neighbourhoods have low-income rates above 30% On average, 49% of neighbourhoods in central cities have low-income rates above 30%. 13 The Urban Poverty Project uses the Census Tract (CTs) to define a neighbourhood. CTs are small geographic units representing urban or rural neighbourhood-like communities created in census metropolitan areas. The population of CTs ranges from a minimum of 2,500 to a maximum of 8,000. They are defined to closely resemble what most people would think of as a neighbourhood. Within a CT, there are smaller geographic units, called Dissemination Areas (DAs). 14 The Urban Poverty Project uses the term central city, to describe the historic anchor city (CSD) of each metropolitan region. There are 30 central cities identified in the Urban Poverty 2007, Poverty by Georgraphy report. 13
15 SECTION 3: INDICATORS OF POVERTY IN LONDON Figure 7: Proportion of City Neighbourhoods with Low, Moderate, Moderately High, High and Very High Poverty Rates Proportion of All Neighbourhoods all central cities London low moderate moderately high high very high Neighbourhood Type London s low-income residents are more likely than Canada s low-income city residents to live in higher-income neighbourhoods: 50.3% of Londoners with low-income live in neighbourhoods that have low-income rates of less than 20%; For all central cities, 29% of individuals with low income live in neighbourhoods that have lowincome rates of less than 20%. These data point to a relatively high level of income mixing at the census tract level. Research suggests that the outcomes for lower-income children living in neighbourhoods that have low to moderately low poverty rates may be better than for low-income children living in neighbourhoods that have higher poverty rates. Within a census tract, however, there are many smaller neighbourhoods (DAs). It is within these smaller neighbourhoods that we may begin to see definite pockets of high levels of low-income rates. (Figure 8) 14

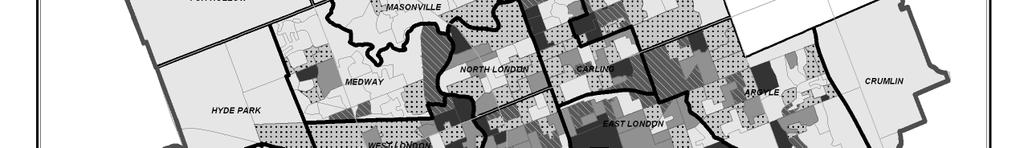
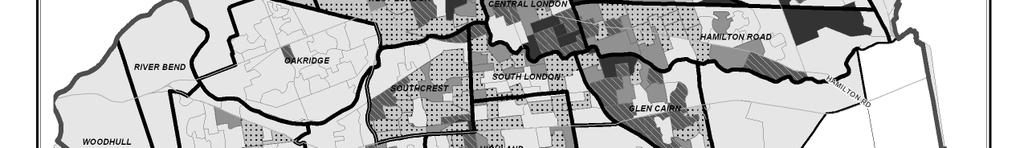
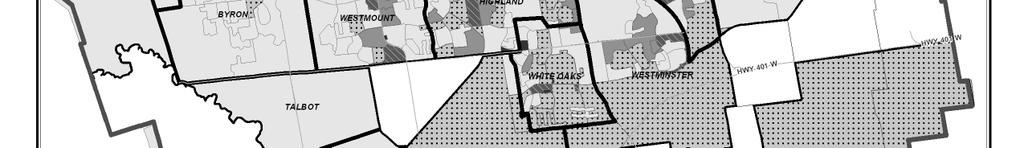


16 SECTION 3: INDICATORS OF POVERTY IN LONDON Figure 8: Low Income Levels of Neighbourhoods as Defined by Dissemination Area 15
17 SECTION 3: INDICATORS OF POVERTY IN LONDON Dimensions of Income Among Households Reliance on Government Transfers Households with lower incomes tend to have less employment and, consequently, fewer earnings than do other households. As a result, these households tend to rely to a greater extent on government transfers and income security programs. Given the low benefit levels of income security programs, households relying on income security programs are more likely to have low incomes. In 2000, the average total income of working age low-income London families ($14,099) was about one-fifth that of working age London families ($72,316) with incomes above the LICO for their family size. Earnings account for about 40% of this income ($5,547) and government transfers account for about 55% ($7,642). Investments and other income account for the remaining 5%. The proportion of working age families with low-income increases from 14.7% to 19.6% when employment earnings alone are considered. This means that government transfers are protecting a small proportion of families in London from living with low-income. The labour market, on its own, is not sufficient to protect these families from having low-income. Income Gap The gap between the low-income cut off and the average income of low-income families is referred to as the depth of poverty. Cities or regions with similar low-income rates but larger gaps have an overall worse state of low-income compared to those cities with smaller gaps. In London, the income gap between the LICO and the average income of a low-income working age family is $15,268. Figure 9: Comparing Overall Low-Income Rates with the Income Gap of Working Age Families by Selected Southern Ontario Cities Income Gap income gap low-income rate Kitchener St. Catherines Windsor London Hamilton CSD Low-Income Rate Figure 9 shows that London, Windsor and St. Catherines are similar in terms of both the incidence of low-income and the depth of poverty. Working age low-income families in London are better off than those in Kitchener but are in a worse state than Hamilton s low-income working families. Another type of income gap exists between those with the highest levels of income (the top 20%) and those with the lowest levels of income (the lowest 20%). Single/unattached individuals in the lowest quintile have incomes below $11,523 while those in the highest quintile have incomes greater than $44,213 for an income gap of $32,690. Families in the lowest quintile have incomes below $32,227 while those in the highest quintile have incomes above $101,800 for an income gap of $69,
18 SECTION 3: INDICATORS OF POVERTY IN LONDON Figure 10 shows that the distribution of income differs for each household type: 52% of senior families have incomes in the lowest two income quintiles Approximately 40% of working age singles, families and unattached seniors have incomes in the lower end of the income scale; 20% of working age families have incomes that are $69,573 lower than the 20% that have the highest incomes. Figure 10: Income Distribution (Quintiles) of Various Household Types % of Population 50% 40% 30% 20% 10% 0% working age unattached unattached senior working age family senior family lowest second third fourth top Family Type Employment and Education Educated and Low Income Working age individuals with less than grade 9 education are over-represented among the lowincome population: 36% of the working age population in London have less than grade 9 education; 46% of the low-income population (working age) have less than grade 9 education; One out of five working age individuals have low-income Education alone is not a guarantee to avoid low-income: the incidence of low-income among the working age population with post secondary education is 11%. Just over 39% of working age Londoners have post secondary certification. The Urban Poverty Project 2007 concluded that education levels do not explain the differences in low-income rates between cities but that other factors should be examined (such as other demographics like age composition and commuting patterns). Employed and Low Income Income and earnings data from the 2001 census show that employment was an important factor in decreasing the likelihood of falling below the LICO. However, a strong attachment to the labour market (i.e. working at least 49 weeks for 30 hours per week or more) was not a complete guarantee that a person would stay above the low-income cut off in London. Although employed people had a lower incidence of low-income, 12.7% of working age adults in London who worked at least 49 weeks in 2000, for 30 hours or more, still lived below the LICO. In Ontario, 38% of children living in low 17
19 SECTION 3: INDICATORS OF POVERTY IN LONDON income live in a family with a parent who is working in full-time, full-year work and the number of working poor families is increasing across Canada. 15 Figure 11: Employment Activity and Low Income Status Distribution of Population Employment Activity Total Low Income No annual employment 20% 45.6% Full time full year employment 44.7% 12.7% The Urban Poverty Project 2007 identifies that the quality of the local labour market impacts the likelihood of being employed and low-income. A city with fewer full-time and full-year jobs paying enough will have a higher incidence of low-income. Kitchener s lower incidence of low-income may be partially due to a higher level of employment activity compared to the other four cities: only 17% of Kitchener s working age population has no annual employment (compared to an average of 22%), and 50% have full-time, full-year employment (compared to an average of 44%). Other factors impacting low-income rates include the local mix of jobs, labour market demand, unionization rates and minimum wages. For example, a city with many people employed in low-end service occupations such as temporary, part-time and low-paid work in personal services, retail and the accommodation and food industries may have a higher low-income rate. High levels of employment in clerical, sales, service and labouring occupations may also contribute to higher lowincome rates as the incidence of low pay among full-time workers in these occupations was 30% or more. When we look at the data for the five southern Ontario cities we are comparing, it is curious that London has both the highest proportion of its working age population in high-skilled occupations and the lowest proportion in low-skilled occupations.(figure 10) This suggests that other factors than London s occupational mix are contributing to London s relatively high low-income rate. It is curious that London has the highest low-income rate among its high-skilled workers. (Figure10). The reasons for London s high low-income rate among individuals employed in high-skill occupations should be investigated. Figure 12: Occupation Skill Level and Low Income Status Proportion of Population in low-skilled occupations in high-skilled occupations Total (%) Low-Income (%) Total (%) Low-Income (%) Kitchener St. Catherines Windsor London Hamilton Campaign Child Poverty in Ontario Promises to Keep
20 SECTION 3: INDICATORS OF POVERTY IN LONDON Populations Vulnerable to Poverty This section of the report profiles four specific groups that are often particularly vulnerable to lowincome. Specifically: the presence of disability, Aboriginal status, immigration status and visible minority status. Persons with Work-Limiting Disabilities Persons with disabilities have higher low-income rates than persons without disabilities in all of the 46 cities examined in the Urban Poverty Project. Low-income rates for this population ranged from 14% to 46% compared to low-income rates ranging from 7% to 32% for persons without disabilities. Persons with disabilities are over-represented in the low-income population. This group comprised 10% to 22% of the total population in each of the 46 cities and comprised 15% and 31% of the total low-income population. In London, 19.1% of the population reported having some type of activity limitation or disability on their census form; 23.6% of this group have incomes below the LICO. Persons with disabilities in London comprise 26.9% of the low-income population. Of concern for London is that 29% of working age adults with disabilities have low-incomes. This lowincome rate is the second highest for this age group among the five Southern Ontario municipalities compared. Comparatively few seniors with disabilities in London have low-income, suggesting that many seniors with disabilities acquired the disability as they aged, and, therefore have access alternative income sources such as pensions and retirement income that they contributed to when working. Figure 13: Persons with Disabilities: Numbers and Low-Income Status, Select CSDs, 2000 % of People Kitchener St. Catherines Windsor London Hamilton CSD % of total population % of low-income population low-income rate, working age persons with disabilities low-income rate, seniors with disabilities Lower employment rates for persons with disabilities compared to other Canadians contributes to their higher low-income rate. In 2002, 53% of people with disabilities in Canada were employed compared to 76% of people without disabilities. Some of the factors contributing to this lower employment rate may include lack of access to assistive aids and devices necessary for 19
21 SECTION 3: INDICATORS OF POVERTY IN LONDON independence. Lack of access to assistive aids and devises and lower education levels may contribute to these lower employment levels. 16 Lower education levels may also contribute to lower employment. Among working-age adults with disabilities (aged 15 to 64), more than a third never completed high school, compared to a quarter of those without disabilities. While persons with disabilities generally have lower incomes and lower employment rates than persons without disabilities, working age women with disabilities are worse off than working age men with disabilities. The disability rate among women is higher 17 and the earning gap between men and women with disabilities mirrors the earning gap between men and women in general, with women earning 64% of what men earn. 18 Aboriginal Status Aboriginal people are over-represented among the low-income population and have a very high lowincome rate. Aboriginal people in London comprise 1.4% of the total population but represent 3.4% of the low-income population. In London, 41% of Aboriginal people lived with low-income. The proportion of Aboriginal children age 0 to 14 living below the LICO is even higher at 46.5% (compared to 20.4% of all children age 0 to 14). Nationally, 40% of off-reserve Aboriginal children live with lowincome. 19 Over half (51.2%) of Aboriginal youth age 15 to 24 live with low income. London s Aboriginal low-income rate of 41% is much higher compared to other municipalities, Ontario and Canada (ranging from 25% to 34%). The exception to this Hamilton, with an Aboriginal lowincome rate of 44%. Nationally, Aboriginal peoples in 2001 had an unemployment rate that was over twice as high as the general rate and Aboriginal workers earned only two-thirds of an average worker's wages. 20 The Aboriginal population in London is growing, increasing by 9.8% from 2001 to One out of five Aboriginals in London in 2006 are under the age of 14, a 1.4% increase from The total under 14 years population decreased by 5.3% in this same time period. The growth in the number of urban Aboriginals 21, including children points to the very real potential for an increase in the absolute and relative number of Aboriginals living with low-income in our community. 16 Community Services Department. City of London. City of London Social Policy Framework: Income Security Policy Paper. August, Statistics Canada. Physical and Activity Limitation Survey Fournier-Savard. Women with Disabilities. In Statistics Canada Women in Canada Campaign Needed: A Collaborative Urban Aboriginal Strategy that Works Report Card on Child Poverty in Canada 20 Campaign Needed: A Collaborative Urban Aboriginal Strategy that Works Report Card on Child Poverty in Canada 21 Some of this growth may be due to an increase in self reporting of Aboriginal status on the Census. 20
22 SECTION 3: INDICATORS OF POVERTY IN LONDON Contributing factors to this high low-income rate include: Lower education levels Higher unemployment rates Lower average earnings Higher likelihood of working in service industry and low-skill occupations High mobility levels. Aboriginal children and youth live with significant challenges and barriers, challenges and barriers that are linked to low-income and these include 22 : Aboriginal children and youth lack of access to education (from early learning to post secondary) and other opportunities; Erosion of family ties, culture and language that could help them grow up with confidence and self-esteem; Higher risk across almost all indicators of wellness. Their health cannot be disassociated from that of their families, communities and living conditions. Aboriginal housing is substandard and inadequate at rates disproportionate to that of the non-aboriginal. Homelessness is more prevalent; and Taking many Aboriginal children into care by child welfare authorities. Many Aboriginal children in care graduate to the justice system where Aboriginal young women, in particular, are too often victims of crime and where Aboriginal peoples are overrepresented among youth in conflict with the law and in prison. Recent analysis of Statistics Canada s Youth in Transition Survey suggests that low-income contributes to the relatively poor educational outcomes of Aboriginal youth. In grade 10, school drop out rates for Aboriginal youth increase dramatically. Aboriginal youth are less likely to leave highschool with a diploma or to continue on to higher education than other Canadians. University researchers analysing the income, education and employment outcome data of youth responding to this survey suggest that the need for additional income is an important factor in pulling Aboriginal youth out of high school early. 23 Immigrants Nationally, almost one quarter (24%) of immigrants live with low-income compared to 16.9% of Canadian-born individuals. Immigrants accounted for 36.7% of Canada s low-income population but made up just under 30% of the total population. Just over one-fifth (21.4%) of London s immigrants live with low-income (14,790 people). They make up one quarter (26.6%) of London s low-income population. The problem is more significant for recent immigrants (i.e. those who arrived between 1996 and 2001) with just over half (51%) living with low incomes. 22 National Council of Welfare. First Nations, Métis and Inuit Children and Youth: Time to Act Maxim, P. School Completion and Workforce Transitions Among Urban Aboriginal Youth. Presentation at University of Western Ontario. September,
Post-Secondary Education, Training and Labour September Profile of the New Brunswick Labour Force
 Post-Secondary Education, Training and Labour September 2018 Profile of the New Brunswick Labour Force Contents Population Trends... 2 Key Labour Force Statistics... 5 New Brunswick Overview... 5 Sub-Regional
Spryfield Highlights. Household Living Arrangements. The following are highlights from the 2016 Census.
 Highlights The following are highlights from the 2016 Census., as defined for United Way's Action for Neighbourhood Change, had a Census population of 11,700 in 2016. The outline shown to the right, and
SACOSS ANTI-POVERTY WEEK STATEMENT
 SACOSS ANTI-POVERTY WEEK STATEMENT 2013 2 SACOSS Anti-Poverty Statement 2013 SACOSS ANTI-POVERTY WEEK 2013 STATEMENT The South Australian Council of Social Service does not accept poverty, inequity or
Appendix A: Economic Development and Culture Trends in Toronto Data Analysis
 Appendix A: Economic Development and Culture Trends in Toronto Data Analysis Introduction The proposed lenses presented in the EDC Divisional Strategy Conversation Guide are based in part on a data review.
Community Social Profile Cambridge and North Dumfries
 Community Trends for 2013 in Cambridge, North Dumfries, Wellesley, Wilmot and Woolwich Community Social Profile - Cambridge and North Dumfries Published December 2014 Community Social Profile Cambridge
STRENGTHENING RURAL CANADA: Fewer & Older: The Coming Demographic Crisis in Rural Ontario
 STRENGTHENING RURAL CANADA: Fewer & Older: The Coming Demographic Crisis in Rural Ontario An Executive Summary 1 This paper has been prepared for the Strengthening Rural Canada initiative by: Dr. Bakhtiar
STRENGTHENING RURAL CANADA: Fewer & Older: Population and Demographic Crossroads in Rural Saskatchewan. An Executive Summary
 STRENGTHENING RURAL CANADA: Fewer & Older: Population and Demographic Crossroads in Rural Saskatchewan An Executive Summary This paper has been prepared for the Strengthening Rural Canada initiative by:
Artists and Cultural Workers in Canadian Municipalities
 Artists and Cultural Workers in Canadian Municipalities Based on the 2011 National Household Survey Vol. 13 No. 1 Prepared by Kelly Hill Hill Strategies Research Inc., December 2014 ISBN 978-1-926674-36-0;
Mapping Child Poverty: A Reality in Every Federal Riding
 Mapping Child Poverty: A Reality in Every Federal Riding End Child & Family Poverty in Canada On the eve of the 2015 federal election, Campaign 2000: End Child and Family Poverty in Canada has mapped the
Article Aboriginal Population Profile for
 Component of Statistics Canada Catalogue no. 89-638-X o. 20000 2006 Aboriginal Population Profiles for Selected Cities and Communities: Article 2006 Aboriginal Population Profile for 20 How to obtain more
Promoting the Common Good. Submission to the Standing Committee on Finance Pre-Budget Consultations
 Promoting the Common Good Submission to the Standing Committee on Finance Pre-Budget Consultations August, 2012 Our Vision CPJ is committed to seek human flourishing and the integrity of creation as our
An Equity Profile of the Southeast Florida Region. Summary. Foreword
 An Equity Profile of the Southeast Florida Region PolicyLink and PERE An Equity Profile of the Southeast Florida Region Summary Communities of color are driving Southeast Florida s population growth, and
How s Life in Austria?
 How s Life in Austria? November 2017 Austria performs close to the OECD average in many well-being dimensions, and exceeds it in several cases. For example, in 2015, household net adjusted disposable income
Social Profile of Oakville An Overview
 Social Profile of Oakville An Overview Prepared by Community Development Halton Funding support provided by the United Way of Oakville 2004 Community Development Halton, all rights reserved. Copies of
Assessment of Demographic & Community Data Updates & Revisions
 Assessment of Demographic & Community Data Updates & Revisions Scott Langen, Director of Operations McNair Business Development Inc. P: 306-790-1894 F: 306-789-7630 E: slangen@mcnair.ca October 30, 2013
Child and Family Poverty
 Child and Family Poverty Report, November 2009 Highlights In 2007, there were 35,000 (16.7%) children under age 18 living beneath the poverty line (before-tax Low Income Cut-off) in. has the third highest
How s Life in Canada?
 How s Life in Canada? November 2017 Canada typically performs above the OECD average level across most of the different well-indicators shown below. It falls within the top tier of OECD countries on household
Population and Dwelling Counts
 Release 1 Population and Dwelling Counts Population Counts Quick Facts In 2016, Conception Bay South had a population of 26,199, representing a percentage change of 5.4% from 2011. This compares to the
Social and Demographic Trends in Burnaby and Neighbouring Communities 1981 to 2006
 Social and Demographic Trends in and Neighbouring Communities 1981 to 2006 October 2009 Table of Contents October 2009 1 Introduction... 2 2 Population... 3 Population Growth... 3 Age Structure... 4 3
Persistent Inequality
 Canadian Centre for Policy Alternatives Ontario December 2018 Persistent Inequality Ontario s Colour-coded Labour Market Sheila Block and Grace-Edward Galabuzi www.policyalternatives.ca RESEARCH ANALYSIS
Employment and Immigration
 Employment and Immigration BUSINESS PLAN 2009-12 ACCOUNTABILITY STATEMENT The business plan for the three years commencing April 1, 2009 was prepared under my direction in accordance with the Government
Poverty: A Social Justice Issue. Jim Southard. Professor David Lucas. Siena Heights University
 Running head: POVERTY: A SOCIAL JUSTICE ISSUE Poverty: A Social Justice Issue Jim Southard Professor David Lucas Siena Heights University Poverty: A Social Justice Issue 2 Introduction: Is poverty a serious
Part 1: Focus on Income. Inequality. EMBARGOED until 5/28/14. indicator definitions and Rankings
 Part 1: Focus on Income indicator definitions and Rankings Inequality STATE OF NEW YORK CITY S HOUSING & NEIGHBORHOODS IN 2013 7 Focus on Income Inequality New York City has seen rising levels of income
How s Life in the United Kingdom?
 How s Life in the United Kingdom? November 2017 On average, the United Kingdom performs well across a number of well-being indicators relative to other OECD countries. At 74% in 2016, the employment rate
Chapter One: people & demographics
 Chapter One: people & demographics The composition of Alberta s population is the foundation for its post-secondary enrolment growth. The population s demographic profile determines the pressure points
Trends in low-income levels
 FEATURE ARTICLE Income Inequality and Low Income in Canada Garnett Picot Statistics Canada John Myles University of Toronto and Statistics Canada Trends in low-income levels and income inequality in Canada
Release of 2006 Census results Labour Force, Education, Place of Work and Mode of Transportation
 Backgrounder Release of 2006 Census results Labour Force, Education, Place of Work and Mode of Transportation On March 4, 2008 Statistics Canada released further results from the 2006 census focusing on
CENSUS BULLETIN #5 Immigration and ethnocultural diversity Housing Aboriginal peoples
 CENSUS BULLETIN #5 Immigration and ethnocultural diversity Housing Aboriginal peoples October 25, 217 Bulletin Highlights: 86.1 per cent of the Brampton s 216 surveyed population held a Canadian citizenship
How s Life in France?
 How s Life in France? November 2017 Relative to other OECD countries, France s average performance across the different well-being dimensions is mixed. While household net adjusted disposable income stands
STRENGTHENING RURAL CANADA: Fewer & Older: Population and Demographic Challenges Across Rural Canada A Pan-Canadian Report
 STRENGTHENING RURAL CANADA: Fewer & Older: Population and Demographic Challenges Across Rural Canada A Pan-Canadian Report This paper has been prepared for the Strengthening Rural Canada initiative by:
How s Life in Switzerland?
 How s Life in Switzerland? November 2017 On average, Switzerland performs well across the OECD s headline well-being indicators relative to other OECD countries. Average household net adjusted disposable
A Profile of CANADiAN WoMeN. NorTHerN CoMMuNiTieS
 A Profile of CANADiAN WoMeN in rural, remote AND NorTHerN CoMMuNiTieS DeMogrAPHiC Profile in 2006, the last census year for which data are currently available, approximately 2.8 million women resided in
Chile s average level of current well-being: Comparative strengths and weaknesses
 How s Life in Chile? November 2017 Relative to other OECD countries, Chile has a mixed performance across the different well-being dimensions. Although performing well in terms of housing affordability
Rural Manitoba Profile:
 Rural Manitoba Profile: A Ten-year Census Analysis (1991 2001) Prepared by Jennifer de Peuter, MA and Marianne Sorensen, PhD of Tandem Social Research Consulting with contributions by Ray Bollman, Jean
Spain s average level of current well-being: Comparative strengths and weaknesses
 How s Life in Spain? November 2017 Relative to other OECD countries, Spain s average performance across the different well-being dimensions is mixed. Despite a comparatively low average household net adjusted
2016 Census of Population Immigration, ethnocultural diversity and Housing
 2016 Census of Population Immigration, ethnocultural diversity and Housing www.statcan.gc.ca Telling Canada s story in numbers Kirstin Elliott Consulting Analyst November 9, 2017 Overview Review of 2016
Justice ACCOUNTABILITY STATEMENT
 BUSINESS PLAN 2000-03 Justice ACCOUNTABILITY STATEMENT This Business Plan for the three years commencing April 1, 2000 was prepared under my direction in accordance with the Government Accountability Act
Representative Workforce (Employment Equity) Strategy Guidelines
 Strategy Guidelines") Representative Workforce (Employment Equity) Strategy Guidelines The positives of a representative workforce verses an employment equity plan are that although both strategies have the same goal, the representative
Representative Workforce (Employment Equity) Strategy Guidelines The positives of a representative workforce verses an employment equity plan are that although both strategies have the same goal, the representative
How s Life in Slovenia?
 How s Life in Slovenia? November 2017 Slovenia s average performance across the different well-being dimensions is mixed when assessed relative to other OECD countries. The average household net adjusted
An Equity Assessment of the. St. Louis Region
 An Equity Assessment of the A Snapshot of the Greater St. Louis 15 counties 2.8 million population 19th largest metropolitan region 1.1 million households 1.4 million workforce $132.07 billion economy
How s Life in Mexico?
 How s Life in Mexico? November 2017 Relative to other OECD countries, Mexico has a mixed performance across the different well-being dimensions. At 61% in 2016, Mexico s employment rate was below the OECD
Who is poor in the United States? A Hamilton Project
 Report Who is poor in the United States? A Hamilton Project annual report Jay Shambaugh, Lauren Bauer, and Audrey Breitwieser Thursday, October 12, 2017 W ho are the millions of people living in poverty
Economic and Social Council
 United Nations Economic and Social Council Distr.: General 31 March 2015 Original: English English, French and Spanish only Committee on Economic, Social and Cultural Rights List of issues in relation
Rural Poverty in Canada. Robert Annis and Lonnie Patterson Rural Development Institute Brandon University
 Rural Poverty in Canada Robert Annis and Lonnie Patterson Rural Development Institute Brandon University Presentation Overview Poverty as a Human Rights Issue Poverty in Canada Poverty in Rural Canada
Item No Halifax Regional Council July 19, 2016
 P.O. Box 1749 Halifax, Nova Scotia B3J 3A5 Canada Item No. 14.4.1 Halifax Regional Council July 19, 2016 TO: SUBMITTED BY: Mayor Savage and Members of Halifax Regional Council Original Signed Councillor
WORKFORCE ATTRACTION AS A DIMENSION OF REGIONAL COMPETITIVENESS
 RUR AL DE VELOPMENT INSTITUTE WORKFORCE ATTRACTION AS A DIMENSION OF REGIONAL COMPETITIVENESS An Analysis of Migration Across Labour Market Areas June 2017 WORKFORCE ATTRACTION AS A DIMENSION OF REGIONAL
Employment, Education and Income
 This is one in a series of fact sheets that provide a profile of immigrants in. Understanding the makeup of our community is important for planning programs and services. Between 2006 and 2011, 15,465
CLOSING THE FRONT DOOR ON WELFARE IN BC
 DENIED ASSISTANCE CLOSING THE FRONT DOOR ON WELFARE IN BC By Bruce Wallace, Seth Klein and Marge Reitsma-Street S U M M A R Y The number of people receiving welfare in BC has been on the decline since
How s Life in Ireland?
 How s Life in Ireland? November 2017 Relative to other OECD countries, Ireland s performance across the different well-being dimensions is mixed. While Ireland s average household net adjusted disposable
How s Life in Denmark?
 How s Life in Denmark? November 2017 Relative to other OECD countries, Denmark generally performs very well across the different well-being dimensions. Although average household net adjusted disposable
STRENGTHENING RURAL CANADA: Fewer & Older: The Coming Population and Demographic Challenges in Rural Newfoundland & Labrador
 STRENGTHENING RURAL CANADA: Fewer & Older: The Coming Population and Demographic Challenges in Rural Newfoundland & Labrador An Executive Summary 1 This paper has been prepared for the Strengthening Rural
The Province of Prince Edward Island Food Insecurity Poverty Reduction Action Plan Backgrounder
 The Province of Prince Edward Island Food Insecurity Poverty Reduction Action Plan Backgrounder 5/17/2018 www.princeedwardisland.ca/poverty-reduction Food Insecurity SUMMARY Access to sufficient quantities
British Columbia Poverty Reduction Strategy
 British Columbia Poverty Reduction Strategy Submission by The Canadian Union of Public Employees British Columbia Division Paul Faoro, President March 29, 2018 The Canadian Union of Public Employees British
Aboriginal Youth, Education, and Labour Market Outcomes 1
 13 Aboriginal Youth, Education, and Labour Market Outcomes 1 Jeremy Hull Introduction Recently, there have been many concerns raised in Canada about labour market shortages and the aging of the labour
How s Life in Hungary?
 How s Life in Hungary? November 2017 Relative to other OECD countries, Hungary has a mixed performance across the different well-being dimensions. It has one of the lowest levels of household net adjusted
How s Life in the Czech Republic?
 How s Life in the Czech Republic? November 2017 Relative to other OECD countries, the Czech Republic has mixed outcomes across the different well-being dimensions. Average earnings are in the bottom tier
Food Insecurity among Latin American Recent Immigrants in Toronto. Dr. Mandana Vahabi. Dr. Cecilia Rocha. Daphne Cockwell School of Nursing
 Food Insecurity among Latin American Recent Immigrants in Toronto Dr. Mandana Vahabi Daphne Cockwell School of Nursing Dr. Cecilia Rocha School of Nutrition Centre for Studies in Food Security Ryerson
Italy s average level of current well-being: Comparative strengths and weaknesses
 How s Life in Italy? November 2017 Relative to other OECD countries, Italy s average performance across the different well-being dimensions is mixed. The employment rate, about 57% in 2016, was among the
Article Aboriginal Population Profile for
 Component of Statistics Canada Catalogue no. 89-638-X o. 20 000 2006 Aboriginal Population Profiles for Selected Cities and Communities: Article 2006 Aboriginal Population Profile for How to obtain more
How s Life in New Zealand?
 How s Life in New Zealand? November 2017 On average, New Zealand performs well across the different well-being indicators and dimensions relative to other OECD countries. It has higher employment and lower
Indigenous Housing Strategy Engagement Table A Coordinated Vision for Indigenous Housing. November 14, 2016
 Indigenous Housing Strategy Engagement Table A Coordinated Vision for Indigenous Housing November 14, 2016 The Indigenous Housing Strategy Engagement Table is a collective of Indigenous organizations and
How s Life in Finland?
 How s Life in Finland? November 2017 In general, Finland performs well across the different well-being dimensions relative to other OECD countries. Despite levels of household net adjusted disposable income
How s Life in Belgium?
 How s Life in Belgium? November 2017 Relative to other countries, Belgium performs above or close to the OECD average across the different wellbeing dimensions. Household net adjusted disposable income
Regina City Priority Population Study Study #2 - Immigrants. August 2011 EXECUTIVE SUMMARY
 Regina City Priority Population Study Study #2 - Immigrants August 2011 EXECUTIVE SUMMARY Executive Summary The City of Regina has commissioned four background studies to help inform the development of
Telephone Survey. Contents *
 Telephone Survey Contents * Tables... 2 Figures... 2 Introduction... 4 Survey Questionnaire... 4 Sampling Methods... 5 Study Population... 5 Sample Size... 6 Survey Procedures... 6 Data Analysis Method...
The Changing Face of Canada s Public Education System. Discussion Paper for the Pan-Canadian Consultation Process. By Laura Eggertson.
 The Changing Face of Canada s Public Education System Discussion Paper for the Pan-Canadian Consultation Process By Laura Eggertson Fall 2006 Produced by The Learning Partnership with funding from TD Bank
how neighbourhoods are changing A Neighbourhood Change Typology for Eight Canadian Metropolitan Areas,
 how neighbourhoods are changing A Neighbourhood Change Typology for Eight Canadian Metropolitan Areas, 1981 2006 BY Robert Murdie, Richard Maaranen, And Jennifer Logan THE NEIGHBOURHOOD CHANGE RESEARCH
Status of Women. Business Plan Accountability Statement. Ministry Overview. Strategic Context
 Business Plan 2018 21 Status of Women Accountability Statement This business plan was prepared under my direction, taking into consideration our government s policy decisions as of March 7, 2018. original
How s Life in Australia?
 How s Life in Australia? November 2017 In general, Australia performs well across the different well-being dimensions relative to other OECD countries. Air quality is among the best in the OECD, and average
NATIONAL HOUSEHOLD SURVEY: LABOUR FORCE, EMPLOYMENT, AND INCOME
 Clause No. 15 in Report No. 1 of was adopted, without amendment, by the Council of The Regional Municipality of York at its meeting held on January 23, 2014. 15 2011 NATIONAL HOUSEHOLD SURVEY: LABOUR FORCE,
2016 Census Bulletin: Education and Labour
 2016 Census Bulletin: Education and Labour Kingston, Ontario Census Metropolitan Area (CMA) The 2016 Census Day was May 10, 2016. In the fall of 2017, Statistics Canada released various data sets from
How s Life in Estonia?
 How s Life in Estonia? November 2017 Relative to other OECD countries, Estonia s average performance across the different well-being dimensions is mixed. While it falls in the bottom tier of OECD countries
How s Life in the United States?
 How s Life in the United States? November 2017 Relative to other OECD countries, the United States performs well in terms of material living conditions: the average household net adjusted disposable income
2011 HIGH LEVEL MEETING ON YOUTH General Assembly United Nations New York July 2011
 2011 HIGH LEVEL MEETING ON YOUTH General Assembly United Nations New York 25-26 July 2011 Thematic panel 2: Challenges to youth development and opportunities for poverty eradication, employment and sustainable
Sustainable Cities. Judith Maxwell. Canadian Policy Research Networks. Canadian Institute of Planners. Halifax, July 7, 2003
 Sustainable Cities Judith Maxwell Canadian Policy Research Networks Canadian Institute of Planners Halifax, July 7, 2003 A New Context For Cities Cities and communities are struggling to adapt to pressures
How s Life in Germany?
 How s Life in Germany? November 2017 Relative to other OECD countries, Germany performs well across most well-being dimensions. Household net adjusted disposable income is above the OECD average, but household
How s Life in Poland?
 How s Life in Poland? November 2017 Relative to other OECD countries, Poland s average performance across the different well-being dimensions is mixed. Material conditions are an area of comparative weakness:
A Barometer of the Economic Recovery in Our State
 THE WELL-BEING OF NORTH CAROLINA S WORKERS IN 2012: A Barometer of the Economic Recovery in Our State By ALEXANDRA FORTER SIROTA Director, BUDGET & TAX CENTER. a project of the NORTH CAROLINA JUSTICE CENTER
Social and Economic Indicators
 Social and Economic Indicators February, 2004 1 Overview SSP Vision and Goals How do we measure progress Indicators what, why, who Key indicators for social and economic development 2 SSP Vision Healthy,
How s Life in Norway?
 How s Life in Norway? November 2017 Relative to other OECD countries, Norway performs very well across the OECD s different well-being indicators and dimensions. Job strain and long-term unemployment are
Aboriginal Occupational Gap: Causes and Consequences
 5 Aboriginal Occupational Gap: Causes and Consequences Costa Kapsalis Introduction While significant improvements in the labour market outcomes of Aboriginal people have been achieved over the last decade,
POVERTY in the INLAND EMPIRE,
 POVERTY in the INLAND EMPIRE, 2001-2015 OCTOBER 15, 2018 DAVID BRADY Blum Initiative on Global and Regional Poverty, School of Public Policy, University of California, Riverside ZACHARY PAROLIN University
Poverty. for people with low incomes (2007) 9 Fact sheet at 9. Sheldon Chumir Foundation for Ethics in Leadership, 2007)at5.
 9 Fact sheet at 9. Sheldon Chumir Foundation for Ethics in Leadership, 2007)at5.") Poverty Being poor limits your choices and is not simply a matter of bad budgeting. Managing on a very low income is like a 7-day per week job from which there is no vacation or relief. Poverty grinds
Poverty Being poor limits your choices and is not simply a matter of bad budgeting. Managing on a very low income is like a 7-day per week job from which there is no vacation or relief. Poverty grinds
A Social Profile of the Halton Visible Minority Population
 Halton Social Planning Council and Volunteer Centre A Social Profile of the Halton Visible Minority Population December 2000 Prepared by Ted Hildebrandt Senior Planner Lyn Apgar - Research Associate December
Demographic Change: The Changing Character of Toronto s Inner City, 1961 to 2001
 Demographic Change: The Changing Character of Toronto s Inner City, 1961 to 2001 SERIES 2 Maps based on the Canadian Census, using Census Tract level data The CURA Study Area: Bathurst St, Bloor St., Roncesvales
Profile of the New Brunswick Labour Force
 Profile of the New Brunswick Labour Force October 213 213 Profile of the New Brunswick Labour Force Province of New Brunswick PO 6, Fredericton NB E3B 5H1 www.gnb.ca 213.11 ISBN 978-1-465-247-1 (Print
Promoting Work in Public Housing
 Promoting Work in Public Housing The Effectiveness of Jobs-Plus Final Report Howard S. Bloom, James A. Riccio, Nandita Verma, with Johanna Walter Can a multicomponent employment initiative that is located
The 2012 Aboriginal Peoples Survey
 The 2012 Aboriginal Peoples Survey Education and Employment A survey of First Nations people living off reserve, Métis and Inuit Tim Leonard October 2013 Outline Context: What does the NHS tell us? Background
Ontario Council of Agencies Serving Immigrants (OCASI) Roundtable Report for Social Assistance Review 2011
 Roundtable Report for Social Assistance Review 2011") Ontario Council of Agencies Serving Immigrants (OCASI) Roundtable Report for Social Assistance Review 2011 Introduction This report by the Ontario Council of Agencies Serving Immigrants (OCASI) is based
Ontario Council of Agencies Serving Immigrants (OCASI) Roundtable Report for Social Assistance Review 2011 Introduction This report by the Ontario Council of Agencies Serving Immigrants (OCASI) is based
How s Life in the Netherlands?
 How s Life in the Netherlands? November 2017 In general, the Netherlands performs well across the OECD s headline well-being indicators relative to the other OECD countries. Household net wealth was about
How s Life in the Slovak Republic?
 How s Life in the Slovak Republic? November 2017 Relative to other OECD countries, the average performance of the Slovak Republic across the different well-being dimensions is very mixed. Material conditions,
RESEARCH BRIEF: The State of Black Workers before the Great Recession By Sylvia Allegretto and Steven Pitts 1
 July 23, 2010 Introduction RESEARCH BRIEF: The State of Black Workers before the Great Recession By Sylvia Allegretto and Steven Pitts 1 When first inaugurated, President Barack Obama worked to end the
D2 - COLLECTION OF 28 COUNTRY PROFILES Analytical paper
 D2 - COLLECTION OF 28 COUNTRY PROFILES Analytical paper Introduction The European Institute for Gender Equality (EIGE) has commissioned the Fondazione Giacomo Brodolini (FGB) to carry out the study Collection
Greater Golden Horseshoe Transportation Plan
 Greater Golden Horseshoe Transportation Plan Socio-Economic Profile Executive Summary October 2017 PREPARED BY Urban Strategies Inc. and HDR for the Ministry of Transportation SOCIO-ECONOMIC PROFILE -
How s Life in Portugal?
 How s Life in Portugal? November 2017 Relative to other OECD countries, Portugal has a mixed performance across the different well-being dimensions. For example, it is in the bottom third of the OECD in
Economic Security. For information on the resources used, please contact Dawn Juker at or call (208)
") Economic Security Diocese Boise Family Economic Security in An increasing number families are becoming burdened with the effects poverty and financial hardships, and many are turning to the state for financial
Economic Security Diocese Boise Family Economic Security in An increasing number families are becoming burdened with the effects poverty and financial hardships, and many are turning to the state for financial
reducing barriers to social inclusion and social cohesion
 In from the Margins, Part II: reducing barriers to social inclusion and social cohesion June 2013 Standing Senate Committee on Social Affairs, Science and Technology The Honourable Kelvin K. Ogilvie, Chair
How s Life in Sweden?
 How s Life in Sweden? November 2017 On average, Sweden performs very well across the different well-being dimensions relative to other OECD countries. In 2016, the employment rate was one of the highest
Japan s average level of current well-being: Comparative strengths and weaknesses
 How s Life in Japan? November 2017 Relative to other OECD countries, Japan s average performance across the different well-being dimensions is mixed. At 74%, the employment rate is well above the OECD
SOCIAL JUSTICE AND ABORIGINAL POVERTY IN CANADA
 SOCIAL JUSTICE AND ABORIGINAL POVERTY IN CANADA DISTRIBUTION OF WEALTH IN CANADA Section of Population Top 20% 75 Second to top 17.4 Middle 20% 6.9 Second from bottom 1.3 Bottom 20% Share (%) of Wealth