Population and Dwelling Counts
|
|
|
- Aubrey Hodge
- 6 years ago
- Views:
Transcription

1 Release 1 Population and Dwelling Counts Population Counts Quick Facts In 2016, Conception Bay South had a population of 26,199, representing a percentage change of 5.4% from This compares to the provincial average growth of 1.0%. In the last 15 years, Conception Bay South has had a total population growth of 6,427. In the last 5 years, the average annual growth rate has been 1.1% or 270 residents per year. Comparatively, the Province has grown 0.2% per year, while Canada has grown 1.0% per year. Conception Bay South is part of the census metropolitan area of St. John s, which grew 4.6% in the last 5 years.


2 Release 1 Population and Dwelling Counts Population Comparison


3 Release 1 Population and Dwelling Counts Dwelling Counts Quick Facts In 2016, Conception Bay South had 10,553 private dwellings. The change in private dwellings from 2011 was 10.8%. For the St. John s CMA as a whole, the number of private dwellings increased 9.2%. Conception Bay South has a population density of persons per square kilometre. This compares to the provincial density of 1.4 persons per square kilometre.
4 Release 3 Type of Dwelling Dwelling Characteristics

5 Release 3 Type of Dwelling Persons in Private Households Average Number of Persons in Private Households Quick Facts The average number of persons per household in Conception Bay South is 2.6. In comparison to 2011, this has decreased. When compared to St. John s CMA, the Province and Nation, Conception Bay South has a higher average of persons per household. The largest growth of structure type between 2011 and 2016 continues to be singledetached homes with 410 new homes added. The second largest growth in structure types was in apartment buildings with fewer than five storeys. Comparably, Conception Bay South proportionally added more apartment buildings to its existing stock than the rest of St. John s CMA.

6 Release 5 Families, Household and Marital Status Marital Status Quick Facts Overall the total population by marital status in Conception Bay South has grown across all marital status segments. Married or living with a common-law partner grew by 6% from 2011 to 2016 compared to those who are single or never legally married, which grew by 7%. In 2016, 62% of the male population and 58% of the female population were married or living with a common-law partner. In 2016, 24% of the total male population and 28% of the total female population were single (never married).
 compared to 5% growth in the remaining communities within the St. John s CMA, 1% growth in the province and 5% growth in Canada.")
7 Release 5 Families, Household and Marital Status Total Number of Census Families in Private Households Quick Facts The total number of census families in private households in Conception Bay South grew by 6% from 2011 to 2016 (net growth of 425 persons) compared to 5% growth in the remaining communities within the St. John s CMA, 1% growth in the province and 5% growth in Canada. The trend toward smaller families is not unique to Conception Bay South. In the St. John s CMA, minus Conception Bay South, the total number of census families in private households grew by 5% and can be largely attributed to the 10% increase of two person families. Provincially, however, there was an overall decline in census families in private households of three persons or more.

8 Release 5 Families, Household and Marital Status Total Number of Children in Census Families Quick Facts Families in Conception Bay South are largely comprised of couple families with one or two children accounting for 90% of couple families. In comparison, 93% of lone parents have either one or two children. Overall couple families represent 3,720 of census families with children. In comparison, lone parent census families with children totalled 1,170. Approximately 44% of the couple families had one child compared to 63% of lone parents with one child.

9 Release 5 Families, Household and Marital Status Families with Children Aged 25 and Over Quick Facts In 2016, 705 census families had children 25 years and older living in the family s primary residence. This represented a 7% growth from 2011 counts and a 14% proportion of all census families. Comparatively, Conception Bay South has a lower percentage of census families with children 25 years and older than both the provincial and national averages. From 2011 to 2016, Canada had a growth of 15% in census families with children 25 years and older.

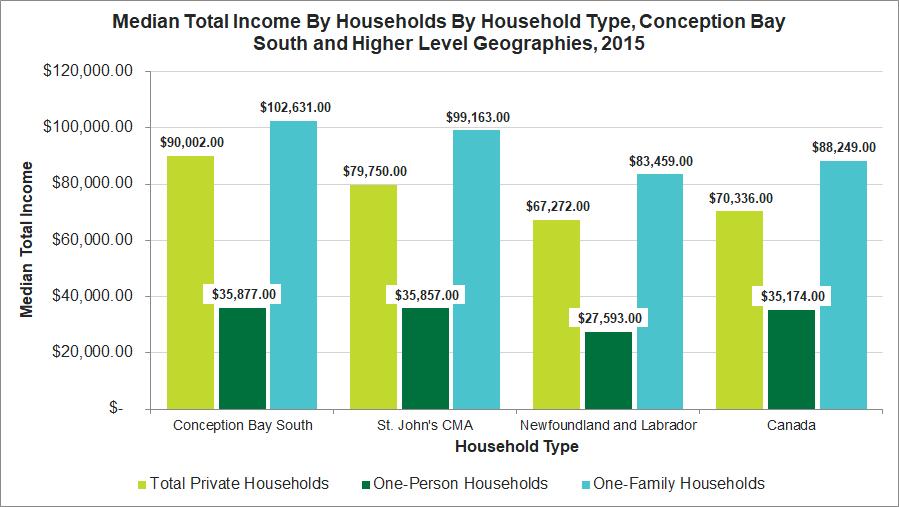
10 Release 7 Income Median Income of Households Quick Facts In 2015, the median total income of households in Conception Bay South was $90,002, a change of 35.5% from $66,411 in In 2015, 30% of the total households in Conception Bay South had an income of $125,000 or higher. In 2015, the median total income of households in Conception Bay South was higher than St. John s CMA, the province, and the nation totals.

11 Release 7 Income
12 Release 7 Income Low Income In 2015, 2,090 persons or 8.1% were in low income, while in 2005, 12.5% of the persons in Conception Bay South lived in low income. 9.8% of children between the ages of 5-9 and 5.2% of youth between the ages of had low income status in % of persons between years had a low-income rate. For seniors aged 60-64, the low income incidence was 9.7%. Persons living in lone-parent families had a higher rate of low income at 23.9%, while those living in couple families without children had a lower rate of 4.4%.

13 Release 7 Income
, Registered Pension Plans (RPPs), or Tax-free Savings Accounts")
14 Release 7 Income Savings In 2015, 68.6% of households in Conception Bay South contributed to Registered Retirement Savings Plans (RRSPs), Registered Pension Plans (RPPs), or Tax-free Savings Accounts (TFSAs). In Newfoundland and Labrador, 54.5% of households contributed to an account while 65.2% of households contributed nationally.

15 Release 7 Income

16 Release 7 Income Income of Couples In 31.7% of couples in Conception Bay South, each partner had fairly equal incomes in 2015 while men had higher income in 54.4% of couples and women had higher income in the remaining 14.1% of couples. For Canada overall, each partner had fairly equal incomes in 32.0% of couples with men having the higher income in 50.7% of couples and women having higher income in 17.3% of couples.
17 Release 8 Immigration and Ethnocultural Diversity Immigrant Population Percentage of immigrant population decreased in Conception Bay South from 2011 to 2016, while it increased in St. John s CMA, Newfoundland, and Canada. Immigrant population in Conception Bay increased from 2011 to 2016 in the age groups of 0-15, and years. Immigrant population decreased from 2011 to 2016 in age groups and 65+. Conception Bay saw an increase in immigration from the Americas, and Asia and Oceania during the periods. Immigration from Europe decreased, and stayed the same from Africa.
18 Release 8 Immigration and Ethnocultural Diversity
19 Release 8 Immigration and Ethnocultural Diversity Generation Status Conception Bay South sees 95.3% of its immigrant population as a third generation, with 1.8% and 2.9% being first and second generation respectively. When compared to Canada, Conception Bay South has a significantly low first and second generation immigration percentage.
20 Release 8 Immigration and Ethnocultural Diversity Visible Minority Population While small (0.5%), Conception Bay South saw an increase in the percentage of visible minorities from 2011 to However, this increase in visible minorities was far outpaced by the increase in St. John s CMA and Canada (5% in St. John s and 4.2% in Canada).
21 Release 8 Immigration and Ethnocultural Diversity Ethnic and Cultural Origins of the Population Conception Bay South s population majority originates from other Northern American origins, with the second most coming from European origins.

22 Release 9 Housing Housing Tenure Conception Bay South experiences a higher percentage of home ownership than St. John s, Newfoundland, and Canada. Renting percentage in Conception Bay South is lower on average than St. John s CMA, Newfoundland, and Canada.

23 Release 9 Housing Housing Suitability, Adequacy and Affordability A lower percentage of Conception bay South s population expressed need for dwelling repairs in comparison to St. John s CMA, the province, and the country. In comparison to higher level geographies, Conception Bay South had the lowest percentage of households not in suitable housing. Conception Bay South also had the lowest percentage of households spending 30% or more of 2015 total income on shelter costs.

24 Release 9 Housing Housing Cost Conception Bay South experienced a higher monthly cost of owned housing per month when compared to the the province, and the country, but less than the average monthly cost in St. John s CMA. The average monthly rental cost in Conception bay South was lower than the Canadian average but higher than both Newfoundland, and St. John s CMA.

25 Release 11 Education Educational Attainment by Population Quick Facts In 2016, 89.1% of people aged 25 to 64 in Conception Bay South had a high school diploma or equivalency certificate, compared with 86.3% in Canada. In Conception Bay South, 18.1% of people aged 25 to 64 had a bachelor s degree or higher, while 35.5% had a college, CEGEP or other non-university certificate or diploma as their highest level education, and 7.5% had an apprenticeship certificate as their highest.
26 Release 11 Education Field of Study Quick Facts Conception Bay South outranked all other comparator regions (St. John s CMA, Newfoundland, and Canada) in percentage of field of study for population aged 25 to 64 in Personal, Protective and Transportation Services. The highest proportion of field of study in Conception Bay South is Architecture, Engineering and Related Fields with 14% of the population aged 25 to 64 having studied in this field.

 fields of study such as business, humanities, health, arts,")
27 Release 11 Education STEM vs BHASE Quick Facts In Conception Bay South, 11.8% of women aged 25 to 64 with a bachelor s degree or higher studied STEM (science, technology, engineering and mathematics) compared with 36% of men. On the other hand, 88.5% of these women studied BHASE (non-stem) fields of study such as business, humanities, health, arts, social sciences, education, etc., compared with 64% of men.
 Population who studied in the same")
28 Release 11 Education Location of Study Quick Facts The largest percentage of level of education studying outside of Canada was Bachelor s Degree or Higher with 3%. Across all categories (Apprenticeship or Trades Certificate Diploma, College, CEGEP, or other Non- University Certificate of Diploma, Bachelor s Degree or Higher) Population who studied in the same province of residence was significantly higher than percentage of those studying outside of the province of residence.

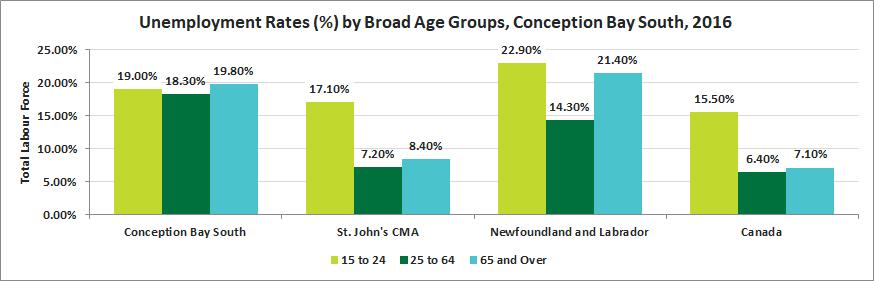
29 Release 12 Labour Participation and Unemployment Rates Unemployment rates in Conception Bay South increased for the age group of 15 to 24, and 65+ between 2006 and From 2006 to 2016, unemployment decreased for the 25 to 54 age group. Employment Rates in Conception Bay South increased from 2006 to 2016 for all age groups, but declined for the 15 to 24 age group from to Participation Rates increased for age groups 25+ but decreased for the 15 to 24 age group between 2006 and Conception Bay South had the highest unemployment rate compared to St. John s CMA, Newfoundland, and Canada for all age groups except 15 to 24.

30 Release 12 Labour


31 Release 12 Labour Employee vs Self Employed From 2006 to 2016 there was a decrease in the percentage of the self-employed labour force for the age groups of 25 to 64. Percentage of self-employed individuals for the age group of 65+ decreased from 2006 to 2016 by 12.4%. Conception Bay South had the second highest percentage of self-employed individuals when comparing to St. John s CMA, Newfoundland and Labrador, and Canada. Percentage of the workforce who are employees was second lowest for Conception Bay South in comparison to St. John s CMA, Newfoundland and Labrador, and Canada.
32 Release 12 Labour Industry Characteristics Conception Bay South experienced the greatest negative net growth in Administrative and Support, Waste management and Remediation Services, and the greatest positive net growth in Construction between 2011 and 2016 for employed labour force aged 15 years and over. Overall there was a positive net growth of 760 for the total employed labour force between 2011 and Percentage of employed labour force in Conception Bay South aged 15 years and over was higher than all other comparator geographies for in Construction, and Public Administration. The highest percentage of the labour force in Conception Bay South was employed in the Health Care and Social Assistance sub-sector (13.8%) followed by Retail Trade (12.4%). Total Distribution of the Employed Labour Force Aged 15 Years and Over By Industry Sectors, Conception Bay South, 2011 and Net Growth Agriculture, Forestry, Fishing and Hunting Mining, Quarrying, and Oil and Gas Extraction Utilities Construction Manufacturing Wholesale Trade Retail Trade Transportation and Warehousing Information and Cultural Industries Finance and Insurance Real Estate and Rental and Leasing Professional, Scientific and Technical Services Management of Companies Administrative and Support, Waste Management and Remediation Services Educational Services Health Care and Social Assistance Arts, Entertainment and Recreation Accommodation and Food Services Other Services (except Public Administration) Public Administration Total
33 Release 12 Labour Percentage of the Employed Labour Force Aged 15 Years and Over By Industry Sectors, Conception Bay South and Higher Level Geographies, 2016 Conception Bay South St. John s CMA NFLD Canada Agriculture, Forestry, Fishing and Hunting 1.00% 0.80% 2.60% 2.40% Mining, Quarrying, and Oil and Gas Extraction 4.10% 3.30% 3.80% 1.40% Utilities 1.50% 1.20% 1.10% 0.80% Construction 8.50% 7.40% 8.90% 7.10% Manufacturing 4.90% 4.00% 6.00% 8.80% Wholesale Trade 2.10% 2.90% 2.40% 3.70% Retail Trade 12.90% 12.50% 13.30% 11.50% Transportation and Warehousing 4.10% 4.20% 4.90% 4.80% Information and Cultural Industries 2.10% 2.40% 1.60% 2.30% Finance and Insurance 2.80% 3.00% 2.30% 4.50% Real Estate and Rental and Leasing 1.40% 1.40% 1.00% 1.90% Professional, Scientific and Technical Services 6.90% 7.00% 4.60% 7.40% Management of Companies 0.00% 0.10% 0.10% 0.20% Administrative and Support, Waste Management and Remediation Services 3.00% 3.20% 2.80% 4.20% Educational Services 7.50% 8.60% 7.80% 7.50% Health Care and Social Assistance 13.90% 14.80% 16.00% 12.10% Arts, Entertainment and Recreation 1.10% 1.60% 1.20% 2.00% Accommodation and Food Services 4.60% 7.20% 6.80% 6.90% Other Services (except Public Administration) 4.50% 4.20% 4.40% 4.50% Public Administration 12.40% 10.30% 8.50% 6.30%
34 Release 12 Labour Occupational Characteristics Conception Bay South experienced growth in the labour force in all occupational classifications except Sales and Service. Overall there was a net growth in the employed labour force of 765. Conception Bay South had the highest percentage of the employed labour force in Business, Finance and Administrative Occupations, Trades, Transport and Equipment Operators and Related Occupations compared to St. John s CMA, Newfoundland and Labrador, and Canada. Highest overall percentage of occupational classification in Conception Bay South was Sales and Service Occupations (20.7%). Total Distribution of the Employed Labour Force Aged 15 Years and Over By Occupational Classification, Conception Bay South, 2011 and Net Growth Management Occupations Business, Finance and Administration Occupations Natural and Applied Sciences and Related Occupations Health Occupations Occupations in Education, Law and Social, Community and Government Services Occupations in Art, Culture, Recreation and Sport Sales and Service Occupations Trades, Transport and Equipment Operators and Related Occupations Natural Resources, Agriculture and Related Production Occupations Occupations in Manufacturing and Utilities Total
35 Release 12 Labour Percentage of the Employed Labour Force Aged 15 Years and Over By Occupational Classification, Conception Bay South and Higher Level Geographies, 2016 Conception Bay South St. John s CMA NFLD Canada Management Occupations 9.60% 10.50% 9.20% 11.40% Business, Finance and Administration Occupations 17.40% 16.50% 13.60% 15.90% Natural and Applied Sciences and Related Occupations 8.80% 9.30% 7.00% 7.00% Health Occupations 6.80% 8.50% 8.40% 7.10% Occupations in Education, Law and Social, Community and Government Services 12.40% 13.40% 13.90% 12.00% Occupations in Art, Culture, Recreation and Sport 2.00% 2.80% 1.90% 3.00% Sales and Service Occupations 20.70% 23.30% 22.60% 23.10% Trades, Transport and Equipment Operators and Related Occupations 17.70% 12.40% 16.70% 14.10% Natural Resources, Agriculture and Related Production Occupations 1.80% 1.50% 3.40% 2.10% Occupations in Manufacturing and Utilities 2.70% 1.90% 3.50% 4.40%

36 Release 12 Labour Work Activity in the Past Year Conception Bay South had the highest percentage of individuals working full year, full time in comparison to St. John s CMA, Newfoundland and Labrador, and Canada. Conception Bay South had the smallest percentage of labour force in the not working in comparison to St. John s, Newfoundland, and Canada.


37 Release 13 Journey to Work Main Mode of Commuting In ,915 people drove to work, 550 individuals walked or cycled to work. In comparison, Conception Bay South (88%) has a higher proportion of labourers that commuted to work by vehicle than the National average (74%).

38 Release 13 Journey to Work Average Commute Time The average commute time for the labour force in Conception Bay South was 23.6 minutes, this compares to the national commute time of 26.2 minutes.

39 Release 13 Journey to Work Time Leaving for Work 40% of the labour force in Conception Bay South left for work between the hours of 5am and 6:59am. This compares to the provincial average where 31% left during this time period. The percentage of individuals leaving for work between 9am and 11:59am was smallest for all comparator regions, with only 6% of the labour force leaving during this time period in Conception Bay South. 4,845 individuals leave for work in Conception Bay South between 7am and 7:59am.

40 Release 13 Journey to Work Place of Work Status From 2011 to 2016 there was an increase of 11% in individuals working from home. The increase in workers categorized as usual place of work increased by 4% or 380 people. In Conception Bay South 5% of the labour force worked from home, this compares to the Canadian average where 7% of the labour force worked from home. 12% of the labour forced in Conception Bay South had no fixed workplace address, while 10% had no fixed workplace address in St. John s.

41 Release 15 Mobility and Migration Mobility Status 69% of Conception Bay South residents lived in the same residence in 2016 as five years earlier. The proportion of non-movers in Conception Bay South is higher than St. John s CMA (63%) and Canada (62%), but lower than Newfoundland (71%).
, Newfoundland and Labrador (59%), and Canada (61%).")
42 Release 15 Mobility and Migration Migration Status In 2016, 69% of migrants to Conception Bay South came from within the province of Newfoundland. Conception Bay South had the highest proportion of intraprovincial migrants when compared to St. John s CMA (57%), Newfoundland and Labrador (59%), and Canada (61%). In 2016, 3% of migrants to Conception Bay South were external migrants (coming from outside of Canada). Conception Bay South had the lowest proportion of external migrants when compared to St. John s CMA (15%), Newfoundland and Labrador (9%), and Canada (24%).
CENSUS RESULTS NATIONAL HOUSEHOLD SURVEY
 2011 CENSUS RESULTS NATIONAL HOUSEHOLD SURVEY INTRODUCTION The inaugural National Household Survey (NHS) was a voluntary survey which replaced the mandatory long-form census questionnaire. The NHS was
Release of 2006 Census results Labour Force, Education, Place of Work and Mode of Transportation
 Backgrounder Release of 2006 Census results Labour Force, Education, Place of Work and Mode of Transportation On March 4, 2008 Statistics Canada released further results from the 2006 census focusing on
Ward 16 River. City of Ottawa Ward Profiles 2011 Census and National Household Survey POPULATION* 45, ,390. Total City of Ottawa Population
 POPULATION* Total Ward Population 45,795 +2.0% 2006-2011 Total City of Ottawa Population 883,390 +8.8% 2006-2011 Population by Age Group Ward 16 City of Ottawa 2006 2011 06-11 2006 2011 06-11 Age Group
2011 CENSUS & NATIONAL HOUSEHOLD SURVEY CITY OF BRAMPTON - WARD 1 PROFILE
 CENSUS & NATIONAL HOUSEHOLD SURVEY CITY OF BRAMPTON WARD 1 PROFILE WARD HIGHLIGHTS Population 53,130 Population 51.0% Females Population by Age Group 9% 20% 014 10.14% of total population 36 Median Age
2011 CENSUS & NATIONAL HOUSEHOLD SURVEY CITY OF BRAMPTON - WARD 3 PROFILE
 2011 CENSUS & NATIONAL HOUSEHOLD SURVEY CITY OF BRAMPTON WARD 3 PROFILE WARD HIGHLIGHTS Population 47,500 2011 Population 50.7% Females 2011 Population by Age Group 13% 18% 014 9.07% of total population
2011 CENSUS & NATIONAL HOUSEHOLD SURVEY CITY OF BRAMPTON - WARD 4 PROFILE
 2011 CENSUS & NATIONAL HOUSEHOLD SURVEY CITY OF BRAMPTON WARD 4 PROFILE WARD HIGHLIGHTS Population 9.51% of total population 49,850 2011 Population 34 Median Age 50.5% Females 49.5% Males 2011 Population
2011 CENSUS & NATIONAL HOUSEHOLD SURVEY CITY OF BRAMPTON - WARD 10 PROFILE
 2011 CENSUS & NATIONAL HOUSEHOLD SURVEY CITY OF BRAMPTON WARD 10 PROFILE WARD HIGHLIGHTS Population 10.72% of total population 56,185 2011 Population 33 Median Age 50.1% Females 49.9% Males 2011 Population
Introduction... i. Population Family Structure Education Mobility Status... 7
 Table of Contents Introduction... i Population... 2 Family Structure... 5 Education... 6 Mobility Status... 7 Ethnicity, Language, Immigrants and Visible Minority... 9 ward three Labour Force Characteristics...13
Introduction... i. Population Family Structure Education Mobility Status... 7
 Table of Contents Introduction... i Population... 2 Family Structure... 5 Education... 6 Mobility Status... 7 ward two Ethnicity, Language, Immigrants and Visible Minority... 9 Labour Force Characteristics...13
Introduction... i. Population Family Structure Education Mobility Status... 7
 ward ten Table of Contents Introduction... i Population... 2 Family Structure... 5 Education... 6 Mobility Status... 7 ward ten Ethnicity, Language, Immigrants and Visible Minority... 9 Labour Force Characteristics...13
Post-Secondary Education, Training and Labour September Profile of the New Brunswick Labour Force
 Post-Secondary Education, Training and Labour September 2018 Profile of the New Brunswick Labour Force Contents Population Trends... 2 Key Labour Force Statistics... 5 New Brunswick Overview... 5 Sub-Regional
North York City of Toronto Community Council Area Profiles 2016 Census
 Bar Chart showing the rate of population growth between the years 2006 and 2016 for the Ward compared to the City of based on the 2006 and data. For more information, please contact Michael Wright at 416-392-7558
A Profile of CANADiAN WoMeN. NorTHerN CoMMuNiTieS
 A Profile of CANADiAN WoMeN in rural, remote AND NorTHerN CoMMuNiTieS DeMogrAPHiC Profile in 2006, the last census year for which data are currently available, approximately 2.8 million women resided in
If this information is required in an accessible format, please contact ext. 2564
 If this information is required in an accessible format, please contact 1-800-372-1102 ext. 2564 From: Report: Date: Commissioner of Planning and Economic Development #2018-INFO-53 April 13, 2018 Subject:
Alberta Provincial Electoral Divisions
 Alberta Provincial Electoral Divisions Edmonton-Decore Compiled from the 2011 Census of Canada and National Household Survey Introduction This report presents the statistical profile for the Provincial
Immigrant Employment by Field of Study. In Waterloo Region
 Immigrant Employment by Field of Study In Waterloo Region Table of Contents Executive Summary..........................................................1 Waterloo Region - Part 1 Immigrant Educational Attainment
Introduction... i. Population Family Structure Education Mobility Status... 7
 Table of Contents Introduction... i Population... 2 Family Structure... 5 Education... 6 Mobility Status... 7 Ethnicity, Language, Immigrants and Visible Minority... 9 Labour Force Characteristics...13
HIGHLIGHTS. 62% with postsecondary 58% $1,081 average monthly rent. $1,026 average monthly rent. China #1 immigrant. China #1 immigrant place of birth
 HIGHLIGHTS Ward Toronto 2010 Household Income 62% with postsecondary certificate, diploma or degree 58% with postsecondary certificate, diploma or degree 30% 25% 20% 15% 10% 5% $1,081 average monthly rent
Ward 17 Davenport City of Toronto Ward Profiles 2016 Census
 Bar Chart showing the rate of population growth between the years 2006 and 2016 for the Ward compared to the City of based on the 2006 and data. For more information, please contact Michael Wright at 416-392-7558
people/hectare Ward Toronto
 Bar Chart showing the rate of population growth between the years 2006 and 2016 for the Ward compared to the City of based on the 2006 and data. For more information, please contact Michael Wright at 416-392-7558
$ $1,026. HIGHLIGHTS Ward Toronto. 52% with postsecondary 58% $978 average monthly rent. China #1 immigrant place of birth
 HIGHLIGHTS Ward Toronto 2010 Household Income 52% with postsecondary certificate, diploma or degree 58% with postsecondary certificate, diploma or degree 35% 30% 25% 20% 15% 10% 5% $978 average monthly
Ward 4 Etobicoke Centre City of Toronto Ward Profiles 2016 Census
 Bar Chart showing the rate of population growth between the years 2006 and 2016 for the Ward compared to the City of based on the 2006 and data. For more information, please contact Michael Wright at 416-392-7558
Alberta Provincial Electoral Divisions
 Alberta Provincial Electoral Divisions Calgary-Foothills Compiled from the 2011 Census of Canada and National Household Survey Introduction This report presents the statistical profile for the Provincial
HIGHLIGHTS Ward Toronto. 67% with postsecondary 58% $1,040 average monthly rent. $ $1,026 average monthly rent. China #1 immigrant place of birth
 HIGHLIGHTS Ward Toronto 2010 Household Income 67% with postsecondary certificate, diploma or degree 58% with postsecondary certificate, diploma or degree 30% 25% 20% 15% 10% 5% $1,040 average monthly rent
Scarborough City of Toronto Community Council Area Profiles 2016 Census
 Bar Chart showing the rate of population growth between the years 2006 and 2016 for the Ward compared to the City of based on the 2006 and data. For more information, please contact Michael Wright at 416-392-7558
Alberta Provincial Electoral Divisions
 Alberta Provincial Electoral Divisions Calgary-Mackay-Nose Hill Compiled from the 2011 Census of Canada and National Household Survey Introduction This report presents the statistical profile for the Provincial
Fanshawe Neighbourhood Profile
 Fanshawe Profile For further information contact: John-Paul Sousa Planning Research Analyst Direct: (519) 661-2500 ext. 5989 I email: jpsousa@london.ca Page 1 Page 2 Population Characteristics & Age Distribution
Alberta Immigrant Highlights. Labour Force Statistics. Highest unemployment rate for landed immigrants 9.8% New immigrants
 2016 Labour Force Profiles in the Labour Force Immigrant Highlights Population Statistics Labour Force Statistics Third highest percentage of landed immigrants in the working age population 1. 34. ON 2.
Alberta Provincial Electoral Divisions. Calgary-McCall. Compiled from the 2016 Census of Canada
 Alberta Provincial Electoral Divisions Calgary-McCall Compiled from the 2016 Census of Canada July 2018 Introduction The following report produced by the Office of Statistics and Information presents a
Bostwick Neighbourhood Profile
 Bostwick Profile For further information contact: John-Paul Sousa Planning Research Analyst Direct: (519) 661-2500 ext. 5989 I email: jpsousa@london.ca Page 1 Page 2 Population Characteristics & Age Distribution
Corporate. Report COUNCIL DATE: April 28, 2008 NO: R071 REGULAR COUNCIL. TO: Mayor & Council DATE: April 28, 2008
 Corporate NO: R071 Report COUNCIL DATE: April 28, 2008 REGULAR COUNCIL TO: Mayor & Council DATE: April 28, 2008 FROM: General Manager, Planning and Development FILE: 6600-01 SUBJECT: 2006 Census Information
Labour Force Structure. Employment. Unemployment. Outside Labour Force Population and Economic Dependency Ratio
 210 Statistical Yearbook of Abu Dhabi 2016 Labour Force. 5 Labour Force Structure Employment Unemployment Outside Labour Force Population and Economic Dependency Ratio Statistical Yearbook of Abu Dhabi
Ward 14 Parkdale-High Park City of Toronto Ward Profiles 2016 Census
 Bar Chart showing the rate of population growth between the years 2006 and 2016 for the Ward compared to the City of based on the 2006 and data. For more information, please contact Michael Wright at 416-392-7558
Appendix A: Economic Development and Culture Trends in Toronto Data Analysis
 Appendix A: Economic Development and Culture Trends in Toronto Data Analysis Introduction The proposed lenses presented in the EDC Divisional Strategy Conversation Guide are based in part on a data review.
COMMUNITY PROFILE TOWNSHIP OF LANGLEY. Township of Langley Immigrant Demographics I Page 1
 COMMUNITY PROFILE TOWNSHIP OF LANGLEY Township of Langley Demographics I Page 1 TOWNSHIP OF LANGLEY IMMIGRANT DEMOGRAPHICS Your quick and easy look at facts and figures around immigration. Newcomers are
Verdun borough HIGHLIGHTS. In 1996, the Verdun borough had a population of 59,714. LOCATION
 Socio-economic profile borough February 2002 HIGHLIGHTS In 1996, the borough had a population of 59,714. LOCATION Between 1991 and 1996, the population of the borough declined by 2.6%. One-person households
Alberta Provincial Electoral Divisions. Lacombe- Ponoka. Compiled from the 2016 Census of Canada
 Alberta Provincial Electoral Divisions Lacombe- Ponoka Compiled from the 2016 Census of Canada July 2018 Introduction The following report produced by the Office of Statistics and Information presents
COMMUNITY PROFILE COQUITLAM. Coquitlam Immigrant Demographics I Page 1
 COMMUNITY PROFILE COQUITLAM Coquitlam Demographics I Page 1 COQUITLAM IMMIGRANT DEMOGRAPHICS Your quick and easy look at facts and figures around immigration. Newcomers are an important and growing part
Alberta Provincial Electoral Divisions. Calgary-Shaw. Compiled from the 2016 Census of Canada
 Alberta Provincial Electoral Divisions Calgary-Shaw Compiled from the 2016 Census of Canada July 2018 Introduction The following report produced by the Office of Statistics and Information presents a statistical
Alberta Provincial Electoral Divisions
 Alberta Provincial Electoral Divisions Innisfail-Sylvan Lake Compiled from the 2011 Census of Canada and National Household Survey Introduction This report presents the statistical profile for the Provincial
Community Social Profile Cambridge and North Dumfries
 Community Trends for 2013 in Cambridge, North Dumfries, Wellesley, Wilmot and Woolwich Community Social Profile - Cambridge and North Dumfries Published December 2014 Community Social Profile Cambridge
COMMUNITY PROFILE: Fort St. John, British Columbia Census Subdivision (CSD) PHASE 1 Winter 2018
 PHASE 1 Winter 2018") COMMUNITY PROFILE: Fort St. John, British Columbia Census Subdivision (CSD) PHASE 1 Winter 2018 About the Community Development Institute Established in 2004, the Community Development Institute (CDI)
COMMUNITY PROFILE: Fort St. John, British Columbia Census Subdivision (CSD) PHASE 1 Winter 2018 About the Community Development Institute Established in 2004, the Community Development Institute (CDI)
COMMUNITY PROFILE BURNABY
 COMMUNITY PROFILE BURNABY Burnaby Demographics I Page 1 BURNABY IMMIGRANT DEMOGRAPHICS Your quick and easy look at facts and figures around immigration. Newcomers are an important and growing part of your
STRENGTHENING RURAL CANADA: Fewer & Older: The Coming Population and Demographic Challenges in Rural Newfoundland & Labrador
 STRENGTHENING RURAL CANADA: Fewer & Older: The Coming Population and Demographic Challenges in Rural Newfoundland & Labrador An Executive Summary 1 This paper has been prepared for the Strengthening Rural
Social and Demographic Trends in Burnaby and Neighbouring Communities 1981 to 2006
 Social and Demographic Trends in and Neighbouring Communities 1981 to 2006 October 2009 Table of Contents October 2009 1 Introduction... 2 2 Population... 3 Population Growth... 3 Age Structure... 4 3
AVERAGE HOUSEHOLD INCOME $83,026 ($93,586) RENTERS 37% (29%) UNEMPLOYMENT RATE 7% (7%) TAKE TRANSIT TO WORK 20% (15%)
 RENTERS 37% (29%) UNEMPLOYMENT RATE 7% (7%) TAKE TRANSIT TO WORK 20% (15%)") CITY OF COMMUNITY PROFILES 2016 Census Data City of Surrey Statistics CITY CENTRE GUILDFORD FLEETWOOD NEWTON CLOVERDALE AREA 3,131 ha (32,621 ha) AVERAGE HOUSEHOLD INCOME $83,026 ($93,586) SOUTH POPULATION
CITY OF COMMUNITY PROFILES 2016 Census Data City of Surrey Statistics CITY CENTRE GUILDFORD FLEETWOOD NEWTON CLOVERDALE AREA 3,131 ha (32,621 ha) AVERAGE HOUSEHOLD INCOME $83,026 ($93,586) SOUTH POPULATION
Town of Niagara-on-the-Lake Official Plan Review Growth Analysis Technical Background Report
 Town of Niagara-on-the-Lake Official Plan Review Growth Analysis Technical Background Report In association with: October 16, 2015 Contents Page Executive Summary... (i) 1. Introduction... 1 2. Population,
STRENGTHENING RURAL CANADA: Fewer & Older: Population and Demographic Crossroads in Rural Saskatchewan. An Executive Summary
 STRENGTHENING RURAL CANADA: Fewer & Older: Population and Demographic Crossroads in Rural Saskatchewan An Executive Summary This paper has been prepared for the Strengthening Rural Canada initiative by:
Le Sueur County Demographic & Economic Profile Prepared on 7/12/2018
 Le Sueur County Demographic & Economic Profile Prepared on 7/12/2018 Prepared by: Mark Schultz Regional Labor Market Analyst Southeast and South Central Minnesota Minnesota Department of Employment and
Spryfield Highlights. Household Living Arrangements. The following are highlights from the 2016 Census.
 Highlights The following are highlights from the 2016 Census., as defined for United Way's Action for Neighbourhood Change, had a Census population of 11,700 in 2016. The outline shown to the right, and
TIEDI Labour Force Update September 2012
 The Toronto Immigrant Employment Data Initiative (TIEDI) s Labour Force Update aims to provide upto-date labour market data on immigrants. This monthly report relies on data from the Labour Force Survey
CENSUS RESULTS WARD 3 PROFILE
 2011 CENSUS RESULTS WARD 3 PROFILE Town of Halton Hills City of Brampton Hwy. 407 Finch Ave. Town of Milton Hwy. 407 ETR Ninth Line 10 Derry Rd. Winston Churchill Blvd. 9 Erin Mills Pkwy. Mississauga Rd.
CARE COLLABORATION FOR APPLIED RESEARCH IN ECONOMICS LABOUR MOBILITY IN THE MINING, OIL, AND GAS EXTRACTION INDUSTRY IN NEWFOUNDLAND AND LABRADOR
 DRAFT January 2016 CARE COLLABORATION FOR APPLIED RESEARCH IN ECONOMICS LABOUR MOBILITY IN THE MINING, OIL, AND GAS EXTRACTION INDUSTRY IN NEWFOUNDLAND AND LABRADOR Yue Xing +, Brian Murphy + and Doug
BENCHMARKING REPORT - VANCOUVER
 BENCHMARKING REPORT - VANCOUVER I. INTRODUCTION We conducted an international benchmarking analysis for the members of the Consider Canada City Alliance Inc., consisting of 11 (C11) large Canadian cities
3 Labour Force and Employment
 3 Labour Force and Employment 3.1 Key Indicators The MODL is home to a labour force that is over 22,764 persons strong. As illustrated in Table 11, the region s labour participation rate and employment
CITY OF MISSISSAUGA. Overview 2-1. A. Demographic and Cultural Characteristics
 Portraits of Peel Overview 2-1 A. Demographic and Cultural Characteristics Population: Size, Age and Growth 2-2 Immigrants 2-3 Visible Minorities 2-4 Language 2-5 Religion 2-6 Mobility Status 2-7 B. Household
CENSUS RESULTS WARD 9 PROFILE
 2011 CENSUS RESULTS WARD 9 PROFILE Town of Halton Hills City of Brampton Hwy. 407 Finch Ave. Town of Milton Hwy. 407 ETR Ninth Line 10 Derry Rd. Winston Churchill Blvd. 9 Erin Mills Pkwy. Mississauga Rd.
TIEDI Labour Force Update May 2011
 The Toronto Immigrant Employment Data Initiative (TIEDI) s Labour Force Update aims to provide upto-date labour market data on immigrants. This monthly report relies on data from the Labour Force Survey
Economic Structure of Vancouver:
 Factsheet # 1.2 Economic Structure of Vancouver: Role of Vancouver in the Metro Vancouver Region Vancouver as a Regional Centre The city of Vancouver is the largest jobs and population centre in the Metro
TIEDI Labour Force Update December 2012
 The Toronto Immigrant Employment Data Initiative (TIEDI) s Labour Force Update aims to provide upto-date labour market data on immigrants. This monthly report relies on data from the Labour Force Survey
Leveraging local content policies for broader economic development
 Göran Hultin, CEO Caden Corporation and Vice- Chair, World Economic Forum s Global Agenda Council on Migration Local Content and Diasporas Side Event IDM 2013 : DIASPORA MINISTERIAL CONFERENCE International
2016 Census Bulletin: Education and Labour
 2016 Census Bulletin: Education and Labour Kingston, Ontario Census Metropolitan Area (CMA) The 2016 Census Day was May 10, 2016. In the fall of 2017, Statistics Canada released various data sets from
TIEDI Labour Force Update January 2013
 The Toronto Immigrant Employment Data Initiative (TIEDI) s Labour Force Update aims to provide upto-date labour market data on immigrants. This monthly report relies on data from the Labour Force Survey
AVERAGE HOUSEHOLD INCOME $97,637 ($93,586) RENTERS 22% (29%) UNEMPLOYMENT RATE 7% (7%) TAKE TRANSIT TO WORK 15% (15%)
 RENTERS 22% (29%) UNEMPLOYMENT RATE 7% (7%) TAKE TRANSIT TO WORK 15% (15%)") CITY OF COMMUNITY PROFILES 2016 Census Data City of Surrey Statistics WHALLEY CITY CENTRE GUILDFORD NEWTON CLOVERDALE AREA 1,809 ha (32,621 ha) AVERAGE HOUSEHOLD INCOME $97,637 ($93,586) SOUTH POPULATION
CITY OF COMMUNITY PROFILES 2016 Census Data City of Surrey Statistics WHALLEY CITY CENTRE GUILDFORD NEWTON CLOVERDALE AREA 1,809 ha (32,621 ha) AVERAGE HOUSEHOLD INCOME $97,637 ($93,586) SOUTH POPULATION
Chapter One: people & demographics
 Chapter One: people & demographics The composition of Alberta s population is the foundation for its post-secondary enrolment growth. The population s demographic profile determines the pressure points
Queensland s Labour Market Progress: A 2006 Census of Population and Housing Profile
 Queensland s Labour Market Progress: A 2006 Census of Population and Housing Profile Issue No. 9 People in Queensland Labour Market Research Unit August 2008 Key Points Queensland s Labour Market Progress:
CENSUS RESULTS WARD 10 PROFILE
 2011 CENSUS RESULTS WARD 10 PROFILE Town of Halton Hills City of Brampton Hwy. 407 Finch Ave. Town of Milton Hwy. 407 ETR Ninth Line 10 Derry Rd. Winston Churchill Blvd. 9 Erin Mills Pkwy. Mississauga
CENSUS RESULTS WARD 7 PROFILE
 2011 CENSUS RESULTS WARD 7 PROFILE Town of Halton Hills City of Brampton Hwy. 407 Finch Ave. Town of Milton Hwy. 407 ETR Ninth Line 10 Derry Rd. Winston Churchill Blvd. 9 Erin Mills Pkwy. Mississauga Rd.
$58,761 ($93,586) 57% (29%) 8% (7%) 36% (15%)
 57% (29%) 8% (7%) 36% (15%)") CITY OF COMMUNITY PROFILES 2016 Census Data City of Surrey Statistics CITY WHALLEY GUILDFORD FLEETWOOD NEWTON CLOVERDALE AREA 548 ha (32,621 ha) AVERAGE HOUSEHOLD INCOME $58,761 ($93,586) SOUTH POPULATION
CITY OF COMMUNITY PROFILES 2016 Census Data City of Surrey Statistics CITY WHALLEY GUILDFORD FLEETWOOD NEWTON CLOVERDALE AREA 548 ha (32,621 ha) AVERAGE HOUSEHOLD INCOME $58,761 ($93,586) SOUTH POPULATION
NATIONAL HOUSEHOLD SURVEY: LABOUR FORCE, EMPLOYMENT, AND INCOME
 Clause No. 15 in Report No. 1 of was adopted, without amendment, by the Council of The Regional Municipality of York at its meeting held on January 23, 2014. 15 2011 NATIONAL HOUSEHOLD SURVEY: LABOUR FORCE,
CENSUS RESULTS WARD 6 PROFILE
 2011 CENSUS RESULTS WARD 6 PROFILE Town of Halton Hills City of Brampton Hwy. 407 Finch Ave. Town of Milton Hwy. 407 ETR Ninth Line 10 Derry Rd. Winston Churchill Blvd. 9 Erin Mills Pkwy. Mississauga Rd.
The Status of Women in Ventura and Santa Barbara Counties
 The Status of Women in Ventura and Santa Barbara Counties March 3, 2010 Foreword March, 2010 One hundred and fifty-three years ago, thousands of women garment workers marched to change their poverty level
Labor Supply Factors and Labor Availability for the Geneva (Fillmore County) Labor Area
 Labor Area") Labor Supply Factors and Labor Availability for the Geneva (Fillmore County) Labor Area June 2015 Prepared by: Kenneth M. Lemke, Ph.D. Economist Nebraska Public Power District 1414 15 th Street - P.O.
Labor Supply Factors and Labor Availability for the Geneva (Fillmore County) Labor Area June 2015 Prepared by: Kenneth M. Lemke, Ph.D. Economist Nebraska Public Power District 1414 15 th Street - P.O.
Briefing Book- Labor Market Trends in Metro Boston
 Briefing Book- Labor Market Two other briefing books focus on the importance of formal education and ESOL courses to Boston s foreign-born residents. While there are a number of reasons why improving immigrant
STRENGTHENING RURAL CANADA: Fewer & Older: The Coming Demographic Crisis in Rural Ontario
 STRENGTHENING RURAL CANADA: Fewer & Older: The Coming Demographic Crisis in Rural Ontario An Executive Summary 1 This paper has been prepared for the Strengthening Rural Canada initiative by: Dr. Bakhtiar
Study Area Maps. Profile Tables. W Broadway & Cambie St, Vancouver, BC Pitney Bowes 2016 Estimates and Projections. W Broadway & Cambie St
 Powered by PCensus Page 1 Study Area Maps Profile Tables 2016 Demographic Snapshot Population Trends Household Trends Population by Age and Sex Comparison Population by Age and Sex Household Maintainers
City of Montréal HIGHLIGHTS. En 1996, the ville de Montréal had a population of 1,775,788.
 Socio-economic profile City of Montréal February 2002 HIGHLIGHTS En 1996, the ville de Montréal had a population of 1,775,788. Between 1991 and 1996, the population of Montréal increased by 0.01%. One-person
1. Where is your company located? Please check all that apply.
 Appendix F: Surveys of employers 1. Where is your company located? Please check all that apply. Vancouver British Columbia (outside of Vancouver) Alberta Yukon Northwest Territories Nunavut Saskatchewan
The case for an inwork progression service
 The case for an inwork progression service 1 Contents 1. Introduction 2. Underemployment in the UK 3. Individual characteristics 4. Industry 5. Recommendations 2 Summary of findings Scale of underemployment:
AVERAGE HOUSEHOLD INCOME $103,177 ($93,586) RENTERS 21% (29%) UNEMPLOYMENT RATE 5% (7%) TAKE TRANSIT TO WORK 6% (15%)
 RENTERS 21% (29%) UNEMPLOYMENT RATE 5% (7%) TAKE TRANSIT TO WORK 6% (15%)") CITY OF COMMUNITY PROFILES 2016 Census Data City of Surrey Statistics WHALLEY CITY CENTRE GUILDFORD FLEETWOOD NEWTON AREA 4,917 ha (32,621 ha) AVERAGE HOUSEHOLD INCOME $103,177 ($93,586) SOUTH POPULATION
CITY OF COMMUNITY PROFILES 2016 Census Data City of Surrey Statistics WHALLEY CITY CENTRE GUILDFORD FLEETWOOD NEWTON AREA 4,917 ha (32,621 ha) AVERAGE HOUSEHOLD INCOME $103,177 ($93,586) SOUTH POPULATION
Post-Secondary Education, Training and Labour January New Brunswick Analysis 2016 Census Topic: Immigration
 Post-Secondary Education, Training and Labour January 2018 New Brunswick Analysis 2016 Census Topic: Contents General Information... 2 Overview... 2 Population... 2 Demographics... 3 Sub-Provincial...
CENSUS RESULTS WARD 8 PROFILE
 2011 CENSUS RESULTS WARD 8 PROFILE Town of Halton Hills City of Brampton Hwy. 407 Finch Ave. Town of Milton Hwy. 407 ETR Ninth Line 10 Derry Rd. Winston Churchill Blvd. 9 Erin Mills Pkwy. Mississauga Rd.
City Windsor 1981 Canada Census WARD 1
 City Windsor 1981 Canada Census March 2, 2012 Table of Contents... 3 POPULATION BY AGE... 4 LANGUAGE/RELIGION... 5 ETHNICITY/MOBILITY... 6 BIRTHPLACE / IMMIGRATION... 7 EDUCATION / LABOUR FORCE... 8 INDUSTRY
CENSUS BULLETIN #5 Immigration and ethnocultural diversity Housing Aboriginal peoples
 CENSUS BULLETIN #5 Immigration and ethnocultural diversity Housing Aboriginal peoples October 25, 217 Bulletin Highlights: 86.1 per cent of the Brampton s 216 surveyed population held a Canadian citizenship
Aboriginal Communities in Profile: Quinte, Kingston, Rideau Building healthy and vibrant communities
 Aboriginal Communities in Profile: Quinte, Kingston, Rideau Building healthy and vibrant communities The Ontario Trillium Foundation is an agency of the Government of Ontario. Métis Elder photo courtesy
BRAMALEA. Overview A. Demographic and Cultural Characteristics
 The Social Planning Council of Peel Portraits of Peel BRAMALEA Overview 13-1 A. Demographic and Cultural Characteristics Population: Size, Age and Growth 13-2 Immigrants 13-3 Visible Minorities 13-4 Language
Employment, Education and Income
 This is one in a series of fact sheets that provide a profile of immigrants in. Understanding the makeup of our community is important for planning programs and services. Between 2006 and 2011, 15,465
Tracking Trends in Kingston
 Tracking Trends in Photo: 22, Courtesy of City Hall Total Population: 152,358 Population Changes for CMAs, 21 to 26 25 19.2 2 15 1 11.6 9.2 8.9 8.2 6.6 59 5.9 55 5.5 54 5.4 51 5.1 51 5.1 5 5. 46 4.6 3.8
Assessment of Demographic & Community Data Updates & Revisions
 Assessment of Demographic & Community Data Updates & Revisions Scott Langen, Director of Operations McNair Business Development Inc. P: 306-790-1894 F: 306-789-7630 E: slangen@mcnair.ca October 30, 2013
Alberta Provincial Electoral Divisions
 Alberta Provincial Electoral Divisions Strathmore-Brooks Compiled from the 2011 Census of Canada and National Household Survey Introduction This report presents the statistical profile for the Provincial
STRENGTHENING RURAL CANADA: Fewer & Older: Population and Demographic Challenges Across Rural Canada A Pan-Canadian Report
 STRENGTHENING RURAL CANADA: Fewer & Older: Population and Demographic Challenges Across Rural Canada A Pan-Canadian Report This paper has been prepared for the Strengthening Rural Canada initiative by:
TOWNSHIP OF LANGLEY, B.C Township of Langley Immigrant Demographics I
 Immigrant demographics TOWNSHIP OF LANGLEY, B.C. - 2018 Township of Langley Immigrant Demographics I Page 1 TOWNSHIP OF LANGLEY IMMIGRANT DEMOGRAPHICS Your quick and easy look at facts and figures around
Greater Moncton in The Role of Immigration to Support a Sustainable Urban Economy. NewConversationsNB.com
 Greater Moncton in 2030 The Role of Immigration to Support a Sustainable Urban Economy Prepared by: David Campbell, Jupia Consultants Inc. for the New Brunswick Multicultural Council March 2018 NewConversationsNB.com
Immigrant DELTA, B.C Delta Immigrant Demographics I
 Immigrant demographics DELTA, B.C. - 2018 Immigrant Demographics I Page 1 DELTA IMMIGRANT DEMOGRAPHICS Your quick and easy look at facts and figures around immigration. Newcomers are an important and growing
Interministerial Women s Secretariat
 Women in PEI: A Statistical Review Interministerial Women s Secretariat Table of Contents Executive Summary 1 1 The Female Population of PEI 8 Chapter Summary 8 Population by Age 9 Mother Tongue 11 Languages
Socio-Economic Trends in the Canadian North: Comparing the Provincial and Territorial Norths
 Socio-Economic Trends in the Canadian North: Comparing the Provincial and Chris Southco Abstract: While there has been a recent increase in social research relating to the s Territorial North, there is
The Planning & Development Department recommends that Council receive this report for information.
 CORPORATE REPORT NO: R237 COUNCIL DATE: November 19, 2018 REGULAR COUNCIL TO: Mayor & Council DATE: November 15, 2018 FROM: General Manager, Planning & Development FILE: 6600-01 SUBJECT: Surrey Community
Rural Newfoundland and Labrador Profile: A Ten-year Census Analysis ( )
") Rural Newfoundland and Labrador Profile: A Ten-year Census Analysis (1991-2001) Prepared by Jennifer de Peuter, MA and Marianne Sorensen, PhD of Tandem Social Research Consulting with contributions by
Rural Newfoundland and Labrador Profile: A Ten-year Census Analysis (1991-2001) Prepared by Jennifer de Peuter, MA and Marianne Sorensen, PhD of Tandem Social Research Consulting with contributions by
Immigrant PORT COQUITLAM, B.C Port Coquitlam Immigrant Demographics I
 Immigrant demographics PORT COQUITLAM, B.C. - 2018 Immigrant Demographics I Page 1 PORT COQUITLAM IMMIGRANT DEMOGRAPHICS Your quick and easy look at facts and figures around immigration. Newcomers are
Demographic Data. Comprehensive Plan
 Comprehensive Plan 2010-2030 4 Demographic Data Population and demographics have changed over the past several decades in the City of Elwood. It is important to incorporate these shifts into the planning