Polarizing the Electoral Connection: Partisan Representation in Supreme Court Confirmation Politics
|
|
|
- Kerry Hall
- 5 years ago
- Views:
Transcription
1 Polarizing the Electoral Connection: Partisan Representation in Supreme Court Confirmation Politics Jonathan P. Kastellec* Dept. of Politics, Princeton University Jeffrey R. Lax Dept. of Political Science, Columbia University Michael Malecki Applied Statistics Center, Columbia University Justin H. Phillips Dept. of Political Science, Columbia University February 27, 2015 Abstract Do senators respond to the preferences of their state s median voter or only to the preferences of their co-partisans? We develop a method for estimating state-level public opinion broken down by partisanship so that scholars can distinguish between general and partisan responsiveness. We use this to study responsiveness in the context of Senate confirmation votes on Supreme Court nominees. We find that senators far more heavily weight their partisan base when casting such roll call votes. Indeed, when their state median voter and party median voter disagree, senators strongly favor the latter. This has significant implications for the study of legislative responsiveness and the role of public opinion in shaping the members of the nation s highest court. The methodological approach we develop allows more nuanced analyses of public opinion and its effects, as well as more finely grained studies of legislative behavior and policy making. Forthcoming in the Journal of Politics *We thank Doug Arnold, Deborah Beim, Benjamin Bishin, Charles Cameron, Robert Shapiro, Alissa Stollwerk, Georg Vanberg, and members of the Princeton University Political Methodology Colloquium for helpful comments and suggestions. Complete replication materials can be found at klmp_replication_materials.zip.
2 Whom do legislators represent? Most scholars agree that constituents preferences shape the behavior of their representatives in Congress (e.g., Mayhew 1974). There is, however, no consensus about whose opinion matters. Are some constituents better represented than others? Are lawmakers more responsive to the median voter or to subconstituencies, particularly their own partisans? The answers to these questions are important for understanding American democracy if members of Congress are primarily (or only) responsive to their same-party constituents, it raises normative concerns of democratic performance and has implications for the study of legislatures and elections. As Clinton (2006, 397) puts it, If representatives are most responsive to the preferences of only some constituents, the representativeness of the system and the legitimacy of resulting outcomes may be lacking. The possibility that lawmakers are most responsive to their co-partisans has long been recognized (Clausen 1973, Fenno 1978) and perhaps believed to be true. Still, there is very little systematic evidence for this claim; in large part, this lack of evidence is due to the challenges associated with measuring preferences across subconstituencies. Researchers have compensated with demographic and economic proxies or diffuse survey measures such as averaged preferences or general ideology. Such measures can be problematic in two way, and their limitations are often explicitly recognized by the scholars that invoke them. First, these measures do not directly capture constituent preferences on the specific roll call votes being studied. Second, they do not share a common metric with roll call votes, sharply limiting the inferences that can reasonably be drawn. The difficulty of measuring subconstituency opinion means that the question of whose opinion matters is far from settled. Indeed, as we discuss below, the existing literature reveals conflicting findings. Our paper makes both methodological and substantive contributions. We overcome existing methodological limitations by generating opinion estimates on specific votes broken down by partisan subconstituencies in each state. To do so, we build on recent advances in opinion estimation based on multilevel regression and poststratification [MRP]. We develop novel extensions of this method that allow more fine-grained estimates of public 1
3 opinion by subgroup a senator s in-party, opposite-party, and independent constituents. In addition, unlike most research that takes survey responses as measured without error, we incorporate the underlying uncertainty in our estimates at every stage of our empirical analysis, developing new tools for doing so. Finally, we develop an MRP extension for measuring three-way splits in opinion compatible with this uncertainty analysis. The goal at hand for these innovations is to conduct a fine-grained substantive case study of responsiveness and representation: how senators cast votes on Supreme Court nominees. We connect senatorial roll call votes to roll-call specific subconstituency preferences. Since our opinion estimates and roll call votes are on a common scale, we not only estimate the strength of the relationship between opinion and senatorial vote choice by subconstituency, but also how often a senator s vote is congruent with the preferences of same-party, oppositeparty, and independent voters. This generates more nuanced assessments of responsiveness than previously possible. Our extensions creating sub-state estimates when Census data necessary for basic MRP is not available will be useful for many further applications of MRP and for studying a wide range of substantive questions. It will make possible the generalization of our substantive research on nomination voting to other types of votes. From a substantive perspective, the question of who gets represented is most important when evaluating key votes cast by legislators these votes are likely to have a lasting impact on their constituents. Not many decisions are as consequential for and visible to the public as a vote to confirm or reject a nominee to the U.S. Supreme Court. While the outcomes of many votes are ambiguous or obscured in procedural detail, the result of a vote on a Supreme Court nomination is stark. From a research design perspective, public opinion can vary widely across states and nominees and has been shown to influence senatorial voting on nominees (Kastellec, Lax and Phillips 2010). Thus, we are not looking for disparate impact where no impact of opinion exists at all. We document that opinion on Supreme Court nominees varies strongly across partisan groups. Given this divergence, to whom senators listen can mean the difference between a 2
4 vote to confirm and a vote to reject. We show clear and robust evidence that senators give far more weight to the the opinion of their fellow partisans. After controlling for ideology and party, we find that Democrats still listen more to Democrats and Republicans more to Republicans. Just changing the composition of a nominee s supporters (holding constant total support) has striking effects on the likelihood that a senator votes to confirm. Increasing support in the senator s party can have almost six times the effect of support outside the party. Overall, senators do what their co-partisans want 87% of the time. This is even more than the 80% of the time that senators vote for nominees made by a president of the same party. When the preferences of the median voter and the party median voter differ, senators side with their co-partisans 75% of the time. The method we develop to analyze partisan opinion within states leads us to the conclusion that the extra weight given to partisan subconstituencies polarizes the electoral connection, which both pulls policy away from the median voter and results in far more contentious confirmation politics. 2 Constituencies & Legislators: Theory, Measurement The natural starting point for linkages between voters and legislators the Median Voter Theorem predicts that if representatives are motivated solely by office-seeking, they will locate at the ideal point of the median voter of the lawmaker s constituency (Downs 1957). However, as discussed in Clinton (2006), empirical evidence suggests that lawmakers often do not converge to the median voter. For example, House candidates from the same district often adopt divergent ideological positions (Ansolabehere, Snyder and Stewart 2001), and same-state senators frequently disagree (Bullock and Brady 1983). Theoretical work on representation offers many reasons why the Downsian empirical predictions might not hold. First, if candidates and politicians are also policy-seeking, they will have incentives to diverge from the median voter. Second, pleasing extreme activists and interest groups may induce divergence (Miller and Schofield 2003). Third, representatives may adopt extreme positions to advance the party s brand (Aldrich 1995). Fourth, the fact that challengers and incumbents often must first win a primary election before running 3
5 in a general election may lead an office holder to favor her primary constituency over the median voter especially if she serves in a jurisdiction with a closed primary in which only self-identified partisans may vote. Primary voters are more extreme relative to those who participate in general elections, which may pull representation towards the primary (and thus partisan) constituency (Gerber and Morton 1998). And, in general elections, partisan voters exhibit greater intensity and thus are more likely to vote (especially in off-year elections), making their support particularly valuable. Finally, if there exists a high degree of preference heterogeneity across a state or district, it may be difficult to accurately represent the median vote. In contrast, partisans are more homogenous, probably more communicative, and hence easier to represent than than the full constituency (Wright 1989, 468-9). The empirical literature on this question (with respect to representation, rather than elections) has largely flowed from Fenno s (1978) canonical work on how members of Congress respond to different subconstituencies. Whereas the median voter can be thought to represent what Fenno calls the geographical constituency (i.e. the entire district or state), members of Congress will also focus on both the reelection constituency and the primary constituency (see also Fiorina 1974). The former comprises people in a district or state that a member thinks will vote to support her, while the latter comprises a subset of these voters those that are the member s strongest supporters. These supporters, of course, are most likely to be members of the legislator s party. As Clausen (1973, 128) notes, Given the overwhelming importance of party affiliation as a basis for choosing among candidates for office, and given the long term exposure of most candidates to the people, and views of a single party, the expectation is that the legislator will represent his partisan followers best. We give here a brief sense of the conflicting findings on partisan representation. While some might strongly believe non-median representation exists, and despite many reasons to believe that it exists, actual empirical evidence is scant at best. One reason for this dearth of evidence is the difficulty in obtaining clean measures of subgroup opinion. Examining the responsiveness of senators to different constituencies, Shapiro et al. (1990) find that 4
6 senator s votes are strongly related to the preferences of their in-party constituents, while Wright (1989) finds that same-party preferences have no direct effect on representation. More recently, Clinton (2006) finds that House Republicans in the 106th Congress were strongly responsiveness to the preferences of Republicans in their districts. However, he also finds that Democrats do not follow the preferences of their partisan constituency, but oddly that they too are more responsive to Republicans. Finally, in a study of representation in California, Gerber and Lewis (2004) finds responsiveness to the median voter (especially when preferences within a district are homogenous), but no effect of in-party preferences on members voting behavior. Thus, more than three decades after Fenno made famous the idea of separate constituencies, there exists little empirical evidence and certainly no consensus that congressional partisans are more responsive to their co-partisans. Methodological challenges. Testing differential representation raises several methodological concerns. Foremost among these is the difficulty of accurately measuring the preferences of various subconstituencies. This challenge arises from a harsh constraint the frequent lack of comparable public opinion polls across states or congressional districts. To compensate for this, scholars have pursued several alternatives, each with its own limitations. Early empirical research (e.g. Peltzman 1984) often used demographic and economic data as proxies for policy preferences. Recent analyses have transitioned to survey-based measures of preferences, which are typically created by disaggregating respondents from national polls so that opinion percentages can be calculated for each state or district. To generate adequate sub-sample sizes, either many national surveys must be pooled over many years or very large surveys must be found. This severely restricts the type of preference measures that can be constructed and makes it difficult to gauge the relative influence of different groups. Studies that have examined responsiveness have therefore relied on general measures of preference aggregated across hundreds or even thousands of votes covering various types and issues. This approach has several limitations. First, responses are not directly matched with relevant roll call votes. Instead, an assumption is made that voters who hold liberal, 5
7 moderate, or conservative opinions on one set of policies will do so on the set of roll call votes being analyzed. However, other research has shown that voters often hold ideologically inconsistent preferences across policy areas. Furthermore, without accurate measures as to how voters want specific roll calls to be cast, no common metric for opinion and votes exists, limiting inferences that can be drawn. A high correlation between roll call votes and the policy liberalness of a senator s same-party constituency reveals some sort of relationship, but it does not allow us to conclude whether same-party constituents are actually getting their senator to vote the way they want more often than the median voter or opposite-party constituents: the inability to measure subconstituency preferences and voting behavior on a common scale prevents a definitive answer we simply cannot see which constituency is closer to the legislator s revealed preferences (Clinton 2006, 407). Finally, most papers in this literature aggregate many different types of votes. To be sure, pooling types of votes has its advantages (e.g., idiosyncrasies across policy areas are averaged out). However, examining averages of opinion against averages of roll call votes means that the two cannot be directly compared, complicating analyses of representation (Bishin and Dennis 2002). Supreme Court nominations are a particularly important area for adjudicating between median and non-median theories of representation. Kastellec, Lax and Phillips (2010) concluded that senators respond to state-level opinion in confirmation votes. This claim ties the Court, a potentially counter-majoritarian institution, to majority will. However, that study did not and could not explore to whom senators respond within states. If senators overrespond to subconstituencies, then earlier findings and conclusions on opinion effects are incomplete the majoritarian linkage is weakened. This shows the importance of studying subconstituency effects and of resolving the methodological difficulties of so doing. Which subconstituencies in Supreme Court confirmation politics are likely to influence senators? One possibility is racial or ethnic groups. For example, public opinion among African-Americans and Hispanics loomed large in the politics surrounding the respective nominations of Justice Thomas in 1992 and Justice Sotomayor in 2009 (Overby et al. 1992, 6
8 Bishin 2009). In general, however, given the importance of partisanship in the Senate confirmation process (Epstein et al. 2006, Shipan 2008), and for the theoretical reasons discussed above, we would expect the views of partisan subconstituencies to play an important role in senators voting decisions. Perhaps most importantly, primary elections allow challengers to attack incumbents who do not heed their partisan constituents opinion. Indeed, Senate lore contains ominous warnings on this front. Despite being virtually unknown, Carol Moseley Braun defeated incumbent Sen. Alan Dixon in the Illinois Democratic primary in 1992, principally campaigning against his vote to confirm Clarence Thomas a year earlier. Similarly, Sen. Arlen Specter of Pennsylvania faced a strong primary challenge leading up to the 2010 election, with his vote against confirming Robert Bork in 1987 playing a large role in driving conservative support away from him (this challenge eventually lead Specter to switch parties in 2009). More generally, Lee (2009) shows that much conflict in the modern Senate can be characterized as partisan fights, and is not simply about ideology. This account would also support the argument that senators should be more mindful of their partisan constituents in high-stakes nomination fights. Indeed, as we show below, public opinion on nominees is often polarized among partisans in the electorate, meaning that senators often face conflicting constituencies when they go to cast a vote on a nominee. Thus, we argue that in general the partisan subconstituency is key for evaluating these sets of votes. Testing whether senators respond more to the median voter or their in-party median requires us to generate nomineespecific estimates of public support, broken down by partisan constituencies. In doing so we must overcome the methodological limitations outlined above. Specifically, we need to have measures of subconstituency policy preferences that relate directly to roll call votes on Supreme Court nominees and that are on the same scale. 3 Data and Methods Estimating opinion. To evaluate the role of subconstituency opinion on roll call voting on Supreme Court nominees, we estimate opinion by party for 11 recent nominees for which data exists (see the Supplemental Appendix [SA] for more details): Rehnquist (for Chief Justice 7
9 in 1986), Bork (1987), Souter (1990), Thomas (1991), Ruth Bader Ginsburg (1993), Breyer (1994), Roberts (2005), Miers (2005), Alito (2005), Sotomayor (2009), and Kagan (2010). All were eventually confirmed except Bork (defeated in a floor vote) and Miers (nomination withdrawn before a vote). To generate the required measures of public opinion, we develop and employ a significant extension to Multilevel Regression and Poststratification, or MRP, a technique originally developed in Gelman and Little (1997) and assessed by Park, Gelman and Bafumi (2006), Lax and Phillips (2009), and Lax and Phillips (2013). It combines detailed national survey data and Census data with multilevel modeling and poststratification to estimate public opinion at the subnational level. The extra information in these data allow for accurate estimates of state or district-level opinion using a relatively small number of survey respondents as few as contained in a single national poll. Basic MRP has two stages. First, individual survey response is modeled as a function of demographic and geographic predictors in the survey data. The state of the respondents is used to estimate state-level effects, which themselves are modeled using additional state-level predictors such as aggregate demographics. Those residents from a particular state yield information on how responses within that state vary from others after controlling for demographics. All individuals in the survey, no matter their location, yield information about demographic patterns which can be applied to all state estimates. The second stage is poststratification: the estimates for each demographic-geographic respondent type are weighted (poststratified) by the percentages of each type in actual state populations, adding up to the percentage of respondents within each state who have a particular position. The previous evaluations noted above demonstrated that MRP performs very well in generating accurate state-level estimates of public opinion. It consistently outperforms raw state breakdowns, even for large samples, and it yields results similar to actual state polls. A single national poll and simple demographic-geographic models (simpler than we use herein) suffice for MRP to produce highly accurate and reliable estimates. How does MRP accomplish this? Intuitively, it compensates for small within-state samples by using demographic 8
10 and geographic correlations. There is much information within surveys that is typically thrown away; MRP makes use of it. Since we will incorporate uncertainty from our response models in our estimates of opinion and throughout the analysis, we can show that our results do not depend on assuming we have perfect models of response. A standard use of MRP is sufficient to generate state-level estimates of opinion, but cannot produce estimates of opinion by partisanship. The second stage of MRP involves poststratifying the estimates based on the Census 5-Percent Public Use Microdata Sample s population frequencies, but this data does not include partisan identification. Thus, using standard MRP one can estimate the level of support for, say, Samuel Alito among college-educated Hispanic males aged in New Jersey, but one cannot estimate the level of support among Republican, Independent or Democratic individuals of the same type. In general, using standard MRP to generate fine-grained estimates by variables not gathered by the Census (such as party or religion) is not possible directly. We have devised a method for doing so, producing three generally applicable extensions to MRP. Using non-census demographics with MRP. Full technical details of the procedure are given in the Appendix, where we explain how all estimates are produced. Here we give the intuition behind the methods. Our approach involves using an additional stage of MRP to generate the necessary poststratification file from the Census poststratification data and additional survey data. First, we collected data on individual survey responses about partisan identification (i.e. whether a respondent is a Democrat, Republican, or an Independent) across multiple points in time spanning the years of the nominations in our data. We then model partisanship as a function of demographic and geographic variables. Specifically, we treat partisanship as a response variable and apply standard MRP to estimate the distribution of partisanship across the full set of demographic-geographic types (e.g., 4,800 for recent nominees). We then have an estimate of the proportion of Democrats, Independents, and Republicans among, say, college-educated Hispanic males aged in New Jersey. This step splits the 4,800 types into a more expansive poststratification 9
11 structure, with 14,400 (4,800 3) partisan-demographic-geographic types. The extra level of MRP provides us with an estimate of the information that would be readily estimated via standard MRP if the Census data included partisan identification. We can now fit multilevel models of opinion on nominees and weight predicted responses by the full typology. Incorporating uncertainty into MRP. It is sometimes suggested that when using generated regressors or other constructs measured with uncertainty, one should incorporate the uncertainty in these variables (Achen 1977). To be sure, it is not standard practice to incorporate uncertainty in regressors; 1 the degree to which it matters depends on the amount and correlates of the uncertainty, not the source (that is, generating a regressor from prior analysis is not different from using any other data source that contains error). We go beyond existing work by accounting for uncertainty from multiple stages leading to our opinion estimates, but also present normal results which take these estimates as given. To do so, we make use of a method sometimes called propagated uncertainty or the method of composition (Treier and Jackman 2008). Rather than using analytical methods, we use empirical distributions to simulate uncertainty from each modeling stage (based on the variance-covariance matrix of a given multilevel model) and propagate it through the rest of the analysis. This yields uncertainty around all final estimates. Our estimates of subconstituency opinion have two sources of uncertainty. First, we estimate the distribution of partisanship across the Census types using a model. As with any model, there will be uncertainty in the resulting coefficients. Using the variance-covariance matrix of the model, we draw 1,250 sets of coefficients, so that the empirical distribution of these captures the uncertainty estimated by the model. Each set is used to predict partisan type for our base demographic-geographic types, so that we now have 1,250 party poststratification sets. Thus, we have 1,250 estimates of the proportion of Democrat, Independent, and Republican among college-educated Hispanic males in New Jersey aged Measures like survey estimates, ideology scores, indices, and scales are usually measured with error that is ignored when these measures are used as independent variables. 10
12 We next model nominee support as a function of the nuanced demographic-geographicpartisanship categories that are now possible. We produce 1,250 random draws of the coefficients based on the model s variance-covariance matrix. Each set of coefficients is combined with one of the 1,250 poststratification sets, so that we now get 1,250 estimates of nominee support for each type of respondent, and therefore for each party constituency in each state. These estimates of opinion incorporate the uncertainty from the party-poststratificationcreation stage and the nominee support stage. Finally, when we want to model roll-call voting, we run a desired model for each of the 1,250 opinion sets. This new model also has uncertainty, of course, and we draw one simulated draw each time so as to incorporate that. If we did not do this, it would be as if only the opinion estimates had uncertainty, not the roll call models. 2 We now have 1,250 sets of estimates of the effects of opinion on roll-call voting as well our other predictors. We use these to form confidence intervals. Each time we push the uncertainty from previous analyses into subsequent stages, until we wind up with a distribution of results for our main substantive analysis that reflects all underlying uncertainty from each stage of the process: we incorporate the uncertainty from our party ID model to create uncertainty for the poststratification weights, which then propagates into our models of nominee support to create uncertainty around opinion estimates. Finally, all uncertainty is propagated into the final roll-call voting model. Multinomial response. There is another complication that we set aside in the foregoing discussion, though it affects both MRP stages. In the party poststratification creation stage, we want to estimate the three-way party split (Democrat, Independent, or Republican). In the nominee support stage, we want to estimate the probability of supporting a nominee, opposing a nominee, and neutrality (not having an opinion). It is difficult to implement 2 Imagine if we had perfectly measured opinion so that opinion estimates did not vary. The 1,250 sets of roll call model coefficients would be identical and we would therefore have empirical estimates of zero standard errors, despite uncertain in each vote model. By drawing simulated coefficients from each vote model, we incorporate this vote model uncertainty. 11
13 MRP (or do any multilevel modeling) where the dependent variable is not dichotomous or continuous. It is theoretically possible to implement a fully Bayesian approach, but computationally infeasible for a complicated problem such as the one at hand. Instead, we employ a two-step solution. We nest one dichotomous analysis inside another, so that the combination leads to the three-way division. For example, to estimate the percentage Democratic (D), Independent (I), and Republican (R), we first predict D versus I or R (these two lumped together so that 1 means D and 0 means other) in a binary logistic regression. Then, we drop all Ds and take the remaining data to predict I (1) vs R (0), conditional on not being a D. This nests the probability of I versus R within the probability of not being a D. Multiplying appropriately yields the percentage of each type. We refer to this as nested multinomial MRP. 3 To ensure the ordering of these steps does not matter (we started with D versus other), we repeat the entire process starting from the other side (starting with R versus other). We then average the results from both orderings. For nominee support, we do similarly, predicting support versus other, and then making a conditional prediction of neutrality versus opposition; followed by starting from the other side; and averaging. We provide code for all the above extensions. Visualizing subconstituency opinion. We begin our exploration of the opinion estimates in Figure 1, which depicts kernel density plots of our estimates of support among opinion holders, broken down by Democrats, Independents, and Republicans, across states. Republican and then Democratic nominees are ordered by increasing state-level mean support. That is, the unit of analysis is states, broken down by each type of opinion (so each density plot summarizes 50 estimates of opinion). The dots under each distribution depict the mean of that respective distribution. Vertical dashed lines depict median state-level support. Note that support for nominees is always higher on average, and indeed very high 3 This can be less efficient than a full Bayesian approach in that we lose the gains from doing things in one step, such as assuming constant coefficients across stages as in ordered logit or assuming other variances remain similar as in multinomial logit. 12
14 in absolute terms, among constituents from the president s party. Figure 1 also reveals that polarization defined as the difference between median Democratic and Republican opinion varies significantly across nominees. Recent nominees Miers, Alito, Sotomayor, and Kagan generated large divisions of opinion, as did Bork. On the other hand, the nominations of Souter, Ginsburg, and Breyer generated little polarization and substantial overlap across constituencies. We observe the widest differences within party for the nomination of Rehnquist to become Chief Justice. Figure SA-1 in the SA shows how opinion varies across both states and constituencies, as well as the degree of uncertainty in our opinion estimates. Taken together, these figures show that if senators respond differently to partisan constituencies the effects on roll call voting can be quite consequential. 4 Models of Roll Call Voting Excluding Miers and abstentions, a total of 991 confirmation votes were cast on ten nominees, 71% to confirm the nominee. Our key tests evaluate how the probability of a confirmation vote changes as subconstituency opinion changes. Doing so requires careful accounting of not just nominee support by a particular group, but also potentially the size of that group. To illustrate our measures, consider public opinion in Ohio on the confirmation of Justice Sotomayor. We limit the denominator to those with an opinion, which is 82.5% of Ohioans (this is from one particular sample and just used to enable the example). Of those polled who held an opinion, 33.3% were Democrats, 83.8% of whom said confirm; 32.2% were Republicans, 23.6% of whom said confirm, and 34.6% were Independents, 50.6% of whom said confirm. Of all Ohio opinion holders, 53.0% supported confirmation. We measure supporters as the share of state opinion holders who support the nominee. A one-unit shift means that 1% of state opinion holders who fall in a particular category, such as constituents in a senator s party, switch from non-support to support. This shift is relative to the size of the state s opinion-holding population; what share of the party population this is depends on party size. That is, this unit shift flips a fixed share of the state opinion-holding population, 13
15 but an unfixed share of the party population (see the SA). 4 Predictors of roll-call votes. Our main predictors are defined as follows: Supporters out of all opinion holders: the % of opinion holders that support the nominee. Supporters in senator s party: the % of opinion holders that share the party affiliation with the senator in question and support the nominee. We denote this category IN in the text for ease of presentation. In some models, we add: Supporters in opposition party: the % of opinion holders who are in the opposite party and support the nominee. We denote this category OPP, and distinguish them from independent supporters, whom we denote IND. (We sometimes use NOT IN to describe all those not in the senator s party that is, combining IND and OPP). In models that include OPP, there are six possible categories of opinion holder, summing to 100% (IN vs. IND vs. OPP support vs. not). Otherwise, there are only four (IN vs. NOT IN support vs. not). We fix the partisan breakdown of the opinion holder population: Percentage of opinion holders in the senator s party Percentage of opinion holders in the opposite party. Based on the existing literature, we include additional predictors as control variables, similar to Epstein et al. (2006). These include: nominee quality, ideological distance between a senator and a nominee or their locations (senator relative to president s party and nominee relative to senator party), and whether the senator is of the same party as the nominating president. These studies show that senators are more likely to support nominees from a 4 With partisan group size held constant, changes in the opinion variables reflect shifts of those with a particular partisan ID, rather than increases in the size of that partisan subgroup as well as an opinion shift. One can set all this up differently, so long as one is careful about interpretation. One could change the meaning of a unit shift to be a percentage of a party group that shifts rather than a percentage of the entire opinion holding population that shifts; results were similar for different ways of compartmentalizing opinion groups. 14
16 president of their party, more likely to support high quality nominees, and less likely to support ideologically distant/extreme nominees. These measures are defined as follows: Quality: The degree to which a nominee is qualified to join the Court (according to newspaper editorials (Cameron, Cover and Segal 1990)). It ranges from 0 to 1 (most qualified). Ideological distance between senator and nominee, or the Location of one or both. For senators, we use DW-nominate scores. For nominees, we employ the scores in Cameron and Park (2009). The authors use the past experience of each nominee (e.g. whether they served in Congress) to develop Nominate-Scaled Perception scores, placing nominees on the same scale as senators. For models using location rather than distance, we flip the senator location measure around its mean so that higher values indicate greater distance from the ideological side of the president and nominee location around its mean so that higher values indicate greater distance from the senator s side ideologically (e.g., conservative for Republicans). Senator in president s party: Coded 1 if the senator is a co-partisan of the president. We estimate logit models in which the dependent variable is whether a senator voted to confirm or reject. In some models, we split opinion into two components: IN opinion versus NOT IN opinion. In other models, we break opinion down into three components: IN, IND, and OPP. Next, we vary the way in which we estimate the effect of senator and nominee ideology. In some models, we look only at the location of the senator, while in others we employ the distance between the senator and the nominee, and sometimes the location of both nominee and senator (depending on what is possible given inclusion of nominee fixed effects). (Distance models assume that senators become less inclined, ceteris paribus, to vote for a nominee as distance increases between them, whether towards one side or the other; location models allow for senators to respond to ideological position rather than distance, so that, say, a conservative senator can accept a too conservative nominee but not a too liberal one). Next, in some models, we employ random effects to estimate varying intercepts for each nominee, while in others we models we employ fixed effects. The latter have the advantage of capturing unobserved heterogeneity across nominees (putting in a black box 15
17 any reasons for such heterogeneity), but at the cost of removing predictors that do not vary within nominees (quality and nominee ideology). Random effects both allow us to include these predictors and provide efficiency gains from partial pooling, at the cost of making a mild distributional assumption about nominee heterogeneity. Finally, some models use point estimates of nominee support as fixed; in others we incorporate the full uncertainty of our estimates into the model estimation. This allows us to gain a sense of whether the uncertainty in the opinion estimates influences our results and whether the noise around opinion effect estimates comes from the noise around opinion estimates or around the effects themselves. Main results. The models split opinion in one of three ways:.1 models split it oneway (without breaking down by constituency, for a baseline);.2 models split it two-way (pooling IND and OPP opinion together); and.3 models split it three-way (IN support versus IND support versus OPP support). Given these variations and the usage of different controls, there are 12 distinct models, each done once with normal point estimates (Table 1) and once with full uncertainty (Table 2). The former show standard errors and the latter confidence intervals, given that we use empirical distributions to calculate uncertainty (we show 90% confidence intervals, allowing for one-tailed 95% significance tests). In both Table 1 or 2, the first row shows the extra impact of in-party opinion. 5 Looking across the models that include Supporters in Sen. Party, this coefficient is sizable, and there is strong statistical evidence of a large effect. (The results using point estimates of 5 The key coefficient, Supporters in Sen. Party, captures the effect of raising IN support holding overall support constant. This means that calculating the total effect of adding IN support requires adding two coefficients (when IN support goes up, so does overall support, Supporters ). The extra effect of a point of IN support is relative to the effect of adding a point of NOT IN support in.2 models or OPP support in.3 models. This is the same effect we would see if we simultaneously flipped one unit of opinion holders who are IN from yes to no and flipped one unit of opinion holders who are NOT IN or OPP from yes to no. 16
18 opinion show, as we would expect, slightly larger and more precise effects.) We conclude, with much confidence, that there is indeed a large partisan constituency effect. More concretely, in the.2 models, estimated difference between IN and NOT IN effects are.16,.12,.20,.09 for the point estimate models and.15,.10,.19 and.08 for the full uncertainty models. Based on the simulations, we can calculate the probability that the effect difference between IN and NOT IN is statistically greater than zero. In the point prediction models, the probabilities of a positive difference in effect are.97,.98,.98, and.93 (similar to p-values between.03 and.07). For the full uncertainty models, these probabilities are.95,.95,.97, and.89 (p-values between.03 and.11). Table 3 summarizes and highlights these effects and differences, along with other effects and differences we calculated using the simulation results and the full uncertainty models (e.g., the Difference between IN and NOT IN in Table 3 is the equivalent of the first row in Table 2). To grasp the magnitude of the differential partisan effect, suppose we flipped 1% of state opinion holders consisting of IN constituents from opposition to support, while at the same time decreasing NOT IN support. Total support remains the same. This change means a likelihood of a yes vote that is up to five percentage points higher, for a senator on the fence (the logit curve is steepest, with larger substantive effects, around 50%). This extra effect ranges from 2.5% 4.8% across full uncertainty models. Independents. Can we also distinguish the effects of IN opinion from IND, and/or the effects of IND from OPP party opinion, using the.3 models? Not really. The first two tables make it possible to see the difference in effect between IN and NOT IN opinion, and between IN and OPP. Table 3 shows these more easily along with other full-uncertainty estimates of effects and differences in effects. We note four things. First, the effect of IND itself is small and imprecisely estimated. Next, IN support is likely to have a larger effect than IND support. The difference between IN and IND opinion is positive and large, and the probability that in-party opinion is greater than independent opinion is about 80-85% across models). Third, OPP support has a small and usually insignificant effect. Finally, 17
19 we are not able to find clear evidence differentiating the effects of IND opinion from OPP opinion. Overall, we lack enough data relative to uncertainty to say much that is conclusive about IND comparisons in these three-way models, but can still see that IN has a clearly larger effect than OPP and that it is likely that IN has a larger effect than IND. The Usual Suspects Other predictors perform as expected (note that controlling for in-party opinion and senator ideology, senators in the president s party are not more likely to approve a nominee than senators of the opposite party, ceteris parabus). To give a sense of relative effect magnitudes, in Model 1.2, a two standard deviation swing in quality could lead to a swing of up to 44 percentage points in the chance of voting yes. Going from an Alito (who has a quality score of.81) to a Roberts (.97) increases the chance of a yes vote by up to 16 percentage points; going from an average nominee to Roberts increases it by up to 28 points. With respect to ideological distance, if Senator McCain had been on the fence for both Justices Ginsburg and Breyer, the additional ideological distance to the former would have reduced his chance of voting yes by up to 22 percentage points. 5 Congruence and Democratic Performance What is the bottom line for democratic representation given the partisan constituency effect? To answer this, we turn to a congruence analysis, measuring how often a senator s vote on a nominee matches what the median voter among opinion holders in his state wants, and how often these votes match the median voter within the senator s own party or opposition party. We present this information in the top part of Figure 2 (with 95% confidence intervals depicted by the horizontal line around each estimate). We find congruence with the median voter of the entire state 75% of the time. This statistic, however, obscures a big difference in terms of partisan representation: majorities among opinion holders in the senator s own party will see their senator vote the way they want 87% of the time, whereas those in the opposing party will only see their senator vote the way they want 56% of the time. When a senator s constituencies are in conflict, how does she weigh her competing constituencies? The second part of the graph depicts the percent of yes votes for all the nominees, 18
20 according to which constituencies favor confirmation. The percentages under the lefthand labels in this part of the graph depict the proportion of observations that fall into each category and the confidence intervals around that proportion. Finally, the two-by-two table underneath the figure summarizes the breakdown of yes votes by state median and party median opinion. Flipping the support of the state median (i.e. moving across the columns) changes the voting far less than flipping the party median (i.e. moving down the rows). Both the state median and party median favor confirmation around 69% of the time. When this happens, a senator votes yes 90% of the time. The party median favors confirmation and the state median does not around 4% of the time when this happens, the percentage of confirmation votes (82%) is a bit lower than when both constituencies agree. That is, flipping the median voter in the state but keeping the in-party median voter as is slightly changes the chances of getting a yes vote. Conversely, the state median favors confirmation in opposition to the party median 19% of the time, and then a yes vote occurs only 27% of the time. Finally, in 8% of cases neither median favors confirmation, and there are only 4% of yes votes when it happens. A nominee seeking a senator s vote would much rather have the median voter in the senator s party on her side than the median voter in the state. Consider Justice Sotomayor: 34 voting senators faced conflicting constituencies (based on point estimates). The five conflicted Democrats (Begich-AK, Conrad-ND, Dorgan-ND, Johnson-SD, and Nelson-NE) all voted yes with their party median. Of the 29 conflicted Republican Senators, all but nine sided with the party median against the state median by voting no (the nine: Martinez-FL (facing a large Hispanic constituency), Lugar-IN, Collins- ME and Snowe-ME, Bond-MO, Gregg-NH, Voinovich-OH, Alexander-TN, and Graham-NC). More generally, suppose that the support of either the median voter or the party median voter perfectly predicted how a senator votes. Then, vote totals for each of the nominees would be as shown in Figure 3. (We set aside uncertainty.) The fate of some nominees would not vary much if they moved to Median Voter World or Party Median Voter World. Judge Bork would not have become Justice Bork in either alternate scenario, and 19
21 those nominees would also see little variation in their vote margins. On the other hand, Justices Alito, Rehnquist, Sotomayor, Kagan, and Roberts all show large gaps between the two scenarios. The voting on Justice Alito closely resembled that in Party Median Voter World. Of the 10 nominees with votes, four show strong evidence of party influence, one is a tie (Roberts), and five are ambigious given similarities between such worlds. Thomas is an outlier. Both scenarios show easy confirmation. Yet, he was narrowly confirmed. Miers of Party Median Voter World would fall below the filibuster threshold, though she would have exceeded it with many votes to spare in Median Voter World. Kagan, Sotomayor, and Rehnquist were also possibly saved from the filibuster by the pull of the median voter and the less than dispositive role of the party median. Note that the tendency to follow the party median, even where the outcome for the nominee is unchanged, drastically increases polarization in the confirmation process, by increasing the no votes of the opposition party. 6 Discussion and Conclusion Our fine-grained study of representation, focusing on votes by senators for or against the confirmation of Supreme Court nominees, reveals a somewhat distorted electoral connection. Confirmation politics is responsive to the public will but not as previously thought. We find that senators weigh the opinion of their fellow partisans far more heavily, that they resolve the tradeoff in representing their median constituent and median party constituent in favor of co-partisans. This partisan constituency effect has significant substantive effects on voting behavior and can be troubling to normative democratic theory. When party constituents have such strong influence, a distortion to median representation occurs on top of any distorting effects due to the co-partisan electorate itself. That is, if senatorial candidates are chosen by more extreme electorates, that alone can mean that senators will not be perfectly representative. That they give extra attention to their in-party constituents even controlling for their own ideological preferences is then a particularly strong partisan distortion. Majority control over policy becomes far more difficult when the two parties do not converge towards the median, but instead represent influences of one extreme 20
22 side or the other. Our results thus show how electoral incentives can polarize elites. Even in a relatively smooth distribution of opinion, partisan groupings that have disproportionate influence can lead to polarized voting behavior. A more optimistic reading of our results is that we still find responsiveness to mass opinion even if it is unequal responsiveness. More broadly, our results provide a new understanding of the factors that drive the roll call votes of senators. We show, for example, how important partisan opinion is relative to other forces, such as senator ideology and partisan loyalty. In Median Voter World, the electoral connection ties a representative back to his constituents strongly enough to make the median voter king (or queen). This seems a reasonable baseline for assessing democratic performance. If a representative gives extra weight to his fellow partisans back home, this implies a distortion of the electoral connection that ties a representative to his district or state, with policy pulled away from the median voter. Or, at least, the co-partisan electoral connection would be undercutting the regular electoral connection. In this sense, our results provide more evidence for leapfrog representation : replacing a representative from one party with one from the other results in voting behavior that jumps from one side of the median voter to the other (Bafumi and Herron 2010). Further, our results refine our understanding of the relationship between the public and the Court. There is a persistent debate over the proper role of the Court in society, and the degree to which we should be concerned that unelected life-appointed justices can block the majority will, as enacted through its elected representatives. One of the few external checks on this possible counter-majoritarianism is political control by the president and senators over who becomes a justice in the first place a check that only acts preemptively, through the confirmation process. If the median voter controlled such nominations, fears of countermajoritarianism would be ameliorated to some extent. However, if a senator s co-partisans are given disproportionate attention, the democratic linkage between Court and public is again called into question, and we have more reason to worry that the nomination and confirmation process might make the Court more counter-majoritarian, rather than less. 21
23 Moreover, these worries may be compounded by the current era of partisan polarization in Supreme Court nomination politics. Cameron, Kastellec and Park (2013) uncover two types of polarization. First, as is well known, the Senate has become increasingly polarized over the last 30 years or so. Second, as is less well known, nominees have become increasingly more polarized. Whereas responsiveness to the median voter by senators might counter the possibility of ideological polarization on the Court itself, partisan representation points in the opposite direction. This is especially true of justices confirmed during periods of unified government as has been the case with the last six justices. Our results also emphasize the important of Senate control. In median vote world, small partisan majorities in either direction would likely not constrain a president s choice of nominees and the process need not be as divisive. But in party world, if the opposition party controls the Senate, a president might be far more constrained in the extent to which he can appoint an ideological ally or even a moderate. With the Republicans taking control of the Senate in 2015, should a justice retire in the coming two years, the prominence of party world would play a huge role in President Obama s calculation of what type of nominee would be confirmable. Because we focused on a particular type of roll call vote, we must be tentative in making any claims about the generalizability of our results. Still, while Supreme Court confirmations are certainly special, we see no reason to believe that our findings would not also apply to high profile votes in the Senate, such as war resolutions, treaties, and major legislation. And, while extrapolating to the House requires more faith, the incentives that drive our results are also likely to apply to high-profile votes in that chamber. It is such votes, of course, that voters are most likely to be aware of, meaning representatives will be most likely to weigh competing subconstituency pressures, should they diverge. A worthy endeavor would be to extend our analysis to other important issue areas and see if our results hold. Similarly, the variation we find in responsiveness leads naturally to the question of what institutional and contextual factors predict when a representative will choose to side with one constituency over another. Our approach could easily be extended to study how variation in opinion interacts 22
24 with factors such as proximity to elections and primary types in predicting responsiveness. 6 To that end, we conclude by reiterating a methodological point. We have extended earlier work on generating model-based estimates of opinion from national polls an extension that can be applied in many other areas of research in the future. Two-stage MRP will allow a researcher to estimate opinion within states or even potentially congressional districts, broken down by partisanship or many other factors, using data commonly available in surveys and the Census. We hope that this extension of the basic MRP approach will point the way towards more nuanced analyses of public opinion and its effects on public policy and choice, and more fine-grained studies of legislative and policy-making behavior. Specifically, subgroup opinion estimates that are useful for the exploration of a wide variety of research questions should now be in reach. Besides breaking down opinion using information currently used in Census weighting data, one can now estimate opinion by any categorization for which sufficient polling data are available (in the same polls or others). Finally, we also have incorporated multiple layers of uncertainty surrounding MRP estimates into our substantive analysis, while comparing our findings to those based on the MRP point predictions. Collectively, these innovations should allow researchers to pursue more concrete answers to vital questions about the extent and quality of representation. 7 Appendix Here, we provide technical details on how we generated our estimates and incorporated their uncertainty into our regressions of roll call voting. The first step was to estimate partisanship as a function of demographic and geographic predictors. We collected every Gallup poll in 1980, (there were fewer polls in 1990), 2000, 2005, and 2010 that asked party identification. The advantage is that Gallup s question wording did not change across these years: In politics, as of today, do you consider yourself a Republican, a Democrat, or an Independent? Leaners are coded as Independents, as are non-responses (under 5%). 6 In the SA, we discuss inconclusive evidence that senators give extra attention to their fellow partisan constituents when that group is larger than the other partisan group. 23
25 We weight estimates from the two closest decennials, if nominations do not fall on the exact decennial. We have Census PUMA data for 1980, 1990, and For 2009 nominees, we use 2009 Census ACS data (the 2010 PUMA sample was never released). Since the Census does not directly provide weights by party, which is necessary for the poststratification part of MRP, we need to estimate this more nuanced poststratification data. The first stage is to estimate the probability that each respondent in our surveys is one of three partisan categories: D, I, or R. Using a multilevel model, we then move from these individual responses to estimates of partisanship for each demographic-geographic type. Because partisanship comprises three categories, we employ what effectively is a multinomial or ordered logit, estimated using a two-stage nested procedure. While this is less efficient than doing so in a single multinomial stage, it allows us to build off of the MRP package (available on GitHub). The loss of efficiency increases confidence intervals around our results. For each year, we code responses as a function of race and gender (males and females broken down into black; Hispanic; or white or other); one of four age groups (18-29, 30-44, 45-64, and 65+); one of four education groups (less than a high school education, high school graduate, some college, and college graduate); an interaction between age and education; state-level ideology (updated from Erikson, Wright and McIver 1993); and state. In a given year, we first estimate the probability that a respondent is a Democrat against the probability he is not (pooling Independents and Republicans). Then, conditional on not being a Democrat (excluding Democrats from the data), we then estimate the probability of being a Republican against being an Independent. Formally, let y( ) = 1 denote a positive response (Democrat 1 and other 0). For individual i (i = 1,..., n), with indexes r, k, l, m, s, and p for race-gender combination, age category, education category, and state respectively: Pr(y( ) = 1) = logit 1 (β 0 + α race,gender r[i] + α age k[i] + αedu l[i] + α age,edu k[i],l[i] + αs[i] state ) (1) The grouped terms are random effects, modeled as a normal distribution with mean zero and endogenous variance, except for the state effect which is relative to state ideology. αr race,gender N(0, σrace,gender 2 ), for r = 1,..., 6 αage k N(0, σage), 2 for k = 1,..., 4 24
26 α age,edu k,l N(0, σage,edu 2 ), for k, ; = 1,..., 4 αedu l N(0, σedu 2 ), for l = 1,..., 4 (2) α state s N(β ideo relig s + β ideo ideo s, σ 2 state), for s = 1,..., 50 Next, we use the coefficients that result from these models to calculate predicted probabilities of being a particular partisan type for each demographic-geographic type. Let j denote a cell in our list of demographic-geographic types (4,800 demographic-geographic types, 96 within each state). For each cell j we have the population frequency derived from the Census sample from the desired year. We then split each cell j into three parts. The results above allow us to make a prediction of each type of support, (ˆθ j DEM, IND ˆθ j, GOP ˆθ j ) based on the inverse logit given the relevant predictors and their estimated coefficients, as estimated in Eq. (1). The first run, predicting Democrats against others, gives the probability of being a Democrat. The second run, splits the remaining part of the cell into Republicans and Independents. Thus the probabilities will always sum to 100%. So, the preexisting cell frequency is multiplied by partisan group share, as calculated above, to create a new set of frequencies, with three times the original number of cells, leading to 14,400 demographic-geographicpartisan types. Formally, N j denotes the actual population frequency of a given cell j. A given cell j will be split into three cells, with frequencies: N j ˆθDEM j ; N ˆθGOP j j ; and N ˆθIND j j. Let q denote a cell in this new poststratification file (to distinguish it from j), specifying a demographic-geographic-partisan type, and let N q denote its population frequency. In terms of programming, the blme package in R which fits Bayesian linear and generalized linear mixed-effects models uses point predictions for the variance parameters (the priors used in the blme models were the default Wishart distribution). This requires the use of the sim function in the arm package to generate uncertainty estimates. It produces simulated samples of coefficients to empirically represent uncertainty. These then are each used to produce a set of party-poststratification weights. To confirm that starting with Democrats did not affect results, we redid the entire process, starting with probability of being a Republican and then the conditional choice of otherwise being a Democrat or Independent. Probabilities were similar. We averaged the results from the two starting points. 25
27 With these party-poststratification weights in hand, we can now turn to estimating public opinion on nominees among each partisan sub-constituency in every state. Instead of modeling partisan identification, we now model nominee support. We first model explicit support for the nominee (y yes i = 1) against other responses (y yes i = 0 for an explicit negative response, don t know, or refused ). Then a nested model predicts an explicit negative response against don t know. We did the process again, but starting with the negative response and pooling the others, then averaging results from both starting points (just as we did above). The specification of the model is similar to that given above, except we now add a random effect for party, and we substitute state-level ideology for presidential vote (we found that state-level ideology is a better measure for capturing support for a liberal or conservative nominee; presidential vote is better at capturing partisan identification). For i = 1,..., n, P r(y yes i = 1) = logit 1 (β 0 +α race,gender r[i] +α age k[i] +αedu l[i] +αage,edu k[i],l[i] +αstate s[i] +α party p[i] ) For each nominee, we weight the cell frequencies based on the two nearest decennials to the year of nomination. For example, Justice Breyer was nominated in 1994, so we let his demographic-geographic-partisan frequencies equal.6 the 1990 frequencies +.4 the 2000 frequencies. For some nominees we only have race broken down into two categories (black and white/other, denoted wb below), yielding so that there are 9,600 poststratification cells. For some, Hispanic is a separate category (denoted wbh) yielding 14,400 cells in total. 7 We then use the results from the model in equation (6) to make a prediction of pronominee support, ˆθq, for each cell q. To get state-level estimates, we next poststratify, weighting the prediction by Nq adj. Formally, let ˆγ denote an estimate of nominee support at a given level of aggregation. For each state, we then calculate the estimated percentage who support the nominee, aggregating over each cell q in state s. Thus, ˆγ s = P P q s Nq ˆθ q q s Nq. 7 The poststratification files used are as follows (1980wb, for example, means the 1980 poststratification file using only two race categories): for Bork and Rehnquist, a weighted average of 1980wb and 1990wb; for Thomas, Souter, Ginsburg, Breyer, a weighted average of 1990wb and 2000wb; for Alito, Roberts, Miers, 2005wbh; for Sotomayor and Kagan, 2009wbh. 26
28 This process yields estimates of explicit support for each nominee in each state. To obtain estimates for each partisan group in each state, we perform similar calculations, each time restricting the aggregation of probabilities in individual cells to a specific partisan subgroup. Let qd denote Democratic cells, qr denote Republican cells, and qi denote Independent cells: ˆγ DEM s = Pq (s qd) N q adj ˆθ q Pq (s qd) N q adj ; ˆγ GOP s = Pq (s qr) N q adj ˆθ q Pq (s qr) N q adj ; ˆγ IND s = Pq (s qi) N q adj ˆθ q Pq (s q) N q adj For each model, we generate 1,250 sets of simulated response model coefficients, so that the variation reflects a empirical distribution capturing uncertainty around the point prediction (median across sims) for the coefficients. For each of these, we could then generate poststratifications, leading to 1,250 sets of ultimate estimates. We repeated the above flipping the nesting, and starting with explicit opposition to the nominee against the other two categories, then modeling support versus neutrality. Again, we get 1,250 sets of estimates. We averaged the estimates across the two ways of doing the nesting. Finally, for each of the 1,250 estimate sets, we run our roll call vote models. We then use the sim function once last time to pull a single draw of coefficients from the model given the uncertainty in that model. We now have 1,250 sets of roll call vote model coefficients, the empirical distributions of which can be used to calculate confidence intervals. We reran the entire process a few times. Key results correlated across runs at.999, showing that 1,250 simulations is sufficient. References Achen, Christopher H Measuring representation: Perils of the correlation coefficient. American Journal of Political Science pp Aldrich, John H Why Parties? The Origin and Transformation of Political Parties in America. Chicago: University of Chicago Press. Ansolabehere, Stephen, James M. Snyder and Charles Stewart Candidate Positioning in U.S. House Elections. American Journal of Political Science 45(1): Bafumi, Joseph and Michael C. Herron Leapfrog Representation & Extremism: A Study of American Voters & Their Members in Congress. APSR 104(3). Bishin, Benjamin Tyranny of the Minority: The Subconstituency Politics Theory of 27
29 Representation. Philadelphia, PA: Temple University Press. Bishin, Benjamin G. and Christopher D. Dennis Heterogeneity and Representation Reconsidered: A Replication and Extension. Political Analysis 10(2):210. Bullock, Charles S. III and David W. Brady Party, Constituency and Roll-Call Voting in the U.S. Senate. Legisative Studies Quarterly 8(1): Cameron, Charles M., Albert D. Cover and Jeffrey A. Segal Senate Voting on Supreme Court Nominees: A Neoinstitutional Model. APSR 84(2): Cameron, Charles M and Jee Kwang Park How Will They Vote? Predicting the Future Behavior of Supreme Court Nominees, JELS 6(3): Cameron, Charles M., Jonathan P. Kastellec and Jee-Kwang Park Voting for Justices: Change and Continuity in Confirmation Voting Journal of Politics 2(283-99). Clausen, Aage R How Congressmen Decide: A Policy Focus. St. Martin s Press. Clinton, Joshua D Representation in Congress: Constituents and Roll Calls in the 106th House. Journal of Politics 68(2): Downs, Anthony An Economic Theory of Democracy. Addison Wesley. Epstein, Lee, Rene Lindstadt, Jeffrey A. Segal and Chad Westerland The Changing Dynamics of Senate Voting on Supreme Court Nominees. Journal of Politics 68: Erikson, Robert S., Gerald C. Wright and John P. McIver Statehouse Democracy Public Opinion and Policy in the American States. Cambridge University Press. Fenno, Richard Home Style: House Members in their Districts. Boston: Little, Brown. Fiorina, Morris P Representatives, Roll Calls and Constituencies. Lexington Books. Gelman, Andrew and Thomas C. Little Poststratification into Many Categories Using Hierarchical Logistic Regression. Survey Methodology 23(2): Gerber, Elisabeth R and Rebecca B Morton Primary Election Systems and Representation. Journal of Law Economics & Organization 14(2): Gerber, Elizabeth R. and Jeffrey B. Lewis Beyond the median: Voter preferences, District Heterogeneity, and Political Representation. J. of Pol. Econ. 112(6):
30 Kastellec, Jonathan P, Jeffrey R Lax and Justin H Phillips Public opinion and Senate confirmation of Supreme Court Nominees. The Journal of Politics 72(03): Lax, Jeffrey R. and Justin H. Phillips How Should We Estimate Public Opinion in the States? American Journal of Political Science 53(1): Lax, Jeffrey R. and Justin H. Phillips How Should We Estimate Sub-National Opinion Using MRP? Preliminary Findings and Recommendations. Paper presented at the annual meeting of the Midwest Political Science Association, Chicago, IL. Mayhew, David Congress: The Electoral Connection. Yale University Press. Miller, Gary and Norman Schofield Activists and Partisan Realignment in the United States. American Political Science Review 97(2): Overby, L. Marvin, Beth M. Henschen, Michael H. Walsh and Julie Strauss Courting Constituents? An Analysis of the Senate Confirmation Vote on Justice Clarence Thomas. American Political Science Review 86(4): Park, David K., Andrew Gelman and Joseph Bafumi State Level Opinions from National Surveys: Poststratification using Multilevel Regression. Stanford pp Peltzman, Sam Constituent Interest & Congressional Voting. J. Law & Econ. 27(1): Shapiro, Catherine R., David W. Brady, Richard A. Brody and John A. Ferejohn Linking Constituency Opinion And Senate Voting Scores: A Hybrid Explanation. Legisative Studies Quarterly 15(4): Shipan, Charles R Partisanship, Ideology and Senate Voting on Supreme Court Nominees. Journal of Empirical Legal Studies 5(1): Treier, Shawn and Simon Jackman Democracy as a Latent Variable. American Journal of Political Science 52(1): Wright, Gerald C Policy Voting in the US Senate: Who is Represented? Legislative Studies Quarterly pp
31 Nominee (Vote) Support among Democrats, Independents and Republicans Bork (R) Democrats Republicans Miers (R) (No vote) Independents Figure 1: The distribution of nominee support among Democratic identifiers, Independents and Republican identifiers. The graph depicts kernel density plots of our estimates of support among opinion holders. Nominees are ordered by increasing state-level mean support, except the four Democratic nominees (Ginsburg, Breyer, Sotomayor, and Kagan) appear last for clarity. The vertical dashed lines depict the median support across states. The dots under each distribution depict the mean of that distribution. The solid lines depict opinion among members of the president s party, the light dashed lines depict opinion among Independents, and the dark dashed lines depict opinion among members not of the president s party. Support is always higher, on average, among constituents from the president s party. Rehnquist (R) Alito (R) Thomas (R) Roberts (R) Souter (R) 90 9 Kagan (D) Sotomayor (D) Republicans Median (all) Democrats Ginsburg (D) 96 3 Breyer (D) Support for Nominee 30
32 Level of congruence of senator votes with the median opinion holding constituent, by constituency In senator's party (87%) Congruence of senator votes In the entire state Not In the senator's party (75%) (56%) Party median says yes, state median says yes 69% (66%, 71%) (90%) Yes votes, by opinion majority Party median says yes, state median says no 4% (3%, 6%) Party median says no, state median says yes 19% (17%, 23%) (82%) (27%) Party median says no, state median says no 8% (6%, 10%) Percent of yes votes for nominees, by various combinations of majority constituency support (4%) Yes votes, by state median and party median opinion State median says yes State median says no Party median says yes 90% 82% Party median says no 27% 4% Figure 2: Congruence in roll call voting on Supreme Court nominees, and percent of yes votes by opinion majority across constituencies. In the top part of the graph, each point depicts the level of congruence with the median voter (among opinion holders) in the respective groups, while the numbers in parentheses denote the actual values. Horizontal lines depict 95% confidence intervals. The bottom part of the graph depicts the percent of yes votes for all the nominees, according to which constituencies favor confirmation. The percentages under the labels in this part of the graph depict the proportion of observations that fall into each category, with the numbers of parentheses depicting 95% confidence intervals. Finally, the table below the graph depicts a 2 x 2 table of yes vote by state and party median opinion majorities. 31
33 Miers Bork Thomas Alito Kagan Rehnquist Sotomayor Roberts Breyer Souter Ginsburg M P P Party Median Voter World P P P P P P M M M Median Voter World M M MP P M M M P M MP Votes for Nominee Figure 3: Votes for nominees in Median Voter World and in Party Median Voter World. Each point depicts the actual number of votes each nominee received. Compared to this are the number of votes each nominee would have received if the median voter in each state (among opinion holders) controlled the senator s vote as well as the number of votes that would have been received if the median voter in the senator s party controlled the senator s vote. 32
34 Model 1.1 Model 1.2 Model 1.3 Model 2.1 Model 2.2 Model 2.3 Supporters in Sen. Party (0.09) (0.09) (0.06) (0.06) Supporters (0.03) (0.04) (0.08) (0.03) (0.03) (0.04) Supporters Independents (0.20) (0.10) Percent in Sen. Party (0.03) (0.06) (0.13) (0.03) (0.04) (0.07) Percent in Opp. Party (0.03) (0.03) (0.13) (0.03) (0.03) (0.07) Senator-nominee ideological distance (0.66) (0.67) (0.67) (0.66) (0.65) (0.65) Senator ideology Nominee ideology Senator in Pres. Party (0.66) (1.39) (1.41) (0.60) (0.95) (0.96) Quality (1.08) (1.10) (1.11) (Intercept) (2.51) (3.56) (8.98) (2.40) (2.81) (4.93) Nominee fixed effects no no no yes yes yes Nominee random effects yes yes yes no no no Model 3.1 Model 3.2 Model 3.3 Model 4.1 Model 4.2 Model 4.3 Supporters in Sen. Party (0.11) (0.11) (0.06) (0.06) Supporters (0.03) (0.05) (0.09) (0.03) (0.04) (0.05) Supporters Independents (0.21) (0.10) Percent in Sen. Party (0.03) (0.07) (0.13) (0.03) (0.04) (0.07) Percent in Opp. Party (0.03) (0.03) (0.15) (0.03) (0.03) (0.07) Senator-nominee ideological distance Senator ideology (1.06) (1.07) (1.07) (1.00) (1.00) (1.00) Nominee ideology (1.90) (1.95) (1.96) Senator in Pres. Party (1.84) (1.96) (1.96) (0.67) (1.01) (1.02) Quality (1.23) (1.11) (1.10) (Intercept) (2.83) (3.95) (9.40) (2.46) (2.88) (4.98) Nominee fixed effects no no no yes yes yes Nominee random effects yes yes yes no no no Table 1: Regression Results (Opinion Point Estimate Models). The table presents logit models of roll call voting, treating our estimates of opinion as point predictions (i.e. measured with certainty). Standard errors in parentheses. For descriptions of the models, see either the text or the caption to Table 2 in terms of predictors included, the models are exactly the same. 33
35 Model 1.1 Model 1.2 Model 1.3 Model 2.1 Model 2.2 Model 2.3 Supporters in Sen. Party ( 0.00, 0.29) ( 0.00, 0.31) (0.00, 0.20) (0.01, 0.20) Supporters (0.08, 0.18) ( 0.00, 0.15) ( 0.02, 0.23) (0.06, 0.16) (0.02, 0.13) (0.00, 0.14) Supporters Ind ( 0.43, 0.23) ( 0.15, 0.17) Percent in Sen. Party ( 0.03, 0.07) ( 0.15, 0.03) ( 0.34, 0.10) ( 0.04, 0.06) ( 0.11, 0.02) ( 0.14, 0.07) Percent in Opp. Party ( 0.07, 0.04) ( 0.07, 0.04) ( 0.31, 0.15) ( 0.06, 0.03) ( 0.06, 0.03) ( 0.11, 0.09) Senator-nominee ideological distance ( 6.89, 4.63) ( 6.91, 4.70) ( 6.88, 4.61) ( 6.95, 4.75) ( 6.84, 4.65) ( 6.80, 4.65) Senator ideology Nominee ideology Senator in Pres. Party (0.45, 2.67) ( 2.95, 1.85) ( 2.85, 1.91) (0.28, 2.30) ( 1.56, 1.48) ( 1.70, 1.39) Quality ( 0.32, 3.46) ( 0.26, 3.57) ( 0.24, 3.72) (Intercept) ( 10.82, 2.21) ( 8.38, 3.66) ( 13.36, 16.75) ( 10.35, 2.23) ( 8.44, 1.06) ( 11.76, 3.58) Nominee fixed effects no no no yes yes yes Nominee random effects yes yes yes no no no Model 3.1 Model 3.2 Model 3.3 Model 4.1 Model 4.2 Model 4.3 Supporters in Sen. Party (0.02, 0.40) (0.02, 0.39) ( 0.02, 0.19) ( 0.02, 0.19) Supporters (0.06, 0.17) ( 0.06, 0.12) ( 0.09, 0.21) (0.04, 0.14) (0.00, 0.12) ( 0.02, 0.13) Supporters Ind ( 0.45, 0.31) ( 0.14, 0.18) Percent in Sen. Party ( 0.05, 0.06) ( 0.22, 0.01) ( 0.38, 0.10) ( 0.05, 0.05) ( 0.11, 0.03) ( 0.14, 0.08) Percent in Opp. Party ( 0.06, 0.04) ( 0.06, 0.05) ( 0.31, 0.21) ( 0.06, 0.04) ( 0.06, 0.04) ( 0.11, 0.11) Senator-nominee ideological distance Senator ideology ( 11.10, 7.55) ( 11.09, 7.49) ( 11.18, 7.50) ( 10.59, 7.41) ( 10.39, 7.22) ( 10.46, 7.20) Nominee ideology ( 2.34, 4.05) ( 0.97, 5.19) ( 1.27, 5.33) Senator in Pres. Party ( 2.36, 4.10) ( 4.74, 2.84) ( 4.49, 2.90) ( 1.11, 1.08) ( 2.75, 0.75) ( 2.78, 0.67) Quality ( 0.30, 4.13) (0.07, 4.22) ( 0.02, 4.11) (Intercept) ( 9.18, 1.18) ( 5.58, 7.57) ( 13.63, 20.44) ( 8.21, 0.44) ( 7.09, 2.82) ( 10.50, 5.69) Nominee fixed effects no no no yes yes yes Nominee random effects yes yes yes no no no Table 2: Regression Results (Full Uncertainty Models). The table presents logit models of roll call voting where we incorporate the full uncertainty from each stage of our estimation. 90% confidence intervals appear in parentheses, which allow for one-tailed 95% significance tests. The models split opinion in one of three ways:.1 models split it one-way (without breaking down by constituency, for a baseline);.2 models split it two-way (pooling independent and out-party opinion together); and.3 models split it threeway (in-party support versus independent support versus out-party support). The Model 1. set includes nominee random effects and uses senator-nominee distance. The Model 2. set uses nominee fixed effects and senator-nominee distance. The Model 3. set includes nominee random effects and uses senator and nominee location. he Model 3. set includes nominee fixed effects and uses senator and nominee location. In each model, the N is
36 Model 1.1 Model 1.2 Model 1.3 Model 2.1 Model 2.2 Model 2.3 Effect of All (0.08, 0.18) (0.06, 0.16) Effect of IN (0.12, 0.32) (0.10, 0.40) (0.10, 0.26) (0.09, 0.26) Effect of NOT IN ( 0.00, 0.15) (0.02, 0.13) Effect of IND ( 0.25, 0.25) ( 0.04, 0.21) Effect of OPP ( 0.02, 0.23) (0.00, 0.14) Difference between IN and NOT IN ( 0.00, 0.29) (0.00, 0.20) Difference between IN and IND ( 0.12, 0.62) ( 0.08, 0.27) Difference between IN and OPP ( 0.00, 0.31) (0.01, 0.20) Difference between IND and OPP ( 0.43, 0.23) ( 0.15, 0.17) Model 3.1 Model 3.2 Model 3.3 Model 4.1 Model 4.2 Model 4.3 Effect of All (0.06, 0.17) (0.04, 0.14) Effect of IN (0.11, 0.37) (0.08, 0.44) (0.05, 0.24) (0.04, 0.24) Effect of NOT IN ( 0.06, 0.12) (0.00, 0.12) Effect of IND ( 0.28, 0.26) ( 0.05, 0.21) Effect of OPP ( 0.09, 0.21) ( 0.02, 0.13) Difference between IN and NOT IN (0.02, 0.40) ( 0.02, 0.19) Difference between IN and IND ( 0.15, 0.69) ( 0.12, 0.25) Difference between IN and OPP (0.02, 0.39) ( 0.02, 0.19) Difference between IND and OPP ( 0.45, 0.31) ( 0.14, 0.18) Table 3: Effects and Differences in Effects (Full Uncertainty Models). The table presents our estimates of the effects and differences in effects between the various combinations of subconstituency opinion, based on the full uncertainty models presented in Table 2. 90% confidence intervals appear in parentheses. 35
37 Supplemental Appendix In this appendix, we present some additional notes on our methods. We also include a supplemental table providing more information on the sample sizes in the nominee polls used. We comment on some additional analysis we did to see if our findings could be drawn out further. Finally, we present a series of figures showing estimates (with uncertainty) by state and party for all remaining nominees (highlighting Alito and Kagan as examples). 1. Comprehensiveness of polls. To produce estimates for as many nominees as possible, we searched the Roper Center s ipoll archive. These nominees are the only ones with sufficient polling data. For nominees who featured in only a handful of polls, we gathered every poll containing sufficient demographic and geographic information on individual respondents. For nominees with a large number of such polls, we only used the polls closest to their confirmation vote. For Thomas, we only retained polls taken after the Anita Hill allegations surfaced. This ensures as much as possible that our estimates tap state opinion as it stood at the time of the vote. 2. Interpreting a unit shift. A unit shift in our opinion measures flips a fixed share of the state population, but an unfixed share of the party population. One cannot scale to both at the same time. Consider Senator Voinovich in 2009 (R-OH). A unit shift in support consisting only of in-party opinion holders means that 1% of the total number of opinion holders in Ohio switch from no to yes, where the switchers consist only of Republicans. Support goes from 53.0% to 54.0% overall in Ohio, but only Republicans change, so this shift means that 3.1% (= 1 ) of Republicans move from no to yes, 32.2 increasing support among Republicans from 23.6% to 26.7%. Next, consider Senator Sherrod Brown (D-OH). Now, a unit shift in opinion holder support consisting only of Democrats still moves total support in Ohio from 53.0% to 54.0%, but this means that 3.0% (= 1 ) of Democrats shifted from no to yes (83.8% becomes 86.8%). The unit 33.3 shift in opinion holders correlates to a different size share within party because party sizes differ. 36
38 3. Cell structure of data. Technically, the MRP package in R converts this individuallevel structure to an equivalent cell-level structure (of types) for the logistic regression, with counts of 1 and 0, and weights by cell. We use the more standard notation in the text. 4. Table SA-1 summarizes the number of respondents used in each of the nominee megapolls, as well as the number of polls used for each nominee. Nominee Number of observations Number of polls Alito 7,904 7 Bork 5,806 5 Breyer 1,524 1 Ginsburg 2,219 2 Kagan 8,207 8 Miers 1,008 1 Rehnquist 3,497 2 Roberts 7,191 8 Sotomayor 6,333 6 Souter 2,200 2 Thomas 3,540 4 Table SA-1: Summary of nominee polls 5. Do Senators behave differently depending on the extent of party control in their state? We explored whether some senators showed more deference than others to their partisan constituents (their in-party median) or to the median of their state as a whole. Specifically, if the senator s party is dominant in their state, is the party median listened to over the state median. Following Shapiro et al. (1990), we started by defining a dominant party as one where it was larger than the independents and at least 5 percentage points larger in size than the opposing party. Then, where the senator s party was dominant, there were 46 votes where the senator faced a choice between what the two medians wanted, and 80% of the time the senator went with the party median. When the senator s party was not dominant, this dropped to 75%. However, the results were too dependent on the exact threshold chosen given the relatively small number of votes for us to form a clear conclusion. If the threshold for dominance were 10 37
39 percentage points in size, then these numbers were 77% and 76%. Or, if we compared the top half of the data to the bottom half, based on the two party split alone, the numbers were 76% and 75%. The most we can say is that it is possible that senators give extra attention to their fellow partisan constituents when that group is larger than the other partisan group. Sorting this out further would require an exploration of a much larger set of senate votes. This would be possible in future work with the MRP extensions we provide. 6. Uncertainty around estimates. In Figure SA-1, for each nominee, the top panels in the following figures depict the distribution of state-level opinion (among opinion holders) in each state, while the bottom panels are broken down by Democratic, Independent and Republican opinion. For each nominee, the states are ordered from lowest levels of state support to highest. The vertical lines connect the median estimate for each state (for the respective constituency). We also depict the uncertainty in the estimates: for each constituency and state, we plot the 95% confidence interval for each set of estimates (i.e the empirical distribution). To depict each distribution, we plot translucent dots such that the darker regions depict the center of the distribution and lighter region depicting the tails. For example, Republican support for Alito is more precisely estimated than the other subgroups for Alito and even than Democratic support for Kagan. For each nominee, the states are ordered from lowest levels of overall support to highest. There is substantial variance in opinion within the same constituency and across states. Variance across parties is even larger, with Democrats and Republicans far apart from each other in every state (for these nominees). 38

40 Figure SA-1: Depicting estimates and uncertainty nominees by state and party. 39

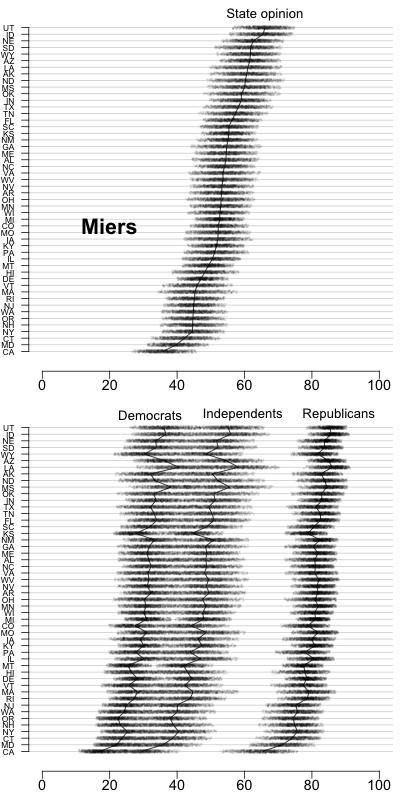
41 40

42 41

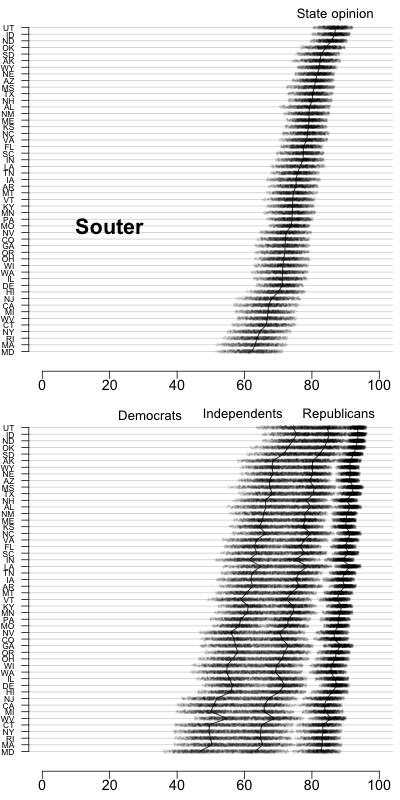
43 42

44 43
Distorting the Electoral Connection? Partisan Representation in Confirmation Politics
 Distorting the Electoral Connection? Partisan Representation in Confirmation Politics Jonathan P. Kastellec Dept. of Politics, Princeton University jkastell@princeton.edu Jeffrey R. Lax Dept. of Political
Distorting the Electoral Connection? Partisan Representation in Supreme Court Confirmation Politics
 Distorting the Electoral Connection? Partisan Representation in Supreme Court Confirmation Politics Jonathan P. Kastellec Dept. of Politics, Princeton University jkastell@princeton.edu Je rey R. Lax Dept.
Public Opinion and Senate Confirmation of Supreme Court Nominees
 Public Opinion and Senate Confirmation of Supreme Court Nominees Jonathan P. Kastellec JPK24@columbia.edu epartment of Political Science Columbia University Jeffrey. Lax JL2124@columbia.edu Justin Phillips
What is The Probability Your Vote will Make a Difference?
 Berkeley Law From the SelectedWorks of Aaron Edlin 2009 What is The Probability Your Vote will Make a Difference? Andrew Gelman, Columbia University Nate Silver Aaron S. Edlin, University of California,
Gay Rights in Congress: Public Opinion and (Mis)Representation
Representation") Gay Rights in Congress: Public Opinion and (Mis)Representation Katherine L. Krimmel klk2118@columbia.edu Jeffrey R. Lax jrl2124@columbia.edu Justin H. Phillips jhp2121@columbia.edu Department of Political
Gay Rights in Congress: Public Opinion and (Mis)Representation Katherine L. Krimmel klk2118@columbia.edu Jeffrey R. Lax jrl2124@columbia.edu Justin H. Phillips jhp2121@columbia.edu Department of Political
The Case of the Disappearing Bias: A 2014 Update to the Gerrymandering or Geography Debate
 The Case of the Disappearing Bias: A 2014 Update to the Gerrymandering or Geography Debate Nicholas Goedert Lafayette College goedertn@lafayette.edu May, 2015 ABSTRACT: This note observes that the pro-republican
Elite Polarization and Mass Political Engagement: Information, Alienation, and Mobilization
 JOURNAL OF INTERNATIONAL AND AREA STUDIES Volume 20, Number 1, 2013, pp.89-109 89 Elite Polarization and Mass Political Engagement: Information, Alienation, and Mobilization Jae Mook Lee Using the cumulative
Should the Democrats move to the left on economic policy?
 Should the Democrats move to the left on economic policy? Andrew Gelman Cexun Jeffrey Cai November 9, 2007 Abstract Could John Kerry have gained votes in the recent Presidential election by more clearly
Wisconsin Economic Scorecard
 RESEARCH PAPER> May 2012 Wisconsin Economic Scorecard Analysis: Determinants of Individual Opinion about the State Economy Joseph Cera Researcher Survey Center Manager The Wisconsin Economic Scorecard
The Case of the Disappearing Bias: A 2014 Update to the Gerrymandering or Geography Debate
 The Case of the Disappearing Bias: A 2014 Update to the Gerrymandering or Geography Debate Nicholas Goedert Lafayette College goedertn@lafayette.edu November, 2015 ABSTRACT: This note observes that the
Online Appendix: Robustness Tests and Migration. Means
 VOL. VOL NO. ISSUE EMPLOYMENT, WAGES AND VOTER TURNOUT Online Appendix: Robustness Tests and Migration Means Online Appendix Table 1 presents the summary statistics of turnout for the five types of elections
Segal and Howard also constructed a social liberalism score (see Segal & Howard 1999).
.") APPENDIX A: Ideology Scores for Judicial Appointees For a very long time, a judge s own partisan affiliation 1 has been employed as a useful surrogate of ideology (Segal & Spaeth 1990). The approach treats
APPENDIX A: Ideology Scores for Judicial Appointees For a very long time, a judge s own partisan affiliation 1 has been employed as a useful surrogate of ideology (Segal & Spaeth 1990). The approach treats
Following the Leader: The Impact of Presidential Campaign Visits on Legislative Support for the President's Policy Preferences
 University of Colorado, Boulder CU Scholar Undergraduate Honors Theses Honors Program Spring 2011 Following the Leader: The Impact of Presidential Campaign Visits on Legislative Support for the President's
Research Statement. Jeffrey J. Harden. 2 Dissertation Research: The Dimensions of Representation
 Research Statement Jeffrey J. Harden 1 Introduction My research agenda includes work in both quantitative methodology and American politics. In methodology I am broadly interested in developing and evaluating
Non-Voted Ballots and Discrimination in Florida
 Non-Voted Ballots and Discrimination in Florida John R. Lott, Jr. School of Law Yale University 127 Wall Street New Haven, CT 06511 (203) 432-2366 john.lott@yale.edu revised July 15, 2001 * This paper
Res Publica 29. Literature Review
 Res Publica 29 Greg Crowe and Elizabeth Ann Eberspacher Partisanship and Constituency Influences on Congressional Roll-Call Voting Behavior in the US House This research examines the factors that influence
Public Opinion and Senate Confirmation of Supreme Court Nominees
 Public Opinion and Senate Confirmation of Supreme Court Nominees Jonathan P. Kastellec JPK2004@columbia.edu epartment of Political Science Columbia University Jeffrey. Lax JL2124@columbia.edu Justin Phillips
Gay Rights in the States: Public Opinion and Policy Responsiveness
 Gay Rights in the States: Public Opinion and Policy Responsiveness Jeffrey R. Lax Department of Political Science Columbia University JRL2124@columbia.edu Justin H. Phillips Department of Political Science
A Dead Heat and the Electoral College
 A Dead Heat and the Electoral College Robert S. Erikson Department of Political Science Columbia University rse14@columbia.edu Karl Sigman Department of Industrial Engineering and Operations Research sigman@ieor.columbia.edu
Case 1:17-cv TCB-WSD-BBM Document 94-1 Filed 02/12/18 Page 1 of 37
 Case 1:17-cv-01427-TCB-WSD-BBM Document 94-1 Filed 02/12/18 Page 1 of 37 REPLY REPORT OF JOWEI CHEN, Ph.D. In response to my December 22, 2017 expert report in this case, Defendants' counsel submitted
1. The Relationship Between Party Control, Latino CVAP and the Passage of Bills Benefitting Immigrants
 The Ideological and Electoral Determinants of Laws Targeting Undocumented Migrants in the U.S. States Online Appendix In this additional methodological appendix I present some alternative model specifications
The Effect of Electoral Geography on Competitive Elections and Partisan Gerrymandering
 The Effect of Electoral Geography on Competitive Elections and Partisan Gerrymandering Jowei Chen University of Michigan jowei@umich.edu http://www.umich.edu/~jowei November 12, 2012 Abstract: How does
Supplementary/Online Appendix for The Swing Justice
 Supplementary/Online Appendix for The Peter K. Enns Cornell University pe52@cornell.edu Patrick C. Wohlfarth University of Maryland, College Park patrickw@umd.edu Contents 1 Appendix 1: All Cases Versus
UC Davis UC Davis Previously Published Works
 UC Davis UC Davis Previously Published Works Title Constitutional design and 2014 senate election outcomes Permalink https://escholarship.org/uc/item/8kx5k8zk Journal Forum (Germany), 12(4) Authors Highton,
Partisan Nation: The Rise of Affective Partisan Polarization in the American Electorate
 Partisan Nation: The Rise of Affective Partisan Polarization in the American Electorate Alan I. Abramowitz Department of Political Science Emory University Abstract Partisan conflict has reached new heights
SHOULD THE DEMOCRATS MOVE TO THE LEFT ON ECONOMIC POLICY? By Andrew Gelman and Cexun Jeffrey Cai Columbia University
 Submitted to the Annals of Applied Statistics SHOULD THE DEMOCRATS MOVE TO THE LEFT ON ECONOMIC POLICY? By Andrew Gelman and Cexun Jeffrey Cai Columbia University Could John Kerry have gained votes in
Party, Constituency, and Constituents in the Process of Representation
 Party, Constituency, and Constituents in the Process of Representation Walter J. Stone Matthew Pietryka University of California, Davis For presentation at the Conference on the State of the Parties, University
This journal is published by the American Political Science Association. All rights reserved.
 Article: National Conditions, Strategic Politicians, and U.S. Congressional Elections: Using the Generic Vote to Forecast the 2006 House and Senate Elections Author: Alan I. Abramowitz Issue: October 2006
Statistics, Politics, and Policy
 Statistics, Politics, and Policy Volume 1, Issue 1 2010 Article 3 A Snapshot of the 2008 Election Andrew Gelman, Columbia University Daniel Lee, Columbia University Yair Ghitza, Columbia University Recommended
Supplementary Materials A: Figures for All 7 Surveys Figure S1-A: Distribution of Predicted Probabilities of Voting in Primary Elections
 Supplementary Materials (Online), Supplementary Materials A: Figures for All 7 Surveys Figure S-A: Distribution of Predicted Probabilities of Voting in Primary Elections (continued on next page) UT Republican
Amy Tenhouse. Incumbency Surge: Examining the 1996 Margin of Victory for U.S. House Incumbents
 Amy Tenhouse Incumbency Surge: Examining the 1996 Margin of Victory for U.S. House Incumbents In 1996, the American public reelected 357 members to the United States House of Representatives; of those
STATISTICAL GRAPHICS FOR VISUALIZING DATA
 STATISTICAL GRAPHICS FOR VISUALIZING DATA Tables and Figures, I William G. Jacoby Michigan State University and ICPSR University of Illinois at Chicago October 14-15, 21 http://polisci.msu.edu/jacoby/uic/graphics
Gay Rights in Congress: Public Opinion and (Mis)Representation
Representation") Gay Rights in Congress: Public Opinion and (Mis)Representation Katherine L. Krimmel kkrimmel@bu.edu Department of Political Science Boston University Jeffrey R. Lax jrl2124@columbia.edu Department of Political
Gay Rights in Congress: Public Opinion and (Mis)Representation Katherine L. Krimmel kkrimmel@bu.edu Department of Political Science Boston University Jeffrey R. Lax jrl2124@columbia.edu Department of Political
Incumbency Effects and the Strength of Party Preferences: Evidence from Multiparty Elections in the United Kingdom
 Incumbency Effects and the Strength of Party Preferences: Evidence from Multiparty Elections in the United Kingdom June 1, 2016 Abstract Previous researchers have speculated that incumbency effects are
Ohio State University
 Fake News Did Have a Significant Impact on the Vote in the 2016 Election: Original Full-Length Version with Methodological Appendix By Richard Gunther, Paul A. Beck, and Erik C. Nisbet Ohio State University
Chapter Four: Chamber Competitiveness, Political Polarization, and Political Parties
 Chapter Four: Chamber Competitiveness, Political Polarization, and Political Parties Building off of the previous chapter in this dissertation, this chapter investigates the involvement of political parties
Supporting Information for Signaling and Counter-Signaling in the Judicial Hierarchy: An Empirical Analysis of En Banc Review
 Supporting Information for Signaling and Counter-Signaling in the Judicial Hierarchy: An Empirical Analysis of En Banc Review In this appendix, we: explain our case selection procedures; Deborah Beim Alexander
How Should We Measure District-Level Public Opinion on Individual Issues? i
 How Should We Measure District-Level Public Opinion on Individual Issues? i Christopher Warshaw cwarshaw@stanford.edu Jonathan Rodden jrodden@stanford.edu Department of Political Science Stanford University
How Should We Estimate Sub-National Opinion Using MRP? Preliminary Findings and Recommendations
 How Should We Estimate Sub-National Opinion Using MRP? Preliminary Findings and Recommendations Je rey R. Lax Department of Political Science Columbia University JRL2124@columbia.edu Justin H. Phillips
Forecasting the 2018 Midterm Election using National Polls and District Information
 Forecasting the 2018 Midterm Election using National Polls and District Information Joseph Bafumi, Dartmouth College Robert S. Erikson, Columbia University Christopher Wlezien, University of Texas at Austin
The aggregation of citizens preferences into policy
 How Should We Measure District-Level Public Opinion on Individual Issues? Christopher Warshaw Jonathan Rodden Stanford University Stanford University Due to insufficient sample sizes in national surveys,
Strategic Partisanship: Party Priorities, Agenda Control and the Decline of Bipartisan Cooperation in the House
 Strategic Partisanship: Party Priorities, Agenda Control and the Decline of Bipartisan Cooperation in the House Laurel Harbridge Assistant Professor, Department of Political Science Faculty Fellow, Institute
Congressional Gridlock: The Effects of the Master Lever
 Congressional Gridlock: The Effects of the Master Lever Olga Gorelkina Max Planck Institute, Bonn Ioanna Grypari Max Planck Institute, Bonn Preliminary & Incomplete February 11, 2015 Abstract This paper
A positive correlation between turnout and plurality does not refute the rational voter model
 Quality & Quantity 26: 85-93, 1992. 85 O 1992 Kluwer Academic Publishers. Printed in the Netherlands. Note A positive correlation between turnout and plurality does not refute the rational voter model
Colorado 2014: Comparisons of Predicted and Actual Turnout
 Colorado 2014: Comparisons of Predicted and Actual Turnout Date 2017-08-28 Project name Colorado 2014 Voter File Analysis Prepared for Washington Monthly and Project Partners Prepared by Pantheon Analytics
Experiments in Election Reform: Voter Perceptions of Campaigns Under Preferential and Plurality Voting
 Experiments in Election Reform: Voter Perceptions of Campaigns Under Preferential and Plurality Voting Caroline Tolbert, University of Iowa (caroline-tolbert@uiowa.edu) Collaborators: Todd Donovan, Western
Political Economics II Spring Lectures 4-5 Part II Partisan Politics and Political Agency. Torsten Persson, IIES
 Lectures 4-5_190213.pdf Political Economics II Spring 2019 Lectures 4-5 Part II Partisan Politics and Political Agency Torsten Persson, IIES 1 Introduction: Partisan Politics Aims continue exploring policy
Appendix A In this appendix, we present the following:
 Online Appendix for: Charles Cameron and Jonathan Kastellec Are Supreme Court Nominations a Move-the-Median Game? January th, 16 Appendix A presents supplemental information relevant to our empirical analyses,
Primaries and Candidates: Examining the Influence of Primary Electorates on Candidate Ideology
 Primaries and Candidates: Examining the Influence of Primary Electorates on Candidate Ideology Lindsay Nielson Bucknell University Neil Visalvanich Durham University September 24, 2015 Abstract Primary
Representation of Primary Electorates in Congressional Roll Call Votes
 Representation of Primary Electorates in Congressional Roll Call Votes Seth J. Hill University of California, San Diego August 9, 2017 Abstract: Do members of Congress represent voters in their primary
The League of Women Voters of Pennsylvania et al v. The Commonwealth of Pennsylvania et al. Nolan McCarty
 The League of Women Voters of Pennsylvania et al v. The Commonwealth of Pennsylvania et al. I. Introduction Nolan McCarty Susan Dod Brown Professor of Politics and Public Affairs Chair, Department of Politics
Whose Statehouse Democracy?: Policy Responsiveness to Poor vs. Rich Constituents in Poor vs. Rich States
 Policy Studies Organization From the SelectedWorks of Elizabeth Rigby 2010 Whose Statehouse Democracy?: Policy Responsiveness to Poor vs. Rich Constituents in Poor vs. Rich States Elizabeth Rigby, University
Congruence in Political Parties
 Descriptive Representation of Women and Ideological Congruence in Political Parties Georgia Kernell Northwestern University gkernell@northwestern.edu June 15, 2011 Abstract This paper examines the relationship
Party Responsiveness and Mandate Balancing *
 Party Responsiveness and Mandate Balancing * James Fowler Oleg Smirnov University of California, Davis University of Oregon May 05, 2005 Abstract Recent evidence suggests that parties are responsive to
Introduction to the declination function for gerrymanders
 Introduction to the declination function for gerrymanders Gregory S. Warrington Department of Mathematics & Statistics, University of Vermont, 16 Colchester Ave., Burlington, VT 05401, USA November 4,
Supplementary Materials for Strategic Abstention in Proportional Representation Systems (Evidence from Multiple Countries)
") Supplementary Materials for Strategic Abstention in Proportional Representation Systems (Evidence from Multiple Countries) Guillem Riambau July 15, 2018 1 1 Construction of variables and descriptive statistics.
Supplementary Materials for Strategic Abstention in Proportional Representation Systems (Evidence from Multiple Countries) Guillem Riambau July 15, 2018 1 1 Construction of variables and descriptive statistics.
DOES GERRYMANDERING VIOLATE THE FOURTEENTH AMENDMENT?: INSIGHT FROM THE MEDIAN VOTER THEOREM
 DOES GERRYMANDERING VIOLATE THE FOURTEENTH AMENDMENT?: INSIGHT FROM THE MEDIAN VOTER THEOREM Craig B. McLaren University of California, Riverside Abstract This paper argues that gerrymandering understood
Accountability, Divided Government and Presidential Coattails.
 Presidential VS Parliamentary Elections Accountability, Divided Government and Presidential Coattails. Accountability Presidential Coattails The coattail effect is the tendency for a popular political
Partisan Advantage and Competitiveness in Illinois Redistricting
 Partisan Advantage and Competitiveness in Illinois Redistricting An Updated and Expanded Look By: Cynthia Canary & Kent Redfield June 2015 Using data from the 2014 legislative elections and digging deeper
Online Appendix for Redistricting and the Causal Impact of Race on Voter Turnout
 Online Appendix for Redistricting and the Causal Impact of Race on Voter Turnout Bernard L. Fraga Contents Appendix A Details of Estimation Strategy 1 A.1 Hypotheses.....................................
Supporting Information Political Quid Pro Quo Agreements: An Experimental Study
 Supporting Information Political Quid Pro Quo Agreements: An Experimental Study Jens Großer Florida State University and IAS, Princeton Ernesto Reuben Columbia University and IZA Agnieszka Tymula New York
Supplementary/Online Appendix for:
 Supplementary/Online Appendix for: Relative Policy Support and Coincidental Representation Perspectives on Politics Peter K. Enns peterenns@cornell.edu Contents Appendix 1 Correlated Measurement Error
Drew Kurlowski University of Missouri Columbia
 Kurlowski 1 Simulation of Increased Youth Turnout on the Presidential Election of 2004 Drew Kurlowski University of Missouri Columbia dak6w7@mizzou.edu Abstract Youth voting has become a major issue in
Congressional Agenda Control and the Decline of Bipartisan Cooperation
 Congressional Agenda Control and the Decline of Bipartisan Cooperation Laurel Harbridge Northwestern University College Fellow, Department of Political Science College Fellow, Institute for Policy Research
BLISS INSTITUTE 2006 GENERAL ELECTION SURVEY
 BLISS INSTITUTE 2006 GENERAL ELECTION SURVEY Ray C. Bliss Institute of Applied Politics The University of Akron Executive Summary The Bliss Institute 2006 General Election Survey finds Democrat Ted Strickland
Model of Voting. February 15, Abstract. This paper uses United States congressional district level data to identify how incumbency,
 U.S. Congressional Vote Empirics: A Discrete Choice Model of Voting Kyle Kretschman The University of Texas Austin kyle.kretschman@mail.utexas.edu Nick Mastronardi United States Air Force Academy nickmastronardi@gmail.com
U.S. Supreme Court Key Findings
 U.S. Supreme Court Key Findings Prepared for C-SPAN July 14, 2015 Robert Green, Principal Adam Rosenblatt, Director 1110 Vermont Avenue NW Suite 1200 Washington, DC 20005 202-842-0500 Methodology Penn
Incumbency Advantages in the Canadian Parliament
 Incumbency Advantages in the Canadian Parliament Chad Kendall Department of Economics University of British Columbia Marie Rekkas* Department of Economics Simon Fraser University mrekkas@sfu.ca 778-782-6793
Working Paper: The Effect of Electronic Voting Machines on Change in Support for Bush in the 2004 Florida Elections
 Working Paper: The Effect of Electronic Voting Machines on Change in Support for Bush in the 2004 Florida Elections Michael Hout, Laura Mangels, Jennifer Carlson, Rachel Best With the assistance of the
A Behavioral Measure of the Enthusiasm Gap in American Elections
 A Behavioral Measure of the Enthusiasm Gap in American Elections Seth J. Hill April 22, 2014 Abstract What are the effects of a mobilized party base on elections? I present a new behavioral measure of
CHAPTER 4 Racial Diversity and Party Polarization: Evidence from State Legislative Voting Records
 CHAPTER 4 Racial Diversity and Party Polarization: Evidence from State Legislative Voting Records Eric R. Hansen Department of Political Science University of North Carolina at Chapel Hill ehansen@live.unc.edu
Methodology. 1 State benchmarks are from the American Community Survey Three Year averages
 The Choice is Yours Comparing Alternative Likely Voter Models within Probability and Non-Probability Samples By Robert Benford, Randall K Thomas, Jennifer Agiesta, Emily Swanson Likely voter models often
Components of party polarization in the US House of Representatives
 Article Components of party polarization in the US House of Representatives Journal of Theoretical Politics 1 27 ÓThe Author(s) 215 Reprints and permissions: sagepub.co.uk/journalspermissions.nav DOI:
Iowa Voting Series, Paper 4: An Examination of Iowa Turnout Statistics Since 2000 by Party and Age Group
 Department of Political Science Publications 3-1-2014 Iowa Voting Series, Paper 4: An Examination of Iowa Turnout Statistics Since 2000 by Party and Age Group Timothy M. Hagle University of Iowa 2014 Timothy
Measuring Constituent Policy Preferences in Congress, State Legislatures and Cities 1
 Measuring Constituent Policy Preferences in Congress, State Legislatures and Cities 1 Chris Tausanovitch Department of Political Science UCLA ctausanovitch@ucla.edu Christopher Warshaw Department of Political
Primary Elections and Partisan Polarization in the U.S. Congress
 Primary Elections and Partisan Polarization in the U.S. Congress The Harvard community has made this article openly available. Please share how this access benefits you. Your story matters. Citation Published
2017 CAMPAIGN FINANCE REPORT
 2017 CAMPAIGN FINANCE REPORT PRINCIPAL AUTHORS: LONNA RAE ATKESON PROFESSOR OF POLITICAL SCIENCE, DIRECTOR CENTER FOR THE STUDY OF VOTING, ELECTIONS AND DEMOCRACY, AND DIRECTOR INSTITUTE FOR SOCIAL RESEARCH,
Constitutional Reform in California: The Surprising Divides
 Constitutional Reform in California: The Surprising Divides Mike Binder Bill Lane Center for the American West, Stanford University University of California, San Diego Tammy M. Frisby Hoover Institution
Retrospective Voting
 Retrospective Voting Who Are Retrospective Voters and Does it Matter if the Incumbent President is Running Kaitlin Franks Senior Thesis In Economics Adviser: Richard Ball 4/30/2009 Abstract Prior literature
VoteCastr methodology
 VoteCastr methodology Introduction Going into Election Day, we will have a fairly good idea of which candidate would win each state if everyone voted. However, not everyone votes. The levels of enthusiasm
Lab 3: Logistic regression models
 Lab 3: Logistic regression models In this lab, we will apply logistic regression models to United States (US) presidential election data sets. The main purpose is to predict the outcomes of presidential
Pavel Yakovlev Duquesne University. Abstract
 Ideology, Shirking, and the Incumbency Advantage in the U.S. House of Representatives Pavel Yakovlev Duquesne University Abstract This paper examines how the incumbency advantage is related to ideological
Congressional Agenda Control and the Decline of Bipartisan Cooperation
 Congressional Agenda Control and the Decline of Bipartisan Cooperation Laurel Harbridge Assistant Professor, Department of Political Science Faculty Fellow, Institute for Policy Research Northwestern University
Economic Expectations, Voting, and Economic Decisions around Elections
 Economic Expectations, Voting, and Economic Decisions around Elections By GUR HUBERMAN, TOBIAS KONITZER, MASHA KRUPENKIN, DAVID ROTHSCHILD, AND SHAWNDRA HILL* * Huberman: Columbia, New York, NY (gh16@gsb.columbia.edu).
Congressional Agenda Control and the Decline of Bipartisan Cooperation
 Congressional Agenda Control and the Decline of Bipartisan Cooperation Laurel Harbridge Northwestern University College Fellow, Department of Political Science l-harbridge@northwestern.edu Electoral incentives
Understanding Taiwan Independence and Its Policy Implications
 Understanding Taiwan Independence and Its Policy Implications January 30, 2004 Emerson M. S. Niou Department of Political Science Duke University niou@duke.edu 1. Introduction Ever since the establishment
The Forum. Public Opinion on Health Care Reform
 An Article Submitted to The Forum Manuscript 1355 Public Opinion on Health Care Reform Andrew Gelman Daniel Lee Yair Ghitza Columbia University, gelman@stat.columbia.edu Columbia University, bearlee@alum.mit.edu
Unequal Recovery, Labor Market Polarization, Race, and 2016 U.S. Presidential Election. Maoyong Fan and Anita Alves Pena 1
 Unequal Recovery, Labor Market Polarization, Race, and 2016 U.S. Presidential Election Maoyong Fan and Anita Alves Pena 1 Abstract: Growing income inequality and labor market polarization and increasing
Supplemental Online Appendix to The Incumbency Curse: Weak Parties, Term Limits, and Unfulfilled Accountability
 Supplemental Online Appendix to The Incumbency Curse: Weak Parties, Term Limits, and Unfulfilled Accountability Marko Klašnja Rocío Titiunik Post-Doctoral Fellow Princeton University Assistant Professor
AP PHOTO/MATT VOLZ. Voter Trends in A Final Examination. By Rob Griffin, Ruy Teixeira, and John Halpin November 2017
 AP PHOTO/MATT VOLZ Voter Trends in 2016 A Final Examination By Rob Griffin, Ruy Teixeira, and John Halpin November 2017 WWW.AMERICANPROGRESS.ORG Voter Trends in 2016 A Final Examination By Rob Griffin,
POLL RESULTS. Question 1: Do you approve or disapprove of the job performance of President Donald Trump? Approve 46% Disapprove 44% Undecided 10%
 Nebraska Poll Results Trump Approval: 46-44% (10% undecided) Ricketts re-elect 39-42% (19% undecided) Fischer re-elect 35-42% (22% undecided) Arming teachers: 56-25% against (20% undecided) POLLING METHODOLOGY
What to Do about Turnout Bias in American Elections? A Response to Wink and Weber
 What to Do about Turnout Bias in American Elections? A Response to Wink and Weber Thomas L. Brunell At the end of the 2006 term, the U.S. Supreme Court handed down its decision with respect to the Texas
The California Primary and Redistricting
 The California Primary and Redistricting This study analyzes what is the important impact of changes in the primary voting rules after a Congressional and Legislative Redistricting. Under a citizen s committee,
Democratic Performance in the States
 Democratic Performance in the States Jeffrey R. Lax Department of Political Science Columbia University JRL2124@columbia.edu Justin H. Phillips Department of Political Science Columbia University JHP2121@columbia.edu
ANES Panel Study Proposal Voter Turnout and the Electoral College 1. Voter Turnout and Electoral College Attitudes. Gregory D.
 ANES Panel Study Proposal Voter Turnout and the Electoral College 1 Voter Turnout and Electoral College Attitudes Gregory D. Webster University of Illinois at Urbana-Champaign Keywords: Voter turnout;
Can Ideal Point Estimates be Used as Explanatory Variables?
 Can Ideal Point Estimates be Used as Explanatory Variables? Andrew D. Martin Washington University admartin@wustl.edu Kevin M. Quinn Harvard University kevin quinn@harvard.edu October 8, 2005 1 Introduction
We study the effects of policy-specific public opinion on state adoption of policies affecting
 American Political Science Review Vol. 3, No. 3 August 29 doi:.7/s35549995 Gay Rights in the States: Public Opinion and Policy Responsiveness JEFFREY R. LAX and JUSTIN H. PHILLIPS Columbia University We
Appendix: Uncovering Patterns Among Latent Variables: Human Rights and De Facto Judicial Independence
 Appendix: Uncovering Patterns Among Latent Variables: Human Rights and De Facto Judicial Independence Charles D. Crabtree Christopher J. Fariss August 12, 2015 CONTENTS A Variable descriptions 3 B Correlation
Web Appendix for More a Molehill than a Mountain: The Effects of the Blanket Primary on Elected Officials Behavior in California
 Web Appendix for More a Molehill than a Mountain: The Effects of the Blanket Primary on Elected Officials Behavior in California Will Bullock Joshua D. Clinton December 15, 2010 Graduate Student, Princeton
Of Shirking, Outliers, and Statistical Artifacts: Lame-Duck Legislators and Support for Impeachment
 Of Shirking, Outliers, and Statistical Artifacts: Lame-Duck Legislators and Support for Impeachment Christopher N. Lawrence Saint Louis University An earlier version of this note, which examined the behavior