THREE ESSAYS IN POLITICAL ECONOMY CAGDAS AGIRDAS DISSERTATION
|
|
|
- Amice Riley
- 5 years ago
- Views:
Transcription
1 THREE ESSAYS IN POLITICAL ECONOMY BY CAGDAS AGIRDAS DISSERTATION Submitted in partial fulfillment of the requirements for the degree of Doctor of Philosophy in Economics in the Graduate College of the University of Illinois at Urbana-Champaign, 2011 Doctoral Committee: Urbana, Illinois Professor Mattias Polborn, Chair and Director of Research Professor Stefan Krasa Professor Werner Baer Lecturer Hassan Arvin-Rad
2 ABSTRACT This is a comprehensive study of the U.S. political process from the perspective of media, voters and candidates. In the first chapter, I analyze the sources of media bias. In the second chapter, I focus on economically self-interested voting. The third chapter studies the effectiveness of negative campaigning. In the next three paragraphs, I summarize these three chapters With the advent of internet, many U.S. metropolitan areas have seen newspaper closures due to declining revenues. This provides the researcher with an opportunity to analyze the microeconomic sources of media bias. This paper uses a large panel data set of newspaper archives for 102 newspapers over 238 months ( ). I find that, after controlling for the unemployment rate and the change in unemployment rate, conservative newspapers report 19% more unemployment news when the President is a Democrat rather than a Republican, before the closure of a rival newspaper in the same media market. This effect is 12% for liberal newspapers. After the closure, these numbers are 3.5% and 1%, respectively. This moderation of media bias after closure of a rival newspaper stands as newspaper size, newspaper fixed-effects or metropolitan area fixed-effects are included. I also find that newspapers in smaller metropolitan areas have a larger moderation in their bias. My findings provide support for theories in which media-bias is demand-driven, as surviving newspapers aim to increase their sales by gaining the former readers of a closed newspaper in the same media market. ii
3 A long literature investigates the influence of income on voting behavior, but it focuses primarily on presidential elections. We ask whether economically self-interested voting is unique to the presidential elections, or if it also extends to House, Senate and gubernatorial elections. In addition, for each office, we look for the presence of absolute income effects and relative income effects. Voters do indeed appear to vote in an economically self-interested manner for each office, but we show that in all elections but presidential elections, this effect is largely generated by the correlation of income with political issue stances. Controlling for voter stances on a number of social and economic issues, there is little evidence of partisan differences in voting according to income outside of presidential elections. Our findings at once support previous studies, but illustrate that presidential elections are very much a special case in US socio-political behavior. Political candidates commonly use negative TV ads to attack their opponents. In very limited research on effectiveness of negative campaigning, endogeneity problem has not been addressed and trait ads were not separated from issue ads. In this project, I use instrumental variables estimates of the effectiveness of negative campaigning and distinguish between issue ads and trait ads. Using 162 U.S. Senate Elections between 1998 and 2008, I find that negative issue campaigning is effective for challengers in significantly reducing the incumbent s vote, although this effect is not large enough to change the election outcome in lopsided elections. In competitive elections, I find that challenger s negative issue ads can change the election outcome. I do not find any significant effects of negative issue ads by an incumbent, except for competitive iii
4 elections. Both incumbents and challengers hurt themselves if they resort to negative trait ads (personal attacks). iv
5 To My Mother, Father and Sister v
6 ACKNOWLEDGEMENTS This project would not have been possible without the support of many people. Many thanks to my advisor, Mattias Polborn, who read my revisions and guided me over the years. Also thanks to my committee members, Stefan Krasa, Werner Baer, Hassan Arvin-Rad, who offered guidance and support. Thanks to the Department of Economics for providing me the financial means to complete this project. And finally, thanks to my parents, sister, and numerous friends who endured this long process with me, always offering support and love. vi
7 TABLE OF CONTENTS CHAPTER 1: WHAT DRIVES MEDIA BIAS? A PANEL STUDY OF NEWSPAPER ARCHIVES: REFERENCES FOR CHAPTER CHAPTER 2: ECONOMIC SELF-INTEREST AND ISSUE STANCES IN U.S. ELECTIONS..31 REFERENCES FOR CHAPTER CHAPTER 3: IS NEGATIVE CAMPAIGNING EFFECTIVE? INSTRUMENTAL VARIABLES ESTIMATES OF U.S. SENATE ELECTIONS REFERENCES FOR CHAPTER vii
8 CHAPTER 1: WHAT DRIVES MEDIA BIAS? A PANEL STUDY OF NEWSPAPER ARCHIVES: I. Introduction On February 27 th, 2009, the Rocky Mountain News closed after 150 years in operation, leaving the Denver Post as the only major newspaper in the Denver metropolitan area. With the advent of internet, newspapers have seen significant declines in their revenues from sales and advertisements, which in turn caused such closures. I was able to identify 24 newspaper closures between January 1990 and October These closures provide an excellent opportunity to analyze the source of media bias. The basic idea is that, if media-bias is demand-driven, then a surviving newspaper could expand its reader base by moderating its bias to reach out to the former readers of the closed rival newspaper in the same media market. On the other hand, if supply-side factors are driving media bias, then a surviving newspaper would not change its bias, as editors or owners of the newspaper did not change after closure of the rival newspaper. In order to analyze the sources of media bias, one first has to define media bias. A common type of media bias is the agenda-setting behavior of newspapers. As Cohen(1963) states: the press may not be successful much of the time in telling people what to think, but it is stunningly successful in telling its readers what to think about. Several studies have found that unemployment rate is a strong predictor of the success of an incumbent president s political party, in both midterm election years and presidential election years (see Abramowitz (1988), Larcinese, Puglisi and Snyder (2007)). In order to influence election results, a conservative newspaper may report more unemployment news under a Democratic President than a Republican President, even if the unemployment rate is the same. This would be a supply-side factor as newspaper editors or owners aim to affect the election outcomes. On the other hand, such behavior may be demand-driven, as newspapers want to increase their profits by Acknowledgements: I would like to thank Mattias Polborn, Richard Akresh, Dan Bernhardt and participants of the research seminar at the Department of Economics. As usual, I am responsible for any errors. 1
9 reaching out to new readers, who may have a taste for newspapers slanted towards their own political views. It is important to analyze whether demand-side factors, such as readers political views; or supply-side factors, such as the political views of newspaper owners or editors, explain the reasons behind media bias. Media bias can affect election outcomes and this in turn can affect the types of public policies that are implemented. Therefore, it is important to analyze the microeconomic reasons behind media bias. I ask whether newspaper closures led to a change in behavior of surviving newspapers in the same media market. To my knowledge, this is the first study that exploits newspaper closures in order to analyze the sources of media bias. In addition, I have not found any studies of declining competition among newspapers and its long-term effects. I use a panel data set of 102 newspapers over 238 months, from 1990 to This period has seen two Republican and two Democratic Presidents. To my knowledge, this is the longest empirical study of newspaper archives. I ran an online keyword search of newspaper archives to construct my data set. One advantage of an online keyword search is the absence of a human-based content analysis. The same search procedure is applied to every newspaper objectively and no subjective judgment is made on whether to include or exclude an article. Another advantage is that such a keyword search is easily replicable for future research. First, I divide the sample of newspapers into three groups according to their historical endorsement pattern: conservative newspapers, liberal newspapers and moderate newspapers. My empirical strategy involves a fixed-effects panel regression model to estimate the effects of a rival newspaper s closure on the surviving newspapers reporting of unemployment news, for each group. It is also important to see how smaller changes in endorsement pattern can affect its agenda-setting behavior, rather than dividing the sample into three large groups. Thus, I create an alignment index representing the ideological distance between a newspaper and the President. Then, I use this index to analyze the effects of smaller changes in endorsement pattern. Finally, in large metropolitan areas, a newspaper closure might not have as much of an impact on surviving newspapers, as there are more newspapers in such areas. Therefore, I divide the sample into two groups according to the population of the Metropolitan 2
10 Statistical Area (MSA). All my regressions control for unemployment rate, change in unemployment rate, size of the newspaper and newspaper fixed-effects. I find that as the newspaper s and the President s political affiliation become more aligned, the newspaper reports unemployment articles less, even if the unemployment rate and change in unemployment rate are controlled for. My main result is that newspapers moderate this bias significantly after the closure of a rival newspaper. After controlling for the unemployment rate and the change in unemployment rate, conservative newspapers report 19% more unemployment news when the President is a Democrat than when the President is a Republican, before the closure. The corresponding bias is 12% for liberal newspapers. After the closure of a rival, these numbers are reduced to 3.5% and 1%, respectively. Moderate newspapers do not display statistically significant bias either before or after closure. This moderation of media bias after the closure lends credit to demand-side factors. Newspapers see an opportunity to increase their profits after the closure of a rival newspaper and they reach out to the former readers of that newspaper by moderating their bias. When I rank newspapers according to their alignment index, a change from 25 th percentile to 75 th percentile alignment leads to 15% reduction in reporting of unemployment news, before the closure of a rival newspaper. This effect is reduced to 5% after the closure. In large media markets, these effects are significantly weaker than in small media markets. This is plausible given that there may still be considerable competition in large media markets even after the closure of a newspaper. As a robustness check, I use newspaper slant measured by Gentzkow and Shapiro (2010), rather than the endorsement pattern of the newspaper, as a way to classify newspapers as conservative, liberal or moderate. My results still had the same signs and significance. This is to be expected as endorsement pattern and newspaper slant were highly correlated. The outline of the paper is as follows: Section II summarizes the related literature. Section III explains my data set. In Section IV, I discuss my empirical strategy and report the main results. Section V concludes. 3
11 II. Related Literature Media bias can have significant political consequences. Berhnardt, Krasa and Polborn (2008) show that media bias can lead to the election of a candidate who would not be elected in the absence of media bias. Their model involves asymmetrically distributed voter ideologies, a polarized electorate, and profit-maximizing media firms. My results lend support to the profit-maximization assumption of media firms, as I find significant evidence for demand-driven media bias. Gentzkow and Shapiro (2010) develop a new index of newspaper slant based on the similarity between a newspaper s language and that of a congressional Republican or Democrat. For example, the same tax is called the estate tax by Democrats, while it is called the death tax by Republicans. Gentzkow and Shapiro use this index to analyze whether newspaper slant is demand or supply driven. They find that newspapers respond strongly to consumer preferences, while identity of a newspaper s owner explains far less of the variation in slant. I use a new approach of using newspaper closures in order to analyze media bias. This approach allows for a study of declining competition on media bias. Larcinese, Puglisi and Snyder (2007) ask a different question of whether a newspaper s past endorsement pattern affects its reporting of news on unemployment, inflation, budget deficit and trade deficit. They find evidence that newspapers with a pro-republican endorsement pattern overreport unemployment news under a Democratic President than a Republican President. An analogous effect also exists for newspapers with a pro-democratic endorsement pattern. They do not find such an effect in the reporting of news on inflation, budget deficit or trade deficit. Their objective is to see whether media bias exists in the reporting of these four economic variables. My research differs in its main question of what drives media bias and its usage of newspaper closures in order to analyze the sources of media bias. Their research involves an online keyword search of newspaper archives for the period This period had only one Democratic President and one Republican President. My project adds an additional 10 years of observations and covers the two decades from 1990 to October This period includes two Democratic and two Republican Presidents. This allows for more variation in media bias and a larger sample size. 4
12 III. Data Newspaper Archives My unit of observation is a newspaper-year-month combination. I collected two sets of data for 102 newspapers over 238 months, from January 1990 to October All of these newspapers were still in operation as of October Archives for 99 newspapers were available on the NewsLibrary electronic archives 1, while I used ProQuest Archiver 2 for the New York Times, the Los Angeles Times and the Chicago Tribune. The first data set was constructed through an online keyword search of the articles about national unemployment rate. I searched for keywords unemployment or jobless 3 in order to identify the number of unemployment articles that appeared in a newspaper over a month. My second data set was a keyword search of the word and in order to identify the number of total articles about any topic, published in a newspaper over a month. I also ran a keyword search on punctuation mark. as another way of identifying the number of total articles. This search and the keyword search on the word and had a correlation coefficient of for 5 randomly selected newspapers. Therefore, I proceeded with the keyword search on and. Using the number of unemployment articles and the number of total articles, I constructed my dependant variable, which is the relative frequency of unemployment articles out of total articles for each newspaper-month combination. This relative frequency is represented as a percentage using the following formula: Where month t. RF jt denotes the relative frequency of unemployment articles for newspaper j in Newspaper Closures 1 Data and documentation is available from the Newslibrary website, 2 Data and documentation is available from the Proquest Archiver website, 3 Larcinese, Puglisi and Snyder (2007) conducted a preliminary search to identify the exact wording of the search strings in order to minimize the number of false positive and false negative hits. 5
13 I obtained a list of closed newspapers from Wikipedia 4. For each closed newspaper, I identified the Metropolitan Statistical Area (MSA) from the 2000 US Census and the closure date. The closure date was obtained either from the closed newspaper s information page on Wikipedia or from a search of that newspaper using an online search engine. Finally, I matched the MSA of the closed newspaper to the MSA of surviving newspapers in my data set. From now on, I call the MSAs with closures closure markets. If this was a natural experiment, the observations that are after the closure of a rival newspaper in a closure market would constitute my treatment group. The control group would consist of all observations that are not in closure markets and observations in closure markets before the closure date. The following binary variable identifies my treatment group: Newspaper s Political Inclination Ansolabehere, Lessem and Snyder (2006) create an endorsement index for 85 newspapers based on the newspaper s editorial endorsements of political candidates from 1986 to This index represents a newspaper s tendency to endorse Republican or Democrat candidates and it controls for the incumbency and quality of a political candidate. Larcinese, Puglisi and Snyder (2007) supplement this with data on 17 additional newspapers to reach a total of 102 newspapers. I obtained the endorsement index from these two sources for 99 newspapers in my data set, since the Rocky Mountain News, the Seattle Post-Intelligencer and the Cincinnati Post have closed since the creation of this index. Negative numbers indicate a pro-republican endorsement pattern, while positive numbers correspond to a Democratic endorsement pattern. Figure 1 displays the newspapers by endorsement index. Most newspapers were located between -0.5 and 0.5 and there were more newspapers with a pro-democratic endorsement pattern than a pro-republican endorsement pattern. 4 List of defunct newspapers of the United States, available at 6
14 Alternatively, Gentzkow and Shapiro (2007) measure the slant of newspapers. Their approach includes first identifying the language used by Republicans and Democrats. For instance, Democrats use the term estate tax for the same tax that Republicans call death tax. After identifying such language, they calculate a slant measure that represents the correlation between the newspaper s language and a political party s language. I also use this slant measure instead of endorsement index as a robustness check of the results. I adjusted this measure so that lower numbers correspond to conservative newspapers, as they did for endorsement index. Unemployment Rate The U.S. Unemployment Rate is announced in the beginning of every month for the previous month. For each month, I obtained previous month s unemployment rate from Bureau of Labor Statistics. As the unemployment rate goes up, the newspapers are expected to report more unemployment articles. Figure 2 shows the relative frequency of unemployment articles with respect to the previous month s unemployment rate. The correlation coefficient between previous month s unemployment rate and number of unemployment articles was It is also plausible that a jump in unemployment rate between previous two months can affect the reporting of such news. In Figure 3, I graph the relative frequency of unemployment articles with respect to change in unemployment rate between last two months. The correlation coefficient between change in unemployment rate and number of unemployment articles was Summary Statistics Table 1 displays summary statistics. My data set includes newspapers from 86 MSAs, 24 of which had a closure between January 1990 and October There were 28 surviving newspapers in the closure markets. This time period includes about 2 years of George H. W. Bush, 8 years of Bill Clinton, 8 years of George W. Bush and 9 months of Barack Obama. About 9% of the archives were missing and I was able to gather a panel data set of over 22 thousand observations. 7
15 In the bottom half of Table 1, I report mean, median, standard deviation and range of other variables. On average, a newspaper reports around 25 unemployment articles out of a total of around 3263 articles in a month. 8
16 IV. Results Conservative, liberal and moderate newspapers First, I estimate the following fixed-effects panel regression model to measure the effects of a rival newspaper s closure on the reporting of unemployment news by surviving newspapers: Where RF jt is the relative frequency of unemployment articles for newspaper j in time period t, AfterClosure jt is a binary variable indicating that the observation is in a time period after the closure of a rival newspaper, DemocratPresident t is a binary variable indicating that the President is a Democrat, Unemployment t-1 is the US unemployment rate of the previous month, log(totalarticles jt ) is the natural logarithm of total articles for newspaper j in month t. Main variables of interest are AfterClosure jt, DemocratPresident t and their interaction. β 3 represents the effect of having a Democrat President in office rather than a Republican President, before closure. β 1 +β 3 represents the same effect after closure. I include an interaction of these two variables in order to allow for different closure effects under Democrat and Republican Presidents. I include the unemployment rate of the previous month, since this rate is announced in the beginning of current month and it is the relevant rate for unemployment articles. Change in unemployment rate can also affect reporting of unemployment news, as a sudden increase (or decrease) in unemployment rate is likely to attract more media attention. Therefore, I include the change in unemployment rate between the two previous months as a control variable. Larger newspapers are more likely to have other sections such as sports, arts, foreign affairs or celebrity news. This in turn can reduce the relative frequency of unemployment articles compared to a smaller newspaper that report only political and economic news. I use logarithm of total articles that appear in a newspaper in a month as a proxy for newspaper s size. In addition, I include a time trend in case newspapers became more (or less) likely to report unemployment news between 1990 and Finally, there may be factors that affect all newspapers in the same MSA. I use MSA 9
17 fixed effects in my first specification in order to account for such factors. Furthermore, the circulation of a closed rival s newspaper relative to a surviving newspaper s circulation or the political affiliation of the closed newspaper can have different effects on each newspaper. I include newspaper fixed effects in my second specification to account for such effects. These two types of fixed effects should produce similar results, as only 4 out of 24 MSAs with closures had more than one surviving newspaper. I divide the newspapers in my sample into three groups, according to their endorsement index and 0.19 correspond to 33 rd and 67 th percentile when I rank all newspapers by endorsement index from most conservative to most liberal. From now on, I will call newspapers in bottom third, top third and middle third of endorsement index conservative newspapers, liberal newspapers and moderate newspapers, respectively. Panel A of Table 2a, 3b and 3c reports the estimated regression results. The first displays results after controlling for MSA fixed effects, while the second column includes newspaper fixed effects. The second specification is my preferred specification, as newspaper fixed effects control for more individualized unobserved factors. In Panel B of each table, I report the predicted relative frequency of unemployment articles by president and closure, based on the estimated coefficients in second specifications. Table 2a indicates that, for the same unemployment rate and change in unemployment rate, conservative newspapers report unemployment news percentage points more under a Democrat President than a Republican President, before closure. This effect is significant at 1% significance level. If we turn our attention to the period after closure, this effect is reduced to In Panel B of the same table, the predicted relative frequencies indicate that conservative newspapers reported about 19% more unemployment news under a Democrat President than a Republican President, before closure. After closure, this effect was only 3.5%. This moderation of media bias after closure can also be seen for liberal newspapers in Table 2b. Liberal newspapers reported percentage points more unemployment news under a Republican President than a Democratic President, before closure. This effect was reduced to percentage points after closure. Panel B of the same table indicates that liberal newspapers were reporting about 12% more unemployment news under a Republican President than a Democrat President. This effect is less than 1% after 10
18 closure. For moderate newspapers, reported in Table 2c, the estimated coefficients for my variables of interest were insignificant. President s party affiliation did not seem to matter for moderate newspapers in their reporting of unemployment news. These effects remained insignificant after closure. For conservative, liberal and moderate newspapers, I test the following two hypotheses. The first one tests the null hypothesis of no bias before closure, while the second test is for the period after closure. Hypothesis 1: H o : β 3 = 0 H 1 : β 3 0 Hypothesis 2: H o : β 1 +β 3 = 0 H 1 : β 1 +β 3 0 For conservative newspapers, p-values for alternative hypotheses were 0 and Null Hypothesis of no bias can be rejected before closure at 1% significance level. After closure, we fail to reject that there is no media bias. P-values for the alternative hypotheses of liberal newspapers were 0 and Null hypothesis of no bias is rejected before closure, while it fails to be rejected after closure. For moderate newspapers, both null hypotheses fail to be rejected, since the p-values are 0.24 and One-tailed tests also led to the same conclusions. A one percentage point increase in unemployment rate increased the reporting of unemployment news by around percentage points in all three tables. This effect was significant. Change in unemployment rate also had a significant positive effect on reporting of unemployment news. The size of the newspaper had a negative effect on relative frequency of unemployment news, but this effect was not always significant at 5% level. Time trend was insignificant. Effects of alignment between newspaper s and President s political inclinations Second, I create an alignment index which is formed by multiplying a newspaper s endorsement index with -1 if the President is Republican. As noted earlier, endorsement index was negative for conservative newspapers and positive for liberal newspapers. This way, positive numbers for alignment index will correspond to a newspaper in political alignment with the President, while negative numbers will 11
19 represent the opposite. In addition, the absolute value of this number will be a measure of the intensity of alignment or misalignment with the President. This approach will allow me to use over 22,000 observations at once and provide a more continuous measure of marginal effects of alignment on relative frequency of unemployment news. I estimate the following econometric model: Here, Alignment jt, is the newly calculated alignment index for newspaper j in time period t. Table 3 displays the regression results with alignment index. Columns 1 and 2 include MSA fixed effects and newspaper fixed effects respectively. The results are significant for all main variables of interest. Before closure, a newspaper reported 0.28 percentage points less unemployment news if it was 1 point more in alignment with the president. This effect was 0.07 after closure. Alignment index range is between -1.2 and th and 75 th percentile of alignment index were and 0.266, respectively. I call the former low alignment and the latter high alignment. Predicted values of relative frequencies are given in Panel B. As alignment increases, unemployment news are reported less. Before closure, this effect is about 15%, while it is about 5% after closure. Moderation of media bias after the closure of a rival newspaper continues to be the case when alignment index is used with over 21,000 observations. Other control variables also have similar signs and magnitudes as in Tables 3a, 3b and 3c. I test the same Null Hypotheses of no bias before closure and after closure. This time, I compare 25 th percentile of alignment index with 75 th percentile of alignment index. I reject the Null Hypothesis of no bias before closure, but fail to reject it after closure. Effects of closures by population of the MSA Third, I consider the population of the Metropolitan Statistical Area in order to analyze whether the newspapers in more populated areas behaved differently after closure than the newspapers in less populated areas. Highly populated areas are more 12
20 likely to have a higher number of newspapers. One rival s closure may not have as large of an effect as in smaller areas, since there will still be more surviving rivals. To capture this effect, I divide the sample into two according to MSA population in 2000 Census. I call the first half low population areas and the second half high population areas. I run the previous regression with alignment index. Regressions results are reported in Table 4. I only include my preferred specification of newspaper fixed effects, as the other specification has produced similar results. First column of Panel A reports the results for low population areas, while the second column is for high population areas. Regression results indicate that alignment s effect is larger in smaller metropolitan areas. Panel B displays the percentage change of relative frequency of unemployment articles by population and closure, as we increase the alignment index from 25 th percentile to 75 th percentile. Newspapers in low population areas had a larger reduction (from 16.3% to 4.3%) in their bias than newspapers in high population areas (from 13.5% to 5.8%). This may be attributed to the fact that in many small areas, the surviving newspaper was the only newspaper left and it moderated its media bias more to reach out to former readers of the closed newspaper. In large areas, there would still be competition after a closure and the benefits from moderation would be relatively less. Robustness I use newspaper slant, measured by Gentzkow and Shapiro (2010), instead of endorsement index in order to see if this would change my results. Newspaper slant was available for 3 additional newspapers for a total of 102 newspapers. Table 5 displays the results of my first regression. Columns 1 and 3 reproduce the results from Tables 3a and 3b, for conservative and liberal newspapers, respectively. These results used the endorsement index to divide the sample into three groups. I report the results with newspaper slant in columns 2 and 4, for conservative and liberal newspapers, respectively. The results were very similar. The numbers have the same signs and significance. This is plausible, as endorsement index and newspaper slant were highly correlated. 13
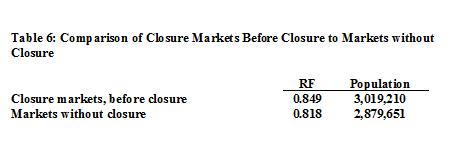
21 There is no evidence that the classification of newspapers by endorsement index or newspaper slant is driving the results. Potential for Selection Bias Newspapers in closure markets might have been already reporting unemployment news more (or less) often than the newspapers in markets without a closure, before the closure date. If this is the case, then the regression results would be biased. My AfterClosure variable takes the value 0 for both observations in markets without closure and for observations before closure date in markets with closure. These two sets of observations construct my control group. In Table 6, I compare these two sets of observations by relative frequency of unemployment articles and MSA population in Relative frequencies of unemployment articles are and 0.818, in closure markets before closure and in markets without closure, respectively. The difference between the two numbers is statistically insignificant at 1% significance level. Average MSA population of the two sets of observations were also very close and the difference between them was statistically insignificant at 1% level. I was not able to find evidence for selection bias before the closure. Potential for Omitted Variable Bias Ideally, I would also control for the ratio of closed newspaper s circulation to surviving newspaper s circulation in the same area. Larger closed newspaper are more likely to have greater effects on surviving newspapers with their closure. Ideal time to observe such circulation numbers would be just before the closure date, for both closed and surviving newspapers. However, my search for historical circulation numbers provided data for less than one third of surviving newspapers and less than 10% of closed newspapers. However, newspaper fixed effects would account for this missing variable, since every newspaper has a fixed effect that account for such a ratio among other factors that do not vary over time for a newspaper. Furthermore, closed newspapers endorsement index was also not available for almost all closed newspapers. If the closed newspaper was of the opposing political view 14
22 in a market, a stronger case can be made for further moderation of media bias in such markets. Nevertheless, newspaper fixed effects would also capture such an effect. 15
23 V. Conclusions This research shows that newspapers moderate their media-bias significantly after the closure of a rival newspaper in the same market. After controlling for the unemployment rate and change in unemployment rate, conservative newspapers reported 19% more unemployment news when the President was a Democrat rather than a Republican, before the closure of a rival newspaper in the same media market. This effect is 12% for liberal newspapers. After the closure, these numbers were 3.5% and 1%, respectively. In addition, newspapers in smaller metropolitan areas, where the effect of a closure on the set of potential readers is conceivably larger, moderate their bias more. My identification strategy can potentially have a selection bias or omitted variable bias. Newspapers in closure markets may already display more (or less) media bias than newspapers in other markets, even before the closure of a rival newspaper. This would bias the regression results. I compare the reporting of unemployment news before the closure in closure markets and in markets that never had a closure. I find no evidence for selection bias. Ideally, I would also have the ratio of a closed newspaper s circulation to that of each surviving newspaper of the same media market, just before the closure. Closed newspapers with high circulation are more likely to affect the behavior of surviving newspapers. However, my search of historical circulation numbers did not provide data for majority of closed or surviving newspapers. Furthermore, I would ideally have the endorsement index of closed newspapers, but this was not available either. A remedy to such omitted variable bias is provided by the nature of panel data. I include newspaper-fixed effects in order to account for such factors. 16
24 My findings provide support for demand-driven media bias, as newspapers aim to increase their revenues by gaining the former readers of a closed newspaper. These estimates are robust to an alternative classification of newspaper s political affiliation. It would appear that, then, newspaper editors or owners do not have as much influence on the agenda-setting behavior of newspapers as the readers. Their influence is more likely to be constrained in the editorial opinion columns and endorsement decisions, rather than the news articles. 17

25 Figure 1: Frequency of Newspapers by Endorsement Index 18

26 Figure 2: Relative Frequency of Newspapers by Unemployment Rate 19

27 Figure 3: Relative Frequency of Newspapers by Change in Unemployment Rate 20
28 21
29 22
30 23
31 24
32 25
33 26
34 27
35 28
36 REFERENCES FOR CHAPTER 1 Alterman, E. (2003). What Liberal Media? The Truth about Bias and the News. Basic Books. Abramowitz, A. I. (1988). An Improved Model for Predicting the Outcomes of Presidential Elections. Political Science and Politics, 21, Ansolabehere, S., Lessem, R., & Snyder Jr., J. M. (2006). The orientation of newspaper endorsements in U.S. elections, Quarterly Journal of Political Science, 1(4), Baron, D. (2006). Persistent Media Bias. Journal of Public Economics, 90(1-2), Bernhardt, D., Krasa, S. & Polborn, M. K. (2008). Political Polarization and the Electoral Effects of Media Bias. Journal of Public Economics, 92 (5-6), Cohen, B. (1963). The Press and Foreign Policy. Princeton, NJ: Princeton University Press. DellaVigna, S., & Kaplan, E. (2007). The Fox News effect: Media bias and voting. Quarterly Journal of Economics, 122(3), Gentzkow, M., & Shapiro, J. M. (2006). Media bias and reputation. Journal of Political Economy, 114(2), Gentzkow, M. & Shapiro, J. M. (2010). What Drives Media Slant? Evidence from U.S. Daily Newspapers. Econometrica, 78(1), George, L., & Waldfogel, J. (2003). Who affects whom in daily newspaper markets? Journal of Political Economy, 111(4), Gerber, A., & Karlan, D., & Bergan, D. (2006). Does the media matter? A field experiment measuring the effect of newspapers on voting behavior and political opinions. Yale University mimeograph, February. Groseclose, T. & Milyo, J. (2005). A Measure of Media Bias. Quarterly Journal of Economics, 120 (4), Larcinese, V., Puglisi, R., & Snyder Jr., J. M. (2007). Partisan Bias in Economic News: Evidence on the Agenda-Setting Behavior of U.S. Newspapers. London School of Economics Mimeo. 29
37 Mullainathan, S., & Shleifer, A. (2005). The Market for News. American Economic Review, 95(4), Puglisi, R. (2006). Being the New York Times: the political behavior of a newspaper. Massachusetts Institute of Technology Working Paper, March. 30
38 CHAPTER 2 : ECONOMIC SELF-INTEREST AND ISSUE STANCES IN US ELECTIONS Cagdas Agirdas * and Adam Stevenson ** I. Introduction On April 7 th, 2008, while speaking at a San Francisco fund-raiser, presidential candidate Barack Obama addressed the attitudes of working-class Pennsylvanians after 25 years of diminishing job prospects, saying that it's not surprising then they get bitter, they cling to guns or religion or antipathy to people who are not like them or anti-immigrant sentiment or anti-trade sentiment as a way to explain their frustrations. For most of the last century, the Democratic Party has tended to support more generous unemployment benefits and more redistributive taxation than the Republican Party, and so it is generally taken as given that it is in the economic selfinterest of the poor to vote for Democratic candidates (this will be our definition of economic self-interest throughout the paper). The argument that lower-income Americans are increasingly voting based on non-economic issues and against their economic self-interest is not new. Thomas Frank s (2004) What s the Matter with Kansas claims that white working-class voters began to abandon the Democratic Party in the 1970s, voting increasingly more Republican due to their positions on social issues, such as the right to bear arms, abortion or same-sex marriage. The claim that many poor voters vote against their economic self-interest is common in the popular media as well (Castello 2007). A number of political scientists have responded to Frank s analysis. Gelman et al. (2007) for example find that the poor consistently vote more Democratic than the rich Acknowledgements: Thanks are due to Prof. Mattias Polborn and Prof. Dan Bernhardt. The usual caveats apply. * Department of Economics, University of Illinois at Urbana-Champaign, David Kinley Hall 410, Urbana, IL 61820, agirdas2@illinois.edu ** Department of Economics, University of Michigan, Ann Arbor, 611 Tappan Street, Ann Arbor, MI 48109, adamstev@umich.edu 31
39 in their own state, but this gradient varies negatively with average state income. Each of these studies focus, as does Frank, on presidential elections 5. Presidential elections may however, be a special case. Even if these studies refute the main argument of What s the Matter with Kansas, Frank could be correct when other elections are considered. We ask whether economically self-interested voting is the rule across U.S. House, Senate, presidential and gubernatorial elections, or whether the presidential election is exceptional in this regard. While most papers that study the effect of income on voting behavior assume that only the absolute level of income affects voting behavior, we allow income to influence voting according to both absolute income levels and relative (within congressional district) income 6. Gelman (2009) implicitly assumes that citizens vary in their voting behavior across income levels within their own state (which have varying average income levels). In this paper, we assume that voters evaluate their income level relative to their congressional district (CD) average, which is generally a much smaller peer group that the state-level effect. Given a common effect of CD-level income, we allow personal income levels to flexibly influence voter preferences for one party over another across elections for each office type. Frank s main hypothesis is that hot-button social issues are increasingly the driver of voting patterns. The influence of social issues run contrary to economic selfinterest among the poor and in traditionally Republican states, so the argument goes, implying that rational voters are harming themselves by voting for Republican candidates. Bartels (2006) rejects a number of hypotheses about the differences in the influence of social issues by social class over time. Again, he focuses on national effects (rather than identifying the state or CD-level context), and he looks only at presidential voting. In this paper, we consider whether voter positions on non-economic issues 5 This is for a number of reasons across offices. Voting in congressional elections are perceived by political scientists as largely being dominated by incumbency and spending effects, or matters of simple recognition (Jacobsen 2004). Governors maybe seen as not particularly powerful or influential, or perhaps the influences on voting are seen as being too idiosyncratic across states we are not aware of any systematic discussion of these issues. Perceived lack of data may also be an issue at the gubernatorial level. 6 If voters evaluate their position in the income distribution relative to those around them, then not only is the income of the voter salient to voting behavior, but so is its interaction with the income in the area in which she lives. For a discussion of how and whether relative income affects economic behavior, see Stevenson and Wolfers (2008), Kahneman et al. (2006). 32
40 attenuate the effect of income on partisan voting relative to the voter s geographical context, across office and time. A number of well-documented influences on voting behavior are correlated with either income or partisan voting and they have largely been omitted from studies of economically self-interested voting. Such characteristics include candidate incumbency, the voter s race, gender, age, education level and the characteristics of the voter s place of residence. These studies focused on presidential elections, where incumbency was irrelevant once year fixed effects are included. The usage of aggregate vote counts, rather than microdata at voter level, made it impossible to analyze the correlation between voter characteristics and the vote. In addition, there is a long literature on the effects of campaign spending on election results (see Jacobson (1978, 1980, 1985, 1990), Abramowitz (1988), Gerber (1998)). For challenger spending, these effects are large, robust, and, again, typically omitted from studies of the effects of income on voting. We must control for these variables before we draw conclusions about economically selfinterested voting. After controlling for the relevant observed variables plus the effect of idiosyncratic and unobserved contest-level partisan shocks, we find that economically self-interested voting prevails across all offices we consider. This difference in partisan voting across income exists within poor and average-income districts. In the wealthiest districts, such a difference exists only in presidential elections. Once we control for issue stances of the voters, economically self-interested voting exists only in presidential elections, and only in poor and average-income districts. We also analyze the dynamics of our results, interacting voter income and issue stances with time. We find evidence for economically self-interested voting in presidential elections of 1990s and 2000s, in all districts but wealthy districts. Over the course of our sample, self-interested voting according to income appears to be a phenomenon of the 1990s and 2000s. There is little evidence of economically selfinterested voting at the beginning of our sample (the late 1970s and 1980s), coinciding with the well-known lull in partisan voting of the 1970s. 33
41 The Presidential election really is a special thing in the American political system. While the federal Congress and state-level politicians like the governor (arguably) have much more control over the economic well-being of voters, voters appear to largely ignore so-called economic self-interest in voting for these politicians. The inclusion of issue positions into our models of voting behavior in these races makes both absolute and relative income completely non-predictive of voting behavior. This is largely as Frank would argue, had he focused on these offices, and it is in line with a relatively rational, well-informed voter. Social concerns like abortion and gun control policies are largely determined at the state level. Income is a very powerful influence over Presidential voting, as other researchers have clearly shown, and in contradiction to Frank and other popular commentators. To the extent that social scientists want to study the tradeoff between economic and social forces in the political economy, they should focus on these other offices, rather than on the focal race of the Presidency, where the tradeoff is less stark, where the policy is actually formed and fought, and where the data largely fails to support the idea of the (relatively) misguided and illinformed voting. 34
42 II. Data The majority of our variables come from the American National Election Surveys (NES) 7. The NES conducts a survey of voting-age adults every election year. This data includes the individual s self-reported voting for Senate, House, presidential and gubernatorial races, income, self-reported ideology, age, minority status, gender, education level, level of urbanization and positions on various issues. We use the NES surveys conducted from 1978 to 2004, with the exception of 2002, since the respondents were not asked to report their income in We exclude the elections before 1978, as campaign spending data was not available for those years. Our unit of observation is a single individual s (i) vote cast over the candidates for a specific office (o) in a given year (t) 8. We use Federal Election Commission (FEC) 9 data for federal campaign spending. Since gubernatorial elections are not federal, this campaign spending is disclosed to the relevant state government agencies, and has been collected in the Gubernatorial Campaign Expenditures Database (GCED) 10. Our incumbency data come from the FEC and GCED as well. CD-level characteristics, (most importantly, the median income of the voter s CD) are taken from nearest US Census 11 for years up through 2000 and from the American Communities Survey (ACS) for We drop votes cast for House candidates in the year immediately after redistricting (if any), since the partisan dynamics in these years are likely to be substantially different than those in other years. We also drop votes cast in elections without real competition between one republican and one democrat. These cases 7 Data and documentation is available from the NES website, 8 The NES is generally a repeated cross-section, but a small number of individuals are observed in multiple years. Our notation makes this clear, but we do not use the partial panel structure of the NES in this paper. 9 Data and documentation is available from the FEC website, 10 GCED was compiled by Thad Beyle and Jennifer M. Jensen, with assistance from Rachelle Fernandes and Jenny Li. Data and documentation is available at 11 Census data for congressional districts was compiled by E. Scott Adler. Data and documentation is available at 35
43 include elections that had strong third party candidates or more than one strong candidate of the same party 12. Table 7 provides the descriptive statistics of the major variables that we use in this paper, for the population of voters. We had more than 5,300 voters surveyed in each of House, Senate and presidential elections, while gubernatorial elections had about 3,600 respondents. In our sample, around 11% of the votes were cast by the poor, while about 7% of the votes came from the rich. We weight our regressions so that the results better approximate the population of voters. 12 Louisiana has a nonpartisan blanket primary in which the candidates from both parties run against each other in one single primary. If no candidate obtains a majority of the vote, then the two strongest candidates advance to the runoff election. In many cases, this resulted in candidates of the same party competing against each other in the runoff election. 36
44 III. Econometric Models and Variables Since we are interested in finding evidence for economically self-interested voting across the four offices, we look for significant differences in the likelihood of voting Republican between the rich and the poor in each. The estimated models and the variables we include are given below. Our base model, Model 1a, is given by: Pr( R = 1) = β I + γ X + λ Z + η + ϕ + ε. (1) ito o it o it o dto to dto ito R ito takes a value of one when voter i reported casting a vote for the Republican candidate for office o in year t. The main variables of interest, the income effects, I it, include a vector of income category dummy variables 13 and their interaction with the (continuously measured) median income of their congressional district. We call this interaction relative income. As one holds individual income constant and raise CD income, the individual becomes poorer relative to her neighbors. If relative income influences voting and the poor are more likely to vote for Democratic candidates, then we expect the coefficient associated with relative income to be negative. X it is a vector of other voter characteristics, such as self-reported ideology 14, age, minority status, and whether the voter is female. There is an endogeneity problem in the previous literature, where party affiliation is used to predict the vote cast (see Ansolabehere et al. (2006)). Party affiliation of the voter is likely to be simultaneously determined with the vote cast by that voter. Namely, it is not clear which way the causality runs between party affiliation and the vote cast. To mitigate this problem, we use self-reported ideology of the voter instead of party affiliation. 13 The NES data restricts us to using income categories rather than a continuous variable. Incomes are grouped by annual income centiles, so that while in absolute terms the categories differ across years, in relative terms they are comparable. We label these five categories poor (0-16 th percentile), low-middle (17 th - 33 rd percentile), middle (34 th -67 th percentile), high-middle (68 th 95 th percentile) and rich (96 th 100 th percentile). 14 Self-reported ideology is measured on a scale of 1-7, 1 being extremely liberal, 7 extremely conservative, and 4 moderate/non-ideological 37
45 Contest-specific characteristics are given by Z dto, where d stands for district. The main characteristics we control for are Republican relative spending 15 (the Republican s share of all expenditures in the dto campaign), and whether the incumbent ran for the office, an effect we allow to differ between Republicans and Democrats. We also allow for national partisan shocks by office in each election year in the form of year fixed effects η to. Since the NES in most cases contains data on multiple votes cast for each race, we can control for idiosyncratic partisan shocks to each contested election, in the form of race-specific dummy variables, φ dto. These latter effects may arise in the form of scandals, differences in candidate valence, or any other effects that sway voters but that are unobserved by the econometrician. Finally, we assume that the residual effect ε ito is normally distributed, so that we may estimate equation (1) by probit regression. As a sensitivity analysis, we analyze the robustness of Model 1 to the presence of possible confounding variables. Model 1b is identical to equation (1) except that X it includes the voter s education level in the form of three binary variables indicating that voter had 0 to 8 years of education, 13 to 15 years of education and a college degree or more (9 to 12 years in the omitted category). Model 1c is identical to model 1b, except that X it contains also the level of urbanization of the voter s congressional district (CD) in the form of two binary variables identifying city and rural voters (suburban residency in the omitted category). One concern here is that higher education may influence political views, and the rich are more likely to be highly educated than the poor. Further, both the rich and the well-educated are disproportionally likely to live in urban area, and it is well known that residents of urban areas are more likely to vote for a Democrat (Gelman 2009). Our main focus is the interaction between the social issue positions and economic self-interest of voters, and so in model 2, we add six issue variables to model 1c to see whether voter responses to these issues attenuate or mitigate the effect of income on 15 Where s R (s D ) is the total spending of the Republican (Democratic) candidate in campaign dto, this variable equals s R /( s R.+ s D ). In the presidential elections within our sample (between 1980 and 2004, both major party candidates accepted public financing. Therefore, they had the same amount of money to spend after the conventions, which eliminated any potential financial advantages in campaigning. For this reason, we do not include a spending variable in presidential elections. 38
46 partisan voting. We divide our issue variables into three that are predominantly economic and three that are predominantly social. Each issue is measured on its own integer-valued scale (indicated in Table 2), where in each case we have constructed the variable so that higher numbers coincide with the more conservative position. A secondary claim of Frank s is the alleged phenomenon that poor citizens grew substantially in the 1980s and 1990s, particularly in rural and inland states. To observe how income and social issue effects have changed over time, in model 3 we interact all income variables and issue variables from model 2 with a time trend variable and its square. 39
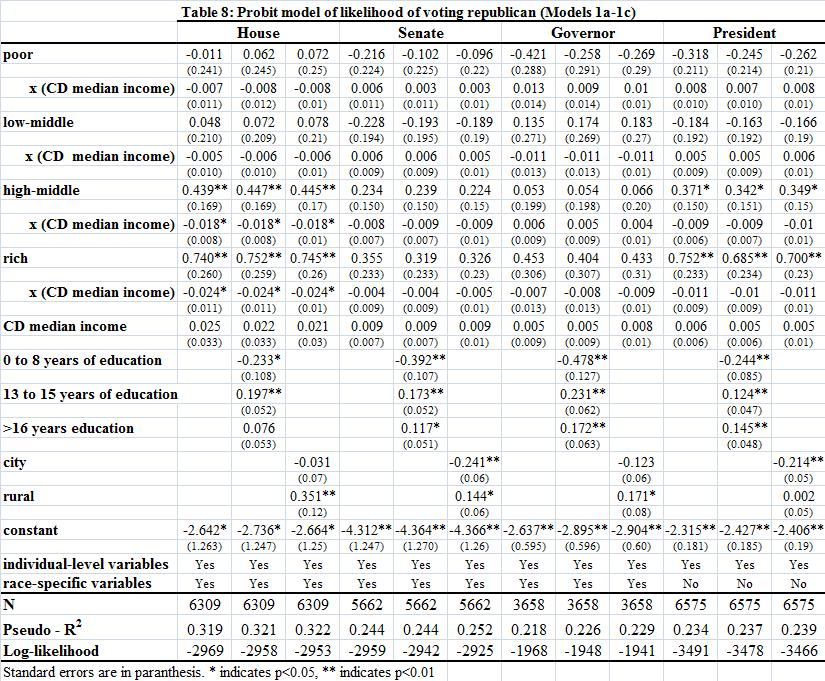
47 IV. Absolute and Relative Income Effects on Partisan Voting There can be no doubt that the rich are more likely to vote for a Republican candidate than the poor (regardless of whether it is true that the poor tend to vote against their economic self-interest ). Figure 4 shows the simple mean of partisan voting behavior (where 1 implies a vote cast for a Republican, 0 for a Democrat) across the deciles of CD median income, plotted by personal income categories. For example, middle-income voters in a median-income district voted for the Republican candidate for a House seat around 40% of the time in our data. There is clear partisan stratification by income in elections for all offices. In the raw data, there seems to be some indication that among rich individuals, the likelihood of voting Republican falls as CD income rises. The opposite appears to be true among the poor; the poor line slope up slightly, implying that as the poor become relatively poorer within district, they become more likely to vote for the Republican candidate. In Senate and presidential elections, in the poorest districts, there is a fifty percentage point difference in Republican voting between the rich and the poor, while in the richest districts, that gap falls to around twenty percentage points. This section investigates first whether the existence of these absolute income gaps are robust to the presence of control variables, and second, whether this closing of the relative income gap in rich districts is a significant relationship within the data. Table 8 reports the results of our base model, model 1a, as well as the sensitivity analyses of models 1b and 1c. The omitted income category corresponds to individuals between the 34 th - 67 th percentiles of income. In every regression presented in this paper, we control for, but do not report the associated coefficients of voter characteristics that consist of self-reported ideology, age, minority status and whether the voter was female. For all offices, in all versions of model 1, self-reported ideology and minority status have significant effect in the expected direction, and voter gender never does. Age has a small but significant effect in House and Senate, (where older voters are slightly more Democratic), while it had no significant effects in gubernatorial and presidential elections. 40
48 The main effects of interest in Table 2 are the absolute and relative income coefficients. Since we define economic self-interest in voting to exist when the rich and the poor, all else equal, we are not directly interested in whether particular income coefficients (whether relative or absolute) are significantly different from zero, since these simply test whether the coefficients differ from those of middle-income voters. We primarily want to investigate whether the total effect of income causes the rich and poor to vote significantly differently, which involves a different test, performed below. That said, it is also informative to look at individual coefficients. Consider model 1a in Table 2. Holding all else (including CD income) equal, individuals in the poor or low-middle income groups do not vote significantly more or less Republican than middle-income voters. Individuals in the top two income categories vote significantly more Republican in House and presidential elections than do middle income voters, and where significant, the relative income effects have the expected sign. When we perform our test of economically self-interested voting, it will become important to note that, except in House elections, the relative income coefficients for the poor, while not individually significantly different from zero, are actually positive. Interestingly, the income of the CD overall is not significantly correlated with voting; it is only through the relative effects that district income sways voting behavior. To directly test the existence of economically self-interested voting, we must control for the electoral context. First, as our specification suggests, we provide separate tests by office type. We also consider how income differences in partisan voting change with the income level of the CD. Our mental experiment goes as follows. We take a poor and rich voter (with all other characteristics set at the sample mean), and place them together into various electoral contexts: into a poor district (in the 10 th percentile of CD median income), a median-income district, and a rich (90 th CD income percentile) district. In each case, find the expected partisan gap in voting, and test whether this gap is statistically significant. We perform a similar test where we assign them to incometypical districts, where the poor and rich individuals are assigned to a CD with the expected income for someone in their individual income group. In this situation, the rich and poor voters are in different districts, but otherwise we compare voters within the same district. Let the total effect of income level I on voting behavior be 41
49 α I + β I *( CD median income ), where αi is the absolute income effect, and βi is the relative income effect. The null hypothesis that we test for an average-income CD is H 0 : ( αpoor + βpoor * ) ( αrich + βrich * ) = 0 (2) with analogous specifications for other CD income levels. Table 3 reports the teststatistics, based on the model 1a results, by office and CD income. All the test statistics are negative, as expected. The poor are more likely to vote for a Democrat than the rich. Second, there is significant economically self-interested voting for every office within average, poor and income-typical districts. In rich districts, there is only evidence for economically self-interested voting in presidential elections. In poor districts, the poor vote poor : they follow their perceived self-interest and vote more democratic. However, in rich districts, there is no significant partisan difference. Even though they are relatively poorer, they vote rich, as if they share the electoral values of their rich neighbors. Finally, economically self-interested voting seems to have the greatest effect in presidential elections, which have been the focus in the literature. Voters seem to believe that the President has more power over redistributing income through tax policy than a single representative, senator or governor. The inclusion of relative income effects is an important addition here. Standard economic assumptions (and most empirical research that we are aware of) would lead us to believe that the poor, for example, are homogenous in the way they vote for their own economic well-being. In fact, the poor (on an absolute scale) in rich districts vote differently than the poor in rich districts. A naïve version of model 1a that only includes absolute income levels 16 systematically overestimates partisan income differences in rich districts and underestimates differences in voting behavior in poor districts. The results of models 1b and 1c, also given in Table 8, test the sensitivity of the estimated income effects in model 1a to the inclusion of plausible confounding variables in the relationship between income and partisan voting. More educated voters are more likely to vote Republican, and college dropouts tend to be more Republican than others. Adding urbanization indicators (omitting the category of predominantly suburban districts), voters in rural areas are significantly more likely to vote Republican, and 16 These results are available upon request. 42
50 urban voters are more likely to vote Democratic in Senate and presidential elections. The inclusion of these variables do not significantly change the absolute and relative income coefficients, nor do they noticeably augment the explanatory power of our regressions, given income and our large number of fixed effects. The tests reported in Table 9 do not change significantly under models 1b and 1c. 43
51 V. Partisan Income Effects, Given Issue Positions, and Across Time In Model 2, we include voter responses to the three economic and three social issues we introduced in the previous section. In contrast to Bartels (2006), we look beyond presidential elections (in addition to including controls given in equation (1). The results are given in Table 10. The explanatory power (as measured by a likelihoodratio test between models 1c and 2) of the model is sharply improved when we include issue positions. The absolute and relative income coefficients do not change significantly relative to model 1a. The three economic issues have stronger association with voting than the three social issues. Therefore, we had no evidence to claim that social issues matter more than economic issues in voting. Among economic issues, the voter s opinion about the government provision of jobs is most consistently associated with partisan voting, while abortion leads among social issues. The coefficients on issue positions are greater in Presidential elections than in any other elections. This might again be due to the fact that a president can have a stronger impact on these issues than a single representative, senator or governor. We perform a test, analogous to equation (2) based on the model 2 results, where we now maintain issue positions at their sample means. These results are given in Table 11. Once we control for differences in issue positions across income categories, income differences in partisan voting tend to fall into insignificance in House, Senate and gubernatorial elections, and significantly, economically self-interested voting remains only in presidential elections. Presidential elections appear unique in this regard, and the evidence supports Frank for all other offices. While issue positions are important to presidential voters, both income and issues exert powerful influence over voting. For the other offices (and particularly so for the House), issue positions largely dominate income as an influence over voting. We summarize these results visually in Figure 5, which plots rich-poor differences in Republican voting, given various levels of controls. Each line is the result of a prediction based on model 2. The line labeled raw difference simply generates predicted voting for each individual based on these results and averages across personal income by CD income categories. The basic controls adjustment generates individual 44
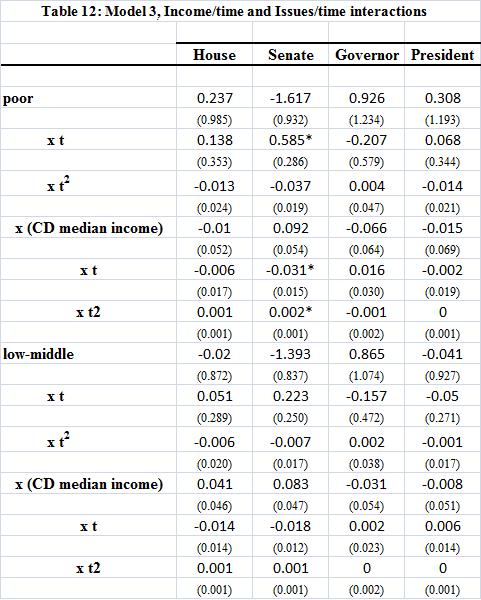
52 predictions, on the assumption that all Z dto and X it variables except issue positions are set to their population means. This controls for systematic differences in these characteristics by income. The full controls does the same while equalizing issue positions across income as well. Moving from raw predicted differences to the full control line pushes income effects towards zero in every office. Only in Presidential elections do these rich-poor differences remain positive, although the gap does shrink as we add controls. In Figure 6, we plot the rich-poor income effect as measured by the difference in the sums of the absolute and relative income coefficients. For this calculation, CD median income is measured at the intra-decile mean. The basic control coefficients are taken from model 1c while the full control coefficients are from model 2. We also display the 95% confidence intervals of each income effect estimate. This difference approaches zero as the district median income increases in every office. With minimal controls, the rich-poor difference is significant in poor districts, while it disappears into insignificance as we move to the wealthiest districts for all offices except the presidency. Frank s essential story is that the phenomenon of issue-driven voting has grown over time, to become a powerful electoral influence by the time of the Republican Revolution in To examine the time dynamics of the effects presented in Table 10, we now turn our attention to time interactions of income and issue variables. Model 3 allows the parameters associated with income groups, relative income effects and issue positions to vary flexibly with time. We set the time variable to take value 0 in 1978 elections and to increase by 1 for each election year thereafter, so that the presidential election year of 1980 is the base year in our analysis. The results are shown in Table 12. In Table 13, we report the test results for economically self-interested voting in three years: 1978, 1990 and We reject the hypothesis of a rich-poor gap in partisan voting (all else, including issue positions, equal) for any office or district type in Frank s idea that voters began voting against their economic-self interest starting in 1970s seems to find support in our findings for The 1990s were a high-point for economically stratified partisan voting in the House. In relatively poor districts, we find 45
53 significant differences in voting by income, but this effect disappears by 2000, and it never approaches the magnitude of the income effect in presidential elections. Economically self-interested voting appears to rise consistently in Senate and presidential elections over our sample period, becoming significant and very large in Senate races (among all median district income levels) by the year 2000, and significant and increasingly large in the presidential races of the 1990s and 2000s. The income dynamics of gubernatorial races are substantially different. We never find any evidence of income differences in partisan voting. It bears repeating that the only income effects that we find in House and presidential races come from low-income and average districts. As we discussed in the context of Table 10, the poor in relatively rich districts vote rich, as if their political self-interest is more aligned with the rich in their district than with the poor in other districts. Table 13 makes it clear that this effect is not common, since there is only one instance in 12 tests of significant differences in income-based voting among rich districts. This phenomenon is actually increasing in presidential races, to the point that the test statistic is almost zero among presidential voters in
54 Table 7: Descriptive Statistics Statistic House Senate Governor President Total votes cast Number of election years Total electoral races Average number of votes per election year Fraction of votes cast for Republicans 46.28% 46.49% 44.92% 49.64% (0.499) (0.499) (0.497) (0.500) Average number of CDs surveyed per election year (14.64) (35.06) (37.86) (53.04) Fraction of races with a Republican incumbent 36.39% 36.32% 22.69% NA (0.481) (0.482) (0.420) NA Races with a Democratic incumbent 49.25% 41.03% 22.69% NA (0.500) (0.493) (0.420) NA Fraction of Republican spending 45.64% 52.04% 48.06% NA (0.343) (0.259) (0.207) NA 47
55 Table 7 (cont.) Median of CD Median Incomes 20,209 19,980 19,980 20,499 (6,732) (7,557) (6,526) (7,632) % of votes cast by the poor voters 10.40% 10.84% 11.21% 11.38% (0.305) (0.311) (0.316) (0.318) % of votes cast by the low-middle income voters 14.93% 14.82% 15% 15.74% (0.356) (0.355) (0.357) (0.364) % of votes cast by the middle income voters 35.03% 33.82% 33.16% 34.32% (0.477) (0.473) (0.471) (0.475) % of votes cast by the high-middle income voters 32.78% 32.96% 32.45% 31.86% (0.469) (0.470) (0.468) (0.466) % of votes cast by the rich voters 6.91% 7.56% 8.20% 6.69% (0.254) (0.264) (0.274) (0.250) Government should leave us alone to get ahead (1-7) (0.269) (0.277) (0.279) (0.278) Government will not do what s right (1-4) (0.185) (0.187) (0.185) (0.187) Government wastes our money (1-3)
56 Table 7 (cont.) (0.247) (0.252) (0.245) (0.253) A woman's place is the home (1-7) (0.292) (0.288) (0.301) (0.298) I attend church regularly (1-6) (0.326) (0.325) (0.324) (0.321) Abortion should never be legal (1-4) Standard errors are in parentheses. (0.352) (0.352) (0.352) (0.354) 49
57 50
58 Table 9: Test results using Model 1a House Senate Governor President Poor district 0.517** 0.428** ** ** Average district 0.386** 0.347** ** ** Rich district ** Income-typical district 0.284** 0.346** ** ** * indicates p<0.05, ** indicates p<
59 52
60 Table 11: Test results using Model 2 House Senate Governor President Average district * ** Rich district Poor district * ** Income-typical district * ** * indicates p<0.05, ** indicates p<
61 54
Partisan Bias in Economic News: Evidence on the. Agenda-Setting Behavior of U.S. Newspapers
 Partisan Bias in Economic News: Evidence on the Agenda-Setting Behavior of U.S. Newspapers Valentino Larcinese Department of Government and STICERD London School of Economics Riccardo Puglisi Dipartimento
Amy Tenhouse. Incumbency Surge: Examining the 1996 Margin of Victory for U.S. House Incumbents
 Amy Tenhouse Incumbency Surge: Examining the 1996 Margin of Victory for U.S. House Incumbents In 1996, the American public reelected 357 members to the United States House of Representatives; of those
Following the Leader: The Impact of Presidential Campaign Visits on Legislative Support for the President's Policy Preferences
 University of Colorado, Boulder CU Scholar Undergraduate Honors Theses Honors Program Spring 2011 Following the Leader: The Impact of Presidential Campaign Visits on Legislative Support for the President's
Gender preference and age at arrival among Asian immigrant women to the US
 Gender preference and age at arrival among Asian immigrant women to the US Ben Ost a and Eva Dziadula b a Department of Economics, University of Illinois at Chicago, 601 South Morgan UH718 M/C144 Chicago,
Web Appendix for More a Molehill than a Mountain: The Effects of the Blanket Primary on Elected Officials Behavior in California
 Web Appendix for More a Molehill than a Mountain: The Effects of the Blanket Primary on Elected Officials Behavior in California Will Bullock Joshua D. Clinton December 15, 2010 Graduate Student, Princeton
Author(s) Title Date Dataset(s) Abstract
 Title Date Dataset(s) Abstract") Author(s): Traugott, Michael Title: Memo to Pilot Study Committee: Understanding Campaign Effects on Candidate Recall and Recognition Date: February 22, 1990 Dataset(s): 1988 National Election Study, 1989
Author(s): Traugott, Michael Title: Memo to Pilot Study Committee: Understanding Campaign Effects on Candidate Recall and Recognition Date: February 22, 1990 Dataset(s): 1988 National Election Study, 1989
THE WORKMEN S CIRCLE SURVEY OF AMERICAN JEWS. Jews, Economic Justice & the Vote in Steven M. Cohen and Samuel Abrams
 THE WORKMEN S CIRCLE SURVEY OF AMERICAN JEWS Jews, Economic Justice & the Vote in 2012 Steven M. Cohen and Samuel Abrams 1/4/2013 2 Overview Economic justice concerns were the critical consideration dividing
Non-Voted Ballots and Discrimination in Florida
 Non-Voted Ballots and Discrimination in Florida John R. Lott, Jr. School of Law Yale University 127 Wall Street New Haven, CT 06511 (203) 432-2366 john.lott@yale.edu revised July 15, 2001 * This paper
Three Essays on Political Economy of Media
 Three Essays on Political Economy of Media The Harvard community has made this article openly available. Please share how this access benefits you. Your story matters. Citation Accessed Citable Link Terms
Res Publica 29. Literature Review
 Res Publica 29 Greg Crowe and Elizabeth Ann Eberspacher Partisanship and Constituency Influences on Congressional Roll-Call Voting Behavior in the US House This research examines the factors that influence
Online Appendix for The Contribution of National Income Inequality to Regional Economic Divergence
 Online Appendix for The Contribution of National Income Inequality to Regional Economic Divergence APPENDIX 1: Trends in Regional Divergence Measured Using BEA Data on Commuting Zone Per Capita Personal
The Case of the Disappearing Bias: A 2014 Update to the Gerrymandering or Geography Debate
 The Case of the Disappearing Bias: A 2014 Update to the Gerrymandering or Geography Debate Nicholas Goedert Lafayette College goedertn@lafayette.edu May, 2015 ABSTRACT: This note observes that the pro-republican
Partisan news: A perspective from economics
 Partisan news: A perspective from economics Daniel F. Stone Bowdoin College University of Maine Department of Communication and Journalism October 3, 2016 Partisan bias is only problem #38 But some
Essays on Political Economy
 Essays on Political Economy The Harvard community has made this article openly available. Please share how this access benefits you. Your story matters. Citation Accessed Citable Link Terms of Use Fonseca
UC Davis UC Davis Previously Published Works
 UC Davis UC Davis Previously Published Works Title Constitutional design and 2014 senate election outcomes Permalink https://escholarship.org/uc/item/8kx5k8zk Journal Forum (Germany), 12(4) Authors Highton,
Presidents and The US Economy: An Econometric Exploration. Working Paper July 2014
 Presidents and The US Economy: An Econometric Exploration Working Paper 20324 July 2014 Introduction An extensive and well-known body of scholarly research documents and explores the fact that macroeconomic
Partisan Nation: The Rise of Affective Partisan Polarization in the American Electorate
 Partisan Nation: The Rise of Affective Partisan Polarization in the American Electorate Alan I. Abramowitz Department of Political Science Emory University Abstract Partisan conflict has reached new heights
The Incumbent Spending Puzzle. Christopher S. P. Magee. Abstract. This paper argues that campaign spending by incumbents is primarily useful in
 The Incumbent Spending Puzzle Christopher S. P. Magee Abstract This paper argues that campaign spending by incumbents is primarily useful in countering spending by challengers. Estimates from models that
Congressional Gridlock: The Effects of the Master Lever
 Congressional Gridlock: The Effects of the Master Lever Olga Gorelkina Max Planck Institute, Bonn Ioanna Grypari Max Planck Institute, Bonn Preliminary & Incomplete February 11, 2015 Abstract This paper
An Analysis of U.S. Congressional Support for the Affordable Care Act
 Chatterji, Aaron, Listokin, Siona, Snyder, Jason, 2014, "An Analysis of U.S. Congressional Support for the Affordable Care Act", Health Management, Policy and Innovation, 2 (1): 1-9 An Analysis of U.S.
Heterogeneous Friends-and-Neighbors Voting
 Heterogeneous Friends-and-Neighbors Voting Marc Meredith University of Pennsylvania marcmere@sas.upenn.edu October 7, 2013 Abstract Previous work shows that candidates receive more personal votes, frequently
Experiments: Supplemental Material
 When Natural Experiments Are Neither Natural Nor Experiments: Supplemental Material Jasjeet S. Sekhon and Rocío Titiunik Associate Professor Assistant Professor Travers Dept. of Political Science Dept.
Publicizing malfeasance:
 Publicizing malfeasance: When media facilitates electoral accountability in Mexico Horacio Larreguy, John Marshall and James Snyder Harvard University May 1, 2015 Introduction Elections are key for political
1. The Relationship Between Party Control, Latino CVAP and the Passage of Bills Benefitting Immigrants
 The Ideological and Electoral Determinants of Laws Targeting Undocumented Migrants in the U.S. States Online Appendix In this additional methodological appendix I present some alternative model specifications
Retrospective Voting
 Retrospective Voting Who Are Retrospective Voters and Does it Matter if the Incumbent President is Running Kaitlin Franks Senior Thesis In Economics Adviser: Richard Ball 4/30/2009 Abstract Prior literature
Whose Statehouse Democracy?: Policy Responsiveness to Poor vs. Rich Constituents in Poor vs. Rich States
 Policy Studies Organization From the SelectedWorks of Elizabeth Rigby 2010 Whose Statehouse Democracy?: Policy Responsiveness to Poor vs. Rich Constituents in Poor vs. Rich States Elizabeth Rigby, University
Supplementary Materials A: Figures for All 7 Surveys Figure S1-A: Distribution of Predicted Probabilities of Voting in Primary Elections
 Supplementary Materials (Online), Supplementary Materials A: Figures for All 7 Surveys Figure S-A: Distribution of Predicted Probabilities of Voting in Primary Elections (continued on next page) UT Republican
Volume 35, Issue 1. An examination of the effect of immigration on income inequality: A Gini index approach
 Volume 35, Issue 1 An examination of the effect of immigration on income inequality: A Gini index approach Brian Hibbs Indiana University South Bend Gihoon Hong Indiana University South Bend Abstract This
Model of Voting. February 15, Abstract. This paper uses United States congressional district level data to identify how incumbency,
 U.S. Congressional Vote Empirics: A Discrete Choice Model of Voting Kyle Kretschman The University of Texas Austin kyle.kretschman@mail.utexas.edu Nick Mastronardi United States Air Force Academy nickmastronardi@gmail.com
Politics, Public Opinion, and Inequality
 Politics, Public Opinion, and Inequality Larry M. Bartels Princeton University In the past three decades America has experienced a New Gilded Age, with the income shares of the top 1% of income earners
THE EFFECT OF EARLY VOTING AND THE LENGTH OF EARLY VOTING ON VOTER TURNOUT
 THE EFFECT OF EARLY VOTING AND THE LENGTH OF EARLY VOTING ON VOTER TURNOUT Simona Altshuler University of Florida Email: simonaalt@ufl.edu Advisor: Dr. Lawrence Kenny Abstract This paper explores the effects
The Cook Political Report / LSU Manship School Midterm Election Poll
 The Cook Political Report / LSU Manship School Midterm Election Poll The Cook Political Report-LSU Manship School poll, a national survey with an oversample of voters in the most competitive U.S. House
Chapter Four: Chamber Competitiveness, Political Polarization, and Political Parties
 Chapter Four: Chamber Competitiveness, Political Polarization, and Political Parties Building off of the previous chapter in this dissertation, this chapter investigates the involvement of political parties
United States House Elections Post-Citizens United: The Influence of Unbridled Spending
 Illinois Wesleyan University Digital Commons @ IWU Honors Projects Political Science Department 2012 United States House Elections Post-Citizens United: The Influence of Unbridled Spending Laura L. Gaffey
Stimulus Facts TESTIMONY. Veronique de Rugy 1, Senior Research Fellow The Mercatus Center at George Mason University
 Stimulus Facts TESTIMONY Veronique de Rugy 1, Senior Research Fellow The Mercatus Center at George Mason University Before the House Committee Transportation and Infrastructure, Hearing entitled, The Recovery
How does media market structure affect what media
 Newspaper Market Structure and Behavior: Partisan Coverage of Political Scandals in the United States from 1870 to 1910 Ángela Fonseca Galvis, Pontificia Universidad Javeriana James M. Snyder Jr., Harvard
Practice Questions for Exam #2
 Fall 2007 Page 1 Practice Questions for Exam #2 1. Suppose that we have collected a stratified random sample of 1,000 Hispanic adults and 1,000 non-hispanic adults. These respondents are asked whether
Research Statement. Jeffrey J. Harden. 2 Dissertation Research: The Dimensions of Representation
 Research Statement Jeffrey J. Harden 1 Introduction My research agenda includes work in both quantitative methodology and American politics. In methodology I am broadly interested in developing and evaluating
Should the Democrats move to the left on economic policy?
 Should the Democrats move to the left on economic policy? Andrew Gelman Cexun Jeffrey Cai November 9, 2007 Abstract Could John Kerry have gained votes in the recent Presidential election by more clearly
The Effect of North Carolina s New Electoral Reforms on Young People of Color
 A Series on Black Youth Political Engagement The Effect of North Carolina s New Electoral Reforms on Young People of Color In August 2013, North Carolina enacted one of the nation s most comprehensive
Purposes of Elections
 Purposes of Elections o Regular free elections n guarantee mass political action n enable citizens to influence the actions of their government o Popular election confers on a government the legitimacy
Political Polarization and the Electoral Effects of Media Bias
 University of Illinois at Urbana-Champaign From the SelectedWorks of Mattias K Polborn 2008 Political Polarization and the Electoral Effects of Media Bias Mattias K Polborn Stefan Krasa Dan Bernhardt Available
Robert H. Prisuta, American Association of Retired Persons (AARP) 601 E Street, N.W., Washington, D.C
 601 E Street, N.W., Washington, D.C") A POST-ELECTION BANDWAGON EFFECT? COMPARING NATIONAL EXIT POLL DATA WITH A GENERAL POPULATION SURVEY Robert H. Prisuta, American Association of Retired Persons (AARP) 601 E Street, N.W., Washington, D.C.
A POST-ELECTION BANDWAGON EFFECT? COMPARING NATIONAL EXIT POLL DATA WITH A GENERAL POPULATION SURVEY Robert H. Prisuta, American Association of Retired Persons (AARP) 601 E Street, N.W., Washington, D.C.
Ohio State University
 Fake News Did Have a Significant Impact on the Vote in the 2016 Election: Original Full-Length Version with Methodological Appendix By Richard Gunther, Paul A. Beck, and Erik C. Nisbet Ohio State University
Research Note: U.S. Senate Elections and Newspaper Competition
 Research Note: U.S. Senate Elections and Newspaper Competition Jan Vermeer, Nebraska Wesleyan University The contextual factors that structure electoral contests affect election outcomes. This research
EFFECTS OF NATURAL RESOURCES WEALTH OF POLITICAL PARTICIPATION AND POLITICAL OUTCOME
 EFFECTS OF NATURAL RESOURCES WEALTH OF POLITICAL PARTICIPATION AND POLITICAL OUTCOME An Undergraduate Research Scholars Thesis by MICHAEL PANG CHUNG YANG Submitted to the Undergraduate Research Scholars
Learning from Small Subsamples without Cherry Picking: The Case of Non-Citizen Registration and Voting
 Learning from Small Subsamples without Cherry Picking: The Case of Non-Citizen Registration and Voting Jesse Richman Old Dominion University jrichman@odu.edu David C. Earnest Old Dominion University, and
Prof. Bryan Caplan Econ 854
 Prof. Bryan Caplan bcaplan@gmu.edu http://www.bcaplan.com Econ 854 Week 6: Voter Motivation, III: Miscellaneous I. Religion, Party, and Ideology A. Many observers of modern American politics think that
Midterm Elections Used to Gauge President s Reelection Chances
 90 Midterm Elections Used to Gauge President s Reelection Chances --Desmond Wallace-- Desmond Wallace is currently studying at Coastal Carolina University for a Bachelor s degree in both political science
Guns and Butter in U.S. Presidential Elections
 Guns and Butter in U.S. Presidential Elections by Stephen E. Haynes and Joe A. Stone September 20, 2004 Working Paper No. 91 Department of Economics, University of Oregon Abstract: Previous models of the
Benefit levels and US immigrants welfare receipts
 1 Benefit levels and US immigrants welfare receipts 1970 1990 by Joakim Ruist Department of Economics University of Gothenburg Box 640 40530 Gothenburg, Sweden joakim.ruist@economics.gu.se telephone: +46
Allocating the US Federal Budget to the States: the Impact of the President. Statistical Appendix
 Allocating the US Federal Budget to the States: the Impact of the President Valentino Larcinese, Leonzio Rizzo, Cecilia Testa Statistical Appendix 1 Summary Statistics (Tables A1 and A2) Table A1 reports
Congressional Elections, 2018 and Beyond
 Congressional Elections, 2018 and Beyond Robert S. Erikson Columbia University 2018 Conference by the Hobby School of Public Affairs, University of Houston Triple Play: Election 2018; Census 2020; and
This journal is published by the American Political Science Association. All rights reserved.
 Article: National Conditions, Strategic Politicians, and U.S. Congressional Elections: Using the Generic Vote to Forecast the 2006 House and Senate Elections Author: Alan I. Abramowitz Issue: October 2006
TRACKING CITIZENS UNITED: ASSESSING THE EFFECT OF INDEPENDENT EXPENDITURES ON ELECTORAL OUTCOMES
 TRACKING CITIZENS UNITED: ASSESSING THE EFFECT OF INDEPENDENT EXPENDITURES ON ELECTORAL OUTCOMES A Thesis submitted to the Faculty of the Graduate School of Arts and Sciences of Georgetown University in
SHOULD THE DEMOCRATS MOVE TO THE LEFT ON ECONOMIC POLICY? By Andrew Gelman and Cexun Jeffrey Cai Columbia University
 Submitted to the Annals of Applied Statistics SHOULD THE DEMOCRATS MOVE TO THE LEFT ON ECONOMIC POLICY? By Andrew Gelman and Cexun Jeffrey Cai Columbia University Could John Kerry have gained votes in
Judicial Elections and Their Implications in North Carolina. By Samantha Hovaniec
 Judicial Elections and Their Implications in North Carolina By Samantha Hovaniec A Thesis submitted to the faculty of the University of North Carolina in partial fulfillment of the requirements of a degree
Online Appendix: Robustness Tests and Migration. Means
 VOL. VOL NO. ISSUE EMPLOYMENT, WAGES AND VOTER TURNOUT Online Appendix: Robustness Tests and Migration Means Online Appendix Table 1 presents the summary statistics of turnout for the five types of elections
Media and Political Persuasion: Evidence from Russia
 Media and Political Persuasion: Evidence from Russia Ruben Enikolopov, Maria Petrova, Ekaterina Zhuravskaya Web Appendix Table A1. Summary statistics. Intention to vote and reported vote, December 1999
National Labor Relations Board
 National Labor Relations Board Submission of Professor Martin H. Malin and Professor Jon M. Werner in response to the National Labor Relations Board s Request for Information Regarding Representation Election
SUPPLEMENT TO WHAT DRIVES MEDIA SLANT? EVIDENCE FROM U.S. DAILY NEWSPAPERS (Econometrica, Vol. 78, No. 1, January 2010, 35 71)
") Econometrica Supplementary Material SUPPLEMENT TO WHAT DRIVES MEDIA SLANT? EVIDENCE FROM U.S. DAILY NEWSPAPERS (Econometrica, Vol. 78, No. 1, January 2010, 35 71) BY MATTHEW GENTZKOW AND JESSE M. SHAPIRO
Econometrica Supplementary Material SUPPLEMENT TO WHAT DRIVES MEDIA SLANT? EVIDENCE FROM U.S. DAILY NEWSPAPERS (Econometrica, Vol. 78, No. 1, January 2010, 35 71) BY MATTHEW GENTZKOW AND JESSE M. SHAPIRO
Economic Voting in Gubernatorial Elections
 Economic Voting in Gubernatorial Elections Christopher Warshaw Department of Political Science Massachusetts Institute of Technology May 2, 2017 Preliminary version prepared for the UCLA American Politics
Corruption and business procedures: an empirical investigation
 Corruption and business procedures: an empirical investigation S. Roy*, Department of Economics, High Point University, High Point, NC - 27262, USA. Email: sroy@highpoint.edu Abstract We implement OLS,
How does the messenger influence the impact of newspaper endorsements?
 How does the messenger influence the impact of newspaper endorsements? Kyle A. Dropp 1 and Christopher Warshaw 2 September 11, 2012 1 Ph.D. candidate, Department of Political Science, Stanford University,
The Messenger Matters: Media Endorsements and Election Outcomes
 The Messenger Matters: Media Endorsements and Election Outcomes Kyle A. Dropp 1 and Christopher Warshaw 2 October 16, 2012 1 Ph.D. candidate, Department of Political Science, Stanford University, dropp@stanford.edu
Julie Lenggenhager. The "Ideal" Female Candidate
 Julie Lenggenhager The "Ideal" Female Candidate Why are there so few women elected to positions in both gubernatorial and senatorial contests? Since the ratification of the nineteenth amendment in 1920
Staff Tenure in Selected Positions in House Member Offices,
 Staff Tenure in Selected Positions in House Member Offices, 2006-2016 R. Eric Petersen Specialist in American National Government Sarah J. Eckman Analyst in American National Government November 9, 2016
The Persuasive Effects of Direct Mail: A Regression Discontinuity Approach
 The Persuasive Effects of Direct Mail: A Regression Discontinuity Approach Alan Gerber, Daniel Kessler, and Marc Meredith* * Yale University and NBER; Graduate School of Business and Hoover Institution,
The Ideological Foundations of Affective Polarization in the U.S. Electorate
 703132APRXXX10.1177/1532673X17703132American Politics ResearchWebster and Abramowitz research-article2017 Article The Ideological Foundations of Affective Polarization in the U.S. Electorate American Politics
A REPLICATION OF THE POLITICAL DETERMINANTS OF FEDERAL EXPENDITURE AT THE STATE LEVEL (PUBLIC CHOICE, 2005) Stratford Douglas* and W.
 Stratford Douglas* and W.") A REPLICATION OF THE POLITICAL DETERMINANTS OF FEDERAL EXPENDITURE AT THE STATE LEVEL (PUBLIC CHOICE, 2005) by Stratford Douglas* and W. Robert Reed Revised, 26 December 2013 * Stratford Douglas, Department
A REPLICATION OF THE POLITICAL DETERMINANTS OF FEDERAL EXPENDITURE AT THE STATE LEVEL (PUBLIC CHOICE, 2005) by Stratford Douglas* and W. Robert Reed Revised, 26 December 2013 * Stratford Douglas, Department
14.11: Experiments in Political Science
 14.11: Experiments in Political Science Prof. Esther Duflo May 9, 2006 Voting is a paradoxical behavior: the chance of being the pivotal voter in an election is close to zero, and yet people do vote...
Staff Tenure in Selected Positions in Senators Offices,
 Staff Tenure in Selected Positions in Senators Offices, 2006-2016 R. Eric Petersen Specialist in American National Government Sarah J. Eckman Analyst in American National Government November 9, 2016 Congressional
DATA ANALYSIS USING SETUPS AND SPSS: AMERICAN VOTING BEHAVIOR IN PRESIDENTIAL ELECTIONS
 Poli 300 Handout B N. R. Miller DATA ANALYSIS USING SETUPS AND SPSS: AMERICAN VOTING BEHAVIOR IN IDENTIAL ELECTIONS 1972-2004 The original SETUPS: AMERICAN VOTING BEHAVIOR IN IDENTIAL ELECTIONS 1972-1992
The Case of the Disappearing Bias: A 2014 Update to the Gerrymandering or Geography Debate
 The Case of the Disappearing Bias: A 2014 Update to the Gerrymandering or Geography Debate Nicholas Goedert Lafayette College goedertn@lafayette.edu November, 2015 ABSTRACT: This note observes that the
A Functional Analysis of 2008 and 2012 Presidential Nomination Acceptance Addresses
 Speaker & Gavel Volume 51 Issue 1 Article 5 December 2015 A Functional Analysis of 2008 and 2012 Presidential Nomination Acceptance Addresses William L. Benoit Ohio University, benoitw@ohio.edu Follow
Consumer Expectations: Politics Trumps Economics. Richard Curtin University of Michigan
 June 1, 21 Consumer Expectations: Politics Trumps Economics Richard Curtin University of Michigan An unprecedented partisan divide in economic expectations occurred following President Trump s election.
Iowa Voting Series, Paper 4: An Examination of Iowa Turnout Statistics Since 2000 by Party and Age Group
 Department of Political Science Publications 3-1-2014 Iowa Voting Series, Paper 4: An Examination of Iowa Turnout Statistics Since 2000 by Party and Age Group Timothy M. Hagle University of Iowa 2014 Timothy
Income Inequality as a Political Issue: Does it Matter?
 University of Colorado, Boulder CU Scholar Undergraduate Honors Theses Honors Program Spring 2015 Income Inequality as a Political Issue: Does it Matter? Jacqueline Grimsley Jacqueline.Grimsley@Colorado.EDU
U.S. Catholics split between intent to vote for Kerry and Bush.
 The Center for Applied Research in the Apostolate Georgetown University Monday, April 12, 2004 U.S. Catholics split between intent to vote for Kerry and Bush. In an election year where the first Catholic
Public Opinion and Political Participation
 CHAPTER 5 Public Opinion and Political Participation CHAPTER OUTLINE I. What Is Public Opinion? II. How We Develop Our Beliefs and Opinions A. Agents of Political Socialization B. Adult Socialization III.
Unequal Recovery, Labor Market Polarization, Race, and 2016 U.S. Presidential Election. Maoyong Fan and Anita Alves Pena 1
 Unequal Recovery, Labor Market Polarization, Race, and 2016 U.S. Presidential Election Maoyong Fan and Anita Alves Pena 1 Abstract: Growing income inequality and labor market polarization and increasing
Changes in Party Identification among U.S. Adult Catholics in CARA Polls, % 48% 39% 41% 38% 30% 37% 31%
 The Center for Applied Research in the Apostolate Georgetown University June 20, 2008 Election 08 Forecast: Democrats Have Edge among U.S. Catholics The Catholic electorate will include more than 47 million
Staff Tenure in Selected Positions in Senate Committees,
 Staff Tenure in Selected Positions in Senate Committees, 2006-2016 R. Eric Petersen Specialist in American National Government Sarah J. Eckman Analyst in American National Government November 9, 2016 Congressional
Public Opinion and Political Socialization. Chapter 7
 Public Opinion and Political Socialization Chapter 7 What is Public Opinion? What the public thinks about a particular issue or set of issues at any point in time Public opinion polls Interviews or surveys
THE PUBLIC AND THE CRITICAL ISSUES BEFORE CONGRESS IN THE SUMMER AND FALL OF 2017
 THE PUBLIC AND THE CRITICAL ISSUES BEFORE CONGRESS IN THE SUMMER AND FALL OF 2017 July 2017 1 INTRODUCTION At the time this poll s results are being released, the Congress is engaged in a number of debates
USING MULTI-MEMBER-DISTRICT ELECTIONS TO ESTIMATE THE SOURCES OF THE INCUMBENCY ADVANTAGE 1
 USING MULTI-MEMBER-DISTRICT ELECTIONS TO ESTIMATE THE SOURCES OF THE INCUMBENCY ADVANTAGE 1 Shigeo Hirano Department of Political Science Columbia University James M. Snyder, Jr. Departments of Political
WORKING PAPER STIMULUS FACTS PERIOD 2. By Veronique de Rugy. No March 2010
 No. 10-15 March 2010 WORKING PAPER STIMULUS FACTS PERIOD 2 By Veronique de Rugy The ideas presented in this research are the author s and do not represent official positions of the Mercatus Center at George
Evaluating the Connection Between Internet Coverage and Polling Accuracy
 Evaluating the Connection Between Internet Coverage and Polling Accuracy California Propositions 2005-2010 Erika Oblea December 12, 2011 Statistics 157 Professor Aldous Oblea 1 Introduction: Polls are
Supporting Information for Do Perceptions of Ballot Secrecy Influence Turnout? Results from a Field Experiment
 Supporting Information for Do Perceptions of Ballot Secrecy Influence Turnout? Results from a Field Experiment Alan S. Gerber Yale University Professor Department of Political Science Institution for Social
Community Well-Being and the Great Recession
 Pathways Spring 2013 3 Community Well-Being and the Great Recession by Ann Owens and Robert J. Sampson The effects of the Great Recession on individuals and workers are well studied. Many reports document
Red Oak Strategic Presidential Poll
 Red Oak Strategic Presidential Poll Fielded 9/1-9/2 Using Google Consumer Surveys Results, Crosstabs, and Technical Appendix 1 This document contains the full crosstab results for Red Oak Strategic s Presidential
Information and Wasted Votes: A Study of U.S. Primary Elections
 Quarterly Journal of Political Science, 2015, 10: 433 459 Information and Wasted Votes: A Study of U.S. Primary Elections Andrew B. Hall 1 and James M. Snyder, Jr. 2 1 Department of Political Science,
Appendix: Supplementary Tables for Legislating Stock Prices
 Appendix: Supplementary Tables for Legislating Stock Prices In this Appendix we describe in more detail the method and data cut-offs we use to: i.) classify bills into industries (as in Cohen and Malloy
Forecasting the 2018 Midterm Election using National Polls and District Information
 Forecasting the 2018 Midterm Election using National Polls and District Information Joseph Bafumi, Dartmouth College Robert S. Erikson, Columbia University Christopher Wlezien, University of Texas at Austin
Swing Voters in Swing States Troubled By Iraq, Economy; Unimpressed With Bush and Kerry, Annenberg Data Show
 DATE: June 4, 2004 CONTACT: Adam Clymer at 202-879-6757 or 202 549-7161 (cell) VISIT: www.naes04.org Swing Voters in Swing States Troubled By Iraq, Economy; Unimpressed With Bush and Kerry, Annenberg Data
Online Appendix for Redistricting and the Causal Impact of Race on Voter Turnout
 Online Appendix for Redistricting and the Causal Impact of Race on Voter Turnout Bernard L. Fraga Contents Appendix A Details of Estimation Strategy 1 A.1 Hypotheses.....................................
The Textile, Apparel, and Footwear Act of 1990: Determinants of Congressional Voting
 The Textile, Apparel, and Footwear Act of 1990: Determinants of Congressional Voting By: Stuart D. Allen and Amelia S. Hopkins Allen, S. and Hopkins, A. The Textile Bill of 1990: The Determinants of Congressional
Introduction. Midterm elections are elections in which the American electorate votes for all seats of the
 Wallace 1 Wallace 2 Introduction Midterm elections are elections in which the American electorate votes for all seats of the United States House of Representatives, approximately one-third of the seats
NBER WORKING PAPER SERIES THE PERSUASIVE EFFECTS OF DIRECT MAIL: A REGRESSION DISCONTINUITY APPROACH. Alan Gerber Daniel Kessler Marc Meredith
 NBER WORKING PAPER SERIES THE PERSUASIVE EFFECTS OF DIRECT MAIL: A REGRESSION DISCONTINUITY APPROACH Alan Gerber Daniel Kessler Marc Meredith Working Paper 14206 http://www.nber.org/papers/w14206 NATIONAL
The Conditional Nature of Presidential Responsiveness to Public Opinion * Brandice Canes-Wrone Kenneth W. Shotts. January 8, 2003
 The Conditional Nature of Presidential Responsiveness to Public Opinion * Brandice Canes-Wrone Kenneth W. Shotts January 8, 2003 * For helpful comments we thank Mike Alvarez, Jeff Cohen, Bill Keech, Dave