DUAL-MEMBER MIXED PROPORTIONAL: A NEW ELECTORAL SYSTEM FOR CANADA. (Updated April 4, 2016) Sean Graham
|
|
|
- Pauline Holmes
- 5 years ago
- Views:
Transcription
1 DUAL-MEMBER MIXED PROPORTIONAL: A NEW ELECTORAL SYSTEM FOR CANADA (Updated April 4, 2016) Sean Graham smg1@ualberta.ca
2 1 CONTENTS ACKNOWLEDGEMENTS 4 1 ABBREVIATIONS 4 2 DEFINITIONS 5 3 INTRODUCTION 6 4 THE IDEAL ELECTORAL SYSTEM 8 5 CRITIQUES OF PROMINENT ELECTORAL SYSTEMS SINGLE MEMBER PLURALITY MIXED MEMBER PROPORTIONAL SINGLE TRANSFERABLE VOTE CONCLUDING REMARKS 21 6 DUAL-MEMBER MIXED PROPORTIONAL THE BASICS AN EXAMPLE NOTES ON EXAMPLE NOTES ON THE DESIGN OF DMP BALLOT DESIGN THE EXCEPTION: INDEPENDENTS THRESHOLDS THE RESERVE ADDRESSING TIED VOTES BY-ELECTIONS WHEN DMP FAILS TO PRODUCE PROPORTIONAL RESULTS 40
3 CASE 1: ONE OR MORE PARTIES RUNS OUT OF QUALIFIED CANDIDATES CASE 2: ONE OR MORE PARTIES WINS A FRACTION OF THE FIRST SEATS GREATER THAN TWICE THEIR FRACTION OF THE ELIGIBLE VOTE 41 7 CONSTITUTIONAL ADHERENCE 43 8 GERRYMANDERING 44 9 TESTING DMP IN MATLAB INTRODUCTION SIMULATIONS OF PAST FEDERAL ELECTIONS USING DMP OVERVIEW OF RESULTS REGIONAL REPRESENTATION THE CORRECTION FACTOR AS A STRENGTH OF DMP CHALLENGING ACCEPTED LIMITATIONS OF ELECTORAL SYSTEMS: WHY DMP COULD BRIDGE THE GAP IN THE ELECTORAL REFORM DEBATE CONCLUSION 54 AFTERWARD 55 APPENDIX A: CALCULATING THE MAXIMUM POTENTIAL FOR WASTED VOTES WITH PROPORTIONAL FORMULAE 56 A.1 THE NUMBER OF PARTIES IS LESS THAN TWICE THE NUMBER OF SEATS 57 A.1.1 THE NUMBER OF PARTIES IS EVEN 57 A.1.2 THE NUMBER OF PARTIES IS ODD 58 A.2 THE NUMBER OF PARTIES IS GREATER THAN TWICE THE NUMBER OF SEATS 59 APPENDIX B: BALLOT DESIGN 60 APPENDIX C: 2006 FEDERAL ELECTION 62
4 3 C.1 REGIONAL RESULTS 62 C.2 FEDERAL RESULTS 64 APPENDIX D: 2008 FEDERAL ELECTION 66 D.1 REGIONAL RESULTS 66 D.2 FEDERAL RESULTS 68 APPENDIX E: 2011 FEDERAL ELECTION 70 E.1 REGIONAL RESULTS 70 E.2 FEDERAL RESULTS 72 APPENDIX F: 2015 FEDERAL ELECTION 74 F.1 REGIONAL RESULTS 74 F.2 FEDERAL RESULTS 76 APPENDIX G: THE DISTRICT REPRESENTATION FACTOR 78 REFERENCES 80
5 4 ACKNOWLEDGMENTS First, I would like to thank Dr. Steve Patten for supervising this project, his advice on the design of DMP, and his contributions to the editing of this report. I would also like to thank the Undergraduate Research Initiative for funding this project. 1 ABBREVIATIONS DMP Dual-Member Mixed Proportional MMP Mixed Member Proportional OPOV One-Person One-Vote SMP Single Member Plurality STV Single Transferable Vote TMP Two Member Plurality
6 5 2 DEFINITIONS Correction Factor The fraction of seats that are assigned differently under DMP than under a two-member district plurality system. District Representation Factor The number that when multiplied by a party's fraction of the seats in an assembly yields the fraction of the districts in which the party has representation. Electoral Formula An algorithm that takes votes as an input and produces winning candidates as an output. Electoral System Refers to the combination of ballot design, districting, and electoral formula. 1 Margin of Error The difference between a party s fraction of the popular vote and its fraction of the seats in an assembly. OPOV The principle that each member of the electorate has one vote and that those votes count equally to determining election outcomes. TMP An electoral system that elects representatives by plurality in two member districts. 1 Dennis Pilon, The Politics of Voting: Reforming Canada s Electoral System (Toronto: Emond Montgomery Publications Limited, 2007), 18.
7 6 3 INTRODUCTION Just over a decade ago, electoral system reform garnered serious attention in Canada. 2 Multiple Canadian governments considered changing their electoral formulae to better reflect the will of the electorate (that is, to produce more proportional election outcomes). 3 Three provinces (British Columbia, Ontario, and Prince Edward Island) held referenda on adopting an alternative electoral system, two provinces (Quebec and New Brunswick) studied electoral system reform, and the federal government established a commission that recommend adopting a new electoral system. 4 However, despite the extensive discussion on the subject and four referenda, electoral system reform has still not been achieved. 5 While reformists agree that Single Member Plurality (SMP) is flawed and should be replaced, they have not been able to agree on an alternative. The most commonly suggested alternatives to SMP are Single Transferable Vote (STV) and Mixed Member Proportional (MMP), with MMP being the favourite of the federal government and the provinces that have considered electoral system reform. 6 These are presented as worthy alternatives to SMP despite having significant flaws of their own. Although these shortcomings are not necessarily massive enough to make these alternatives inferior to SMP, their existence merits going back to the drawing board to develop a better alternative. The aim of this report is to present that better alternative. While the focus will be on replacing Canada s federal electoral system, much of the discussion will also be applicable to provincial jurisdictions. Like many works on electoral reform, an explanation of why SMP is 2 Pilon, The Politics of Voting, The components of an electoral system are not isolated from one another, and changing one often necessitates changes in the others. What is important to note here is that in considering changing their electoral formulae, these governments have contemplated changing their respective jurisdiction s entire electoral system. 4 Electoral Reform Initiatives in Canadian Provinces, last modified August 18, 2009, Pilon, The Politics of Voting, Electoral Reform Initiatives in Canadian Provinces. 6 Electoral Reform Initiatives in Canadian Provinces ; Pilon, The Politics of Voting, 89-90, 119. PEI, New Brunswick, and Ontario have considered MMP, while BC has contemplated STV.
8 7 flawed and needs to be replaced will be provided. However, unlike many other writings on this subject, both STV and MMP will be thoroughly criticized as well. The collective flaws of these three systems will inform the parameters for the construction of a new alternative called Dual- Member Mixed Proportional. The remainder of the report will be devoted to explaining and defending this new system. But, to begin this project, a clear target at which all electoral systems should aim must be established.
9 8 4 THE IDEAL ELECTORAL SYSTEM Before examining how SMP and its most discussed potential replacements are inadequate, it is necessary to describe what an electoral system should accomplish. These terms of reference will serve as the ideal that all electoral systems should strive to achieve and will create an objective scale with which to compare different electoral systems. While any list of objectives will be open for debate, I contend that the following six are the most defensible criteria for judging the quality of electoral systems. First, an electoral system should produce proportional results. In other words, an electoral system should translate each party s fraction of the popular vote into the same fraction of seats in the assembly with a margin of error no larger than total n m er of seats. Second, an electoral system should achieve One-Person One-Vote (OPOV). That is to say, each person s vote should count equally when determining election outcomes. Third, an electoral system should only make use of first choice preferences. Fourth, electoral systems should waste as few votes as possible, meaning that they should maximize the fraction of votes that count towards electing representatives. 7 Fifth, an electoral system should not breed intra-party competition. Finally, an electoral system should permit the distribution of an assembly s seats across as many districts as possible, which requires that it minimize the number of representatives allocated to each district. The above criteria are not entirely distinct since there are two logical connections that exist. The first is between criteria two and three. If an electoral system adheres completely to OPOV, it will only count first choice preferences. 8 This is the case because to not count the first choice of every voter is to create inequality between votes electing one s first choice preference is not 7 Appendix A explains how to calculate the maximum fraction of votes that can be wasted by a proportional electoral system. 8 The exception to this is when all of the representatives are chosen from a single district. With this structure, lower choice preferences are only counted when it is impossible for a voter s first choice to count.
10 9 the same as electing one s fourth, or even second. However, an electoral system can exclusively count first choice preferences but still fail to achieve OPOV. Therefore, strictly limiting an electoral system to counting first choice preferences is a necessary, but not a sufficient, condition for OPOV. The second logical connection exists between criteria one, two, and four. If an electoral system produces proportional outcomes, each vote will have been counted equally and, therefore, OPOV will have been achieved. Furthermore, criterion four will be satisfied since as many votes will have a direct impact on the results as possible. Of these three criteria, the only one that can be satisfied independently is OPOV. 9 However, as will be explained in section five, accomplishing this is virtually impossible. The ideal electoral system has been defined in the above manner for four reasons. First, it is fundamental to democracy to ensure that the majority rules. This is impossible if the electorate is given differential voting power or if one party has its support arbitrarily inflated from a minority position to complete legislative control. Criteria one through four ensure that the will of the majority will be reflected accurately in an assembly. Second, criterion one which has been deemed necessary to adhere to democratic principles requires the existence of political parties. Without these vehicles of representation, proportional representation would have no practical means of coming into existence. Therefore, political parties must remain effective instruments of representation. Fostering internal bickering and competition during elections would not serve this purpose; thus, criterion five has been introduced to maintain the integrity of political parties. 9 For example, an election with two single-member districts, 10 votes cast in each district, and that is to be decided by plurality would achieve OPOV but would not produce proportional results or waste as few votes as possible by design.
11 10 Third, the electorate must be able to make informed decisions. Criterion six strives to ensure that this is possible by dividing the responsibility for choosing the members of an assembly between as many districts as possible. This reduces the number of candidates that each district has to choose from and, as a result, reduces the effort required by voters to become informed. Fourth, an assembly should be cognizant of the issues facing all communities over which it has jurisdiction. By creating as many districts as possible (given the agreed upon size of the assembly), criterion six attempts to prevent the members of an assembly from disproportionately coming from one community. Implicit in this justification is that an electoral system must foster accountability. The first step to creating an environment where politicians can be held accountable is to actually elect the politicians and parties that the electorate has chosen. A proportional electoral system accomplishes this task. Equally important to guaranteeing accountability is developing an electoral system that allows voters to make informed decisions. By dividing the responsibility of electing members to an assembly across as many districts as possible, the number of candidates that voters have to choose from is reduced to as small a number as possible. As a consequence, the time and effort required for a voter to become informed about their local candidates is minimized, and, therefore, the possibility of them becoming informed is maximized.
12 11 5 CRITIQUES OF PROMINENT ELECTORAL SYSTEMS 5.1 SINGLE MEMBER PLURALITY From its name, one can discern that SMP is not a proportional electoral system. The fact that it uses pluralities to elect representatives in single-member districts means that there is no safeguard built into the calculation to ensure a proportional outcome. Canada s history has shown that the absence of an electoral formula that explicitly works to produce proportional results makes achieving proportionality highly unlikely; indeed, the electoral formula used by SMP has produced disproportionate results in every federal election since Canada s inception. 10 Even more concerning, though, is that this lack of proportionality in the results produced by SMP has made false majority governments far more common than true majority governments. 11 Since 1921, Canada has had thirteen false majority governments but only three true majority governments. 12 This is a problem for a country that claims to be a democracy, as it is fundamentally undemocratic to translate a minority of votes from the electorate into a majority of seats in the House of Commons. For this reason, the lack of proportionality in the results produced by SMP is its most significant flaw. Another democratic failing of SMP is its dismal record on voter equality. There are three reasons why SMP fails to achieve OPOV in Canada. First, the minimum seat allocations to each province and territory outlined in sections 51(1) rule 2, 51A, and 51(2) of the 1867 Constitution Act prevent the proportional distribution of federal seats. 13 For example, John Courtney points 10 Canadian Election Results by Party: 867 to 2008, accessed August 2, 20 3, Electoral Results by Party, last modified October 7, 20, 11 A false majority government is one that has over 50% of the seats in the assembly but less than 50% of the popular vote (Russell 2008, 10). 12 Electoral Results by Party ; Peter Russell, Two Cheers for Minority Government: The Evolution of Canadian Parliamentary Democracy (Toronto: Emond Montgomery Publications Limited, 2008), Constitution Act, 867, last modified August 30, 2013,
13 12 out that the provincial averages for the population of electoral districts varied from 33,824 in Prince Edward Island to 108,548 in British Columbia in the post-2001 redistribution. 14 In this redistribution, PEI only deserved one seat based on its population but was allocated four because it is constitutionally guaranteed four seats. 15 This meant that votes cast in PEI were, on average, worth 3.2 times as much as those cast in BC. 16 Second, districts are permitted to vary in size within the provinces. Under normal circumstances, district populations within a province are allowed to be 25% larger or smaller than the provincial electoral quotient, which is a province s population divided by its number of seats. 17 A calculation of the Gini Index has shown that this leeway has been utilized when electoral districts have been drawn, as no province has had exact equality in district size during the hundred-year period the index was calculated. 18 Third, if the absolute (not relative) voter turnout is not equal from one district to the next, then votes cast in different districts will not be of equal weight. For example, consider two districts, each with a voting population of 10. If the first district has 100% voter turnout and the second 50%, the votes cast in the second district would be worth twice as much as those cast in the first. Therefore, although these hypothetical districts have been drawn to achieve OPOV, the voter turnout has thwarted the effort. Wasted votes are also a major concern with SMP. Allowing pluralities of votes to decide election outcomes permits a majority of votes to not count towards the election of any candidates or, in other words, to be wasted. For example, consider a single-member district that has ten 14 John C. Courtney Canada s Electoral System, in Canadian Parties in Transition, third edition, ed. Alain-G. Gagnon et al. (North York: University of Toronto Press Incorporated, 2011), Courtney, Canada s Electoral System, This assumes that the relative provincial voter turnouts were equal. 17 Ibid., Ibid., 288. Note that the Gini index was calculated for the redistributions that occurred between 1903 and 2003.
14 13 candidates contesting the election. If the first candidate receives 10.9% of the vote and each of the other nine candidates receives 9.9%, the first candidate would win the seat. Therefore, 89.1% of the votes cast in this district would not contribute to the election of a representative, or, to say it differently, 89.1% of the voters would fail to achieve representation. At this point, it may be tempting to say that this is just a theoretical problem that has no practical implications, but the evidence suggests otherwise. For the federal elections that occurred between 1980 and 2006, an average of 49% of the votes cast were wasted. 19 The issue of wasted votes leads directly to the problem of strategic voting. Strategic voting is a behaviour engaged in by some voters when their party of choice is likely to place third or lower and their least favourite party is perceived to be in the lead. Since it is thought that a vote for their preferred party is guaranteed to be wasted, such voters decide to vote for the perceived runner-up, with the hope that their votes will put them in the lead. Rather than aim to be represented by their party of choice, these voters attempt to prevent being represented by their least favourite party. This behaviour is a concern because it is indicative of a sentiment in some voters that their voices will not be heard if they cast a vote for their preferred party. In a democracy, citizens must be able to be represented by the parties of their choice. Therefore, to use a system that produces representation that the voters do not want is not only illogical, it is also undemocratic. Yet another criticism of SMP is that it exacerbates regional differences. An analysis of elections that occurred between 1968 and 2000 found that SMP turned national parties with some regional bias in their support base (such as Reform/Canadian Alliance) into purely regional parties that are thenceforth perceived and attacked as such. For governing parties, support in key regions has been exaggerated (most recently, federal Liberals in Ontario ), with its own distorting effects on the party and the government it formed. The representation of certain provinces within the winning 19 Pilon, The Politics of Voting, 54.
15 14 party caucus has been inflated, reinforcing their demographic weight in Canadian political life. With the partisan heterogeneity of provinces artificially reduced, diverse provincial electorates have been simplistically and misleadingly compressed into a single partisan voice. 20 Therefore, it can be argued that SMP is detrimental to Canadian unity, since it frequently turns a national electorate only moderately divided along regional lines into a regionally fractured and polarized House of Commons. 21 Finally, SMP makes drawing district boundaries a contentious issue. Since districts are often won with a plurality of votes rather than a majority, a slight change in where votes are counted can change the outcome. Therefore, a minor shift in a district s boundaries could be enough to change the party that will garner a plurality of votes. This opens the door to gerrymandering, both real and perceived. For instance, Terence Qualter demonstrates that some types of voter distributions lack an objective right way to draw district boundaries. 22 Consequently, regardless of the drafting process, the drafters will be charged with gerrymandering by whichever party feels that it has not got out of the scheme all that it expects MIXED MEMBER PROPORTIONAL MMP achieves proportionality by electing regional representatives from party lists in addition to local representatives in single-member districts by plurality. The regional representatives are chosen in a manner that counteracts the disproportionate results obtained 20 James Bickerton, Between Integration and Fragmentation: Political Parties and the Representation of Regions, in Canadian Parties in Transition, third edition, ed. Alain-G. Gagnon et al. (North York: University of Toronto Press Incorporated, 2011), Ibid., Terence Qualter, The Election Process in Canada (Toronto: McGraw-Hill Company of Canada Limited, 1970), Ibid.
16 15 from the SMP component of the system. Therefore, the ability of MMP to obtain proportional results is dependent on two factors. First, the more regional seats (or list seats) there are in comparison to district seats, the greater the ability of MMP to produce proportional election results. Second, the ability of MMP to produce proportional election outcomes is improved as the number of regions is reduced. Unfortunately, due to the constitutional constraints that were noted earlier, supra-provincial seats cannot currently be used in Canada. Instead, the best that could be done with MMP is to use the provinces and territories as regions. 24 This would cause the quality of the results produced by MMP to decrease in two important ways. First, it would reduce the level of proportionality the system could produce. Applying MMP to supra-provincial vote totals is not equivalent to applying the system to provincial and territorial vote totals even if the total number of list seats is the same. To see why this is true, consider an assembly that is to have 20 members elected using a proportional formula. If the 20 members are elected from one region, each party can be over or under represented by at most one seat. Therefore, the margin of error can be at most five percentage points. However, if the 20 members are elected from two ten member regions, each party can be over or under represented by at most one seat in each region or two seats in total. This would allow the margin of error to be as high as ten percentage points. 25 It should also be noted that this problem is exacerbated when the regions have unequal voter to representative ratios. For example, consider two regions, each with five seats. Region One has a population of eight, whereas Region Two has a population of two. If all of Region One s votes go to Party A, and all of Region Two s votes go to Party B, both parties will receive 24 For a more detailed discussion of this issue, see Law Commission of Canada 2004: Note that there is no significance to the choice to divide the number of seats evenly between the regions. The cause of the effect is the creation of the second region.
17 16 five seats. However, proportionality requires that Party A receive eight seats and Party B two seats. Therefore, over representing one region and under representing another works to create disproportionate results in an MMP system. Second, the constitutional requirements would prevent MMP from achieving OPOV. Since MMP is a proportional electoral system, it uses aggregate district results to determine election outcomes. This allows MMP to attain OPOV in each region but prevents it from meeting this objective between regions. It is not theoretically impossible for MMP to realize OPOV between regions in general, but Canada is an exception because of the disproportionate distribution of seats between the provinces that is stipulated by the constitution. However, this is not the main limiting factor. Even if the seats were distributed proportionally between the provinces, the level of voter turnout would need to be constant from one province to the next for OPOV to be realized. 26 Therefore, the only practical way in which MMP can be made to achieve OPOV is to have only one region. The final drawback of MMP is the very mechanism it utilizes to achieve proportionality, the regional seats. The use of regional seats creates two problems. The first is that it requires the single-member districts to be enlarged if the the number of seats in the House of Commons is to be maintained. This would represent a reduction in the level of local representation that currently exists in Canada. The second problem is more significant. To elect the regional representatives, party lists would be required. If voters were not allowed to rank candidates on the party lists, then it would reduce the ability of the electorate to hold their representatives accountable. However, allowing voters to rank the candidates would only marginally improve 26 In this case, each region would have the same voter to seat ratio but, most probably, a different total number of seats. Therefore, the relative voter turnouts would need to be equal, not the absolute, for OPOV to be achieved. If the relative voter turnouts were equal (e.g. 60%), the voter to seat ratio would be unaffected. It is the voter to seat ratios that must be equal for OPOV to be realized, which means the absolute number of voters per seat must be equal.
18 17 the situation. Since Canadian elections can be as short as 36 days, voters would not have much time to gather information about the regional and local candidates. 27 For example, in a formulation of MMP that has one regional seat for every three district seats which would not produce proportional results in general 28 Ontario could have up to 30 candidates on each party list. 29 It is unlikely that voters would be able to gather enough information about such a large number of candidates to make an informed decision. Furthermore, allowing voters to rank candidates from the same party would promote intra-party competition. One of the main functions of political parties is to aggregate interests. This would be difficult to accomplish if the bodies that are meant to unite like groups of interests were themselves divided. Instead of running as a team that would mutually benefit from votes for their party, candidates would have an incentive to campaign against other candidates running under the same party banner. 5.3 SINGLE TRANSFERABLE VOTE STV is arguably the most complicated of the electoral systems discussed in this report. Simply put, it works by choosing winning candidates based on voter rankings in multi-member districts. Each voter is able to rank a series of candidates in their district so that their vote can be transferred to lower ranking candidates if their first choice loses or wins with a surplus of votes. However, in addition to being one of the more complicated electoral systems, STV is also one of 27 Canada Elections Act: Part 5, last modified June 22, 20 2, See section c. 28 The Law Commission of Canada used a ratio of one regional seat for every two district seats and did not get proportional results (Law Commission of Canada 2004, 96). 29 House of Commons Seat Allocation by Province, last modified March 23, 20 2, This is based on the redistribution done in 2011.
19 18 the more problematic. This becomes immediately clear when it is realized what is missing from STV. When discussing STV, Rae notes that, the party affiliations of the candidates make no difference. 30 This is not a trivial fact. The trademark of a proportional formula is its recognition and use of party affiliations. This is what enables proportional formulae to translate parties percentages of the popular vote into equal percentages of the seats in an assembly. The consequence of STV s ignorance of candidates party affiliations is that it lacks a mechanism to guarantee proportional election outcomes. To make matters worse, STV requires a significant increase in district size. According to Pilon, STV requires a minimum of five members per district to produce its semi-proportional results. 31 This is a significant departure from the single-member districts currently used in Canada. Not only would it decrease the level of local representation, it would also significantly increase the number of candidates contesting each district. This would make the voters task of gathering information about all of the candidates more difficult. Although STV would significantly increase district size, it would have the smallest regions of the proportional systems discussed in this report. This is a result of the fact that, for STV, regions and districts are synonymous. Since a system s ability to produce proportional results is almost entirely dependent on region size, this equality between district and region severely limits STV s capacity to create proportional election outcomes. 30 Douglas W. Rae, The Political Consequences of Electoral Laws, revised edition (New Haven: Yale University Press, 1971), Pilon, The Politics of Voting, 132.
20 19 Despite locking up votes in small regions, however, STV is often presented as a proportional system. 32 This theoretical failure is overlooked since, it is argued, STV produces fairly proportional results in practice. 33 However, the results for the 2011 election in Ireland (one of the few countries that use STV) 34 depart substantially from proportionality. In this election, the first place party received a 10 percentage point bonus, while the third place party was under represented by nearly 6 percentage points. 35 This result is far from the 0.6 percentage point margin of error that a true proportional system would have achieved in Ireland. 36 Furthermore, when the disproportionality index was calculated for Western countries for the 1990s, STV placed last among the proportional systems. 37 In addition to its failure to achieve proportionality, STV also falls short of attaining OPOV. Like SMP, STV relies on district vote totals to decide election results. This makes STV subject to the same problems involving OPOV faced by SMP discussed earlier. Unlike SMP, however, one s first choice does not always count in an STV election. Instead, voters are asked to rank candidates in multi-member districts so that their second, third, etc. preferences can be considered if their first choice candidate fails to be elected or is elected with a surplus. 38 This causes three problems. First, it detracts from STV s ability to achieve OPOV. Voter equality is not realized if one individual is able to elect their first choice while another is only able to elect their third. Second, as mentioned above in the discussion of MMP, permitting voters to rank candidates from the same party would promote intra-party competition. 32 Law Commission of Canada, Voting Counts: Electoral Reform for Canada (Ottawa: Law Commission of Canada, 2004), 80-1; Pilon, The Politics of Voting, Pilon, The Politics of Voting, Law Commission of Canada, Voting Counts, Irish Election 25 February 20, last modified November 3, 2011, 36 Ibid. Since Ireland elected 165 members in 2011, the use of a proportional formula would have ensured, with minor exceptions, that the margin of error could not have exceeded X 100 percentage points. 37 Pilon, The Politics of Voting, Rae, The Political Consequences of Electoral Laws, 36-7.
21 20 Third, ranking candidates from different parties promotes the election of centrist parties. For example, consider a district contested by the Left Party, the Centre Party, and the Right Party that has weak support for both the LP and RP. If the LP has the weakest support of the three parties, its candidates would be declared defeated first, and its votes would need to be transferred to its supporters lower preferences. Since the CP is the closest to the LP ideologically, it would be most logical for it to be the beneficiary of vote transfers from defeated LP candidates. The same would be true if RP candidates were declared defeated. Therefore, the CP would have a systematic advantage over the LP and RP. Although some may claim that such political convergence is beneficial, it is not befitting of a democracy. If it is the desire of a portion of the electorate to be represented by a particular party whether or not many consider this party extreme it is their democratic right to obtain this representation so long as their numbers warrant at least one representative. It is categorically undemocratic to make use of an electoral system that is structured in a manner to systematically promote the transfer of votes from left and right wing parties to centrist parties. An electoral system ought not to be so structured that one specific party will be given a permanent advantage in the manner in which votes are translated into seats. 39 The use of droop quotas in STV is the source of another flaw. Droop quotas reduce the number of votes candidates require to be elected, which, in turn, wastes votes. For example, in a district with 10,000 votes cast that is to elect four representatives, the droop quota would be 0,000 2, This permits up to 2,000 votes, or 20%, to be wasted. Although this theoretical upper limit for a four-member district is lower than the average in practice for SMP, it is still far from ideal. It is certainly possible to ensure that a much smaller fraction of the votes is wasted. 39 Qualter, The Election Process in Canada, Rae, The Political Consequences of Electoral Laws, 36.
22 21 For example, with 308 seats in the House of Commons and 18 parties contesting the election in 2011, 41 this upper limit could have been reduced to a mere 1.46% CONCLUDING REMARKS Although many issues were discussed in this section, only four distinct problems were actually examined: proportionality, local representation, accountability, and party unity. The issues of wasted votes, breaking the principle of OPOV, strategic voting, exacerbated regional fractionalization, and gerrymandering are all symptoms of a more general problem, a lack of proportionality. As was demonstrated, if the issue of proportionality is not completely addressed, its symptoms do not disappear. Therefore, addressing this problem should receive the highest priority. Addressing all of the problems discussed in this section will make for a difficult task but a necessary one. Given the importance of the mechanisms in place to choose those who will represent us, we should not accept system as flawed as SMP, STV, and MMP. Indeed, as Rae aptly notes, electoral laws are of special importance for every group and individual in the society, because they help to decide who writes other laws. 43 Therefore, it is time to invent a new solution to the problem of choosing representatives for an assembly. 41 Elections Canada, Forty-first General Election May 2, 2011: List of Confirmed Candidates (Canada: Chief Electoral Officer of Canada, 2011), viii, accessed August 2, 2013, 42 See Appendix A for an explanation of how to calculate the theoretical upper limit to the fraction of votes that can be wasted by a proportional formula. 43 Rae, The Political Consequences of Electoral Laws, 3.
23 22 6 DUAL-MEMBER MIXED PROPORTIONAL 6.1 THE BASICS DMP is a proportional electoral system that would require minimal changes to Canada s existing system, aside from the electoral formula, to be implemented. The first necessary change would be the transformation of Canada s single-member districts into two-member districts. To maintain the size of the House of Commons, districts would be amalgamated rather than given an extra MP. This would represent a minor reduction in local representation but would not negatively affect the average voter to representative ratio at the district level. The second required change would be even less substantial. Each voter would still mark only one X on the ballot, but, in most circumstances, this vote would be cast for two ranked candidates running under the same party banner. 44 An example of this type of ballot is provided in Appendix B and is labeled Option A. To elect the two members from each district, DMP makes use of two methods. The first seat in each district is assigned by plurality (these will be referred to as the first seats). The second seat in each district, in general, is assigned in a manner that achieves proportional results at the regional level (these will be referred to as the second seats). The seat assignment process can be broken down into three straightforward steps: 1. Determine the number of seats each party deserves: a. Determine the fraction of the regional vote each party has received. 45 b. Using the fraction determined in step a, calculate the number of seats each party deserves in the region: 44 The two exceptions to this would be when a party nominates only one candidate and when an independent seeks election. 45 Votes received by independents and ineligible parties are excluded from the regional vote.
24 23 Record the whole number and any remaining fraction (called the remainder) of seats each party deserves. c. Determine the number of seats that remain to be allocated by summing the remainders of all of the parties. Allocate these seats to the parties with the largest remainders. 2. Determine the winners of the first seats using plurality. 3. Determine the winners of the second seats: a. For parties that won first seats, divide the fraction of the vote received within the districts they won first seats in half. The purpose of this step will be explained in Section b. For each party, create a party list. Place candidates that received the largest fraction of the vote in their district at the top and those that received the lowest fraction of the vote in their district at the bottom. c. Determine the number of seats each party needs, N, in addition to the first seats they have been assigned. d. Assign each party the first N seats from its party list. e. If multiple parties have been assigned the same second seat, assign the seat to the party that performed the best in the district. Assign parties that lost a seat due to a conflict the next seat on their party list. f. Repeat step e until no seat assignments conflict.
25 AN EXAMPLE Consider three parties (A, B, and C) competing in an election for a ten-member assembly. Since DMP is to be used to decide the outcome of the election, the region over which the assembly governs is divided into five two-member districts. The hypothetical election data is displayed in the table below: Party Votes Received/Percent of Votes Received in Each District District 1 District 2 District 3 District 4 District 5 A % % % % % B % % % % % C % % % % % Step 1: Determine the Number of Seats Each Party Deserves The following table displays the results of steps 1.a and 1.b: Party Total Votes Received Percent of Votes Received Whole Number of Seats Deserved Remainder A % B % C % To carry out Step 1.c, the number of seats that remain to be allocated must be determined. This is done by adding the entries in the column labelled Remainder, which yields two. Since parties B and C have the largest remainders, they are each allocated another seat. The final seat count for each party is given in the table below:
26 25 Party Whole Number of Seats Deserved A 3 B 3 C 4 Step 2: Determine the Winners of the First Seats To carry out Step 2, simply select (for each district) the party that received the most votes: Party Percent of Votes Received in Each District District 1 District 2 District 3 District 4 District 5 A 55.7% 19.5% 20.3% 29.4% 34.8% B 30.9% 8.0% 53.0% 34.9% 29.4% C 13.4% 72.5% 26.6% 35.7% 35.8% Step 3: Determine the Winners of the Second Seats Step 3.a is to cut the percentage of the vote received by the winners of the first seats in half. This produces the following results: Table A Party Percent of Votes Received in Each District District 1 District 2 District 3 District 4 District 5 A 27.85% 19.5% 20.3% 29.4% 34.8% B 30.9% 8.0% 26.5% 34.9% 29.4% C 13.4% 36.25% 26.6% 17.85% 17.9% This step in the DMP algorithm tends to cause the most confusion. As such, additional explanation is in order. When a party that has won the first seat in a district is considered for the second seat in that district, the fact that the party s votes have already been used to elect a
27 26 candidate must be accounted for by dividing the fraction of the vote received by the party in the district in half. Such a step is necessary because, should the second candidate also be elected, the party s votes would be legitimizing the election of two, not one, candidates. Therefore, this process ensures that the second candidate has sufficient support in the riding to be elected. Even though the other parties have two candidates on the ballot as well, only their first listed candidates can be elected at this point. Therefore, should one of these parties win the second seat, all of the party s votes in the district would be associated with one candidate. Step 3.b is to create a ranked list of candidates for each party. This is done using table A. To observe how to make the lists, let us look at how to make the list for Party A. The first step is to determine where Party A performed best after the vote tallies have been adjusted for the first seat winners. In this case, Party A had its best result in District 5. District 5 is, therefore, the first entry on Party A s list. Party Lists Party A Party B Party C 5 After District 5, Party A performed best in District 4. District 4 is, therefore, the second entry on Party A s list. Party Lists Party A Party B Party C 5 4 This process is repeated until each party has every district it contested placed, in order of decreasing performance, on its list.
28 27 Party Lists Party A Party B Party C To carry out Step 3.c, the number of first seats each party won must be determined. The following table lists the number of seats each party has won so far: Party Seats Assigned A 1 B 1 C 3 The number of second seats each party needs can now be calculated. Party Whole Number of Seats Deserved Second Seats Needed A = 2 B = 2 C = 1 Step 3.d is to assign each party the number of second seats it needs from its party list. To accomplish this, we attempt to assign the parties seats to their best performing candidates:
29 28 Party Lists Party A Party B Party C Following this, Step 3.e is to look for and address conflicting seat assignments. In this case, the second seat in District 4 has been assigned to both Party A and Party B. To address the conflict, the results in Table A are observed. Party B outperformed Party A in District 4; therefore, Party A must attempt to take the second seat in the next district on its party list, District 1: Party Lists Party A Party B Party C Step 3.f is to resolve any conflicts that were produced as a result of step 3.e. This is accomplished by repeating step 3.e. The result is the following:
30 29 Party Lists Party A Party B Party C The seat assignments are now free of conflicts, and all second seats have been filled. The tables below summarize the election outcome: Party Total Votes Received Percent of Popular Vote Received Whole Number of Seats Deserved Remainder Number of Seats Won A % B % C % District # Seat 1 Seat 2 Place 1 A B 2 2 C C 2 3 B A 4 4 C B 2 5 C A 2 The fourth column in the second table indicates the place of the candidate that won the second seat. This is not done for the first seats since the winners of these seats always place first.
31 NOTES ON EXAMPLE At first glance, it may seem odd that Party A placed fourth in District 3 when there were only three parties competing. However, there were actually four candidates competing for the seats in the district. In District 3, the fourth candidate to enter the competition was the second listed candidate for Party B. Since a party s second listed candidate can only have a chance of winning if the first listed candidate is elected to the first seat in the district, the second listed candidates of the parties that do not win the first seat are never considered. Therefore, the one party that will have an opportunity to elect both of its candidates contributes an extra competitor to the local race. 46 There are a few properties of this election outcome that are worth noting. First, four of the five districts, or 80%, are represented by two parties. Second, only one seat (the second seat in district three), or 10% of the total seats, was assigned differently than it would have been under TMP. Finally, the results are as proportionate as possible with ten seats. As will be seen later, simulations of past elections show that the results produced by DMP generally fit this pattern NOTES ON THE DESIGN OF DMP DMP has been designed to produce election outcomes that are both similar to those produced by TMP and proportional. Obviously, DMP must fail to achieve equality with the results obtained when using TMP in order to produce proportional election outcomes. Therefore, the objective was to minimize, not eliminate this difference. 46 This is true so long as an independent does not win the first seat. Since votes for independents cannot be transferred to other candidates, the number of candidates competing for the seats in a district when an independent wins the first seat is: (number of parties) + (number of independents). If a party candidate wins the first seat in a district and this candidate s party nominated two candidates, then the number of candidates competing in the district is: (number of parties) + (number of independents) + 1.
32 31 These two disparate objectives have been accomplished with three techniques. First, proportionality is achieved by using the regional vote totals to allocate seats to each party. Second, the system strives to assign parties their deserved number of second seats where they have had their strongest performances. Third, the second place finisher in each district is elected as frequently as possible. The last two mechanisms that have been built into DMP work to push the correction factor to as small a value as possible. As will be demonstrated in section 9.2.1, the correction factor tends to be surprisingly small. It is also worth mentioning that DMP utilizes a simple implementation of the Largest Remainder method. This method has been chosen over the d Hondt Highest Average method for its conceptual simplicity and stricter adherence to proportionality. 47 Conceptual simplicity has been one of the key objectives in the development of DMP. In the past, reform debates have been hampered by overly technical, and sometimes unintuitive, features of the alternatives. An alternative that permits a more intuitive and less technical explanation will likely have a better chance of amassing public support. 6.2 BALLOT DESIGN In addition to the status quo ballot design mentioned in Section 6.1, the ballot labelled Option B in Appendix B would also work well with DMP. This design would provide the electorate with more flexibility than Option A by allowing them to split their vote into ten equally valued portions. Such flexibility would allow voters to make more precise and nuanced decisions. Instead of deciding which party one wants to win all of the seats in the assembly, voters would be able to choose their ideal seat distribution between the parties. This would lead to three benefits. 47 For an explanation of how the d Hondt Highest Average method works, see Rae 1971:
33 32 First, voters would be able to decide if they wanted a majority or a minority government. For example, if a voter wanted a majority government, they could give six of their votes to their preferred party and their remaining four votes to the party or parties that they want to form the opposition. This leads to the next benefit of this method of voting: not only does the voter get to choose their government, they also get to have a say in who will form the opposition. Finally, voters could give support to single-issue parties such that they cannot form the government. For example, consider a voter that generally supports Party A but is concerned about an issue, call it Z, that Party A is not addressing. If a party were to be formed solely for the purpose of addressing issue Z, call them Party B, this voter may wish to give them support while still wanting Party A to form the government. Under this ballot design, such a voter could give a minority of their vote to Party B and a majority to Party A. This would put pressure on Party A to address issue Z without risking the possibility of Party B forming the government. 6.3 THE EXCEPTION: INDEPENDENTS In general, DMP assigns the first seats using plurality and the second seats with a proportional algorithm. However, in order to prevent independents from being disadvantaged, an override mechanism has been built into DMP. In cases where an independent places second in a district, the proportional algorithm used to assign the second seats is suspended, and both seats in the district are assigned by plurality. 6.4 THRESHOLDS Every electoral system has a minimum number of votes that a candidate or party must acquire to achieve representation, or a threshold. SMP has a variable threshold. It varies from
34 33 district to district and from one election to the next. It depends on the number of candidates contesting a district s seat and the manner in which the votes are distributed between the candidates. However, a government-mandated threshold is not imposed, at least not in Canada. Consequently, it is possible to win with an arbitrarily small percentage of the vote. The more candidates that contest a district s seat, the smaller the minimum fraction of the vote a candidate will require to win the seat will be. For example, if there are twenty candidates contesting a district, the seat could be won with as little as 5% plus one of the votes. Although it is commonly accepted to not mandate a threshold when using SMP, it is unusual to see a proportional system in use without one. However, thresholds are arbitrary and, if high enough, can pose a significant and unfair challenge to small parties. Therefore, the task of choosing a threshold should not be seen as trivial. Moreover, one should be inclined to support low thresholds and demand rigorous, democratic justifications for high thresholds. There are two types of thresholds that are worthy of consideration for DMP. The first is a regional threshold. In order for a party to be awarded seats on a proportional basis with this kind of threshold, it must receive a minimum fraction of the regional vote. Parties that fail to pass a regional threshold are said to be ineligible. The second type is a district threshold. A district threshold requires candidates to receive a minimum fraction of their district s vote to qualify for election. Regional thresholds focus on the legitimacy of parties, whereas district thresholds focus on the legitimacy of candidates. These thresholds can be used individually or in combination with each other. Since the largest region proposed in this report would encompass 122 seats, it is the recommendation of this report that a district threshold of 5% would be sufficient. It would be
35 34 low enough to not pose a significant burden to small parties, yet high enough to prevent parties with extremely low levels of support from electing candidates on a routine basis. If a regional threshold is desired, this report recommends 2% for four reasons. First, it would have been high enough to block all but the top five parties from winning seats in the federal elections examined. Second, it is high enough that a party would require more than a few protest votes to win representation. In other words, a party would require significant public support to gain seats in the House of Commons. Third, it is low enough that it would not present a significant barrier to new parties gaining representation. Finally, it is a moderate choice, as it is in the middle of the range of thresholds that are already in use. 48 There are two final points that must be made about thresholds. First, each type of threshold only applies to the second seats. The first seats are always decided by plurality, and, consequently, formal thresholds are not applicable to this stage of the seat assignment process. Second, in the rare case where no party eligible for second seats passes the district threshold in one or more districts, the second seats are assigned to the second place candidates. 6.5 THE RESERVE In order to allow all parties a fair opportunity to elect their top candidates, a small number of second seats can be set aside for assignment in a separate application of the DMP algorithm. These seats are collectively referred to as the reserve. The seats that remain are called the core allocation and are assigned first. It is during the core seat assignment process that parties will be able to elect their best candidates. A party's reserve allocation is determined by the reserve factor and is calculated as follows: 48 Thresholds appear to range from 0.67% to 5% (Law Commission of Canada 2004, 91; Seidle 1989, 255).
36 35 The reserve allocation is always rounded down. Therefore, a party that deserves 35 seats would have a reserve allocation of 3 seats if the reserve factor is 10%. In some cases, a party s reserve allocation will be greater than the number of second seats it deserves. When such a situation arises, the reserve allocation is taken to be the number of second seats the party deserves. For instance, if the party in the example given in the last paragraph only needed 2 second seats, its reserve allocation would be 2 rather than 3 seats. Once the reserve allocations are known, the core allocations can be found. Each party's core allocation is calculated in the following way: Each party's core allocation is assigned using the three steps outlined in Section 6.1. The seats in the reserve are assigned after the core allocations. These seats are assigned using steps 3.d to 3.f of the DMP algorithm, with the additional rule that core seats always beat reserve seats. For example, if Party A is assigned the second seat in District 1 during the core seat assignment process, Party B cannot win the second seat in District 1 during the reserve seat assignment process, even if Party B performed better in that district than Party A. The ideal reserve factor changes with region size. Since small parties usually don t have sufficient levels of support to be assigned seats during the reserve assignment process, the reserve factor must be small enough to prevent small parties from contributing a significant number of seats to the reserve. On the other hand, the reserve factor must be large enough to actually give every party a fair opportunity to elect their top candidates. Finally, the reserve factor must not be so large that it gives small parties an unfair advantage in electing their best candidates over large parties. The reserve factors given in Table B below were developed with these goals in mind.
37 36 Region size (in number of seats) Table B Recommended Reserve Factor 60 or more 10% % % % 6.6 ADDRESSING TIED VOTES With SMP, there is only one opportunity for a tie: two or more candidates can tie for first place in a district. To address this issue, section 318 of the Canada Elections Act requires that a by-election be held for the districts in which a tie for first place has occurred. 49 Not only is this a costly solution to the problem, it also has no democratic merit. Furthermore, it provides the voters in such a district with an unfair advantage over other voters. On election night, no one knows what the result of the election will be before the votes are counted. That the voters choice in a district with a tie for first place has been indecisive should not give them the privilege of knowing the election outcome in every other district before they choose their representative. Therefore, another solution to this problem must be devised. Democratic theory does not handle ties well. Consequently, there is no obvious solution to deal with this problem. The current solution is costly, time consuming, and unconvincing. Some electoral systems make the decision of how to deal with ties easier by restricting the choice of remedy. DMP is such a system. Even if one thought the current manner in which ties are dealt with was appropriate, it could not be used to address the issue when using DMP. This is evident if we consider the points at which DMP permits ties to occur. When DMP is used, ties can occur when: 49 Canada Elections Act: Part 5, last modified June 22, 2012,
38 37 1. Deciding candidate placements in the districts, which has two instances that can be of consequence: a. Deciding the winner of the first seat b. A conflicting seat assignment is addressed 2. Ordering the party lists 3. The remainder seats are allocated Holding a by-election could not address the ties that occur in points two and three. Whom would the by-election be held between for the second type of tie, and where would it be held? Would one completely redo the election to break the third type of tie? As these questions demonstrate, by-elections are completely nonsensical in these situations. The first type of tie would permit a by-election solution; however, since the result obtained when this tie is broken has the potential to affect the results in other districts, one would have to wait until the by-election was held in order to calculate the results of the election in every other district in the region. Not only would this likely be met with negative reaction from the public, in the case of tie 1.a, it may end up being of no consequence at all. Since it can be expected that more than 80% 50 of the seats will be assigned to the first and second place finishers, the two individuals that tied for first (it would be extremely unlikely to have a three, four, etc. way tie) would likely both win a seat in the district regardless of how the tie is broken. Finally, there is a more cost-effective and timely solution. For these reasons, by-elections are not recommended to break the first type of tie. To address all three types of ties, DMP chooses a winner by random draw. This may seem odd or illegitimate, but there really is no legitimate solution. The voters have chosen not to decide, and democracy only functions by having a decisive vote. When it fails to produce one, a 50 This result is presented in Section
39 38 decisive answer must be manufactured. Whether it is manufactured through a by-election or a random draw makes no difference. While this solution is admittedly as unconvincing from a democratic standpoint as holding a by-election, it would cost nothing and would consume no extra time. In order to ensure that DMP produces the same results every time it is applied to election data, part of the tie breaking procedure has been left out of the algorithm. Instead of randomly choosing a winner when a tie occurs, the algorithm assumes that the data has been randomized in two ways: 1. The order in which the parties appear on the ballot is randomly generated for each district The order in which the party labels appear in the list of parties contesting the election is randomly generated. To see how randomizing the election data in this way addresses the three types of ties listed above, it is useful to understand how the DMP algorithm is structured to break these ties. The three types of ties are addressed as follows: 1. The candidate closest to the top of the ballot wins. 2. The candidate that appears first in the election data file at the time of the comparison wins. Note, however, that there is no structural benefit given to candidates based on the order of the election data. Since the process of ordering the party lists can shift tied candidates positions before they are compared, it cannot be said that candidates closer to the top are in a better position than those at the bottom or vice versa. 51 Note that this does not require the ballots used by voters to have the same ordering. The order of the ballot being referred to here is only required for use in the application of the DMP algorithm. In order to prevent a systematic advantage to those closest to the top of the ballot, the order of the ballots used for voting should be changed frequently within each district.
40 39 3. The party closest to the top of the list of parties contesting the election wins. Finally, it is important to note that, despite the fact that there are more ways ties can occur with DMP than SMP, they would still be a rare event. Furthermore, many of them would be of no consequence. Except for tie 1.b, each of the ties is unlikely to affect an election outcome. The reason this is true for tie 1.a was explained earlier. For the second type of tie to affect the outcome, it would have to occur at the boundary of a party list. To make this clearer, consider the example discussed in Section Party B was able to elect the first two candidates on its party list. Had the candidates in districts one and four received the same percentage of their respective district s votes, it would not matter which candidate is chosen as the winner of the tie. Both would win their seats regardless of the outcome. However, if the tie were between the candidates in districts one and five, the loser of the random draw would possibly not win a seat. In this example, that is not the case. Party A performed better in District 5 than Party B, and, therefore, Party B s candidate in District 1 would win a seat even if they lost the random draw to the candidate in District 5. Similarly, the third type of tie would only be of consequence if two parties tied for the last remainder seat. If two parties tied for the second last remainder seat, both parties would be allocated a seat. 6.7 BY-ELECTIONS DMP uses regional voting results in combination with local results to determine election outcomes at a local level. In a by-election scenario, there may be one seat to be filled or several, with some districts requiring both of its two seats to be filled and some only one. These circumstances would not permit the application of DMP. As a result, it is recommended that plurality be used to decide the outcome of by-elections.
41 40 There are two reasons why this recommendation is not problematic. First, there would be no incentive to resign one s seat to hold a by-election. For example, consider a district where the Green Party won the second seat in third place and the Conservative Party won the first seat. The party that stands to gain from having a by-election in the district is the Conservative Party, but it has no control over whether the Green Party member resigns their seat. Moreover, the Green Party member would have a strong incentive to keep their seat, as they would know that their party would likely lose the by-election. Second, it is not much of a concern if the outcomes of by-elections are not proportional. In the 16 years between 1998 and 2013, there was an average of only 12 by-elections every four years, and the most districts that had a by-election at once was seven WHEN DMP FAILS TO PRODUCE PROPORTIONAL RESULTS CASE 1: ONE OR MORE PARTIES RUNS OUT OF QUALIFIED CANDIDATES DMP attempts to assign parties second seats where they performed the best. However, this cannot always be accomplished. Parties may need to be assigned some seats in areas of weak performance or where they didn t nominate enough candidates. When a party must be assigned a second seat in a district where it either did not pass the district threshold or does not have a candidate available to win the second seat, it will lose some of its deserved representation. 53 Any seats that cannot be assigned for this reason are redistributed between the eligible parties on a proportional basis. Specifically, these unassigned seats are distributed to the remaining eligible parties using steps.b and.c from Section 6., where total seats available is the number of unassigned 52 Past Elections, last modified June 17, 2013, 53 When this occurs, the party is labeled ineligible.
42 41 seats. The re-allocated seats are assigned using steps 3.d to 3.f from Section 6.1, with the additional rule that core and reserve seats always beat re-allocated seats. If more seats are unable to be assigned, then this process is repeated. Note that re-allocated seats from an earlier stage always beat re-allocated seats from a later stage CASE 2: ONE OR MORE PARTIES WINS A FRACTION OF THE FIRST SEATS GREATER THAN TWICE THEIR FRACTION OF THE ELIGIBLE VOTE In rare circumstances, one or more parties could win a large enough share of the first seats to cause DMP to fail to produce proportional results. Specifically, this failure would occur when at least one party secures a fraction of the first seats greater than twice its fraction of the eligible vote. 54 In such circumstances, one or more parties would be over-represented and the remaining parties under-represented. So that no one party is penalized more than another, DMP has been constructed to distribute the impact of parties that have been over represented proportionally across all other parties. For example, if party A obtains 40% of the vote but wins 100% of the first seats, it will have secured 50% of all of the seats before the second seats are assigned. As a result, there would be no way to assign the second seats to produce a proportional outcome. Party A would be over-represented by 10 percentage points, and the remaining parties would be collectively under represented by the same amount. If there were two other parties, B and C, that received 25% and 35% of the vote respectively, Party B would be entitled to of the 54 The eligible vote excludes votes cast for independents and parties that failed to pass the regional threshold.
43 42 seats and party C would be entitled to of the seats. 55 Therefore, each party would lose the same fraction of its deserved seat share, 17%. To prevent parties which have been over represented in this manner from gaining even more undeserved seats, they are labelled ineligible. This prevents these parties from winning seats in the re-allocation process discussed in Section Regarding DMP s inability to produce proportional results in these circumstances, there are two important points that should be noted. First, such a situation has never arisen at the federal level in Canada s history. 56 Therefore, it seems unlikely that such a failure would be experienced if DMP were implemented. Second, and most importantly, DMP guarantees that any party which receives less than or equal to 50% of the vote will be denied a majority government. 57 Therefore, DMP prevents the most harmful consequence of over representation. 55 To distribute the impact of party A s over representation proportionally across parties B and C, the total number of seats is taken to be 50% of the original, and the total number of votes is taken to be 60% of the original. The number of seats parties B and C deserve is then calculated using steps 1.b and 1.c from Section Canadian Election Results by Party: 867 to 2008 ; Electoral Results by Party. 57 There are two caveats to this statement. First, if votes are cast for parties or independents that fail to achieve their deserved representation, the other parties will receive more than their deserved representation, which could transform a minority of votes into a legislative majority. Note that a party would need to be very close to having 50% of the vote for this to happen. Second, it is possible to conceive of situations where a party that is over represented forms a coalition with one or more parties to form a majority government with a combined popular vote of less than 50%.
44 43 7 CONSTITUTIONAL ADHERENCE Sections 51(1) rule 2 and 51A of the Constitution outline minimum seat allocations for each province, and Section 51(2) states that each of the three territories is entitled to one seat. 58 As discussed earlier, these three sections present problems for most electoral systems. DMP, however, can meet the minimum seat allocation requirements mandated by the Constitution while still being applied at the supra-provincial level. Indeed, one of the motivations for the creation of DMP was to accomplish this goal. By meeting this objective, DMP is able to respect the principle of OPOV and achieve high quality proportionality at the federal level. In order for DMP to be implemented, minor constitutional change would be required. The use of two-member districts would make it necessary for each province and territory to be allocated an even number of seats. To ensure that the provinces and territories each receive an even number of seats, Section 51(1) rules 1 and 6.b would need to be amended so that fractional remainders are rounded up to the nearest even integer. 59 In addition, Section 51(2) would need to assign two seats to each territory instead of one. 60 Since neither of these changes breaks with the principle of proportionate representation, the Parliament of Canada should be able to unilaterally make the adjustments. 61 These changes would result in Ontario, Nova Scotia, Newfoundland and Labrador, and the three territories receiving one extra seat based on the new seat allocation calculated on December 16, It is important to note that this is not an entirely new suggestion in the electoral reform debate. For example, the Law Commission of Canada has recommended adding a seat to each territory to implement MMP Constitution Act, Constitution Act, Ibid. 61 Constitution Act, 82, last modified August 30, 2013, 16.html#docCont. See sections 42.1.a and House of Commons Seat Allocation by Province. 63 Law Commission of Canada, Voting Counts, 104.
45 44 8 GERRYMANDERING Although gerrymandering is still possible with DMP, it is made prohibitively difficult. Moreover, even if it were to be achieved, it would be almost entirely inconsequential. Both of these properties are a result of the 50% reduction in the number of seats assigned by plurality and the overall proportional allocation of seats. Let s look at this issue in more concrete terms. First, gerrymandering could not increase the seat count of a party that acquires 50% or more of the popular vote because only seats assigned by plurality can be won through gerrymandering. Furthermore, a party with less than 50% of the popular vote that successfully gerrymanders 64 would be unable to secure a majority of seats, making the few seats that they would gain over what they deserve of no more consequence than to deny all other parties a small fraction of their deserved representation. This small gain in seat count for a party that successfully gerrymanders could come about only after overt and widespread manipulation of electoral boundaries. This is again due to the reduction of seats assigned using plurality to 50% of the total. Consider a party, P, that anticipates receiving 35% of the popular vote in the next election, is part of a coalition government that does not mind participating in gerrymandering that will only serve to help Party P and harm the others, and that will not be punished by the electorate for gerrymandering. In order for Party P to successfully gerrymander, it must secure 70% + 1 of the first seats. If this is not yet convincing that gerrymandering with DMP is an extraordinarily difficult task, then consider that in Canada s entire history, despite the many bizarre and unfair election results our plurality system has produced, it has never given a party a percentage of seats greater than, nor equal to, double its percentage of the vote Gerrymandering is being considered successful when a party is able to secure more seats than it deserves. 65 Canadian Election Results by Party: 867 to 2008 ; Electoral Results by Party.
46 45 9 TESTING DMP IN MATLAB 9.1 INTRODUCTION This section demonstrates the efficacy of DMP by presenting simulations of the federal elections that occurred between 2006 and For these simulations, it was assumed that each one-member district was actually a two-member district. However, if DMP is implemented in Canada, the number of districts would likely be reduced by approximately half. Thus, the election results presented in this report cannot be taken as the results that would have been produced had DMP been in use at the time of the elections. There are two primary reasons for this. First, changing the district boundaries would affect where parties win their seats. Second, reducing the number of seats by half would affect the formula s ability to achieve proportional results. Although these factors are important to mention, neither would meaningfully affect the properties of the results that will be discussed. It should also be noted that there is much that has not been included in this report. The MATLAB files that execute the DMP formula and many of the results that they produce, such as the province-by-province results and the district-by-district results, do not appear in their entirety or at all in this report. Some of this material is available at DMPForCanada.wordpress.com. For further information, please contact the author. 9.2 SIMULATIONS OF PAST FEDERAL ELECTIONS USING DMP OVERVIEW OF RESULTS Appendices C through F display simulations for the federal elections of 2006, 2008, 2011, and These simulations were produced by dividing Canada into four regions: Atlantic Canada, Ontario, Quebec, and Western Canada. Atlantic Canada is comprised of Newfoundland
47 46 and Labrador, PEI, Nova Scotia, and New Brunswick, whereas Western Canada groups together the three territories, BC, Alberta, Saskatchewan, and Manitoba. Finally, the simulations use a reserve factor of 10% and a districts threshold of 5%. Each appendix is split into two parts. Part 1 contains an overview of the regional results. Part 2 contains a summary of the nationwide results. The charts in the first section of each appendix, along with the first chart in the second section, display the distribution of the popular vote between the major parties, 66 the distribution of the seats under DMP, and the distribution of the seats under the current system. The second chart in the second part of each appendix shows the rank of the candidates that won seats. For example, 8% for third place means that 8% of the seats were filled by candidates that placed third in their district. The third and fourth charts in the second part of each appendix display the manner in which the parties seats are distributed across the country. With these results, four important observations can be made: 1. In each election, DMP produced high quality proportionality at both the regional and federal levels. 2. The correction factor ranged from 13% to 18% % to 82% of the districts were represented by two different parties in each simulation The district representation factor ranged from 1.78 to Major party has been defined to be any party that receives 3% or more of the popular vote. 67 Districts represented by a party and an independent, in addition to districts represented by two independents, are considered to be represented by two different parties. 68 For an explanation of how to calculate the district representation factor, see Appendix G.
48 REGIONAL REPRESENTATION As was mentioned in Section 5.1, SMP tends to mask the diversity of party support by producing homogenous party representation in many regions of Canada. The election of 2015 is a case in point. Despite over 40% of the vote going to other parties, the Liberal Party won every seat in Atlantic Canada. As this section will demonstrate, DMP would correct this failing of SMP. To begin with, DMP would reduce the regional fractionalization that is routinely manufactured by SMP when concentrations of support occur. Since DMP is a proportional system, concentrated support will not be given an advantage over support that is evenly spread out. This would eliminate the current incentive to participate in regionally inflammatory rhetoric to generate concentrations of support. Additionally, since regional parties have relied on the distorting effects of SMP for their success and would not experience such inflated representation with DMP, the implementation of DMP would significantly diminish the strength and relevance of regional parties. A related issue is the scope of party representation across the country. That the district representation factor ranged from 1.78 to 1.82 in the elections examined is highly significant. This means that each party would have been represented in nearly twice as many districts as it was in our single-member district system, which supports the idea that parties would have more regionally diverse caucuses under DMP. More importantly, however, DMP would greatly increase the diversity within government and opposition caucuses. Table C below demonstrates the breadth of representation governments and oppositions could have with DMP. For each election, a left-centre and rightcentre coalition comprised of the minimum number of parties to form a majority government was
49 48 examined. These coalition governments would have been represented in 80-91% of the districts, with an average district representation of 86%. Impressively, all but one of the oppositions to these coalition governments would have been represented in a majority of districts. They would have ranged from 45-81% district representation, with an average district representation of 65%. To put this in other terms, Canadians would have had an 86% chance of being represented by a member of the governing coalition and a 65% chance of being represented by a member of the opposition, on average, during the period between 2006 and The best result that has been realized in Canada at the federal level in terms of district representation for a government occurred in 1958 when the Progressive Conservatives won 78.5% of the seats and were, therefore, represented in the same fraction of the districts. 69 Since each district only has one member in an SMP system, it is impossible for a party to be represented in a larger fraction of the districts than its fraction of seats in the House of Commons. Therefore, the opposition had to be represented in exactly 21.5% of the districts. In contrast, the average district representation for the eight coalition governments examined in this section is seven and a half percentage points higher than the best result that has ever been achieved with SMP at the federal level. Moreover, the average district representation for the oppositions is well over 50%, which is an impossible result under the current system. 69 Canadian Election Results by Party: 867 to 2008 ; Electoral Results by Party.
50 49 Year of Federal Election Table C Government/Opposition Percent of Percent of Seats Districts Government A: Liberal, NDP, Green 52% 80% Opposition A 48% 76% Government B: Liberal, Conservative 68% 90% Opposition B 32% 54% Government A: Liberal, NDP, Green 51% 82% Opposition A 49% 80% Government B: Liberal, Conservative 65% 87% Opposition B 35% 57% Government A: Liberal, NDP, Green 53% 87% Opposition A 47% 81% Government B: Liberal, Conservative 60% 81% Opposition B 40% 61% Government A: Liberal, NDP 61% 90% Opposition A 39% 68% Government B: Liberal, Conservative 73% 91% Opposition B 27% 45%
51 50 10 THE CORRECTION FACTOR AS A STRENGTH OF DMP As noted in Section 9.2.1, the correction factor ranged from 13% to 18% for the four federal elections examined in this report. Aside from the fact that this is a small fraction of the seats, it must be remembered that it is the 13-18% of the seats that were assigned differently than they would be under TMP that produced the proportionate results. Therefore, although a candidate may win a seat despite placing fifth in their district, they deserve to win based on the regional support for their party. What is surprising about DMP is not that these seats exist but that their number is so small DMP is able to correct the distortions produced by plurality with a very small correction factor. Since DMP is a proportional system, parties would have an incentive to campaign in areas where they do not expect to win. However, since parties could win a seat in a district where they do not expect to do well (that is, place first or second), there would also be an incentive to run quality candidates in every district. As a result, the practice of nominating ballot fillers in districts where a party performs poorly would likely be less common, if not ended entirely. This would raise the quality of electoral competition, since strong performing incumbents would be up against quality candidates from the other parties. At first glance, this may seem like it would make a small party s work more difficult. Under the current system, small parties can focus on nominating quality candidates in the few districts where they perform well. However, if DMP is implemented, there would be fewer districts likely 172 instead of Furthermore, small parties, such as the Green Party, that have not done well enough to win both seats in many districts would only need to focus on 70 As noted in Section 7, six extra seats would be required to implement DMP. Therefore, there would be 344 seats in the House of Commons instead of 338.
52 51 nominating one quality candidate in most districts. 71 As a result, small parties would only need to nominate approximately half as many candidates as they would with SMP to contest every district. Finally, the correction factor would not negatively affect voters ability to hold candidates accountable. If a candidate were to win a second seat in 5 th place, it would be very unlikely that the results of the next election would align in such a way to elect the candidate in 5 th place again. Therefore, a candidate elected in such a position would have until the next election to prove to the voters of the district that they were worthy of election. 71 The only districts where two quality candidates should be nominated are those where a party has a chance of winning the first seat.
53 52 11 CHALLENGING ACCEPTED LIMITATIONS OF ELECTORAL SYSTEMS: WHY DMP COULD BRIDGE THE GAP IN THE ELECTORAL REFORM DEBATE The unique property of DMP is the mechanism used to decide the winners of the second seats. Using the regional voting results to determine the number of seats each party deserves and the individual district results to decide where each party will win its seats breaks sharply with the accepted structures of electoral systems. It is explicitly 72 or tacitly 73 accepted by most actively involved in the electoral reform debate that the following are mutually exclusive: small districts and proportional results. If one wants to achieve proportional results, reformers often present two general options: 1. Create large multi-member districts where the winners are decided solely by the votes cast within the district. 2. Retain single-member districts, but achieve proportional results by adding a second tier of representatives that will be elected based on a regional vote. To implement option two, one must decide whether to increase the size of the legislative body or decrease the number of single-member districts. This option does not break with the mutually exclusive relationship noted above because it achieves proportionality by superimposing large multi-member districts over smaller single-member districts. This leads Rae to present the following dilemma: Suppose that the reformer seeks to optimize three values: (1) the compactness of electoral districts, (2) the smallness of the legislature elected from these districts, and (3) the proportionality of the election outcomes. Increasing district magnitudes will force the reformer to sacrifice one of his first two values, because he must either (a) make the districts less compact to include more seats, or (b) leave the district compact, but add seats, thereby making the elected legislature a larger body Rae, The Political Consequences of Electoral Laws. 73 Law Commission of Canada, Voting Counts; Pilon, The Politics of Voting. 74 Rae, The Political Consequences of Electoral Laws, 119.
54 53 This issue has plagued much of the reform debate. Those advocating for reform often disagree on the values that should be retained and those that can be compromised if necessary. This disagreement can be seen between those that support STV, who sacrifice single-member districts for semi-proportional results, and those that support MMP, who sacrifice either the small size of the legislative body or the number and small size of the single-member districts. DMP implements an algorithm for allocating seats that allows all of the values presented by Rae to be satisfied. It allows the size of the assembly to remain small, produces results that are generally as proportionate as mathematically possible, and maintains an exceptionally high degree of district compactness. The ability of DMP to adhere to these basic values and those outlined in Section 4 could allow the system to unite the supporters of STV and MMP.
55 54 12 CONCLUSION After nearly a decade of dormancy, the electoral system reform debate is resurging. In the last year, both the federal and PEI governments have made significant electoral system reform commitments. The federal Liberals came to power on the promise that the next election would be determined by a new electoral system, and PEI will be holding a plebiscite on changing its system in the fall of Yet, the same solutions and arguments that failed to achieve reform a decade ago are being dusted off and held up as the most likely path to success. This report has argued for a new approach in the hope of avoiding a repeat of history. At the heart of this new way forward is Dual-member Mixed Proportional. Unlike the leading alternatives to SMP, DMP can meet the criteria detailed in Section 4 with only minor exceptions. Indeed, it would leave the current level of local representation almost completely intact while achieving proportional results with nearly flawless accuracy. The evidence presented in Section 9 shows that DMP can produce these high quality results with a minimal correction to plurality voting. Additionally, the evidence suggests that DMP would do a great deal to address the regional fractionalization frequently seen in Canada by substantially increasing the district representation of governments and oppositions. Perhaps most importantly, these benefits would be realized with minimal changes to the current system. Whereas STV and MMP require a complete overhaul of Canada s electoral system, DMP retains much of the current ballot and district designs. From the voters perspective then, DMP would be a means to ensuring every voter s first choice is reflected in election outcomes that doesn t require a complete upending of the status quo.
56 55 AFTERWORD Months after developing DMP, I came across a recently developed and sparsely discussed electoral system called Fair Majority Voting. The main algorithm used by this formula is similar to the algorithm I developed to assign the second seats in DMP. 75 The main difference between the two systems is that DMP makes use of two-member districts, whereas Fair Majority Voting uses single-member districts. 76 This has been brought to the reader s attention for the sake of full transparency. 75 Michel Balinski, Fair Majority Voting (or How to Eliminate Gerrymandering), The Mathematical Association of America 115 (February 2008): , 76 Ibid., 99.
57 56 APPENDIX A: CALCULATING THE MAXIMUM POTENTIAL FOR WASTED VOTES WITH PROPORTIONAL FORMULAE The upper limit to the fraction of votes that can be wasted, W M, represents the maximum fraction of the votes that cannot count to the election of any representatives. It is important to realize that this quantity does not tell us the fraction of votes that will be wasted but, rather, the highest fraction of votes that could be wasted. This quantity is the smallest when a proportional formula is used. The purpose of this appendix is to derive the formulae required to calculate W M. For this derivation, p will be used to denote the number of parties and s the number of seats. Furthermore, the specific case when s is 5 will be used to develop the formulae for the general case. Two separate cases will need to be considered. The first case will deal with situations where the number of parties is less than twice the number of seats. In order to derive the formulae for this case, two sub-cases will need to be examined: when the number of parties is even and when the number of parties is odd. The second case will handle when the number of parties is greater than twice the number of seats. Two assumptions will be made in developing these formulae. First, it will be assumed that no votes are cast for independents. Since independents do not usually perform well in Canada, the effect of this omission should not be significant. Second, it will be assumed that a completely proportional electoral formula is being used. 77 Finally, note that votes are only wasted when a party does not gain representation from its fractional remainder. For example, if a party deserves 3.4 of 5 seats but only receives 3, the votes that contributed to the 0.4 remainder would be wasted. The fraction of the votes that this 77 This implies that no formal threshold exists and that there is effectively only one region used to allocate seats on a proportional basis. To apply the formulae derived in this appendix to electoral formulae that allocate seats on a proportional basis in multiple regions, calculate W M for each region and combine them using a weighted average.
58 57 represents can be calculated in the following way: fractional remainder total n m er of seats However, if this party had received 4 seats instead of 3, none of the votes cast for the party would have been wasted. A.1 THE NUMBER OF PARTIES IS LESS THAN TWICE THE NUMBER OF SEATS A.1.1 THE NUMBER OF PARTIES IS EVEN To begin, take p to be 2. The most votes will be wasted when each party has a remainder of exactly half a seat (e.g., one party deserves 1.5 seats and the other 3.5). In order to assign all of the seats, one party will have to be over represented by half a seat and the other under represented by half a seat. The party that is under represented will be the source of the wasted votes. Therefore, in this case, of the votes will be wasted. When p is 4, the same strategy will waste the most votes. Each party having a remainder of half a seat (e.g., three parties deserve 1.5 seats, and one party deserves 0.5) will waste 5 20 of the votes. Similarly, when p is 6, 30% of the votes will be wasted with this strategy. This strategy can be summarized as follows: 1. Divide the number of parties by Multiply by 1/2. 3. Divide by the number of seats. This produces the following formula:
59 58 A.1.2 THE NUMBER OF PARTIES IS ODD The case where p is 1 will not be considered since it will be impossible to waste any of the votes. Therefore, the case where p equals 3 will be the starting point. To waste the most votes, the remainders for the parties need to be made as equal to each other and as close to 1/2 as possible. With three parties, this can be done in two ways: assign each party a fractional remainder of 1/3 or 2/3. Both options produce the same result. For the sake of consistency with what is to follow, I will choose the first option. Since only one remainder seat needs to be assigned with this option, two parties will gain no representation from their remainders. As a result, of the votes will be wasted. When p is 5, the most votes will be wasted when each party has a fractional remainder of 2/5. This will result in three parties receiving no representation from their remainders, which will waste of the votes. Similarly, when p is 7, of the votes will be wasted. This strategy can be summarized as follows: 1. Determine the fractional remainder of each party: a. Subtract 1 from the total number of parties. b. Divide by 2. c. Divide by the total number of parties. 2. Multiply the result from 1 by the number of parties plus one. 3. Divide by Divide by the total number of seats. In formulaic form, this becomes:
60 59 A.2 THE NUMBER OF PARTIES IS GREATER THAN TWICE THE NUMBER OF SEATS Once the number of parties exceeds twice the number of seats, the strategies applied in Section A.1 will no longer work. The reason is that, in these situations, there are not enough seats to create the seat distributions made earlier. One can also determine that the above formulae will not hold for all p greater than one by observing that in the limit that p approaches infinity, both formulae also approach infinity. Since it is impossible for W M to be greater than unity, these formulae do not hold for sufficiently large p. Therefore, one test for the formula that will be derived in this section is that it approach one as p approaches infinity. To maximize the number of wasted votes, we again want to make the fractional remainders of the parties equal to one another and as close to 1/2 as possible. When the number of parties is greater than twice the number of seats, this is easy to achieve. First, divide the number of seats by the number of parties to determine the fraction of a seat each party will deserve. Then, multiply this fraction by the number of parties minus the number of seats (this is the number of parties that will not receive representation). Finally, to determine the fraction of the votes that this represents, divide by the number of seats. Here is this process in formulaic form: It can be easily observed that in the limit where p approaches infinity, W M approaches 1 as required.
61 60 APPENDIX B: BALLOT DESIGN Sample DMP Ballot: Option A Red Party 1. Candidate A 2. Candidate B Blue Party 1. Candidate A 2. Candidate B Green Party 1. Candidate A 2. Candidate B Independent Candidate
62 61 Sample DMP Ballot: Option B Red Party 1. Candidate A 2. Candidate B Blue Party 1. Candidate A 2. Candidate B Green Party 1. Candidate A 2. Candidate B Independent Candidate

63 62 C.1 REGIONAL RESULTS APPENDIX C: 2006 FEDERAL ELECTION th General Election Poll-by-Poll Results Raw Data, Table 2, last modified August 2, 20 0, The charts in this appendix have been produced by running the raw election data in Table 12 through a collection of MATLAB files.
64 63
65 C.2 FEDERAL RESULTS 64
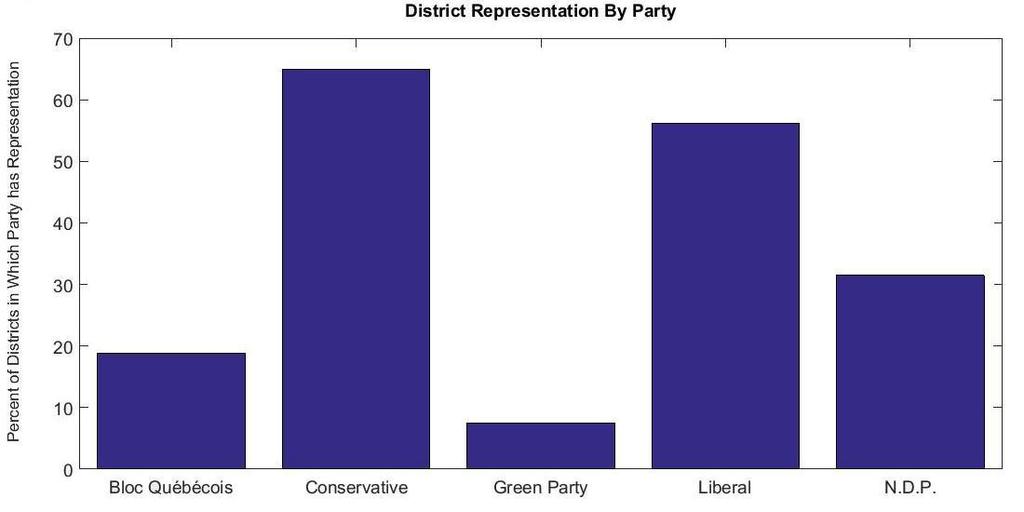
66 65
67 66 D.1 REGIONAL RESULTS APPENDIX D: 2008 FEDERAL ELECTION th General Election Poll-by-Poll Results Raw Data, Table 12, last modified August 24, 2010, The charts in this appendix have been produced by running the raw election data in Table 12 through a collection of MATLAB files.
68 67

69 D.2 FEDERAL RESULTS 68
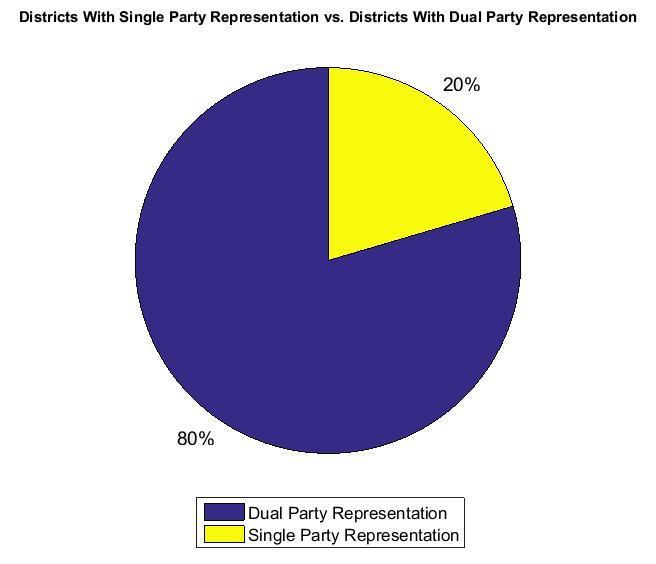
70 69
71 70 E.1 REGIONAL RESULTS APPENDIX E: 2011 FEDERAL ELECTION st General Election Poll-by-Poll Results Raw Data, Table 2, last modified January 0, 20 3, The charts in this appendix have been produced by running the raw election data in Table 12 through a collection of MATLAB files.
72 71
73 E.2 FEDERAL RESULTS 72
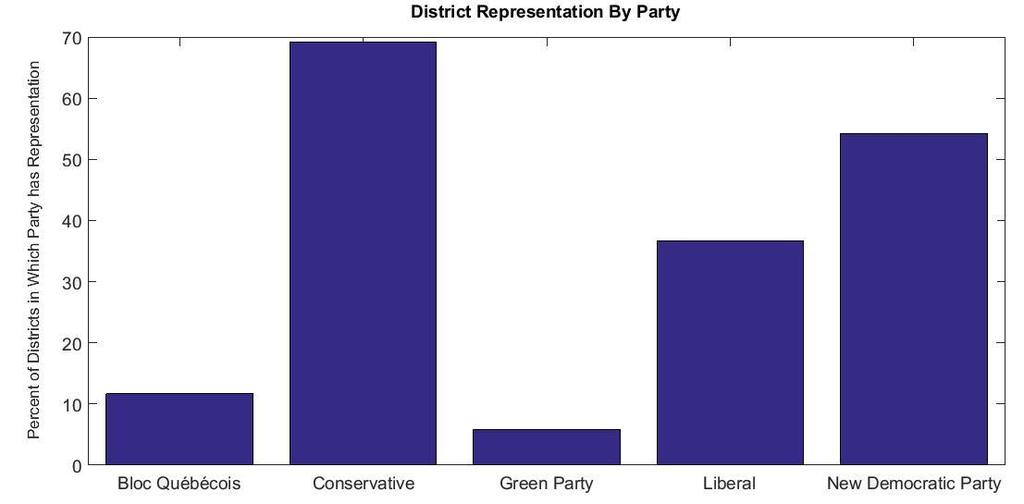
74 73
75 74 F.1 REGIONAL RESULTS APPENDIX F: 2015 FEDERAL ELECTION nd General Election: Poll-by-Poll Results (raw data), Table 2, last modified February 2, 20 3, The charts in this appendix have been produced by running the raw election data in Table 12 through a collection of MATLAB files.
76 75
77 F.2 FEDERAL RESULTS 76
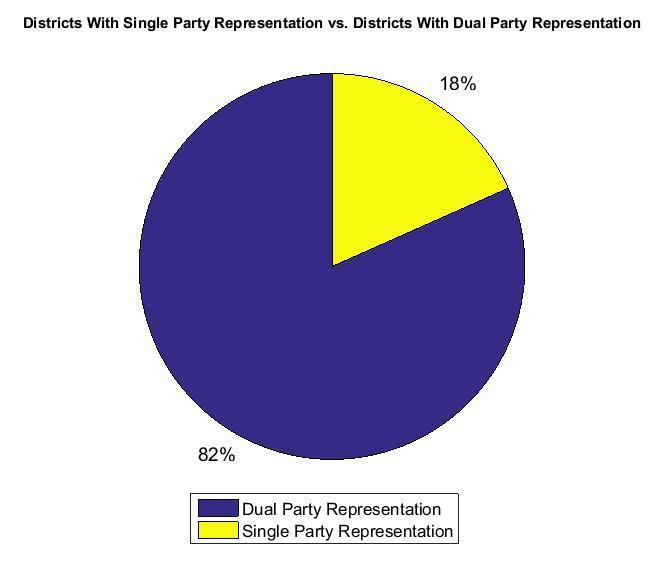
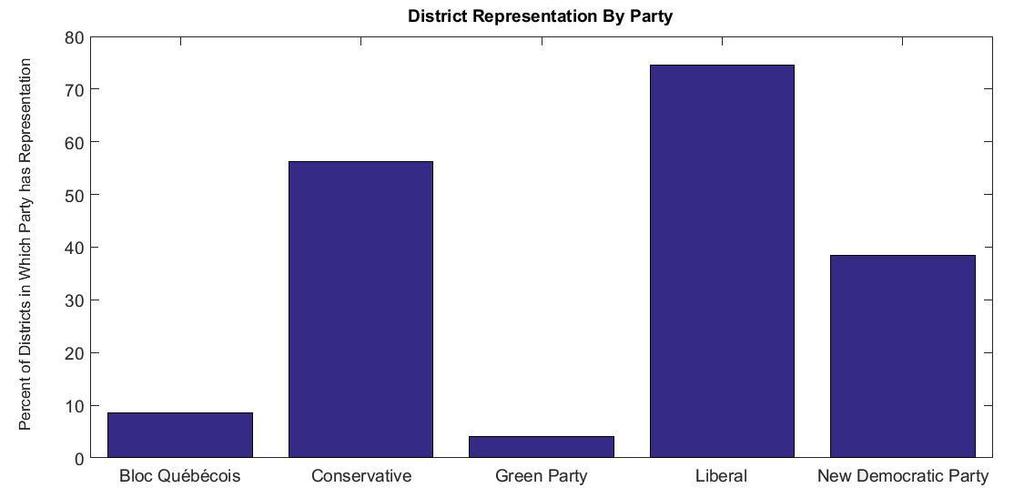
78 77
REFORMING THE ELECTORAL SYSTEM IN ALBERTA: THE CASE FOR DUAL- MEMBER MIXED PROPORTIONAL Sean Graham
 1 REFORMING THE ELECTORAL SYSTEM IN ALBERTA: THE CASE FOR DUAL- MEMBER MIXED PROPORTIONAL Sean Graham The Ethics and Accountability Committee has, among other tasks, been ordered to review the Election
REFORMING THE ELECTORAL FORMULA IN PEI: THE CASE FOR DUAL-MEMBER MIXED PROPORTIONAL Sean Graham
 1 REFORMING THE ELECTORAL FORMULA IN PEI: THE CASE FOR DUAL-MEMBER MIXED PROPORTIONAL Sean Graham As a strong advocate for improving the democratic integrity of voting systems, I am very excited that PEI
HOW DUAL MEMBER PROPORTIONAL COULD WORK IN BRITISH COLUMBIA Sean Graham February 1, 2018
 HOW DUAL MEMBER PROPORTIONAL COULD WORK IN BRITISH COLUMBIA Sean Graham smg1@ualberta.ca February 1, 2018 1 1 INTRODUCTION Dual Member Proportional (DMP) is a compelling alternative to the Single Member
The Case for Electoral Reform: A Mixed Member Proportional System for Canada. Brief by Stephen Phillips, Ph.D.
 1 The Case for Electoral Reform: A Mixed Member Proportional System for Canada Brief by Stephen Phillips, Ph.D. Instructor, Department of Political Science, Langara College Vancouver, BC 6 October 2016
Electoral Reform: Key Federal Policy Recommendations. Researched and written by CFUW National Office & CFUW Leaside East York and Etobicoke JULY 2016
 Electoral Reform: Key Federal Policy Recommendations Researched and written by CFUW National Office & CFUW Leaside East York and Etobicoke JULY 2016 Page 1 About CFUW CFUW is a non-partisan, voluntary,
Electoral Reform Brief
 2016 Electoral Reform Brief Ron Campbell csm.ron30@yahoo.ca 7/1/2016 Summary We need to look at the cause of the problems that our current system has, in order to know what needs modifying. If we do not
Electoral Reform: Making Every Vote Count Equally
 Osgoode Hall Law School of York University From the SelectedWorks of Craig M. Scott September 17, 2016 Electoral Reform: Making Every Vote Count Equally Craig M. Scott Available at: https://works.bepress.com/craig_scott/88/
BCGEU surveyed its own members on electoral reform. They reported widespread disaffection with the current provincial electoral system.
 BCGEU SUBMISSION ON THE ELECTORAL REFORM REFERENDUM OF 2018 February, 2018 The BCGEU applauds our government s commitment to allowing British Columbians a direct say in how they vote. As one of the largest
CAN FAIR VOTING SYSTEMS REALLY MAKE A DIFFERENCE?
 CAN FAIR VOTING SYSTEMS REALLY MAKE A DIFFERENCE? Facts and figures from Arend Lijphart s landmark study: Patterns of Democracy: Government Forms and Performance in Thirty-Six Countries Prepared by: Fair
ON A SINGLE-BALLOT MIXED MEMBER PROPORTIONAL (SBMMP) ELECTORAL SYSTEM
 ELECTORAL SYSTEM") ON A SINGLE-BALLOT MIXED MEMBER PROPORTIONAL (SBMMP) ELECTORAL SYSTEM 7 October 2016 SUMMARY Seeing governments win a majority of seats in the House of Commons with only about 40% of the national popular
ON A SINGLE-BALLOT MIXED MEMBER PROPORTIONAL (SBMMP) ELECTORAL SYSTEM 7 October 2016 SUMMARY Seeing governments win a majority of seats in the House of Commons with only about 40% of the national popular
Proportional Representation for BC: A Necessary Reform and Long Overdue
 Proportional Representation for BC: A Necessary Reform and Long Overdue Brief to the BC Government s Consultations on Electoral Reform by Stephen Phillips, Ph.D. Instructor, Department of Political Science
Electoral Reform Proposal
 Electoral Reform Proposal By Daniel Grice, JD, U of Manitoba 2013. Co-Author of Establishing a Legal Framework for E-voting 1, with Dr. Bryan Schwartz of the University of Manitoba and published by Elections
ONTARIO SUPERIOR COURT OF JUSTICE. JOAN RUSSOW and THE GREEN PARTY OF CANADA. - and -
 ONTARIO SUPERIOR COURT OF JUSTICE File No.: B E T W E E N: JOAN RUSSOW and THE GREEN PARTY OF CANADA Applicants - and - THE ATTORNEY GENERAL OF CANADA, THE CHIEF ELECTORAL OFFICER OF CANADA and HER MAJESTY
State Study of Election Methods: A Continuation
 State Study of Election Methods: A Continuation A Summary of Graphics Used in the Committee s Presentations April 2002 THE League of Women Voters of Seattle EDUCATION FUND LWVWA Election Methods Committee
Fair Division in Theory and Practice
 Fair Division in Theory and Practice Ron Cytron (Computer Science) Maggie Penn (Political Science) Lecture 4: The List Systems of Proportional Representation 1 Saari s milk, wine, beer example Thirteen
THE SOUTH AUSTRALIAN LEGISLATIVE COUNCIL: POSSIBLE CHANGES TO ITS ELECTORAL SYSTEM
 PARLIAMENTARY LIBRARY OF SOUTH AUSTRALIA THE SOUTH AUSTRALIAN LEGISLATIVE COUNCIL: POSSIBLE CHANGES TO ITS ELECTORAL SYSTEM BY JENNI NEWTON-FARRELLY INFORMATION PAPER 17 2000, Parliamentary Library of
2010 Municipal Elections in Lebanon
 INTERNATIONAL FOUNDATION FOR ELECTORAL SYSTEMS 2010 Municipal Elections in Lebanon Electoral Systems Options Municipal elections in Lebanon are scheduled for Spring/Summer 2010. The current electoral system
Plurality-Majority Electoral Systems: A Review. John C. Courtney Department of Political Studies University of Saskatchewan
 Plurality-Majority Electoral Systems: A Review John C. Courtney Department of Political Studies University of Saskatchewan Presented to the Advisory Committee of Registered Political Parties Elections
Partisan Advantage and Competitiveness in Illinois Redistricting
 Partisan Advantage and Competitiveness in Illinois Redistricting An Updated and Expanded Look By: Cynthia Canary & Kent Redfield June 2015 Using data from the 2014 legislative elections and digging deeper
Fair Voting BC s Submission on BC s Electoral Reform Referendum
 February 28, 2018 Fair Voting BC s Submission on BC s Electoral Reform Referendum Who We Are Fair Voting BC (FVBC) is a registered BC non-profit society that is committed to the principle of the fundamental
If a party s share of the overall party vote entitles it to five seats, but it wins six electorates, the sixth seat is called an overhang seat.
 OVERHANGS How an overhang occurs Under MMP, a party is entitled to a number of seats based on its shares of the total nationwide party vote. If a party is entitled to 10 seats, but wins only seven electorates,
Random tie-breaking in STV
 Random tie-breaking in STV Jonathan Lundell jlundell@pobox.com often broken randomly as well, by coin toss, drawing straws, or drawing a high card.) 1 Introduction The resolution of ties in STV elections
Elections and Electoral Systems
 Elections and Electoral Systems Democracies are sometimes classified in terms of their electoral system. An electoral system is a set of laws that regulate electoral competition between candidates or parties
The MAP (Majority and Proportional) Voting System
 Voting System") The MAP Voting System page 1 Overview The Duncan family proposes a made in Canada voting system that combines the advantages of our traditional majoritarian FPTP (First Past The Post) system, with a proportional
The MAP Voting System page 1 Overview The Duncan family proposes a made in Canada voting system that combines the advantages of our traditional majoritarian FPTP (First Past The Post) system, with a proportional
Guide to Ireland s PR-STV Electoral System
 Guide to Ireland s PR-STV Electoral System 1. Overview Voting at Presidential, Dáil, Seanad, European and local elections is by secret ballot on the principle of proportional representation in multi-seat
Electoral Reform Questionnaire Field Dates: October 12-18, 2016
 1 Electoral Reform Questionnaire Field Dates: October 12-18, 2016 Note: The questions below were part of a more extensive survey. 1. A [ALTERNATE WITH B HALF-SAMPLE EACH] All things considered, would you
Modernizing Canada s Electoral System: Instant Runoff Voting as the Best Alternative. By Maxime Dubé, as an individual
 Modernizing Canada s Electoral System: Instant Runoff Voting as the Best Alternative Summary By Maxime Dubé, as an individual In the context of electoral reform brought about by the current government,
Preferential votes and minority representation in open list proportional representation systems
 Soc Choice Welf (018) 50:81 303 https://doi.org/10.1007/s00355-017-1084- ORIGINAL PAPER Preferential votes and minority representation in open list proportional representation systems Margherita Negri
Federal Primary Election Runoffs and Voter Turnout Decline,
 Federal Primary Election Runoffs and Voter Turnout Decline, 1994-2010 July 2011 By: Katherine Sicienski, William Hix, and Rob Richie Summary of Facts and Findings Near-Universal Decline in Turnout: Of
ELECTING CANDIDATES WITH FAIR REPRESENTATION VOTING: RANKED CHOICE VOTING AND OTHER METHODS
 November 2013 ELECTING CANDIDATES WITH FAIR REPRESENTATION VOTING: RANKED CHOICE VOTING AND OTHER METHODS A voting system translates peoples' votes into seats. Because the same votes in different systems
Public Justice in Representation. A CPJ Position Paper on Electoral Reform and Representation
 Public Justice in Representation A CPJ Position Paper on Electoral Reform and Representation Approved by the Board of Directors: April 16, 2009 Our Vision CPJ is committed to seek human flourishing and
HOW WE VOTE Electoral Reform Referendum. Report and Recommendations of the Attorney General
 HOW WE VOTE 2018 Electoral Reform Referendum Report and Recommendations of the Attorney General May 30, 2018 Contents Executive Summary and Recommendations... 1 Introduction... 8 How We Vote Public Engagement
Canadian electoral reform involves a befuddling
 Feature RAMPing up Parliament An Alternative to Electoral Reform Electoral reform is a complicated proposition, yet the current first-past-the-post (or single member plurality) system has been criticised
STRENGTHENING OUR DEMOCRACY. Public Interest Alberta Democracy Task Force Submission to Alberta s Select Special Ethics and Accountability Committee
 STRENGTHENING OUR DEMOCRACY Public Interest Alberta Democracy Task Force Submission to Alberta s Select Special Ethics and Accountability Committee February 2016 A. INTRODUCTION Public Interest Alberta
A New Method of the Single Transferable Vote and its Axiomatic Justification
 A New Method of the Single Transferable Vote and its Axiomatic Justification Fuad Aleskerov ab Alexander Karpov a a National Research University Higher School of Economics 20 Myasnitskaya str., 101000
Women s. Political Representation & Electoral Systems. Key Recommendations. Federal Context. September 2016
 Women s Political Representation & Electoral Systems September 2016 Federal Context Parity has been achieved in federal cabinet, but women remain under-represented in Parliament. Canada ranks 62nd Internationally
DHSLCalc.xls What is it? How does it work? Describe in detail what I need to do
 DHSLCalc.xls What is it? It s an Excel file that enables you to calculate easily how seats would be allocated to parties, given the distribution of votes among them, according to two common seat allocation
What to Do about Turnout Bias in American Elections? A Response to Wink and Weber
 What to Do about Turnout Bias in American Elections? A Response to Wink and Weber Thomas L. Brunell At the end of the 2006 term, the U.S. Supreme Court handed down its decision with respect to the Texas
Recommendations on Election Reform in British Columbia
 BC Symposium on Proportional Representation Recommendations on Election Reform in British Columbia February 28, 2018 Symposium organizers: Mira Bernstein (mira.bernstein@tufts.edu) Jameson Quinn (jameson@electology.org)
ONTARIO SUPERIOR COURT OF JUSTICE. JOAN RUSSOW and THE GREEN PARTY OF CANADA. - and -
 ONTARIO SUPERIOR COURT OF JUSTICE Court File No.: B E T W E E N: JOAN RUSSOW and THE GREEN PARTY OF CANADA Applicants - and - ATTORNEY GENERAL OF CANADA, THE CHIEF ELECTORAL OFFICER OF CANADA and HER MAJESTY
4 However, devolution would have better served the people of Wales if a better voting system had been used. At present:
 Electoral Reform Society Wales Evidence to All Wales Convention SUMMARY 1 Electoral Reform Society Wales will support any moves that will increase democratic participation and accountability. Regardless
THRESHOLDS. Underlying principles. What submitters on the party vote threshold said
 THRESHOLDS Underlying principles A threshold is the minimum level of support a party needs to gain representation. Thresholds are intended to provide for effective government and ensure that every party
Commission on Parliamentary Reform
 Consultation response from Dr James Gilmour 1. The voting system used to elected members to the Scottish Parliament should be changed. The Additional Member System (AMS) should be replaced by the Single
Bill C-20: An Act to amend the Constitution Act, 1867, the Electoral Boundaries Readjustment Act and the Canada Elections Act
 Bill C-20: An Act to amend the Constitution Act, 1867, the Electoral Boundaries Readjustment Act and the Canada Elections Act Publication No. 41-1-C20-E 7 November 2011 Andre Barnes Michel Bédard Legal
- The Fast PR System is a proportional representation (PR) system. Every vote counts. But it offers significant differences from other PR systems.
 system. Every vote counts. But it offers significant differences from other PR systems.") The Fast PR System for Reform of the Canadian Electoral System By John Goodings Summary : - The Fast PR System is a proportional representation (PR) system. Every vote counts. But it offers significant
The Fast PR System for Reform of the Canadian Electoral System By John Goodings Summary : - The Fast PR System is a proportional representation (PR) system. Every vote counts. But it offers significant
Electoral System Design Database Codebook
 Electoral System Design Database Codebook Electoral System Design Database Codebook International Institute for Democracy and Electoral Assistance 2018 International Institute for Democracy and Electoral
Iowa Voting Series, Paper 6: An Examination of Iowa Absentee Voting Since 2000
 Department of Political Science Publications 5-1-2014 Iowa Voting Series, Paper 6: An Examination of Iowa Absentee Voting Since 2000 Timothy M. Hagle University of Iowa 2014 Timothy M. Hagle Comments This
SOME QUESTIONS ABOUT THE ELECTORAL SYSTEM FOR THE 2004 INDONESIAN GENERAL ELECTION ANSWERED
 SOME QUESTIONS ABOUT THE ELECTORAL SYSTEM FOR THE 2004 INDONESIAN GENERAL ELECTION ANSWERED Jakarta July 2003 INDEX Why Change The Electoral System Used at the 1999 Election 2 What Is The Date For The
STV in Malta: A crisis?
 STV in Malta: A crisis? A. Buhagiar, J. Lauri University of Malta Abstract Malta is one of the relatively few countries that uses the Single Transferable Vote Method for its General and Local Council elections
The California Primary and Redistricting
 The California Primary and Redistricting This study analyzes what is the important impact of changes in the primary voting rules after a Congressional and Legislative Redistricting. Under a citizen s committee,
As you may have heard, there has been some discussion about possibly changing Canada's electoral system. We want to ask people their views on this.
 Ballot Testing and Voting System Survey [Screen for PC-only won't work on mobile] [Intro Screen] As you may have heard, there has been some discussion about possibly changing Canada's electoral system.
Democratic Engagement
 JANUARY 2010 Democratic Engagement EXECUTIVE SUMMARY PRAIRIE WILD CONSULTING CO. Together with HOLDEN & Associates Introduction Democratic Engagement has been selected as one of eight domains that comprises
PRESENTATION SUMMARY
 CITIZENS' SSEMBLY ON ELECTORL REFORM PRESENTTION SUMMRY PRINCETON PUBLIC HERING DTED 14 JUNE 2004 T THE COMMUNITY SKILLS CENTRE THE FOLLOWING INFORMTION IS BRIEF SUMMRY OF THE PRESENTTION TO THE CITIZENS'
Measuring the Compliance, Proportionality, and Broadness of a Seat Allocation Method
 Center for People Empowerment in Governance 3F, CSWCD, Magsaysay Avenue University of the Philippines, Diliman Quezon City, 1101, Philippines Tel/fax +632-929-9526 www.cenpeg.org Email: cenpeg.info@gmail.com
In Elections, Irrelevant Alternatives Provide Relevant Data
 1 In Elections, Irrelevant Alternatives Provide Relevant Data Richard B. Darlington Cornell University Abstract The electoral criterion of independence of irrelevant alternatives (IIA) states that a voting
Has the time come to reform Ireland s PR-STV electoral system? John Kenny BSc Government III
 Has the time come to reform Ireland s PR-STV electoral system? John Kenny BSc Government III In their programme for government, the Fine Gael-Labour coalition made a commitment on the establishment of
OPTIONS FOR SYSTEMS TO ELECT THE HOUSE OF THE PEOPLE IN SOMALIA
 OPTIONS FOR SYSTEMS TO ELECT THE HOUSE OF THE PEOPLE IN SOMALIA JUNE 2015 Discussion Note Authors: Acknowledgements: Francisco Cobos-Flores, Peter Mackenzie, Roger Middleton, Kirsti Samuels, and Falastin
Part Three (continued): Electoral Systems & Linkage Institutions
: Electoral Systems & Linkage Institutions") Part Three (continued): Electoral Systems & Linkage Institutions Our political institutions work remarkably well. They are designed to clang against each other. The noise is democracy at work. -- Michael
Part Three (continued): Electoral Systems & Linkage Institutions Our political institutions work remarkably well. They are designed to clang against each other. The noise is democracy at work. -- Michael
1 Electoral Competition under Certainty
 1 Electoral Competition under Certainty We begin with models of electoral competition. This chapter explores electoral competition when voting behavior is deterministic; the following chapter considers
Testimony of FairVote The Center for Voting and Democracy Jack Santucci, Program for Representative Government. October 16, 2006
 Testimony of FairVote The Center for Voting and Democracy Jack Santucci, Program for Representative Government Given in writing to the Assembly Standing Committee on Governmental Operations and Assembly
Chapter 3. The Evidence. deposition would have to develop to generate the facts and figures necessary to establish an
 Chapter 3 The Evidence The demographic and political analyses Dreyer was questioned about during his July 1983 deposition would have to develop to generate the facts and figures necessary to establish
CREASE HARMAN & COMPANY
 CREASE HARMAN & COMPANY Barristers & Solicitors 800-1070 DOUGLAS STREET R. LOU-POY, Q.C. J.F.N. PAGET P.W. KLASSEN PO BOX 997 R.T. TAYLOR G.C. WHITMAN J.E.D. SAVAGE VICTORIA, B.C. CANADA R.L. SPOONER A.R.
PEI COALITION FOR WOMEN IN GOVERNMENT. Submission to the Special Committee on Democratic Renewal for the Legislative Assembly of Prince Edward Island
 PEI COALITION FOR WOMEN IN GOVERNMENT Submission to the Special Committee on Democratic Renewal for the Legislative Assembly of Prince Edward Island PEI Coalition for Women in Government PEI Coalition
Between plurality and proportionality: an analysis of vote transfer systems
 Between plurality and proportionality: an analysis of vote transfer systems László Csató Department of Operations Research and Actuarial Sciences Corvinus University of Budapest MTA-BCE Lendület Strategic
REFORMING ONTARIO S ELECTORAL SYSTEM SUBMISSION TO THE ONTARIO CITIZENS ASSEMBLY. By Fair Vote Canada National Capital Region Chapter
 1 Introduction REFORMING ONTARIO S ELECTORAL SYSTEM SUBMISSION TO THE ONTARIO CITIZENS ASSEMBLY By Fair Vote Canada National Capital Region Chapter The Ontario Citizens Assembly has been asked to do two
Executive Summary The AV Referendum in context The Voter Power Index 6. Conclusion 11. Appendix 1. Summary of electoral systems 12
 Executive Summary 1 Voter Power under First Past the Post 2 The effect of moving to the Alternative Vote 2 The VPI website 2 1. The AV Referendum in context 3 The referendum options 3 First Past the Post
Elections and referendums
 Caramani (ed.) Comparative Politics Section III: Structures and institutions Chapter 10: Elections and referendums by Michael Gallagher (1/1) Elections and referendums are the two main voting opportunities
Community-centred democracy: fine-tuning the STV Council election system
 Community-centred democracy: fine-tuning the STV Council election system Denis Mollison - September 2017 Introduction The proportional system of STV has worked well for Scotland s council elections (Curtice
Math of Election APPORTIONMENT
 Math of Election APPORTIONMENT Alfonso Gracia-Saz, Ari Nieh, Mira Bernstein Canada/USA Mathcamp 2017 Apportionment refers to any of the following, equivalent mathematical problems: We want to elect a Congress
T hroughout the history of Prince Edward Island
 The Prince Edward Island Plebiscite on Electoral Reform by Jeannie Lea On November 28, 2005 the voters of Prince Edward Island rejected a proposal for the introduction of a Mixed Member Proportional electoral
Migrants and external voting
 The Migration & Development Series On the occasion of International Migrants Day New York, 18 December 2008 Panel discussion on The Human Rights of Migrants Facilitating the Participation of Migrants in
The Belgian Electoral System: Open list system, political parties and individual candidates
 The Belgian Electoral System: Open list system, political parties and individual candidates by Frédéric BOUHON Lecturer (chargé de cours) at the University of Liège (Belgium) Paper presented on the 21
Electoral Reform National Dialogue INFORMATION BOOKLET
 Electoral Reform National Dialogue INFORMATION BOOKLET Thank you for joining us in this historic dialogue. Federal electoral reform in Canada Canada is a great nation with a rich democratic history, and
Arguments for and against electoral system change in Ireland
 Prof. Gallagher Arguments for and against electoral system change in Ireland Why would we decide to change, or not to change, the current PR-STV electoral system? In this short paper we ll outline some
Wasted Votes: A Conceptual Synthesis and Generalization to the Case of PR Elections*
 Wasted Votes: A Conceptual Synthesis and Generalization to the Case of PR Elections* Peter Selb Department of Politics and Public Management University of Konstanz 78457 Konstanz, Germany peter.selb@uni-konstanz.de
! # % & ( ) ) ) ) ) +,. / 0 1 # ) 2 3 % ( &4& 58 9 : ) & ;; &4& ;;8;
 ) ) ) ) +,. / 0 1 # ) 2 3 % ( &4& 58 9 : ) & ;; &4& ;;8;") ! # % & ( ) ) ) ) ) +,. / 0 # ) % ( && : ) & ;; && ;;; < The Changing Geography of Voting Conservative in Great Britain: is it all to do with Inequality? Journal: Manuscript ID Draft Manuscript Type: Commentary
! # % & ( ) ) ) ) ) +,. / 0 # ) % ( && : ) & ;; && ;;; < The Changing Geography of Voting Conservative in Great Britain: is it all to do with Inequality? Journal: Manuscript ID Draft Manuscript Type: Commentary
A New Electoral System for a New Century. Eric Stevens
 A New Electoral System for a New Century Eric There are many difficulties we face as a nation concerning public policy, but of these difficulties the most pressing is the need for the reform of the electoral
Fair Division in Theory and Practice
 Fair Division in Theory and Practice Ron Cytron (Computer Science) Maggie Penn (Political Science) Lecture 5b: Alternative Voting Systems 1 Increasing minority representation Public bodies (juries, legislatures,
F2PTP A VOTING SYSTEM FOR EQUALITY OF REPRESENTATION IN A MULTI-PARTY STATE FIRST TWO PAST THE POST. 1 Tuesday, 05 May 2015 David Allen
 A VOTING SYSTEM FOR EQUALITY OF REPRESENTATION IN A MULTI-PARTY STATE 1 Tuesday, 05 May 2015 David Allen TIME FOR CHANGE In 2010, 29,687,604 people voted. The Conservatives received 10,703,654, the Labour
Carnegie Mellon University Student Senate Bylaws
 Carnegie Mellon University Student Senate Bylaws 5 10 15 20 25 30 35 40 45 Article I. Purpose and Scope. A. The purpose of these bylaws is to establish the structures and operating procedures of Student
Introduction Why Don t Electoral Rules Have the Same Effects in All Countries?
 Introduction Why Don t Electoral Rules Have the Same Effects in All Countries? In the early 1990s, Japan and Russia each adopted a very similar version of a mixed-member electoral system. In the form used
Iowa Voting Series, Paper 4: An Examination of Iowa Turnout Statistics Since 2000 by Party and Age Group
 Department of Political Science Publications 3-1-2014 Iowa Voting Series, Paper 4: An Examination of Iowa Turnout Statistics Since 2000 by Party and Age Group Timothy M. Hagle University of Iowa 2014 Timothy
ANALYSIS AND COMPARISON OF GREEK PARLIAMENTARY ELECTORAL SYSTEMS OF THE PERIOD
 ANALYSIS AND COMPARISON OF GREEK PARLIAMENTARY ELECTORAL SYSTEMS OF THE PERIOD 1974-1999 Aikaterini Kalogirou and John Panaretos Department of Statistics, Athens University of Economics and Business, 76,
EUROPEISKA KONVENTET SEKRETARIATET. Bryssel den 27 februari 2003 (28.2) (OR. en) CONV 585/03 CONTRIB 261 FÖLJENOT
 (OR. en) CONV 585/03 CONTRIB 261 FÖLJENOT") EUROPEISKA KONVENTET SEKRETARIATET Bryssel den 27 februari 2003 (28.2) (OR. en) CONV 585/03 CONTRIB 261 FÖLJENOT från: till: Ärende: Sekretariatet Konventet Bidrag från John Bruton, ledamot av konventet:
EUROPEISKA KONVENTET SEKRETARIATET Bryssel den 27 februari 2003 (28.2) (OR. en) CONV 585/03 CONTRIB 261 FÖLJENOT från: till: Ärende: Sekretariatet Konventet Bidrag från John Bruton, ledamot av konventet:
Reforming the Electoral System in Iraq. Reforming the Electoral System in Iraq
 Reforming the Electoral System in Iraq Reforming the Electoral System in Iraq Hashim Al-Rikabi Copyright 2017 www.bayancenter.org info@bayancenter.org 2 About Al-Bayan Center for Planning and Studies is
REPRESENTATIVE DEMOCRACY - HOW TO ACHIEVE IT
 - 30 - REPRESENTATIVE DEMOCRACY - HOW TO ACHIEVE IT Representative democracy implies, inter alia, that the representatives of the people represent or act as an embodiment of the democratic will. Under
kicking the tyres Choosing a voting system for New Zealand
 kicking the tyres Choosing a voting system for New Zealand by steve thomas contents Kicking the Tyres. Choosing a voting system for New Zealand 1 Evaluating Voting Systems 2 Mixed Member Proportional (MMP)
Amended by the Green Party State Committee at its meeting held in Rensselaer, New York on May 18, 2013.
 RULES OF THE GREEN PARTY OF NEW YORK STATE Amended by the Green Party State Committee at its meeting held in Rensselaer, New York on May 18, 2013. The Green Party having attained party status as that term
VOTING ON INCOME REDISTRIBUTION: HOW A LITTLE BIT OF ALTRUISM CREATES TRANSITIVITY DONALD WITTMAN ECONOMICS DEPARTMENT UNIVERSITY OF CALIFORNIA
 1 VOTING ON INCOME REDISTRIBUTION: HOW A LITTLE BIT OF ALTRUISM CREATES TRANSITIVITY DONALD WITTMAN ECONOMICS DEPARTMENT UNIVERSITY OF CALIFORNIA SANTA CRUZ wittman@ucsc.edu ABSTRACT We consider an election
November 9, The Honourable Buck Watts Speaker of the Legislative Assembly Province of Prince Edward Island. Honourable Speaker:
 November 9, 2016 The Honourable Buck Watts Speaker of the Legislative Assembly Province of Prince Edward Island Honourable Speaker: I am please to submit an interim report in accordance with Section 119
NEWS RELEASE. Attorney General unveils report and recommendations on electoral reform referendum
 For Immediate Release 2018AG0041-001071 May 30, 2018 NEWS RELEASE Attorney General unveils report and recommendations on electoral reform referendum VICTORIA David Eby, Attorney General, has released a
PEI COALITION FOR WOMEN IN GOVERNMENT. Submission to the Special Committee on Democratic Renewal for the Legislative Assembly of Prince Edward Island
 PEI COALITION FOR WOMEN IN GOVERNMENT Submission to the Special Committee on Democratic Renewal for the Legislative Assembly of Prince Edward Island PEI Coalition for Women in Government 10/21/2015 PEI
EXPLORING PARTISAN BIAS IN THE ELECTORAL COLLEGE,
 WHS (2009) ISSN: 1535-4738 Volume 9, Issue 4, pp. 2010 Nova Science Publishers, Inc. EXPLORING PARTISAN BIAS IN THE ELECTORAL COLLEGE, 1964-2008 ABSTRACT The purpose of this work is to examine the sources
BILL C-24: AN ACT TO AMEND THE CANADA ELECTIONS ACT AND THE INCOME TAX ACT (POLITICAL FINANCING)
") LS-448E BILL C-24: AN ACT TO AMEND THE CANADA ELECTIONS ACT AND THE INCOME TAX ACT (POLITICAL FINANCING) Prepared by: James R. Robertson, Principal Law and Government Division 5 February 2003 Revised 11
LS-448E BILL C-24: AN ACT TO AMEND THE CANADA ELECTIONS ACT AND THE INCOME TAX ACT (POLITICAL FINANCING) Prepared by: James R. Robertson, Principal Law and Government Division 5 February 2003 Revised 11
United Nations Educational, Scientific and Cultural Organization Executive Board
 ex United Nations Educational, Scientific and Cultural Organization Executive Board Hundred and fifty-fifth Session 155 EX/29 PARIS, 29 July 1998 Original: French/English Item 7.5 of the provisional agenda
CARLETON ECONOMIC PAPERS
 CEP 17-06 In Defense of Majoritarianism Stanley L. Winer March 2017 CARLETON ECONOMIC PAPERS Department of Economics 1125 Colonel By Drive Ottawa, Ontario, Canada K1S 5B6 In Defense of Majoritarianism
Devolved Immigration Policy: Will it Work in Scotland? Robert E. Wright
 Devolved Immigration Policy: Will it Work in Scotland? by Robert E. Wright Department of Economics Strathclyde Business School University of Strathclyde William Duncan Building 130 Rottenrow Glasgow, G4
CHAPTER OUTLINE WITH KEYED-IN RESOURCES
 OVERVIEW A political party exists in three arenas: among the voters who psychologically identify with it, as a grassroots organization staffed and led by activists, and as a group of elected officials
Rules for Voting and Elections in the Michigan Democratic Party
 Rules for Voting and Elections in the Michigan Democratic Party 1.0 PURPOSE 1.1 These rules provide procedures to be used for all voting and elections at the various levels of the Michigan Democratic Party:
What is fairness? - Justice Anthony Kennedy, Vieth v Jubelirer (2004)
") What is fairness? The parties have not shown us, and I have not been able to discover.... statements of principled, well-accepted rules of fairness that should govern districting. - Justice Anthony Kennedy,
What is fairness? The parties have not shown us, and I have not been able to discover.... statements of principled, well-accepted rules of fairness that should govern districting. - Justice Anthony Kennedy,