Much-hyped Turnout Record Fails to Materialize Convenience Voting Fails to Boost Balloting
|
|
|
- Harvey Gregory
- 6 years ago
- Views:
Transcription

1 Much-hyped Turnout Record Fails to Materialize Convenience Voting Fails to Boost Balloting Contact: Curtis Gans, , , , Jon Hussey, AU Media Relations, or WASHINGTON, D.C. (November 6, 2008) Despite lofty predictions by some academics, pundits, and practitioners that voter turnout would reach levels not seen since the turn of the last century, the percentage of eligible citizens casting ballots in the 2008 presidential election stayed at virtually the same relatively high level as it reached in the polarized election of According to a report and turnout projection released today by American University s Center for the Study of the American Electorate (CSAE) and based, in part, on nearly final but unofficial vote tabulations as compiled by the Associated Press as of 7 p.m. Wednesday, November 5, the percentage of Americans who cast ballots for president in this year s presidential election will reach between million and million when all votes have been counted by early next month. If this prediction proves accurate, turnout would be at either exactly the same level as in 2004 or, at most, one percentage point higher (or between 60.7 percent and 61.7 percent). If the rate of voting exceeds 61.0 percent of eligibles, turnout will have been the highest since This projection is based on the million tabulated votes compiled by the Associated Press plus some estimate partially based on experience with post-election vote counting in previous elections and partially based on factors specific to this election, most notably the spread of balloting prior to Election Day on how many ballots are still to be counted. A downturn in the number and percentage of Republican voters going to the polls seemed to be the primary explanation for the lower than predicted turnout. The percentage of eligible citizens voting Republican declined to 28.7 percent down 1.3 percentage points from Democratic turnout increased by 2.6 percentage points from 28.7 percent of eligibles to 31.3 percent. It was the seventh straight increase in the Democratic share of the eligible vote since the party s share dropped to 22.7 percent of eligibles in Of the 47 states and the District of Columbia included in this report, turnout was up in only 22 states and D.C. (Because of the extensive uncounted no excuse absentee balloting in Alaska and California and all-mail voting in Oregon and most of the state of Washington, those states are not included in this report.) Many people were fooled (including this student of politics although less so than many others) by this year s increase in registration (more than 10 million added to the rolls), citizens willingness to
2 stand for hours even in inclement weather to vote early, the likely rise in youth and African American voting, and the extensive grassroots organizing network of the Obama campaign into believing that turnout would be substantially higher than in 2004, said Curtis Gans, CSAE s director. But we failed to realize that the registration increase was driven by Democratic and independent registration and that the long lines at the polls were mostly populated by Democrats. Gans attributed the GOP downturn to three factors: 1) John McCain s efforts to unite the differing factions in the Republican Party by the nomination of Governor Sarah Palin as vice-presidential nominee was a singular failure. By election time many culturally conservative Republicans still did not see him as one of their own and stayed home, while moderate Republicans saw the nomination of Palin reckless and worried about McCain s steadiness. 2) As events moved towards Election Day, there was a growing perception of a Democratic landslide, discouraging GOP voters. 3) The 2008 election was a mirror image of the 2004 election. In the 2004 election, the enthusiasm level was on the Republican side. By Election Day, Democratic voters were not motivated by their candidate but rather by opposition to President Bush, while Republican voters had a much greater liking for their standard bearer. In 2008 and according to polls from several sources, by at least 20 percentage points, Obama enjoyed stronger allegiance than McCain. Even the best get-out-the-vote activities tend to be as successful as the affirmative emotional context in which they are working. In 2004, that context favored the GOP. In 2008, it favored the Democrats. In the end, this election was driven by deep economic concerns and the prevailing emotional climate, Gans said. While there probably has not been, since 1932, the confluence of factors that underlay this election 90 percent of the American people seeing the nation on the wrong track, 75 percent disapproving of the president s performance, more than 80 percent perceiving a recession and feeling that things will get worse, and the reality of growing economic distress on one level this election was typical. When economic conditions go bad, the party in the White House gets blamed and they lose.
3 Convenience Voting Didn t Help During the past several years, and in the belief that turnout would be enhanced, many states have moved to various forms of what has been called convenience voting. The most extreme form is the all-mail balloting in Oregon, and more recently, in most of the state of Washington. Other forms include no-excuse absentee voting (whereby citizens can get absentee ballots without stating a reason and cast them for a period in advance of the election), early voting (whereby at certain polling places established by election officials in convenient locations, citizens can, in person, cast ballots for a specified period before an election) and Election Day registration (where a citizen can both register and vote on Election Day). The evidence from the 2008 election is that if the mission of these electoral devices is turnout enhancement, the mission has been a failure. Of the 14 states which had the largest turnout increases in 2008, only six had implemented one form or another of convenience voting. Of the 13 states which had the largest turnout decreases, all but one had one form or another of convenience voting. (See chart 3.) It has always been abundantly clear that, after four decades of making it easier to vote and having turnout decline (among most groups) except for elections driven by fear and anger, Gans said, the central issue governing turnout is not procedure but motivation. These new procedures, except for Election Day registration for some states, don t help turnout and pose some discrete dangers for American democracy. Some Statistical Highlights: Of the states included in this report, Democratic turnout increased in all but seven states, led by Indiana (up 8.32 percentage points), North Carolina (8.3), Hawaii (6.4), Delaware (6.1), Georgia (6.1), North Dakota (6.0), Nevada (5.9), Montana (5.4), New Mexico (.1), and Virginia (5.0) all except Hawaii, new areas of potential Democratic strength. Republican turnout increased in only eight of 47 states and the District of Columbia included in this report. The greatest increase in overall turnout was in North Carolina, where turnout increased by 9.4 percentage points to a record high. Georgia also had a record high turnout, increasing by 6.7 percentage points, as did South Carolina with a 6.0 percentage point increase. Others setting new records included Alabama, Virginia, Mississippi, and the District of Columbia. As usual the highest turnout was recorded in Minnesota (75.9 percent of eligible), followed by Wisconsin (70.9), Iowa (68.9) Missoouri (67.4), Michigan (66.7), South Dakota (66.7), and North Carolina (66.3).
4 Commentary (Two Shorts for Longer Future Analysis): 1. The opportunity for long-term realignment: The Democratic victory was not only large in margin and sweeping in scope, it also was a continuation of their gains in share of the eligible vote, which began after the 1980 election and many of their largest gains in 2008 came in states where the Democrats had not previously had a foothold in the post-voting Rights Act south and in the mountain west and southwest. While this election did not in itself realign American politics after 28- years of Republican dominance, it presented the opportunity for such a realignment to take place. But that realignment can only occur if President-elect Obama is a successful president. If he restores political trust, economic stability, international respect, and broad citizen approval, the Democrats could be in power everywhere for a very long time. But that is a tall order which may not be, given the severity of current conditions, an accomplishable task. However, the GOP would be wise not to play politics in the manner they utilized during the Clinton Administration a manner that was largely obstructionist and nay-saying. If they pursue that strategy in the face of Obama s call to cooperation in dealing with crisis, the GOP could be in the political wilderness for a very, very, long time. 2. Convenience Voting: This election showed what many previous elections have shown that the types of innovations adopted in the past several years particularly early voting, no-excuse absentee voting and mail voting do not enhance and may hurt turnout. They pose other dangers the most significant is the danger that something may occur on the last few days of the electoral season, such as, the present context, the capture of Osama Bin Laden, a domestic terrorist act, or an elderly candidate having a heart attack after 35 million citizens have cast an irrevocable vote. With the exception of those who physically can t get to the polls or those who for business reasons can t be at the polls on a given election day, the nation would be safer if everyone voted on the same day. Mail voting and no-excuse absentee voting also offer the greatest opportunity for voting fraud and intimidation of any aspect of the electoral system. This is because these forms of voting provide for the elimination by any individual of their right to a secret ballot and thus, their vote could be (and has been on a few occasions) bought, or someone delivering an open ballot filled out the wrong way could discard it, or one could be pressured at ballot signing parties among one s peers, pressure easy to resist behind a voting curtain, not so easy to resist at the home of a friend. It is why the United States adopted the Australian (secret) ballot in the first place around the turn of the last century. But in a larger sense, convenience voting is addressing a real problem with the wrong solutions. The participation problem is, at heart, not procedural but motivational. In a variety of ways, events, politics, leadership, education, communications, and values have damped the religion of civic engagement and responsibility. We will not get that back by treating would-be voters as spoiled children. We need to demand more of our citizenry rather than less. The Democrats liked convenience voting this time because it benefitted them. The Republicans liked it in 2004 because it benefitted them. But democracy was not benefitted. These devices are extremely popular, but popularity is not the same as wisdom and in this case, it is antithetical. It s time to consider rolling them back.
5 Voting Trend Year Percentage Partisan Voting Trend Year Percentage Democratic Republican Other
6 SUMMARY CHARTS 1. Turnout Trend: The number and percentage of eligible citizens who voted for President in elections since The 2008 figure is an estimate: YEAR Citizens Eligible Vote Percent of Eligible Voted Pct. Pt. Dif ,323, ,500,000 (est.)** ,780, ,265, ,327, ,399, ,437,000 96,277, ,048, ,428, ,855,000 91,594, ,727,000 92,659, ,111,000 86,515, ,419,000 81,555, ,228,000 77,718, ,955,000 73,211, ,979,000 70,645, * ,188,000 68,838, * ,295,000 62,026, ,607,000 61,550, ,689,000 48,793, ,607,000 47,976, ,248,000 49,900, ,013,000 45,654, ,295,000 39,758, ,715,000 36,805, ,334,466 29,095, * Figure adjusted upwards to compensate for the African-Americans considered as part of those eligible but denied the vote throughout the south. Similar adjustments in lesser amounts should be made for all the years preceding the Voting Rights Act of 1965, but will await CSAE s final election report in January. Actual figures, without adjustment are 62 percent for 1964 and 64.9 for ** CSAE s estimated 2008 general election turnout is within a range between 126,500,000 and 128,500,500 or between 60.7 percent of eligibles and 61.7 percent.
7 2. Partisan Turnout Trend: Percentage of eligible citizens who voted for the presidential candidate of each major party. The vote percentage in 2008 is based on near final but unofficial counted returns. Percentages for previous years are based on final and official results: Year Democratic Republican Other
8 3. Convenience Voting and Turnout % VAP % VAP Early No Excuse State VAP Turnout Voted Voted Pt Diff % Diff Voting Absentee EDR NC 6,423,000 4,256, X X GA 6,302,000 3,862, X SC 3,224,000 1,876, AL 3,394,000 2,091, IN 4,586,000 2,737, NV 1,642, , X X MO 4,328,000 2,916, MS 2,151,000 1,212, DC 371, , TN 4,512,000 2,614, X VA 5,560,000 3,460, TX 14,886,000 8,045, X MA 4,625,000 3,047, X DE 630, , ID 1,024, , X X NM 1,346, , X X MI 7,490,000 4,993, MT 731, , X IL 8,540,000 5,339, ND 485, , X X KS 1,968,000 1,206, X KY 3,147,000 1,828, PA 9,450,000 5,830, FL 12,923,000 8,072, X X AR 2,065,000 1,075, IA 2,201,000 1,515, X X X NJ 5,904,000 3,653, X LA 3,338,000 1,958, MN 3,824,000 2,901, X OK 2,561,000 1,461, X WY 388, , X X NE 1,243, , X CT 2,518,000 1,567, RI 790, , SD 573, , X WI 4,183,000 2,965, X X CO 3,219,000 2,110, X X NY 12,653,000 7,011, HI 918, , X VT 495, , X MD 4,064,000 2,312, X NH 1,016, , X WV 1,428, , X OH 8,562,000 5,227, X UT 1,578, , X ME 1,048, , X X AZ 4,117,000 1,886, X X Eleven states conduct early voting. Twenty five conduct no-excuse absentee voting. Seven states conduct Election day registration. Twelve states have a combination of methods.
9 4. Other Candidate Vote: Votes for, percentage share of eligible vote, and party affiliations of presidential candidates other than the major party candidates: Candidate Party Total Vote Percentage Ralph Nader Ecology, Unaffiliated, Independent, 658, % Natural Law, None, Peace Bob Barr Libertarian, Independent 489, % Chuck Baldwin Alaska Independence, Constitution, 175, % Independent American, Independent Green, Independent, Nebraska Independent, Reform, US Taxpayers Cynthia McKinney Green, Independent, Mountain, 143, % Pacific Green, Unaffiliated Alan Keyes America's Independent 35, % Ron Paul Libertarian, Constitution 19, % Gloria La Riva Independent, Socialism and 7, % Liberation, New American Independent Roger Calero Socialist Workers, Independent 7, % Brian Moore Independent, Liberty Union, 6, % Socialist None of these candidates 6, % Richard Duncan Independent 3, % James Harris Socialist Workers 2, % Charles Jay Boston Tea, Independent 2, % John Joseph Polachek New 1, % Jeffrey Wamboldt Independent % Frank McEnulty New American Independent % Thomas Stevens Objectivist % Gene Amondson Prohibition % Jeffrey Boss Independent % George Phillies Libertarian % Ted Weill Reform % Jonathan Allen HeartQuake ' % Bradford Lyttle Pacifist %
10 5.
11 NOTES 1. What is Turnout: Turnout should be a simple calculation in which the numerator is the number of votes cast and the denominator is the number of citizens eligible to vote. But because of various anomalies in election statistics, some of which are outlined in detail below, this calculation is more complicated. By common usage, the numerator in every presidential election year is the vote for president (even though that tally is usually about one percentage point lower than the actual number of citizens who go to the polls. It is lower because many states, although an ever-diminishing number, do not keep records of all those who go to the polls, the total ballots cast). In midterm elections, the numerator is the total of votes for the statewide race in each state that draws the highest number of votes and the aggregate total of votes for U.S. House of Representatives in those states that do not have statewide races. (This total tends to be between 1 and 1.5 percent lower than the actual total ballots cast but is used for the same reasons that many states do not compile total ballots cast figures.) Turnout is NOT the percentage of those registered who voted. There are three basic reasons for this: 1) Using registration as a denominator does not account for the whole of the electorate, including those who are not registered. Thus, it gives a false picture of true citizen engagement. 2) Changes in registration law can dramatically affect the figures. If the nation adopts, as it did, a registration law that provides for national mail registration, registration at motor vehicle bureaus, and at social service agencies, registration will go up but turnout of those registered will decline artificially by a greater amount than it does when using the entire eligible electorate as a denominator. 3) Registration figures are subject to the fluctuations of election administration. If a state conducts a thorough purge of its registration lists close to election, its registration figures will be lower and thus its percentage of registered voting will be higher. But if registration lists are not so purged, as is the case in many states, the figures for registration will be higher and the turnout based on these inflated registration figures will be lower. Consider how distorted a turnout percentage using registration as a base would be in a state such as Alaska, where because of a lack of regular list cleaning and potential flaws with the Census Bureau s estimates of the state s eligible population, registration figures are regularly in excess of 100 percent of the eligible vote. 2. The Eligible Vote The Denominator for Determining Turnout: The eligible vote in this report is the number of people residing in the United States who are 18 years of age or over, minus the number of noncitizens residing in the United States who are 18 years of age and over as of November 1. It is an interpolated figure from the 2000 Census, based on the methodology outlined below. For years, CSAE and every other reputable organization working in this field had used the Census Bureau s estimates of November age-eligible population (VAP) to determine turnout. That figure came under legitimate criticism because it included noncitizens; convicted felons (in most states) and, in some states, ex-felons; and people deemed mentally incompetent in institutions who could not vote and did not include citizens residing in other countries, citizens naturalized during the election year and the citizen portion of the Census undercount, all of whom could vote but were not part of the VAP estimate. The Census Bureau has ceased providing its VAP estimates.
12 For years also, Dr. Walter Dean Burnham, professor emeritus at the University of Texas at Austin, has been producing a denominator of age-eligible citizens (age-eligible population minus age-eligible noncitizens, interpolated by state and nation from and between decennial censuses). After some study of this matter, CSAE has come to believe that this denominator is the best for determining turnout, subject to the caveat below. It has come to this belief because of two factors: 1. Available data: One does not determine turnout simply for any given year but also as an historical comparison with previous years. Data for several of the issues involving the inadequacy of the age-eligible population (VAP) figures are either simply not available, not available in a timely manner, not available over a given period of history, or not allocatable to the states. Data on convicted and incarcerated felons are only available for a fairly recent time period. State laws on whether convicted felons and ex-felons can vote are changing and have changed over time. There is no accurate set of figures on those deemed mentally incompetent. The number of American citizens residing abroad is ascertainable but the number of age-eligible has to be estimated and there are no figures that allow the allocation of these citizens by state. Naturalization figures come in too late, often a year or two after the election year, to be usable in any current population accounting. And while any given Census undercount can be allocated by state, one can only estimate how much of that undercount is of citizens as opposed to noncitizens. 2. The balance of the figures: In studying this statistical problem, CSAE has found that the most important issue is that of noncitizens. If one wants to have a relatively accurate picture of turnout, one must eliminate the noncitizens from the age-eligible population. On the other hand, the other adjustments to the denominator would not substantially differ from the denominator of citizen age-eligible population. In pursuing its inquiry into this topic, CSAE found that the factors which would lower the denominator felons, ex-felons, and people deemed mentally incompetent who can t vote are roughly equal to two of the factors which would increase the denominator citizens living in other countries and naturalization who could vote. If one added a ballpark figure for the number of citizens in the undercount who could vote, the factors in those years of an undercount, other than noncitizens, which would increase the denominator exceeds those that would reduce it. The one caveat in adopting the Burnham methodology lock, stock, and barrel is that Burnham interpolates from census to census. These censuses are accurate as of April 1 of each decennial year for all of the past 50 years. (In prior years, census results captured the population as of varying months.) In order to have more accurate figures for November, CSAE has, using the same methodology, projected citizen population to November. Thus, CSAE used for reports on primaries the April figure for age-eligible citizen population but is using the November figure for this report and any others relating to the general election.
13 METHODOLOGY Since the decennial census population figures are accurate as of April 1 in each census year, the VAP Burnham dataset calculates the difference in the required census figures between a base census year and the same figures as reported in the following census. To estimate the voting age population for the years between the censuses, the difference between them is simply multiplied by the number of months that have passed beyond April 1 of the base year and then added to the base year figure. For example, to arrive at the April 1, 1992, voting age population, the difference between the April 1, 1990, census population and the April 1, 2000, census population is multiplied by 24/120ths (for the 24 out of 120 months between the census counts) and added to the April 1, 1990, figure. The process for arriving at the CSAE November eligible figures is the same, except that the data are projected forward to November instead of April. To accomplish this, the multiplier is simply changed to the number of months that have passed since April of the base census year. For instance, to calculate the November 1996 voting age population, the difference between April 1, 1990, and April 1, 2000, is multiplied by 79/120ths and added to the April 1, 1990, count. The same interpolation process is applied to the decennial census counts of noncitizens of voting age in each state. Once estimates of the total voting age population and the non-citizen voting age population for each state have been calculated, the noncitizen figure is simply subtracted from the total to arrive at the appropriate figure. Since the last decennial census occurred in 2000, it is necessary to project the figures forward to arrive at the voting age population for 2002 and To accomplish this, the difference between the 1990 and 2000 decennial censuses is used to establish a rate of growth. This rate of growth is then used to project forward based on the number of months passed since April 1990 out of the 120 months between the censuses. For instance, to obtain the voting age population for April 2004, the difference between April 1, 1990, and April 1, 2000, is multiplied by 168/120 and added to the April 1, 1990, total. 3. The votes that are counted in this report for the 2008 general election are unofficial results from the several states that are compiled and distributed by the Associated Press as of 7 p.m. Wednesday, November 5, The comparisons in the charts are with the final, official, and certified votes for previous presidential elections (or more precisely the accurate and verified percentage of eligible citizens who voted since raw vote comparisons are usually meaningless as the population grows each year). These comparisons are not without problems. By the evening after Election Day, the figures that have been counted and are available from the Western states of Alaska, California, Oregon, and Washington may be no more than 60 percent of the votes cast in these states and thus comparisons with previous years tend to yield until the votes are fully counted sometimes as many as three weeks later invalid comparisons. Because of this, these four states have been left off all charts in this report. Another problem is, of course, that the 2008 vote counts in this report are frozen in time but not in reality. A state on the bottom of a chart indicating that state had the largest or one of the largest declines in voting when compared to 2004 may still have sufficient votes yet to be counted that will move it up the charts. By and large, however, the further down on a chart of comparison a state is the less the likelihood that it can change from a decrease in turnout to an increase. Similarly, rankings can change as more votes are counted.
14 Two other items are worth mentioning. In most presidential elections, the voters tend to cast their votes for the top of the ticket, the presidential candidates. But often, in one state or another, heated competition or dissatisfaction with the standard bearer can lead citizens to cast more votes for major downticket offices. CSAE has provided a chart of total ballots cast in each state which can be compared to the presidential vote. In 2008, only one race Senator Lindsey Graham s successful reelection bid in South Carolina drew more votes (13,000) than the presidential contest. CSAE s final vote estimate is more tentative this year than most years. Usually through experience CSAE was able to have a good idea of the number of ballots still to be counted when this preliminary report was issued and make a reliable prediction of ultimate turnout. This year, its prediction is considerably more tentative since many more states adopted early voting and easy absentee voting. There are some states, such as Nevada, which have completed processing their absentee votes before this report is issued. Some have processed early votes but not absentees. Until there s some experience one can t be certain that one has a handle on how many votes are still to be counted after Wednesday. Thus, CSAE, this year, chose to predict within a range rather than aim for a number. There were 121,500,000 votes counted as of this writing. CSAE feels reasonably confident that there are no less than five million and no more than seven million votes still to be counted. CSAE reserves the right to have egg on its face. 4. Acknowledgments: Primary research for this report was done by Matthew Mulling, CSAE research associate, who, along with former research associate Mark P. Harvey, is responsible for creating the denominator database for the analysis of November turnout. Organizing the analysis for this report was made profoundly easier by a custom database program developed by Samuel Schreiber, CSAE research associate emeritus. CSAE would also like to express its profound gratitude to Dr. Walter Dean Burnham, professor emeritus at the University of Texas at Austin, for sharing his database, helping to devise CSAE s new November denominator for the analysis of registration and turnout, and for his continuing help to CSAE s work. The committee is also grateful to all the state election officials for graciously yielding their registration and voting figures after an unconscionable amount of hounding by CSAE s staff. Most of all for this particular report CSAE would like to thank Brian Scanlon, Tracy Lewis, Donna Cassata and Alexandra Gassner for their help in arranging access to the figures AP diligently supplies every election year. 5. Culpability: The analysis contained in this report has been done by Curtis Gans, CSAE s director, who is solely responsible for any and all errors contained within.
15 Republican Turnout as a Percentage of VAP - Citizen 2008 vs 2004 Ranked By Percent Point Difference President - General Races ST 2008 VAP 2008 Turnout 2008 % VAP Voted 2004 % VAP Voted Point Diff / % Diff AR 2,065, , / 7.67 AL 3,394,000 1,263, / 5.80 TN 4,512,000 1,487, / 4.27 SC 3,224,000 1,008, / 3.47 NC 6,423,000 2,108, / 3.14 LA 3,338,000 1,147, / 2.26 MA 4,625,000 1,104, / 1.53 GA 6,302,000 2,022, / 1.04 MS 2,151, , / OK 2,561, , / MO 4,328,000 1,442, / KY 3,147,000 1,050, / DC 371,000 14, / TX 14,886,000 4,467, / WV 1,428, , / FL 12,923,000 3,908, / PA 9,450,000 2,584, / RI 790, , / VA 5,560,000 1,637, / NJ 5,904,000 1,540, / NV 1,642, , / KS 1,968, , / ID 1,024, , / WY 388, , / MN 3,824,000 1,275, / NY 12,653,000 2,573, / IN 4,586,000 1,341, / IA 2,201, , / CT 2,518, , / NM 1,346, , / MI 7,490,000 2,044, / DE 630, , / AZ 4,117,000 1,012, / IL 8,540,000 1,975, / MD 4,064, , / OH 8,562,000 2,469, / NH 1,016, , / CO 3,219, , / MT 731, , / SD 573, , / VT 495,000 95, / ND 485, , / NE 1,243, , / WI 4,183,000 1,258, / ME 1,048, , / UT 1,578, , / HI 918, , /
16 Total Turnout as a Percentage of VAP - Citizen 2008 vs President - General Races % VAP % VAP +/ % VAP +/ % VAP +/ % VAP +/ % VAP +/ ST 2008 VAP Turnout Voted Voted Points Voted Points Voted Points Voted Points Voted Points AL 3,394,000 2,091, AZ 4,117,000 1,886, AR 2,065,000 1,075, CO 3,219,000 2,110, CT 2,518,000 1,567, DE 630, , DC 371, , FL 12,923,000 8,072, GA 6,302,000 3,862, HI 918, , ID 1,024, , IL 8,540,000 5,339, IN 4,586,000 2,737, IA 2,201,000 1,515, KS 1,968,000 1,206, KY 3,147,000 1,828, LA 3,338,000 1,958, ME 1,048, , MD 4,064,000 2,312, MA 4,625,000 3,047, MI 7,490,000 4,993, MN 3,824,000 2,901, MS 2,151,000 1,212, MO 4,328,000 2,916, MT 731, , NE 1,243, , NV 1,642, , NH 1,016, , NJ 5,904,000 3,653, NM 1,346, , NY 12,653,000 7,011, NC 6,423,000 4,256, ND 485, , OH 8,562,000 5,227, OK 2,561,000 1,461, PA 9,450,000 5,830, RI 790, , SC 3,224,000 1,876, SD 573, , TN 4,512,000 2,614, TX 14,886,000 8,045, UT 1,578, , VT 495, , VA 5,560,000 3,460, WV 1,428, , WI 4,183,000 2,965, WY 388, , Overall: 178,424, ,347,
17 Total Turnout as a Percentage of VAP - Citizen 2008 vs President - General Races % VAP % VAP +/ % VAP +/ % VAP +/ % VAP +/ % VAP +/ ST 2008 VAP Turnout Voted Voted Points Voted Points Voted Points Voted Points Voted Points AL 3,394,000 2,091, AZ 4,117,000 1,886, AR 2,065,000 1,075, CO 3,219,000 2,110, CT 2,518,000 1,567, DE 630, , DC 371, , FL 12,923,000 8,072, GA 6,302,000 3,862, HI 918, , ID 1,024, , IL 8,540,000 5,339, IN 4,586,000 2,737, IA 2,201,000 1,515, KS 1,968,000 1,206, KY 3,147,000 1,828, LA 3,338,000 1,958, ME 1,048, , MD 4,064,000 2,312, MA 4,625,000 3,047, MI 7,490,000 4,993, MN 3,824,000 2,901, MS 2,151,000 1,212, MO 4,328,000 2,916, MT 731, , NE 1,243, , NV 1,642, , NH 1,016, , NJ 5,904,000 3,653, NM 1,346, , NY 12,653,000 7,011, NC 6,423,000 4,256, ND 485, , OH 8,562,000 5,227, OK 2,561,000 1,461, PA 9,450,000 5,830, RI 790, , SC 3,224,000 1,876, SD 573, , TN 4,512,000 2,614, TX 14,886,000 8,045, UT 1,578, , VT 495, , VA 5,560,000 3,460, WV 1,428, , WI 4,183,000 2,965, WY 388, , Overall: 178,424, ,347,
18 Total Turnout as a Percentage of VAP - Citizen 2008 vs President - General Races % VAP % VAP +/ % VAP +/ % VAP +/ % VAP +/ % VAP +/ ST 2008 VAP Turnout Voted Voted Points Voted Points Voted Points Voted Points Voted Points AL 3,394,000 2,091, AK 476, , AZ 4,117,000 1,886, AR 2,065,000 1,075, CA 22,319,000 10,104, CO 3,219,000 2,110, CT 2,518,000 1,567, DE 630, , DC 371, , FL 12,923,000 8,056, GA 6,302,000 3,862, HI 918, , ID 1,024, , IL 8,540,000 5,339, IN 4,586,000 2,737, IA 2,201,000 1,515, KS 1,968,000 1,206, KY 3,147,000 1,828, LA 3,338,000 1,958, ME 1,048, , MD 4,064,000 2,312, MA 4,625,000 3,043, MI 7,490,000 4,993, MN 3,824,000 2,901, MS 2,151,000 1,212, MO 4,328,000 2,916, MT 731, , NE 1,243, , NV 1,642, , NH 1,016, , NJ 5,904,000 3,653, NM 1,346, , NY 12,653,000 7,011, NC 6,423,000 4,243, ND 485, , OH 8,562,000 5,212, OK 2,561,000 1,461, OR 2,615,000 1,253, PA 9,450,000 5,830, RI 790, , SC 3,224,000 1,876, SD 573, , TN 4,512,000 2,614, TX 14,886,000 8,045, UT 1,578, , VT 495, , VA 5,560,000 3,460, WA 4,489,000 1,679, WV 1,428, , WI 4,183,000 2,921, WY 388, , Overall: 208,323, ,503,
19 Ranked Order Total President - General Turnout as a Percentage of VAP - Citizen % VAP 2008 VAP Turnout Voted 1) MN 3,824,000 2,901, % 2) WI 4,183,000 2,965, % 3) IA 2,201,000 1,515, % 4) MO 4,328,000 2,916, % 5) MI 7,490,000 4,993, % 6) SD 573, , % 7) NC 6,423,000 4,256, % 8) MA 4,625,000 3,047, % 9) CO 3,219,000 2,110, % 10) NH 1,016, , % 11) ND 485, , % 12) MT 731, , % 13) ME 1,048, , % 14) DE 630, , % 15) ID 1,024, , % 16) WY 388, , % 17) IL 8,540,000 5,339, % 18) FL 12,923,000 8,072, % 19) CT 2,518,000 1,567, % 20) VA 5,560,000 3,460, % 21) NJ 5,904,000 3,653, % 22) NE 1,243, , % 23) PA 9,450,000 5,830, % 24) AL 3,394,000 2,091, % 25) KS 1,968,000 1,206, % 26) GA 6,302,000 3,862, % 27) VT 495, , % 28) DC 371, , % 29) OH 8,562,000 5,227, % 30) IN 4,586,000 2,737, % 31) NM 1,346, , % 32) NV 1,642, , % 33) LA 3,338,000 1,958, % 34) SC 3,224,000 1,876, % 35) KY 3,147,000 1,828, % 36) TN 4,512,000 2,614, % 37) OK 2,561,000 1,461, % 38) MD 4,064,000 2,312, % 39) MS 2,151,000 1,212, % 40) UT 1,578, , % 41) NY 12,653,000 7,011, % 42) RI 790, , % 43) TX 14,886,000 8,045, % 44) AR 2,065,000 1,075, % 45) WV 1,428, , % 46) AZ 4,117,000 1,886, % 47) HI 918, , %
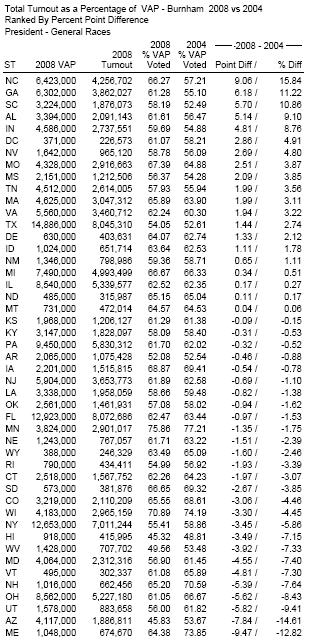
20 Total Turnout as a Percentage of VAP - Burnham 2008 vs 2004 Ranked By Percent Point Difference President - General Races ST 2008 VAP 2008 Turnout 2008 % VAP Voted 2004 % VAP Voted Point Diff / % Diff NC 6,423,000 4,256, / GA 6,302,000 3,862, / SC 3,224,000 1,876, / AL 3,394,000 2,091, / 9.10 IN 4,586,000 2,737, / 8.76 DC 371, , / 4.91 NV 1,642, , / 4.80 MO 4,328,000 2,916, / 3.87 MS 2,151,000 1,212, / 3.85 TN 4,512,000 2,614, / 3.56 MA 4,625,000 3,047, / 3.11 VA 5,560,000 3,460, / 3.22 TX 14,886,000 8,045, / 2.74 DE 630, , / 2.12 ID 1,024, , / 1.78 NM 1,346, , / 1.11 MI 7,490,000 4,993, / 0.51 IL 8,540,000 5,339, / 0.27 ND 485, , / 0.17 MT 731, , / 0.06 KS 1,968,000 1,206, / KY 3,147,000 1,828, / PA 9,450,000 5,830, / AR 2,065,000 1,075, / IA 2,201,000 1,515, / NJ 5,904,000 3,653, / LA 3,338,000 1,958, / OK 2,561,000 1,461, / FL 12,923,000 8,072, / MN 3,824,000 2,901, / NE 1,243, , / WY 388, , / RI 790, , / CT 2,518,000 1,567, / SD 573, , / CO 3,219,000 2,110, / WI 4,183,000 2,965, / NY 12,653,000 7,011, / HI 918, , / WV 1,428, , / MD 4,064,000 2,312, / VT 495, , / NH 1,016, , / OH 8,562,000 5,227, / UT 1,578, , / AZ 4,117,000 1,886, / ME 1,048, , /
INSTITUTE of PUBLIC POLICY
 INSTITUTE of PUBLIC POLICY Harry S Truman School of Public Affairs University of Missouri ANALYSIS OF STATE REVENUES AND EXPENDITURES Andrew Wesemann and Brian Dabson Summary This report analyzes state
African-Americans, Anger, Fear and Youth Propel Turnout to Highest Level Since 1960 Possible Pro-Democratic Realignment, GOP Disaster
 African-Americans, Anger, Fear and Youth Propel Turnout to Highest Level Since 1960 Possible Pro-Democratic Realignment, GOP Disaster Contact: Curtis Gans, 202-885-6295, 703-304-1283, 540-822-5292, gans@american.edu,
The Youth Vote in 2008 By Emily Hoban Kirby and Kei Kawashima-Ginsberg 1 Updated August 17, 2009
 The Youth Vote in 2008 By Emily Hoban Kirby and Kei Kawashima-Ginsberg 1 Updated August 17, 2009 Estimates from the Census Current Population Survey November Supplement suggest that the voter turnout rate
2016 us election results
 1 of 6 11/12/2016 7:35 PM 2016 us election results All News Images Videos Shopping More Search tools About 243,000,000 results (0.86 seconds) 2 WA OR NV CA AK MT ID WY UT CO AZ NM ND MN SD WI NY MI NE
a rising tide? The changing demographics on our ballots
 a rising tide? The changing demographics on our ballots OCTOBER 2018 Against the backdrop of unprecedented political turmoil, we calculated the real state of the union. For more than half a decade, we
Representational Bias in the 2012 Electorate
 Representational Bias in the 2012 Electorate by Vanessa Perez, Ph.D. January 2015 Table of Contents 1 Introduction 3 4 2 Methodology 5 3 Continuing Disparities in the and Voting Populations 6-10 4 National
If you have questions, please or call
 SCCE's 17th Annual Compliance & Ethics Institute: CLE Approvals By State The SCCE submitted sessions deemed eligible for general CLE credits and legal ethics CLE credits to most states with CLE requirements
UNIFORM NOTICE OF REGULATION A TIER 2 OFFERING Pursuant to Section 18(b)(3), (b)(4), and/or (c)(2) of the Securities Act of 1933
(3), (b)(4), and/or (c)(2) of the Securities Act of 1933") Item 1. Issuer s Identity UNIFORM NOTICE OF REGULATION A TIER 2 OFFERING Pursuant to Section 18(b)(3), (b)(4), and/or (c)(2) of the Securities Act of 1933 Name of Issuer Previous Name(s) None Entity Type
Item 1. Issuer s Identity UNIFORM NOTICE OF REGULATION A TIER 2 OFFERING Pursuant to Section 18(b)(3), (b)(4), and/or (c)(2) of the Securities Act of 1933 Name of Issuer Previous Name(s) None Entity Type
January 17, 2017 Women in State Legislatures 2017
 January 17, 2017 in State Legislatures 2017 Kelly Dittmar, Ph.D. In 2017, 1832 women (1107D, 703R, 4I, 4Prg, 1WFP, 13NP) hold seats in state legislatures, comprising 24.8% of the 7383 members; 442 women
Some Change in Apportionment Allocations With New 2017 Census Estimates; But Greater Change Likely by 2020
 FOR IMMEDIATE RELEASE Date: December 20, 2017 Contact: Kimball W. Brace 6171 Emerywood Court Manassas, Virginia 20112 202 789.2004 tel. or 703 580.7267 703 580.6258 fax Info@electiondataservices.com Tel.:
WYOMING POPULATION DECLINED SLIGHTLY
 FOR IMMEDIATE RELEASE Wednesday, December 19, 2018 Contact: Dr. Wenlin Liu, Chief Economist WYOMING POPULATION DECLINED SLIGHTLY CHEYENNE -- Wyoming s total resident population contracted to 577,737 in
2016 NATIONAL CONVENTION
 Delegate Allocations and Region Formation 2016 NATIONAL CONVENTION ROSEN CENTRE, ORLANDO, FL FRIDAY, MAY 27 MONDAY, MAY 30 Written and Prepared By Alicia Mattson Secretary, Libertarian National Committee
New Population Estimates Show Slight Changes For 2010 Congressional Apportionment, With A Number of States Sitting Close to the Edge
 67 Emerywood Court Manassas, Virginia 202 202 789.2004 tel. or 703 580.7267 703 580.6258 fax Info@electiondataservices.com EMBARGOED UNTIL 6:0 P.M. EST, SUNDAY, SEPTEMBER 26, 200 Date: September 26, 200
2018 NATIONAL CONVENTION
 Delegate Allocations and Region Formation 2018 NATIONAL CONVENTION HYATT REGENCY, NEW ORLEANS, LA SUNDAY, JULY 1 TUESDAY JULY 3 Written and Prepared By Alicia Mattson Secretary, Libertarian National Committee
Now is the time to pay attention
 Census & Redistricting : Now is the time to pay attention By Kimball Brace, President Election Data Services, Inc. Definitions Reapportionment Allocation of districts to an area Example: Congressional
Some Change in Apportionment Allocations With New 2017 Census Estimates; But Greater Change Likely by 2020
 FOR IMMEDIATE RELEASE Date: December 26, 2017 Contact: Kimball W. Brace 6171 Emerywood Court Manassas, Virginia 20112 202 789.2004 tel. or 703 580.7267 703 580.6258 fax Info@electiondataservices.com Tel.:
We re Paying Dearly for Bush s Tax Cuts Study Shows Burdens by State from Bush s $87-Billion-Every-51-Days Borrowing Binge
 Citizens for Tax Justice 202-626-3780 September 23, 2003 (9 pp.) Contact: Bob McIntyre We re Paying Dearly for Bush s Tax Cuts Study Shows Burdens by State from Bush s $87-Billion-Every-51-Days Borrowing
Geek s Guide, Election 2012 by Prof. Sam Wang, Princeton University Princeton Election Consortium
 Geek s Guide, Election 2012 by Prof. Sam Wang, Princeton University Princeton Election Consortium http://election.princeton.edu This document presents a) Key states to watch early in the evening; b) Ways
A Dead Heat and the Electoral College
 A Dead Heat and the Electoral College Robert S. Erikson Department of Political Science Columbia University rse14@columbia.edu Karl Sigman Department of Industrial Engineering and Operations Research sigman@ieor.columbia.edu
RULE 1.14: CLIENT WITH DIMINISHED CAPACITY
 American Bar Association CPR Policy Implementation Committee Variations of the ABA Model Rules of Professional Conduct RULE 1.14: CLIENT WITH DIMINISHED CAPACITY (a) When a client's capacity to make adequately
ELECTORAL COLLEGE AND BACKGROUND INFO
 ELECTORAL COLLEGE AND BACKGROUND INFO 1. Go to www.270towin.com and select the year 2000 2. How many total popular votes did George W. Bush receive? Al Gore? 3. How many total electoral votes did George
SPECIAL EDITION 11/6/14
 SPECIAL EDITION 11/6/14 The document below will provide insights on what the new Senate Majority means, as well as a nationwide view of House, Senate and Gubernatorial election results. We will continue
PREVIEW 2018 PRO-EQUALITY AND ANTI-LGBTQ STATE AND LOCAL LEGISLATION
 PREVIEW 08 PRO-EQUALITY AND ANTI-LGBTQ STATE AND LOCAL LEGISLATION Emboldened by the politics of hate and fear spewed by the Trump-Pence administration, state legislators across the nation have threatened
According to Curtis Gans, director of CSAE, turnout is likely to be high in the 2008 general election, but not because primary turnout was high.
 2008 Primary Turnout Falls Just Short of Record Nationally, Breaks Records in Most States Report By Curtis Gans of AU s Center for the Study of the American Electorate Finds Democratic Turnout Far Exceeds
Trump, Populism and the Economy
 Libby Cantrill, CFA October 2016 Trump, Populism and the Economy This material contains the current opinions of the manager and such opinions are subject to change without notice. This material has been
Kansas Legislator Briefing Book 2019
 Kansas Legislator Briefing Book 2019 I-1 Addressing Abandoned Property Using Legal Tools I-2 Administrative Rule and Regulation Legislative Oversight I-3 Board of Indigents Defense Services I-4 Election
State Legislative Competition in 2012: Redistricting and Party Polarization Drive Decrease In Competition
 October 17, 2012 State Legislative Competition in 2012: Redistricting and Party Polarization Drive Decrease In Competition John J. McGlennon, Ph.D. Government Department Chair and Professor of Government
Presented by: Ted Bornstein, Dennis Cardoza and Scott Klug
 1 Attorney Advertising Prior results do not guarantee a similar outcome Models used are not clients but may be representative of clients 321 N. Clark Street, Suite 2800,Chicago, IL 60654 312.832.4500 2
Prison Price Tag The High Cost of Wisconsin s Corrections Policies
 Prison Price Tag The High Cost of Wisconsin s Corrections Policies November 19, 2015 Wisconsin s overuse of jails and prisons has resulted in outsized costs for state residents. By emphasizing high-cost
Research Brief. Resegregation in Southern Politics? Introduction. Research Empowerment Engagement. November 2011
 Research Brief Resegregation in Southern Politics? David A. Bositis, Ph.D. November 2011 Civic Engagement and Governance Institute Research Empowerment Engagement Introduction Following the election of
TABLE OF CONTENTS. Introduction. Identifying the Importance of ID. Overview. Policy Recommendations. Conclusion. Summary of Findings
 1 TABLE OF CONTENTS Introduction Identifying the Importance of ID Overview Policy Recommendations Conclusion Summary of Findings Quick Reference Guide 3 3 4 6 7 8 8 The National Network for Youth gives
RULE 1.1: COMPETENCE. As of January 23, American Bar Association CPR Policy Implementation Committee
 American Bar Association CPR Policy Implementation Committee Variations of the ABA Model Rules of Professional Conduct RULE 1.1: COMPETENCE A lawyer shall provide competent representation to a client.
CA CALIFORNIA. Ala. Code 10-2B (2009) [Transferred, effective January 1, 2011, to 10A ] No monetary penalties listed.
![CA CALIFORNIA. Ala. Code 10-2B (2009) [Transferred, effective January 1, 2011, to 10A ] No monetary penalties listed.](/thumbs/72/66892882.jpg "CA CALIFORNIA. Ala. Code 10-2B (2009) [Transferred, effective January 1, 2011, to 10A ] No monetary penalties listed.") AL ALABAMA Ala. Code 10-2B-15.02 (2009) [Transferred, effective January 1, 2011, to 10A-2-15.02.] No monetary penalties listed. May invalidate in-state contracts made by unqualified foreign corporations.
AL ALABAMA Ala. Code 10-2B-15.02 (2009) [Transferred, effective January 1, 2011, to 10A-2-15.02.] No monetary penalties listed. May invalidate in-state contracts made by unqualified foreign corporations.
State Governments Viewed Favorably as Federal Rating Hits New Low
 APRIL 15, 2013 State Governments Viewed Favorably as Federal Rating Hits New Low FOR FURTHER INFORMATION CONTACT THE PEW RESEARCH CENTER FOR THE PEOPLE & THE PRESS Michael Dimock Director Carroll Doherty
Mrs. Yuen s Final Exam. Study Packet. your Final Exam will be held on. Part 1: Fifty States and Capitals (100 points)
") Mrs. Yuen s Final Exam Study Packet your Final Exam will be held on All make up assignments must be turned in by YOUR finals day!!!! Part 1: Fifty States and Capitals (100 points) Be able to identify the
Mrs. Yuen s Final Exam Study Packet your Final Exam will be held on All make up assignments must be turned in by YOUR finals day!!!! Part 1: Fifty States and Capitals (100 points) Be able to identify the
Congressional Districts Potentially Affected by Shipments to Yucca Mountain, Nevada
 2015 Congressional Districts Potentially Affected by Shipments to Yucca Mountain, Nevada Fred Dilger PhD. Black Mountain Research 10/21/2015 Background On June 16 2008, the Department of Energy (DOE) released
RULE 3.1: MERITORIOUS CLAIMS AND CONTENTIONS
 American Bar Association CPR Policy Implementation Committee Variations of the ABA Model Rules of Professional Conduct RULE 3.1: MERITORIOUS CLAIMS AND CONTENTIONS A lawyer shall not bring or defend a
Constitution in a Nutshell NAME. Per
 Constitution in a Nutshell NAME Per Preamble We the People of the United States, in Order to form a more perfect Union, establish Justice, insure domestic Tranquility, provide for the common defense, promote
Next Generation NACo Network BYLAWS Adopted by NACo Board of Directors Revised February, 2017
 Next Generation NACo Network BYLAWS Adopted by NACo Board of Directors Revised February, 2017 I. NAME The name of the organization shall be Next Generation NACo Network, hereinafter called NextGen. NACo
/mediation.htm s/adr.html rograms/adr/
 Alaska Alaska Court System AK http://www.state.ak.us/courts /mediation.htm A variety of programs are offered in courts throughout the state. Alabama Arkansas Alabama Center for AL http://www.alabamaadr.org
Ballot Questions in Michigan. Selma Tucker and Ken Sikkema
 Ballot Questions in Michigan Selma Tucker and Ken Sikkema PUBLIC SECTOR PUBLIC CONSULTANTS SECTOR CONSULTANTS @PSCMICHIGAN @PSCMICHIGAN PUBLICSECTORCONSULTANTS.COM Presentation Overview History of ballot
Mandated Use of Prescription Drug Monitoring Programs (PMPs) Map
 Map") Mandated Use of Prescription Drug Monitoring Programs (PMPs) Map Research Current as of January 2, 2018. This project was supported by Grant No. G1799ONDCP03A, awarded by the Office of National Drug Control
Mandated Use of Prescription Drug Monitoring Programs (PMPs) Map Research Current as of January 2, 2018. This project was supported by Grant No. G1799ONDCP03A, awarded by the Office of National Drug Control
WLSA&RDC 2014 GARY MONCRIEF
 LESSONS FROM ROSENTHAL WLSA&RDC 2014 GARY MONCRIEF ALAN ROSENTHAL ROSENTHAL S OBSERVATIONS ABOUT LIFE Ask questions Enjoy what you do Have fun Have more fun Keep to yourself that which need not be public
NATIONAL VOTER REGISTRATION DAY. September 26, 2017
 NATIONAL VOTER REGISTRATION DAY September 26, 2017 THE PROBLEM Every year millions of Americans find themselves unable to vote because they miss a registration deadline, don t update their registration,
Uniform Wage Garnishment Act
 Uniform Wage Garnishment Act Agenda What is it? Why do we need it? Major provisions Enactment 1 Who is the ULC? National Conference of Commissioners for Uniform State Laws Uniform Interstate Family Support
DC: I estimate a 4,600 valid sig petition drive for President in I budget $15,000 from the LNC.
 LIBERTARIAN PARTY BALLOT ACCESS ACTION REPORT Libertarian National Committee meeting Phoenix, Arizona March 28-29, 2015 Dear Colleagues: If we lived in a nation with just election laws, we wouldn t have
Political Contributions Report. Introduction POLITICAL CONTRIBUTIONS
 Political Contributions Report January 1, 2009 December 31, 2009 Introduction At CCA, we believe that participation in the political process is an important and appropriate part of our partnership relations
Incarcerated Women and Girls
 Incarcerated and Over the past quarter century, there has been a profound change in the involvement of women within the criminal justice system. This is the result of more expansive law enforcement efforts,
RULE 2.4: LAWYER SERVING
 American Bar Association CPR Policy Implementation Committee Variations of the ABA Model Rules of Professional Conduct RULE 2.4: LAWYER SERVING AS THIRD-PARTY NEUTRAL (a) A lawyer serves as a third-party
STATISTICAL GRAPHICS FOR VISUALIZING DATA
 STATISTICAL GRAPHICS FOR VISUALIZING DATA Tables and Figures, I William G. Jacoby Michigan State University and ICPSR University of Illinois at Chicago October 14-15, 21 http://polisci.msu.edu/jacoby/uic/graphics
Immigrant Policy Project. Overview of State Legislation Related to Immigrants and Immigration January - March 2008
 Immigrant Policy Project April 24, 2008 Overview of State Legislation Related to Immigrants and Immigration January - March 2008 States are still tackling immigration related issues in a variety of policy
Election 2014: The Midterm Results, the ACA and You
 Election 2014: The Midterm Results, the ACA and You James Slotnick, JD Sun Life Financial AVP, Broker Education Join the conversation on Twitter using #SLFElection2014 The Midterm Results The Outlook for
Governing Board Roster
 AASA Governance AASA is the national association most directly concerned with public education leadership. Its practicing superintendents and other school system leaders establish and oversee AASA's goals.
Charlie Cook s Tour of American Politics
 Charlie Cook s Tour of American Politics Insights into the 2018 midterm elections September 2018 Producer National Journal Presentation Center Director Alistair Taylor Roadmap Eight things to watch in
THE LEGISLATIVE PROCESS
 THE LEGISLATIVE PROCESS (and a few other things) Gary Moncrief University Distinguished Professor of Political Science Boise State University NEW LEADERSHIP IDAHO 2017 Lets start with a few other things
Oregon and STEM+ Migration and Educational Attainment by Degree Type among Young Oregonians. Oregon Office of Economic Analysis
 Oregon and STEM+ Migration and Educational Attainment by Degree Type among Young Oregonians 1 What is STEM and STEM+? STEM refers to college degrees where graduates majored in Science, Technology, Engineering
Dynamic Diversity: Projected Changes in U.S. Race and Ethnic Composition 1995 to December 1999
 Dynamic Diversity: Projected Changes in U.S. Race and Ethnic Composition 1995 to 2050 December 1999 DYNAMIC DIVERSITY: PROJECTED CHANGES IN U.S. RACE AND ETHNIC COMPOSITION 1995 TO 2050 The Minority Business
Unsuccessful Provisional Voting in the 2008 General Election David C. Kimball and Edward B. Foley
 Unsuccessful Provisional Voting in the 2008 General Election David C. Kimball and Edward B. Foley The 2002 Help America Vote Act (HAVA) required most states to adopt or expand procedures for provisional
House Apportionment 2012: States Gaining, Losing, and on the Margin
 House Apportionment 2012: States Gaining, Losing, and on the Margin Royce Crocker Specialist in American National Government August 23, 2013 CRS Report for Congress Prepared for Members and Committees
Mineral Availability and Social License to Operate
 Mineral Availability and Social License to Operate Brett Jordan Division of Economics and Business Colorado School of Mines Camp Resources, August 7-9, 2016 Motivation Social License to Operate (SLO) NIMBYism
The Progressive Era. 1. reform movement that sought to return control of the government to the people
 Date CHAPTER 17 Form A CHAPTER TEST The Progressive Era Part 1: Main Ideas Write the letter of the term or name that best matches each description. (4 points each) a. Federal Trade Commission f. Susan
Washington, D.C. Update
 Washington, D.C. Update 2016 AMGA CMO Council March 9, 2016 Chester Speed, J.D., LL.M, Vice-President, Public Policy Presentation Outline AMGA Priority Issues Risk Survey Legislative Agenda Elections 1
THE POLICY CONSEQUENCES OF POLARIZATION: EVIDENCE FROM STATE REDISTRIBUTIVE POLICY
 THE POLICY CONSEQUENCES OF POLARIZATION: EVIDENCE FROM STATE REDISTRIBUTIVE POLICY Elizabeth Rigby George Washington University Gerald Wright Indiana University Prepared for presentation at the Conference
Election Cybersecurity, Voter Registration, and ERIC. David Becker Executive Director, CEIR
 Election Cybersecurity, Voter Registration, and ERIC David Becker Executive Director, CEIR SECURING THE VOTER FILE Prevention Detection Mitigation Prevention White-listing IP addresses Limiting
RULE 3.8(g) AND (h):
 AND (h):") American Bar Association CPR Policy Implementation Committee Variations of the ABA Model Rules of Professional Conduct RULE 3.8(g) AND (h): (g) When a prosecutor knows of new, credible and material evidence
American Bar Association CPR Policy Implementation Committee Variations of the ABA Model Rules of Professional Conduct RULE 3.8(g) AND (h): (g) When a prosecutor knows of new, credible and material evidence
RIDE Program Overview
 RIDE Program Overview Table of Contents 1 Program Overview and the E-Verify Process 2 RIDE by the Numbers 3 Filling a Critical Gap and a Glance at Identity Fraud 4 Fact and Fiction? 5 Benefits of Working
the polling company, inc./womantrend on behalf of Judicial Watch/Breitbart National Post-Election Survey of 806 Actual Voters TOPLINE DATA
 Field Date: November 4, 2014 Margin of Error: ±3.5% the polling company, inc./womantrend on behalf of Judicial Watch/Breitbart National Post-Election Survey of 806 Actual Voters TOPLINE DATA **PLEASE NOTE:
The Impact of Wages on Highway Construction Costs
 The Impact of Wages on Highway Construction Costs Updated Analysis Prepared for the Construction Industry Labor-Management Trust and the National Heavy & Highway Alliance by The Construction Labor Research
Presentation to the Bakery, Confectionery, Tobacco Workers and Grain Millers' International Union. Paul Lemmon July 26, 2010
 Presentation to the Bakery, Confectionery, Tobacco Workers and Grain Millers' International Union Paul Lemmon July 26, 2010 Our Hard Work in 2006 Our Hard Work in 2008 Who We re Fighting Speaker Boehner?
the polling company, inc./ WomanTrend On behalf of the Center for Security Policy TOPLINE DATA Nationwide Survey among 1,000 Adults (18+)
") Field Dates: September 23-26, 2014 Margin of Error: ±3% SCREENER 1. Gender (RECORDED BY OBSERVATION) 49% MALE 51% FEMALE the polling company, inc./ WomanTrend On behalf of the Center for Security Policy
Field Dates: September 23-26, 2014 Margin of Error: ±3% SCREENER 1. Gender (RECORDED BY OBSERVATION) 49% MALE 51% FEMALE the polling company, inc./ WomanTrend On behalf of the Center for Security Policy
Migrant and Seasonal Head Start. Guadalupe Cuesta Director, National Migrant and Seasonal Head Start Collaboration Office
 Migrant and Seasonal Head Start Guadalupe Cuesta Director, National Migrant and Seasonal Head Start Collaboration Office The Migrant Seasonal Head Start (MSHS) program is one of the largest community based
By 1970 immigrants from the Americas, Africa, and Asia far outnumbered those from Europe. CANADIAN UNITED STATES CUBAN MEXICAN
 In Search of the American Dream After World War II, millions of immigrants and citizens sought better lives in the United States. More and more immigrants came from Latin America and Asia. Between 940
Candidate Faces and Election Outcomes: Is the Face-Vote Correlation Caused by Candidate Selection? Corrigendum
 Quarterly Journal of Political Science, 2010, 5: 99 105 Corrigendum Candidate Faces and Election Outcomes: Is the Face-Vote Correlation Caused by Candidate Selection? Corrigendum Matthew D. Atkinson, Ryan
Admitting Foreign Trained Lawyers. National Conference of Bar Examiners Washington, D.C., April 15, 2016
 Admitting Foreign Trained Lawyers National Conference of Bar Examiners Washington, D.C., April 15, 2016 Professor Laurel S. Terry Carlisle, Pennsylvania LTerry@psu.edu Overview of Remarks Why this issue
Graduation and Retention Rates of Nonresidents by State
 Graduation and Retention Rates of Nonresidents by State March 2011 Highlights: California, Illinois, and Texas are the states with the largest numbers of nonresidents. Students from Ohio and Wyoming persist
THE LEGISLATIVE PROCESS
 THE LEGISLATIVE PROCESS (and a few other things) Gary Moncrief University Distinguished Professor of Political Science Boise State University NEW LEADERSHIP IDAHO 2016 Lets start with a few other things
Gun Laws Matter. A Comparison of State Firearms Laws and Statistics
 Gun Laws Matter A Comparison of State Firearms Laws and Statistics Some states have stepped in to fi ll the gaping holes in our nation s gun laws; others have done almost nothing. In this publication,
Key Factors That Shaped 2018 And A Brief Look Ahead
 Key Factors That Shaped 2018 And A Brief Look Ahead November 2018 Bill McInturff SLIDE 1 Yes, it was all about Trump. SLIDE 2 A midterm record said their vote was a message of support or opposition to
Effective Dispute Resolution Systems and the Vital Role of Stakeholders
 Effective Dispute Resolution Systems and the Vital Role of Stakeholders Region 4 PTAC Summer Working Meeting June 24-25, 2015 Traverse City, Michigan Philip Moses Associate Director The human brain is
A contentious election: How the aftermath is impacting education
 Amy L Dagley, Ph.D. University of Alabama Birmingham Brittany Larkin, Ph.D. Auburn University ELA Annual Conference, San Diego, 2017 A contentious election: How the aftermath is impacting education Each
CIRCLE The Center for Information & Research on Civic Learning & Engagement
 FACT SHEET CIRCLE The Center for Information & Research on Civic Learning & Engagement The Youth Vote in the 2008 Super Tuesday States: Alabama, Arizona, Arkansas, California, Connecticut, Georgia, Illinois,
RIDE Program Overview
 RIDE Program Overview Region IV Annual Conference May 2017 Table of Contents 1 2 3 Program Overview and the E-Verify Process Fact and Fiction Filling a Critical Gap and a Glance at Identity Fraud? 4 RIDE
COMPARISON OF ABA MODEL RULE FOR PRO HAC VICE ADMISSION WITH STATE VERSIONS AND AMENDMENTS SINCE AUGUST 2002
 As of January 26, 2017 2017 American Bar Association AMERICAN BAR ASSOCIATION CENTER FOR PROFESSIONAL RESPONSIBILITY CPR POLICY IMPLEMENTATION COMMITTEE COMPARISON OF ABA MODEL RULE FOR PRO HAC VICE ADMISSION
THE TARRANCE GROUP. BRIEFING MEMORANDUM To: Interested Parties. From: Ed Goeas and Brian Nienaber. Date: November 7, 2006
 THE TARRANCE GROUP BRIEFING MEMORANDUM To: Interested Parties From: Ed Goeas and Brian Nienaber Date: November 7, 2006 Re: Key findings from a recent national study on Methodology These findings come from
Presentation Outline
 2016 Elections November 10, 2016 Grant Couch, Director, Government Relations Christina Lavoie, JD, Assistant Director, Public Policy and Operations Jamie Miller, MBA, Director, Government Relations Presentation
FSC-BENEFITED EXPORTS AND JOBS IN 1999: Estimates for Every Congressional District
 FSC-BENEFITED EXPORTS AND JOBS IN 1999: Estimates for Every Congressional District Prepared for National Foreign Trade Council July 2, 2002 National Economic Consulting FSC-BENEFITED EXPORTS AND JOBS IN
Bylaws of the Prescription Monitoring Information exchange Working Group
 Bylaws of the Prescription Monitoring Information exchange Working Group ` Table of Contents Table of Contents... 2 Article I. Introduction... 6 Article II. Purpose... 6 Article III. Membership... 6 Article
WHAT IS THE PROBABILITY YOUR VOTE WILL MAKE A DIFFERENCE?
 WHAT IS THE PROBABILITY YOUR VOTE WILL MAKE A DIFFERENCE? ANDREW GELMAN, NATE SILVER and AARON EDLIN One of the motivations for voting is that one vote can make a difference. In a presidential election,
14 Pathways Summer 2014
 14 Pathways Summer 2014 Pathways Summer 2014 15 Does Immigration Hurt the Poor? By Giovanni Peri The United States has a famously high poverty rate. In recent years, the Great Recession and the slow recovery
DONATE. From: DNC Rapid Response Subject: Donald Trump's Supreme Court pick? Date: July 19, 2016 at 9:06 PM To:
 From: DNC Rapid Response democraticparty@democrats.org Subject: Donald Trump's Supreme Court pick? Date: July 19, 2016 at 9:06 PM To: Mitch McConnell and Senate Republicans have obstructed progress at
Briefing ELECTION REFORM. Ready for Reform? After a day of chaos, a month of uncertainty and nearly two years of INSIDE. electionline.
 ELECTION REFORM Briefing March 2003 INSIDE Introduction............. 1 Executive Summary........3 Key Findings............. 5 Maps................... 9 Snapshot of the States..... 14 Methodology/Endnotes...17
NATIONAL VOTER SURVEY. November 30 December 3, 2017 N = 1,200 respondents (1/3 Landline, 1/3 Cell, 1/3 Internet) margin of error: +/- 2.
 margin of error: +/- 2.") NATIONAL VOTER SURVEY N = 1,200 respondents (1/3 Landline, 1/3 Cell, 1/3 Internet) margin of error: +/- 2.83% 1 For reference: the 2018 map. When we refer to competitive 2018 Senate states, we are referring
NATIONAL VOTER SURVEY N = 1,200 respondents (1/3 Landline, 1/3 Cell, 1/3 Internet) margin of error: +/- 2.83% 1 For reference: the 2018 map. When we refer to competitive 2018 Senate states, we are referring
Reporting and Criminal Records
 A project funded by U.S. Department of Labor and U.S. Department of Justice Reporting and Criminal Records Considerations for Writing about People Who Have Criminal Histories June 13, 2018 Presenters Corinne
How States Can Achieve More Effective Public Safety Policies
 How States Can Achieve More Effective Public Safety Policies Arkansas Legislative Criminal Justice Oversight Task Force and Behavioral Health Treatment Access Task Force July 13, 2015 Marc Pelka, Deputy
VOCA 101: Allowable/Unallowable Expenses Janelle Melohn, IA Kelly McIntosh, MT
 VOCA 101: Allowable/Unallowable Expenses Janelle Melohn, IA Kelly McIntosh, MT While you re waiting, please visit pollev.com/iowaagcvad so you can participate in this presentation from your phone. Overview
dcollege investigation. My dstuden students prior knowl-
 mathematical explorations classroom-ready activities The Electoral College Kimberly A. Markworth and Lara M. Willox Edited by gwen Johnson, gwendolyn.johnson@unt.edu, University of North Texas, Dallas,
Supreme Court Decision What s Next
 Supreme Court Decision What s Next June 3, 2015 Provided by Avalere Disclaimer Organizations may not re use material presented at this AMCP webinar for commercial purposes without the written consent of
RULE 4.2: COMMUNICATION WITH PERSON REPRESENTED BY COUNSEL
 American Bar Association CPR Policy Implementation Committee Variations of the ABA Model Rules of Professional Conduct RULE 4.2: COMMUNICATION WITH PERSON REPRESENTED BY COUNSEL In representing a client,
A Nation Divides. TIME: 2-3 hours. This may be an all-day simulation, or broken daily stages for a week.
 910309g - CRADLE 1992 Spring Catalog Kendall Geer Strawberry Park Elementary School Steamboat Springs, Colorado Grade Level - 5-9 A Nation Divides LESSON OVERVIEW: This lesson simulates the build up to
Background and Trends
 Background and Trends Kim English, Division of Criminal Justice Colorado Commission on Criminal and Juvenile Justice February 10, 2017 CCJJ / 02-10-2017 1/14 CCJJ / 02-10-2017 2/14 CCJJ / 02-10-2017 3/14