Improving and evaluating survey instruments
|
|
|
- Maximillian Hancock
- 5 years ago
- Views:
Transcription

1 Improving and evaluating survey instruments Survey embedded experiments using on line panels Lisa Kareliusson [SOM report no. 2011:31]
2
3 Improving and evaluating survey instruments: Survey embedded experiments using on line panels LISA KARELIUSSON Background Since 1986, the SOM Institute the University of Gothenburg conducts annual mail surveys in Sweden and in Swedish regions. Representative samples of people aged years are asked questions about their media habits, leisure habits and their attitudes on different social issues. Several research projects are involved in the surveys and leading scholars in the Swedish social sciences appear in the books that the SOM Institute annually publishes. The annual surveys also provide descriptions of long-term trends based on previous studies. The Institute s analyses are often referred to in the public debate and can be considered to have a great impact on many levels of the society. Collection of data suitable for longitudinal comparisons requires continuous development work. Therefore, all surveys need to be carefully scrutinized and the quality of data continuously evaluated. In addition, it is the ambition of the SOM Institute to contribute to a general development of research methods and survey research. The SOM Institute is constantly trying to improve its work, its current methods are always subject to improvement, and new ones are continuously tested. Since a great deal of the collected data must be comparable over time, many questions need to be similarly formulated over the years. Yet, the surrounding society and people at large are constantly changing, implying that the SOM Institute must constantly revise the survey questions. In this work, methodological experiments for validating and constructing survey instruments are becoming increasingly important. This report is a part of this on-going process. The ultimate goal is to have all new survey instruments thoroughly pretested before they appear in a regular SOM-survey. In this aim the SOM-institute participated with a series of methodological split ballot experiments in a panel study called The Citizen Panel (M-panelen) in spring Through a methodological experiment it is possible to, for example, impose how the use of single words and turns of phrase or a different use of items in a survey question may, if circumstances are right, affect the answers and valuations (see f c Schuman & Presser 1996). With this knowledge it becomes possible to develop survey questions and examine how they affect the answers in order to improve the research methods and the surveys. This paper examines the outcomes and the conclusions of a series of methodological experiments that were embedded in a websurvey to an on line panel of respondents participating in the University of Gothenburg s Citizen panel. 1
4 Design The results are based on survey-embedded experiments which were included in a larger survey (M-panelen/ The Citizen Panel) where the respondents also got additional questions of various issues. In this report four sets of questions from the methodological test will be examined. The experiments reflect a general interest in how different formulations of survey questions affect the respondent s answers. The survey instruments examined in this report deals with four general areas. These areas are a) attitudes to cities in Sweden, b) attitudes to refugees, c) questions about siblings and finally a question that can still be considered to be controversial in a Swedish context, d) what sexual orientation the respondents have. The first three tests (a-c) were standard split-ballot experiments while the fourth test (d) can be characterized as an evaluation of how the survey question on sexual orientation was perceived by the respondents. The survey questions were designed and formulated by the SOM Institute and the practical work of transferring the questions to the web survey and to send out the survey and collect data was all conducted by the Laboratory of Opinion Research (LORe) at the University of Gothenburg. Data for the study were gathered via web-questionnaires which was sent out to participators of the Citizen Panel in April Most of the questions were followed by fixed alternatives, with accompanying boxes for respondents to fill in (see appendix 2). Population and sample The methodological test conducted by the SOM Institute included a total of randomly selected people from the Citizen Panel s participants, which in total consists of about respondents (Dahlberg, S et.al 2010 and Dahlberg, S et.al 2011). These respondents where then randomly assigned into ten groups of 200 respondents each. These groups then received different questions or variations of questions or items that were included in the methodological tests. By comparing the different groups results it becomes possible to investigate how small changes in wording can affect the understanding and valuation of an issue. This paper examines the results of the methodological tests and focuses on how and if the answers changed depending on the phrasing of the survey questions, items or response alternatives. It also examines how the respondents managed to answer the questions, if there were any problems understanding the questions and how to answer them. The focus of the report will therefore be on how the questions worked and how changes in question format influence the answers. 2
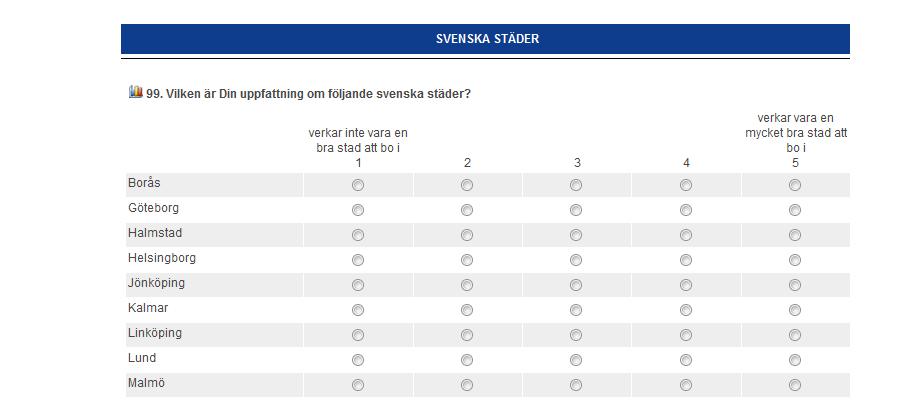
5 Results Test 1. Popularity measurement of Swedish cities The first methodological test was designed to test how questions about attitudes to various Swedish cities work. We wish to develop a measure of the popularity of Swedish cities in order to invite more research on creative cities, and how cities may work to be more appealing to the creative class, i.e. in line with the thoughts of Richard Florida and others. This first test mainly aimed to analyze how, if at all, the respondents valuations were affected by how the scale was graded. The question the respondents received was simply What is your opinion on the following cities? and below the question there were sixteen of the largest cities in Sweden which the respondents were supposed to evaluate (in two groups of eight presented on two different web survey pages). The sample was here divided into two groups (split ballot randomized), group A and group B with 200 respondents in each group. Respondents in both groups were then asked to evaluate the cities along a 5-point scale running from 1 to 5. The experimental variation was a small difference in the phrasing of the end points of the scale. The difference lies in the upper end of the scale ( 5 ) where the word very was included in the scale for group B. The two different scales were A) Does not seem to be a good city to live in to seems to be a good city to live in and B) Does not seem to be a good city to live in to seems to be a very good city to live in. Findings On the question on how respondents value different cities the methodological test shows that the answers are slightly different depending on the scale. By making a comparison between the two groups (Group A and Group B) to see how they valued the various cities it is possible to recognize some differences. As the chart below illustrates Group A tend to value the cities higher than group B in general do. 3
6 Percentage that answered fairly good or good/very good Östersund Örebro Västerås Uppsala Umeå Sundsvall Stockholm Malmö Lund Linköping Kalmar Jönköping Helsingborg Halmstad Göteborg Borås Group B Group A The chart illustrates how many of the respondents, in % who valued the cities as fairly good or good/very good. The different scales between group A and B: A) 1=Does not seem to be a good city to live in, 5 = Seems to be a good city to live in, B) 1 = Does not seem to be a good city to live in, 5 =Seems to be a very good city to live in. Not only did Group B evaluate the cities more carefully when it came to the upper scale. The experiment also showed that there are differences at the lowest point of the scale. To some extent group B seems to evaluate cities fairly bad or bad in a greater extent than group A do (see chart 1 in appendix).this becomes clear when an analysis is made of the mean of the two groups evaluations. As the figure below illustrates, the mean is lower in group B than in group A on almost every city. This gives an indication that when the scale includes very on the highest point of the scale respondents tend to get more cautious in their valuation. 4
7 Mean valuations of the cities Östersund 2,9 3,0 Örebro 2,8 3,0 Västerås 2,9 2,9 Uppsala 3,5 3,6 Umeå 3,0 3,3 Sundsvall 2,8 3,0 Stockholm 3,4 3,4 Malmö 2,9 2,7 Lund 3,5 3,7 Linköping 3,2 3,4 Kalmar 3,0 3,2 Jönköping 2,8 2,9 Helsingborg 3,3 3,3 Halmstad 3,3 3,4 Göteborg 3,5 3,7 Borås 2,9 2,8 0,0 0,5 1,0 1,5 2,0 2,5 3,0 3,5 4,0 Group B Group A We now return to the primary question of whether the different scaling affected the evaluations of the cities. All in all the results indicate that there indeed are differences in the answers in the two groups. Not only, Group A tend to choose the highest scale in a greater extent they were also less likely to give low points in some extent. But one should not exaggerate the results since the significant is relatively low. All in all, the experiment on the valuation of Swedish cities was not instantaneously, to be specific the results were just significant on two cities, namely Västerås and Örebro (see table 1 in appendix A). A cautious conclusion can thus be drawn; the results indicate that the phrasing of the end points on the rating scale affects, in some extent, respondents evaluations of Swedish cities. Criteria for evaluations The respondents also got a follow-up question on what they take into account in their evaluation of the cities. This was of interest in order to get more information on how to formulate future questions and items on the subject. There was a few central themes which were mentioned several times and therefore can be interesting in the analysis of how and what a question regarding valuations of cities should include. The most common topics that the respondents said formed their evaluation of the cities were: the labor market, surroundings i.e. nature and water, communications, a wide cultural selection, proximity to universities, good health and social care, low crime rate, good environment for business and enterprises. These answers help us to formulate questions in the future, especially if we want to construct a closed end follow up question on what factors respondents regard as important when choosing 5
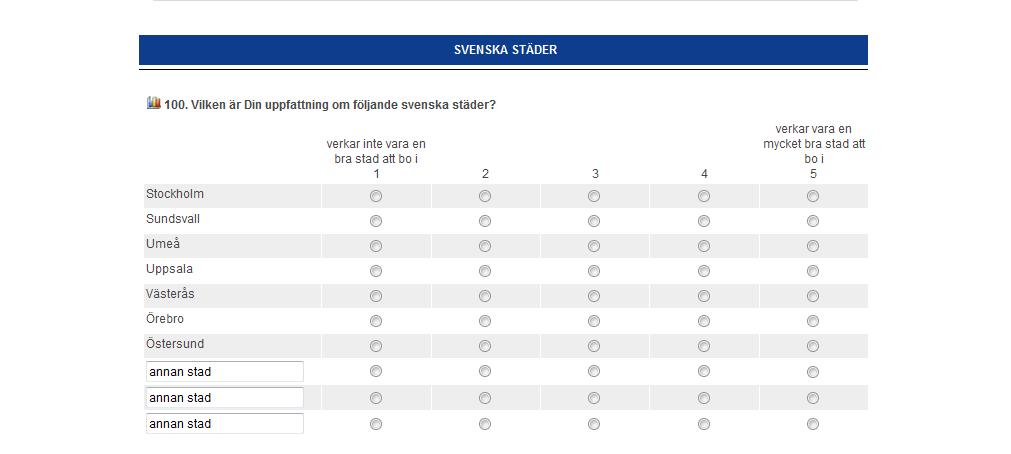
8 what city to live in. The topics mentioned above could be used to form items in the future, just to name one possible use. Additional cities Since one aim of the test was to examine how the question of the cities works and how it best could be formed it is also interesting to analyze what cities that seemed to be missing in the list, since there is a possibility that more cities should be included. There were a few cities that occurred several times on the alternative other city, these were Trollhättan, Gävle, Karlstad, Eskilstuna, Luleå and Uddevalla. However, these responses may have been shaped by the fact that a large part of the panel participants actually live in these cities. We have long known that some regions are over-represented in the MOD/LORe Citizen panel and some of the cities mentioned above are situated in these regions. It could also be interesting to analyze how the respondents valuated cities that they suggested themselves, in the field other city (See appendix B). A trend in the answers is that both groups tended to mention cities they valuated high and very few mentioned cities they valuated low. Comments At the end of the survey the respondents were asked to leave their comments on the questionnaire and there were some who commented on the block concerning Swedish cities. A recurring comment was that it was difficult to answer the question since it was unclear what the question actually was referring to. There were a number of respondents who claimed that they needed more information on what aspects they were supposed to base their evaluations on. It simply seems as the question in some extent was too broad to understand. In addition, there were a few respondents who said that they had never been in the city, or simply knew too little about it, which made it difficult to comment on it. An analysis of the comments from the respondents shows that they experienced some difficulties in answering the question since they did not understand how they were supposed to rate the cities and what they should take into account when they value a city. This indicates that it is important to specify the question in some way. One way to solve this problem could be by using the results from this methodological test and make use of items like the various topics mentioned above. 6
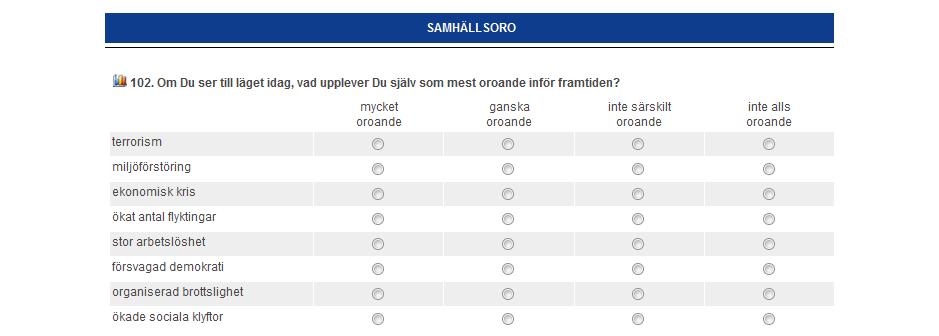
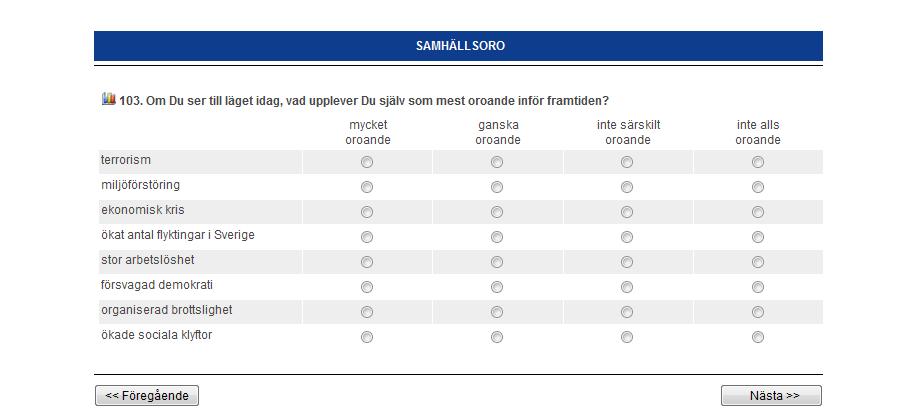
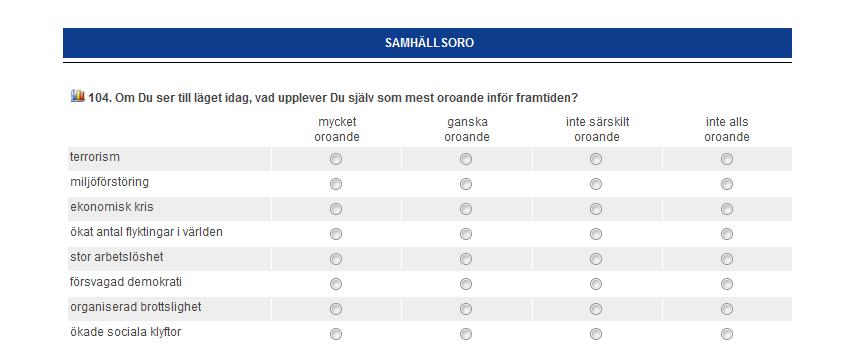
9 Test 2. Anxieties The second test aimed to examine how just a change of wording and additional clarifications in one item can affect the respondents attitudes regarding refugees. The main question was Given the situation today, what do you experience being most worrying for the future? For this aim the sample was divided into three different groups (33/33/33 split ballot method experiment), with 200 respondents in each group. Each group got different variations of one item (item 4). The different variations of the items were: Increased amount of refugees, increased amount of refugees in Sweden, increased amount of refugees in the world. Except from this change all other items were exactly the same for all the groups. The other items were the following: terrorism, pollution, economic crisis, wide spread unemployment, weakened democracy, organized crime and increase in social inequality. The respondents were then asked to evaluate these various items on a scale from very anxious, quite anxious, not so anxious to not anxious at all. The aim of the test was to inform the scholars linked to the SOM Institute whether respondents make different evaluations of their anxiety depending on shift of perspective. It was also of interest to examine which of the various formulations of the item that resulted in the highest and lowest percent worried respondents. Findings As the figure below illustrates there was a great difference in the answers depending on the formulation of the item. The result of the test shows that the group that got the most specific and close-to-themselves item (increased amount of refugees in Sweden) were least likely to state they were worried or fairly worried. "Given the situation today, what do you experience being worrying for the future?" ,6 Increased amount of refugees 39 Increased amount of refugees in Sweden 77,1 Increased amount of refugees in the world The figure illustrates how many of the respondents, in percent, that has stated that they are fairly worried or worried. Most striking is the large difference between the two first groups and the group that got the item stressing an increased amount of refugees in the world, where almost 80 % were worried 7
10 in some degree. The point estimate is almost twice as high compared to the proportion of panelists that, in some extent, was worried of an increased amount of refugees in Sweden. Most worrying is an increased amount of refugees in the world whereas only 39 percent of the respondents are worried by an increased amount of refugees in Sweden. The results of the test show that the formulation of the items affects how worried the respondents say they are regarding the question of refugees. There is a significant difference in responses between the group receiving the item increased number of refugees in the world (n=170) and the group receiving the item increased number of refugees (N=125) were 49 % of the respondents compared to 77 % indicated that they were very or quite worried (p=<0,001). Likewise, it is a significant difference in responses between the group receiving the item increased number of refugees in Sweden (n=159) and the group receiving the item increased number of refugees in the world in which only 39% indicated that they were very or quite worried (see chart 2 in appendix). To investigate how reliable these results are it can also be fruitful to analyze the differences between the groups on other items in the question. When it comes to the question of terrorism all three groups valuate their worriedness very similar to each other (49,6 percent/50,6 percent/47,6 percent). The same is the case of pollution where no distinctive differences can be found between the three groups (12 percent/13,7 percent/16,4 percent). This indicates that the big differences in the answers about refugees were more because of the shift of perspective in the items than because of other differences between the groups. There was only one single comment after this question which is interesting in this matter. Slightly amusing a respondent took up the fact that the question did not specify where the influx of refugees would increase which made it difficult to answer the question. This respondent had been received the item that was very broad formulated (Increased amount of refugees) which also is the one used in the surveys at present. Although the purpose of the methodological test was to examine how the responses were affected by the change of wording in the first place it also flow into new knowledge on other aspects of the issue which can be of help in coming surveys. As the test illustrates it really does matter, at least in this case, how the questions are formulated. Regarding the issue of refugees the results are also interesting. What does it mean that people are worried about more refugees in the world? What do they read in to that? War? Natural disasters? This is not something we can know anything about from the test but could be an interesting to test in upcoming waves of the Citizen panel. 8
11 Test 3. Siblings The next experiment concerned two versions of a survey instrument about respondents siblings. This block was divided into a number of sub queries and was sent to 200 respondents who all got the same questions. This experiment was more a test of a new type of question in order to analyze how it works. For this aim the analysis of the answers will include details regarding the response rate and how the respondents managed to answer the question, i.e. if they understood the question and the guidelines. Findings The first question the respondents got was did you grow up with one or more siblings? (the answer alternatives were yes or no). According to the results 56,5 percent of the respondents had one or more siblings. This first question seemed to be the easiest to answer and of 200 respondents 154 answered, the response rate was thus 77 percent. However, this question was not in focus, but it can serve as a help for subsequent questions and not least as an analytical tool. Thereafter the respondents who answered yes were asked to enter year of birth and gender for each of the siblings they grew up with. As the italics indicate it was the siblings they have lived together with that was in focus. The question was followed by five rows where the respondents could fill in birth date and gender for each sibling (See appendix B). The figure below illustrates the results of how many siblings the respondents have and the results seem to be reasonable when it comes to how the answers were distributed between the number of siblings Average score, number of siblings in percent Sibling 2 Siblings 3 siblings 4 siblings 5 siblings The test also revealed some difficulties and what details that has to be improved. The main purpose of the methodological test was, as mentioned before, to test if the respondents were able to answer the question. All of the 134 respondents who said that they have one or more siblings on the first question also filled in the birth date on the first row and all but one also filled in the gender on the second question. 9
12 One problem that appeared was that there were a number of respondents who did not seem to understand that they were supposed to rank the siblings in chronological order and where to put themselves. This indicates that a more detailed introduction text may be necessary. In the survey there were fixed options for the year of birth in a scale from Before 1910 to The experiment made it clear that it at least should be an option for later than since there was a number of respondents who could not answer the question correctly since they had siblings born later than Another conclusion drawn from the results is that there should be more than five rows, since there was a small number of respondents who stated that they had more than five siblings and therefore was not able to answer the question fully. 10
13 Test 4. Sexual orientation The question about sexual orientation is interesting to test in various means since it can be considered to be a sensitive and most personal issue. Therefore, a cautious test was carried out to investigate in what extent the respondents were likely to answer the question and perhaps above all to see the respondents reactions. A group of 200 respondents got the question What is your sexual orientation with following answer alternatives: heterosexual, homosexual, bisexual, other (please specify), or just fill in the I do not want to answer alternative. In the purpose of not being too distinctive, the question was asked in connection with other background questions and was carefully placed not to let it be shown alone on its own page in the survey (see appendix B). The title of the block was thus "a few questions about yourself" and as a beginning the respondents were asked about their education to prevent the question about sexual orientation to become too protruding. Findings The methodological test of this question signals that it seems to be no overhanging difficulties in asking about the sexual orientation, at least not in an elite panel as the MOD/LORe Citizen panel. The response rate on the question is somewhat lower compared to random selected questions as it is 70 % compared to around 77 % on the other questions. In the same manner the results give no signs of that the respondents did not want to answer. As the table below illustrates only 5 % of the respondents said they did not want to answer. Heterosexual 87,9% Homosexual 2,9% Bisexual 4,3% I do not want to answer 5,0% It may also be interesting to see how the responses are distributed among different age group. The table below illustrates how different age groups have answered the question. However, the groups are of very different size why the results are reported in exact number instead of percent since comparisons between the groups would be biased. As illustrated in the table none of the groups answers that stand out much from the other and not any of the groups that was more likely to refrain from responding. Age Heterosexual Homosexual Bisexual Do not want to answer n Furthermore, the reactions on the question were not so many as the research team first thought it would be and the reactions were fewer and actually more mixed than expected. Since it was mainly the reactions that were in focus of the methodological test it was more the comments in the comment fields that was of interest than the actual answers on the question and therefore these will 11
14 be in focus here. There were too few comments to make any conclusions of how the respondents in general reacted on the question. But the fact that there were so few comments could also indicate that most of the respondent did not react in either a positive or negative way on this question. Among the comments there were some who indicated that they did not know what sexual orientation they had or that there is not something static. One conclusion one can draw from this is that there could be fruitful to add an alternative for I am unsure of my sexual orientation, which has been used elsewhere (see Livsvillkor och hälsa bland unga homo- och bisexuella resultat från nationella folkhälsoenkäten, Folkhälsoinstitutet). Precisely because of this it may also be good to have an option for other for those who feel they do not fit in in any of the other alternatives. One comment was formulated as a question which stressed that it is an irrelevant question which just aimed to categorize people. One similar comment stressed that the sexual orientation could not be of any relevance for the other answers. This indicates that it also seems to be important to have a clear aim with the question of sexual orientation to refer to. Final words The methodological tests yielded highly variable results, some more easily analyzed and conclusive than others. However, it becomes clear that the methodological tests contribute to new knowledge, which in turn can contribute to new and better questions, or to the confirmation of the old ones. This new knowledge can in turn lead to improvements in research and hopefully to new and exciting questions to illuminate different social issues. 12
15 References Dahlberg, S et.al (2010) The 2010 Internet Campaign Panel. MOD Working Paper Series 2010: _1---the-2010-internet-panel---dahlberg-et-al.pdf Dahlberg, S et.al (2011) Documentation version Multidisciplinary Opinion and Democracy Research Group, University of Gothenburg. Schuman, H & Presser, S (1996). Questions & answers in attitude surveys. Thousand Oaks, CA: Sage. Statens folkhälsoinstitut. Livsvillkor och hälsa bland unga homo- och bisexuella. 13
 not so anxious not anxious at all (%) N (102) Increased amount of refugees 49,6 50,4 125 (103) Increased amount of refugees in Sweden (104) Increased amount of")
16 Appendix A In this appendix charts and tables referred to in the text is illustrated. Chart 1 The chart illustrates how many percent of the groups that valued the cities as bad or fairly bad. Chart 2 Very+ quite anxious (%) not so anxious not anxious at all (%) N (102) Increased amount of refugees 49,6 50,4 125 (103) Increased amount of refugees in Sweden (104) Increased amount of refugees in the world 39,0 61, ,1 22,9 170 The difference between (102) and (103) is not significant (Sig. 0,074) The difference between (102) and (104) is significant at the 99%-level (Sig. 0,000) The difference between (103) and (104) is significant at 99%-level (Sig. 0,000) 14
17 Table 1: Valuations of the cities Group A Group B A) B) Sum n Sum n Sig XA XB Sig Borås ,86 2,83 2,9 0,292 Göteborg ,23 3,74 3,54 0,493 Halmstad ,605 3,35 3,33 0,34 Helsingborg ,98 3,33 3,27 0,726 Jönköping ,074 2,94 2,79 0,035 Kalmar ,234 3,22 2,99 0,214 Linköping ,704 3,35 3,19 0,681 Lund ,479 3,7 3,54 0,649 Malmö ,16 2,71 2,89 6,82 Stockholm ,84 3,35 3,37 0,308 Sundsvall ,087 3,01 2,81 0,961 Umeå ,173 3,29 3,01 0,275 Uppsala ,299 3,62 3,46 0,354 Västerås ,02 2,9 2,87 0,034 Örebro ,016 3,01 2,75 0,323 Östersund , ,8 4, ,686 3,04 2,87 0,853 15


18 Appendix B The questions in the web-survey In this part of appendix all questions that were asked in the methodlogical test are illustrated eactly the way they were designed in the web-survey. 16
19 17
20 18

21 19
22 The SOM Institute at the University of Gothenburg conducts yearly national and local surveys in Sweden, and gives seminars on Society, Opinion and Media. The SOM Institute Seminariegatan 1B Po box 710, SE Gothenburg, Sweden
Summary. See OECD (2013). 6. See Statistics Sweden (2015). 7. See Swedish Migration Agency (2015).
. 6. See Statistics Sweden (2015). 7. See Swedish Migration Agency (2015).") Summary In 2015, more than 1.5 million people more than 16 per cent of Sweden s total population were born in another country. In addition, more than 700 000 people who were born in Sweden have at least
Summary In 2015, more than 1.5 million people more than 16 per cent of Sweden s total population were born in another country. In addition, more than 700 000 people who were born in Sweden have at least
How s Life in Sweden?
 How s Life in Sweden? November 2017 On average, Sweden performs very well across the different well-being dimensions relative to other OECD countries. In 2016, the employment rate was one of the highest
Court statistics 2018 Official statistics of Sweden
 Court statistics 2018 Official statistics of Sweden 551 81 Jönköping Visiting address: Kyrkogatan 34 Telephone: +46-36-15 53 00 Fax: +46-36-16 57 21 domstolsverket@dom.se www.domstol.se Opening hours:
Court statistics 2015 Official statistics of Sweden
 Court statistics 2015 Official statistics of Sweden 551 81 Jönköping Visiting address: Kyrkogatan 34 Telephone: +46-36-15 53 00 Fax: +46-36-16 57 21 domstolsverket@dom.se www.domstol.se Opening hours:
Court statistics official statistics of Sweden 2010
 Court statistics official statistics of Sweden 2010 551 81 Jönköping Besöksadress: Kyrkogatan 34 Telefon: 036-15 53 00 Fax: 036-16 57 21 domstolsverket@dom.se www.domstol.se Expeditionstid: Måndag-fredag
Georg Lutz, Nicolas Pekari, Marina Shkapina. CSES Module 5 pre-test report, Switzerland
 Georg Lutz, Nicolas Pekari, Marina Shkapina CSES Module 5 pre-test report, Switzerland Lausanne, 8.31.2016 1 Table of Contents 1 Introduction 3 1.1 Methodology 3 2 Distribution of key variables 7 2.1 Attitudes
Segregation and Employment in Swedish Regions
 Segregation and Employment in Swedish Regions Bachelor s thesis within economics Author: Heda Saijeva Tutor: Lars Pettersson Sofia Wixe Jönköping Spring 2011 Bachelor s Thesis in Economics Title: Author:
The Rights of the Child. Analytical report
 Flash Eurobarometer 273 The Gallup Organisation Analytical Report Flash EB N o 251 Public attitudes and perceptions in the euro area Flash Eurobarometer European Commission The Rights of the Child Analytical
Court statistics 2017 Official statistics of Sweden
 Court statistics 2017 Official statistics of Sweden 551 81 Jönköping Visiting address: Kyrkogatan 34 Telephone: +46-36-15 53 00 Fax: +46-36-16 57 21 domstolsverket@dom.se www.domstol.se Opening hours:
SWEDISH TRENDS Henrik Oscarsson & Annika Bergström (ed.)
") SWEDISH TRENDS 1986 215 Henrik Oscarsson & Annika Bergström (ed.) Contents SOCIAL TRENDS Assessment of Swedish economy 4 Assessment of personal financial situation 5 Confidence in institutions: Police
SWEDISH TRENDS 1986 215 Henrik Oscarsson & Annika Bergström (ed.) Contents SOCIAL TRENDS Assessment of Swedish economy 4 Assessment of personal financial situation 5 Confidence in institutions: Police
Submission by Save the Children Sweden related to the Human Rights Council Universal Periodical Review of Sweden 2010
 Submission by Save the Children Sweden related to the Human Rights Council Universal Periodical Review of Sweden 2010 Introduction Save the Children Sweden took an active part in the reporting process
Country Reports Nordic Region. A brief overview about the Nordic countries on population, the proportion of foreign-born and asylum seekers
 Country Reports Nordic Region A brief overview about the Nordic countries on population, the proportion of foreign-born and asylum seekers Nordic collaboration for integration of refugees and migrants
How s Life in France?
 How s Life in France? November 2017 Relative to other OECD countries, France s average performance across the different well-being dimensions is mixed. While household net adjusted disposable income stands
The Rights of the Child. Analytical report
 The Gallup Organization Flash EB N o 187 2006 Innobarometer on Clusters Flash Eurobarometer European Commission The Rights of the Child Analytical report Fieldwork: February 2008 Report: April 2008 Flash
Plan against discrimination
 Plan against discrimination Disposition Page. Introduction 1 Work against discrimination 5 A labour market free from discrimination 9 A housing market free from discrimination 13 A school free from discrimination
On the dynamics of segregation
 On the dynamics of segregation Matz Dahlberg Peter Fredriksson Jordi Jofre-Monseny June 2011 Abstract: Card et al (2008a) formalize a model of ethnic residential segregation where an ethnically mixed neighborhood
Telephone Survey. Contents *
 Telephone Survey Contents * Tables... 2 Figures... 2 Introduction... 4 Survey Questionnaire... 4 Sampling Methods... 5 Study Population... 5 Sample Size... 6 Survey Procedures... 6 Data Analysis Method...
Attitudes towards the EU in the United Kingdom
 Flash Eurobarometer European Commission Attitudes towards the EU in the United Kingdom Analytical Report Fieldwork: January 200 Publication: May 200 Flash Eurobarometer 203 The Gallup Organization This
How s Life in the Netherlands?
 How s Life in the Netherlands? November 2017 In general, the Netherlands performs well across the OECD s headline well-being indicators relative to the other OECD countries. Household net wealth was about
Refugee Immigration and Media Consumption
 Refugee Immigration and Media Consumption Eleonora Freddi CentER, Tilburg University SNS Mötesplats Integration, Oct 17th 2017 Refugee crisis Figure: Number of asylum seekers per 1000 inhabitants in EU
How s Life in the Czech Republic?
 How s Life in the Czech Republic? November 2017 Relative to other OECD countries, the Czech Republic has mixed outcomes across the different well-being dimensions. Average earnings are in the bottom tier
Italy s average level of current well-being: Comparative strengths and weaknesses
 How s Life in Italy? November 2017 Relative to other OECD countries, Italy s average performance across the different well-being dimensions is mixed. The employment rate, about 57% in 2016, was among the
Data Protection in the European Union. Data controllers perceptions. Analytical Report
 Gallup Flash Eurobarometer N o 189a EU communication and the citizens Flash Eurobarometer European Commission Data Protection in the European Union Data controllers perceptions Analytical Report Fieldwork:
The European Emergency Number 112
 Gallup 2 Flash Eurobarometer N o 189a EU communication and the citizens Flash Eurobarometer European Commission The European Emergency Number 112 Summary Fieldwork: January 2008 Publication: February 2008
How s Life in Portugal?
 How s Life in Portugal? November 2017 Relative to other OECD countries, Portugal has a mixed performance across the different well-being dimensions. For example, it is in the bottom third of the OECD in
How s Life in Ireland?
 How s Life in Ireland? November 2017 Relative to other OECD countries, Ireland s performance across the different well-being dimensions is mixed. While Ireland s average household net adjusted disposable
How s Life in Australia?
 How s Life in Australia? November 2017 In general, Australia performs well across the different well-being dimensions relative to other OECD countries. Air quality is among the best in the OECD, and average
How s Life in Mexico?
 How s Life in Mexico? November 2017 Relative to other OECD countries, Mexico has a mixed performance across the different well-being dimensions. At 61% in 2016, Mexico s employment rate was below the OECD
Chile s average level of current well-being: Comparative strengths and weaknesses
 How s Life in Chile? November 2017 Relative to other OECD countries, Chile has a mixed performance across the different well-being dimensions. Although performing well in terms of housing affordability
How s Life in the Slovak Republic?
 How s Life in the Slovak Republic? November 2017 Relative to other OECD countries, the average performance of the Slovak Republic across the different well-being dimensions is very mixed. Material conditions,
CSES Module 5 Pretest Report: Greece. August 31, 2016
 CSES Module 5 Pretest Report: Greece August 31, 2016 1 Contents INTRODUCTION... 4 BACKGROUND... 4 METHODOLOGY... 4 Sample... 4 Representativeness... 4 DISTRIBUTIONS OF KEY VARIABLES... 7 ATTITUDES ABOUT
EUROBAROMETER 67 PUBLIC OPINION IN THE EUROPEAN UNION SPRING This survey was requested and coordinated by Directorate-General Communication.
 Standard Eurobarometer European Commission EUROBAROMETER 67 PUBLIC OPINION IN THE EUROPEAN UNION SPRING 2007 NATIONAL REPORT Standard Eurobarometer 67 / Spring 2007 TNS Opinion & Social EXECUTIVE SUMMARY
How s Life in Switzerland?
 How s Life in Switzerland? November 2017 On average, Switzerland performs well across the OECD s headline well-being indicators relative to other OECD countries. Average household net adjusted disposable
Employer Attitudes, the Marginal Employer and the Ethnic Wage Gap *
 [Preliminary first version] Employer Attitudes, the Marginal Employer and the Ethnic Wage Gap * by Magnus Carlsson Linnaeus University & Dan-Olof Rooth Linnaeus University, IZA and CReAM Abstract: This
The National Citizen Survey
 CITY OF SARASOTA, FLORIDA 2008 3005 30th Street 777 North Capitol Street NE, Suite 500 Boulder, CO 80301 Washington, DC 20002 ww.n-r-c.com 303-444-7863 www.icma.org 202-289-ICMA P U B L I C S A F E T Y
How s Life in Poland?
 How s Life in Poland? November 2017 Relative to other OECD countries, Poland s average performance across the different well-being dimensions is mixed. Material conditions are an area of comparative weakness:
How s Life in the United Kingdom?
 How s Life in the United Kingdom? November 2017 On average, the United Kingdom performs well across a number of well-being indicators relative to other OECD countries. At 74% in 2016, the employment rate
Thornbury Township Police Services Survey: Initial Data Analyses and Key Findings
 Thornbury Township Police Services Survey: Initial Data Analyses and Key Findings 1160 McDermott Drive, Suite 101, West Chester, PA 19383 Phone: 610-425-7448, E-Mail: lbernotsky@wcupa.edu April 2012 2
How s Life in New Zealand?
 How s Life in New Zealand? November 2017 On average, New Zealand performs well across the different well-being indicators and dimensions relative to other OECD countries. It has higher employment and lower
Employer Attitudes, the Marginal Employer and the Ethnic Wage Gap *
 [I have an updated presentation for changes made until 29th of April - email me if it is wanted before the conference - this version of the paper is 18th of March] Employer Attitudes, the Marginal Employer
How s Life in Austria?
 How s Life in Austria? November 2017 Austria performs close to the OECD average in many well-being dimensions, and exceeds it in several cases. For example, in 2015, household net adjusted disposable income
The European emergency number 112
 Flash Eurobarometer The European emergency number 112 REPORT Fieldwork: December 2011 Publication: February 2012 Flash Eurobarometer TNS political & social This survey has been requested by the Directorate-General
The Sudan Consortium African and International Civil Society Action for Sudan. Sudan Public Opinion Poll Khartoum State
 The Sudan Consortium African and International Civil Society Action for Sudan Sudan Public Opinion Poll Khartoum State April 2015 1 Table of Contents 1. Introduction... 3 1.1 Background... 3 1.2 Sample
EUROBAROMETER 62 PUBLIC OPINION IN THE EUROPEAN UNION
 Standard Eurobarometer European Commission EUROBAROMETER 62 PUBLIC OPINION IN THE EUROPEAN UNION AUTUMN 2004 NATIONAL REPORT Standard Eurobarometer 62 / Autumn 2004 TNS Opinion & Social IRELAND The survey
Report for the Associated Press: Illinois and Georgia Election Studies in November 2014
 Report for the Associated Press: Illinois and Georgia Election Studies in November 2014 Randall K. Thomas, Frances M. Barlas, Linda McPetrie, Annie Weber, Mansour Fahimi, & Robert Benford GfK Custom Research
Equality Awareness in Northern Ireland: General Public
 Equality Awareness in Northern Ireland: General Public Equality Awareness Survey General Public 2016 Table of Contents 1. Introduction... 1 2. Social Attitudes and Perceptions of Equality... 11 3. Perception
How s Life in Belgium?
 How s Life in Belgium? November 2017 Relative to other countries, Belgium performs above or close to the OECD average across the different wellbeing dimensions. Household net adjusted disposable income
How s Life in Hungary?
 How s Life in Hungary? November 2017 Relative to other OECD countries, Hungary has a mixed performance across the different well-being dimensions. It has one of the lowest levels of household net adjusted
Characteristics of People. The Latino population has more people under the age of 18 and fewer elderly people than the non-hispanic White population.
 The Population in the United States Population Characteristics March 1998 Issued December 1999 P20-525 Introduction This report describes the characteristics of people of or Latino origin in the United
How s Life in Norway?
 How s Life in Norway? November 2017 Relative to other OECD countries, Norway performs very well across the OECD s different well-being indicators and dimensions. Job strain and long-term unemployment are
Graffiti: An inventory of preventive measures
 English summary Graffiti: An inventory of preventive measures Author: Solveig Hollari Published by: National Council for Crime Prevention (BRÅ) P.O.Box 1386 SE-111 93 Stockholm Sweden Reference: ISBN 91-38-32070-3
Survey sample: 1,013 respondents Survey period: Commissioned by: Eesti Pank Estonia pst. 13, Tallinn Conducted by: Saar Poll
 Survey sample:,0 respondents Survey period:. - 8.. 00 Commissioned by: Eesti Pank Estonia pst., Tallinn 9 Conducted by: Saar Poll OÜ Veetorni, Tallinn 9 CHANGEOVER TO THE EURO / December 00 CONTENTS. Main
Wisconsin Economic Scorecard
 RESEARCH PAPER> May 2012 Wisconsin Economic Scorecard Analysis: Determinants of Individual Opinion about the State Economy Joseph Cera Researcher Survey Center Manager The Wisconsin Economic Scorecard
How s Life in Estonia?
 How s Life in Estonia? November 2017 Relative to other OECD countries, Estonia s average performance across the different well-being dimensions is mixed. While it falls in the bottom tier of OECD countries
Hispanic Attitudes on Economy and Global Warming June 2016
 Hispanic Attitudes on Economy and Global Warming June 2016 Final Results June May June M-M Y-Y 2016 2016 2015 Change Change Index of Consumer Sentiment 105.8 93.5 98.4 +12.3 +7.4 Current Economic Conditions
How s Life in Slovenia?
 How s Life in Slovenia? November 2017 Slovenia s average performance across the different well-being dimensions is mixed when assessed relative to other OECD countries. The average household net adjusted
Spain s average level of current well-being: Comparative strengths and weaknesses
 How s Life in Spain? November 2017 Relative to other OECD countries, Spain s average performance across the different well-being dimensions is mixed. Despite a comparatively low average household net adjusted
How s Life in Canada?
 How s Life in Canada? November 2017 Canada typically performs above the OECD average level across most of the different well-indicators shown below. It falls within the top tier of OECD countries on household
ANNUAL SURVEY REPORT: AZERBAIJAN
 ANNUAL SURVEY REPORT: AZERBAIJAN 2 nd Wave (Spring 2017) OPEN Neighbourhood Communicating for a stronger partnership: connecting with citizens across the Eastern Neighbourhood June 2017 TABLE OF CONTENTS
ANNUAL SURVEY REPORT: BELARUS
 ANNUAL SURVEY REPORT: BELARUS 2 nd Wave (Spring 2017) OPEN Neighbourhood Communicating for a stronger partnership: connecting with citizens across the Eastern Neighbourhood June 2017 1/44 TABLE OF CONTENTS
Community perceptions of migrants and immigration. D e c e m b e r
 Community perceptions of migrants and immigration D e c e m b e r 0 1 OBJECTIVES AND SUMMARY OBJECTIVES The purpose of this research is to build an evidence base and track community attitudes towards migrants
EUROPAFORUM NORTHERN SWEDEN
 Territorial cohesion - the views of Europaforum Northern Sweden Europaforum Northern Sweden consists of a network of politicians at local, regional, national, and European level from the counties of Norrbotten,
Uppsala Center for Fiscal Studies
 Uppsala Center for Fiscal Studies Department of Economics Working Paper 2013:2 Ethnic Diversity and Preferences for Redistribution: Reply Matz Dahlberg, Karin Edmark and Heléne Lundqvist Uppsala Center
DATA PROTECTION EXECUTIVE SUMMARY
 Special Eurobarometer European Commission DATA PROTECTION Fieldwork: September 2003 Publication: December 2003 Special Eurobarometer 196 Wave 60.0 - European Opinion Research Group EEIG EXECUTIVE SUMMARY
How s Life in Germany?
 How s Life in Germany? November 2017 Relative to other OECD countries, Germany performs well across most well-being dimensions. Household net adjusted disposable income is above the OECD average, but household
The Effect of Immigrant Student Concentration on Native Test Scores
 The Effect of Immigrant Student Concentration on Native Test Scores Evidence from European Schools By: Sanne Lin Study: IBEB Date: 7 Juli 2018 Supervisor: Matthijs Oosterveen This paper investigates the
How s Life in the United States?
 How s Life in the United States? November 2017 Relative to other OECD countries, the United States performs well in terms of material living conditions: the average household net adjusted disposable income
How s Life in Finland?
 How s Life in Finland? November 2017 In general, Finland performs well across the different well-being dimensions relative to other OECD countries. Despite levels of household net adjusted disposable income
Unravelling Child Discrimination
 Unravelling Child Discrimination Measuring Global Perceptions on Child Discrimination and Exclusion April 201 Methodology An online survey was conducted using managed consumer panels amongst 1,000 citizens
ANNUAL SURVEY REPORT: ARMENIA
 ANNUAL SURVEY REPORT: ARMENIA 2 nd Wave (Spring 2017) OPEN Neighbourhood Communicating for a stronger partnership: connecting with citizens across the Eastern Neighbourhood June 2017 ANNUAL SURVEY REPORT,
California Ballot Reform Panel Survey Page 1
 CALIFORNIA BALLOT RE FORM PANEL SURVEY 2011-2012 Interview Dates: Wave One: June 14-July 1, 2011 Wave Two: December 15-January 2, 2012 Sample size Wave One: (N=1555) Wave Two: (N=1064) Margin of error
EUROBAROMETER 62 PUBLIC OPINION IN THE EUROPEAN UNION AUTUMN
 Standard Eurobarometer European Commission PUBLIC OPINION IN THE EUROPEAN UNION AUTUMN 2004 NATIONAL REPORT Standard Eurobarometer 62 / Autumn 2004 TNS Opinion & Social EXECUTIVE SUMMARY SWEDEN The survey
November 2017 Toplines
 November 2017 Toplines The first of its kind bi-monthly survey of racially and ethnically diverse young adults GenForward is a survey associated with the University of Chicago Interviews: 10/26-11/10/2017
Data Protection in the European Union. Citizens perceptions. Analytical Report
 Gallup Flash Eurobarometer N o 189a EU communication and the citizens Flash Eurobarometer European Commission Data Protection in the European Union Citizens perceptions Analytical Report Fieldwork: January
Topline questionnaire
 12 Topline questionnaire S AMERICAN TRENDS PANEL WAVE 25 MARCH FINAL TOPLINE March 13-27, TOTAL N=4,151 4 [RANDOMLY ASSIGN PARTICIPANTS TO RECEIVE ONE OF THE FOLLOWING FOUR VIGNETTES; VIGNETTE=1, 2, 3
BY Aaron Smith FOR RELEASE JUNE 28, 2018 FOR MEDIA OR OTHER INQUIRIES:
 FOR RELEASE JUNE 28, 2018 BY Aaron Smith FOR MEDIA OR OTHER INQUIRIES: Aaron Smith, Associate Director, Research Lee Rainie, Director, Internet and Technology Research Dana Page, Associate Director, Communications
ANNUAL SURVEY REPORT: REGIONAL OVERVIEW
 ANNUAL SURVEY REPORT: REGIONAL OVERVIEW 2nd Wave (Spring 2017) OPEN Neighbourhood Communicating for a stronger partnership: connecting with citizens across the Eastern Neighbourhood June 2017 TABLE OF
The Cook Political Report / LSU Manship School Midterm Election Poll
 The Cook Political Report / LSU Manship School Midterm Election Poll The Cook Political Report-LSU Manship School poll, a national survey with an oversample of voters in the most competitive U.S. House
SUMMARY. Migration. Integration in the labour market
 SUMMARY The purpose of this report is to compare the integration of immigrants in Norway with immigrants in the other Scandinavian countries and in Europe. The most important question was therefore: How
Flash Eurobarometer 364 ELECTORAL RIGHTS REPORT
 Flash Eurobarometer ELECTORAL RIGHTS REPORT Fieldwork: November 2012 Publication: March 2013 This survey has been requested by the European Commission, Directorate-General Justice and co-ordinated by Directorate-General
Iceland and the European Union
 Flash Eurobarometer European Commission Iceland and the European Union Fieldwork: December 2010 Report: March 2011 Flash Eurobarometer 302 The Gallup Organization This survey was requested by the Directorate-General
As might be expected, the two panels were different in their approaches to the question about the methodological and institutional implications of
 Alan Shima and Hans Lofgren (eds), American Studies in the Nordic Countries. Uppsala Nordic American Studies Reports No. 14 (Uppsala: The Swedish Institute for North American Studies, 1998), 101 pp., ISBN
How s Life in Denmark?
 How s Life in Denmark? November 2017 Relative to other OECD countries, Denmark generally performs very well across the different well-being dimensions. Although average household net adjusted disposable
Vancouver Police Community Policing Assessment Report Residential Survey Results NRG Research Group
 Vancouver Police Community Policing Assessment Report Residential Survey Results 2017 NRG Research Group www.nrgresearchgroup.com April 2, 2018 1 Page 2 TABLE OF CONTENTS A. EXECUTIVE SUMMARY 3 B. SURVEY
Executive summary. Strong records of economic growth in the Asia-Pacific region have benefited many workers.
 Executive summary Strong records of economic growth in the Asia-Pacific region have benefited many workers. In many ways, these are exciting times for Asia and the Pacific as a region. Dynamic growth and
Deliberative Polling for Summit Public Schools. Voting Rights and Being Informed REPORT 1
 Deliberative Polling for Summit Public Schools Voting Rights and Being Informed REPORT 1 1 This report was prepared by the students of COMM138/CSRE38 held Winter 2016. The class and the Deliberative Polling
Special Eurobarometer 469. Report
 Integration of immigrants in the European Union Survey requested by the European Commission, Directorate-General for Migration and Home Affairs and co-ordinated by the Directorate-General for Communication
Economic conditions and lived poverty in Botswana
 WWW.AFROBAROMETER.ORG Economic conditions and lived poverty in Botswana Findings from Afrobarometer Round 6 Surveys in Botswana At a Glance Economic Conditions: Trend analysis on present living conditions
Viktória Babicová 1. mail:
 Sethi, Harsh (ed.): State of Democracy in South Asia. A Report by the CDSA Team. New Delhi: Oxford University Press, 2008, 302 pages, ISBN: 0195689372. Viktória Babicová 1 Presented book has the format
Movers and stayers. Household context and emigration from Western Sweden to America in the 1890s
 Paper for session Migration at the Swedish Economic History Meeting, Gothenburg 25-27 August 2011 Movers and stayers. Household context and emigration from Western Sweden to America in the 1890s Anna-Maria
Draft, please do not circulate or quote
 Does ideology make a difference for government-nonprofit relationships in the Swedish welfare state: a study of local authorities policies and practices Authors: Håkan Johansson 1, Malin Arvidson 2 & Staffan
DU PhD in Home Science
 DU PhD in Home Science Topic:- DU_J18_PHD_HS 1) Electronic journal usually have the following features: i. HTML/ PDF formats ii. Part of bibliographic databases iii. Can be accessed by payment only iv.
Executive summary. Part I. Major trends in wages
 Executive summary Part I. Major trends in wages Lowest wage growth globally in 2017 since 2008 Global wage growth in 2017 was not only lower than in 2016, but fell to its lowest growth rate since 2008,
Post-referendum in Sweden
 Flash Eurobarometer 149 European Commission Post-referendum in Sweden Fieldwork 23 24. September 2003 Publication October 2003 Flash Eurobarometer 149 - Taylor Nelson Sofres. Coordination EOS Gallup Europe
SOM. Swedish Opinion. Swedish Membership. European Union Sören Holmberg March on the. in the SOM INSTITUTE. Society Opinion Massmedia
 SOM Swedish Opinion on the Swedish Membership in the European Union -6 Sören Holmberg March 7 SOM INSTITUTE Society Opinion Massmedia s o c i e t y o p i n i o n m a s s m e d i a percent Swedish Membership
Motivations and Barriers: Exploring Voting Behaviour in British Columbia
 Motivations and Barriers: Exploring Voting Behaviour in British Columbia January 2010 BC STATS Page i Revised April 21st, 2010 Executive Summary Building on the Post-Election Voter/Non-Voter Satisfaction
QUALITY OF LIFE IN TALLINN AND IN THE CAPITALS OF OTHER EUROPEAN UNION MEMBER STATES
 QUALITY OF LIFE IN TALLINN AND IN THE CAPITALS OF OTHER EUROPEAN UNION MEMBER STATES Marika Kivilaid, Mihkel Servinski Statistics Estonia The article gives an overview of the results of the perception
How s Life in Iceland?
 How s Life in Iceland? November 2017 In general, Iceland performs well across the different well-being dimensions relative to other OECD countries. 86% of the Icelandic population aged 15-64 was in employment
Voter ID Pilot 2018 Public Opinion Survey Research. Prepared on behalf of: Bridget Williams, Alexandra Bogdan GfK Social and Strategic Research
 Voter ID Pilot 2018 Public Opinion Survey Research Prepared on behalf of: Prepared by: Issue: Bridget Williams, Alexandra Bogdan GfK Social and Strategic Research Final Date: 08 August 2018 Contents 1
This memo was published originally as Appendix C to the 1996 Report of the Governor s Advisory Task Force on Civil Justice Reform.
 This memo was published originally as Appendix C to the 1996 Report of the Governor s Advisory Task Force on Civil Justice Reform. M E M O R A N D U M TO: FROM: Governor s Task Force on Civil Justice Reform