Introduction. IT Grows in Brooklyn 2. to make Brooklyn attractive for IT firms to start up or relocate. Defining IT: Industries and Occupations
|
|
|
- Tabitha West
- 5 years ago
- Views:
Transcription

1
2 to make Brooklyn attractive for IT firms to start up or relocate. The Brooklyn IT scene is heavily concentrated in the Tech Triangle Downtown Brooklyn including MetroTech, DUMBO, and the Brooklyn Navy Yard. Brooklyn comprises 18 percent of firms, five percent of employment, and four percent of total payroll in New York City s IT industries. Brooklyn s IT industries underwent astounding growth between 2005 and 2012: 44 percent growth in the number of firms and 56 percent growth in the number employed. Real annual wages in the Brooklyn IT industries increased by 32 percent between 2005 and In the private sector citywide, wages remained unchanged during the same period. IT growth and technological change pervades all industries in the local economy. In Brooklyn, the largest concentrations of IT jobs outside of the IT industries are in the education, finance and insurance, and healthcare sectors. When seen through the occupational lens, Brooklyn s IT workforce is highly educated. Three out of four have attained at least a fouryear college degree. The IT industries also provide opportunities for people who don t have tech skill sets, especially in administration, sales, and marketing. IT occupations and industries employ a larger percentage of males and a smaller percentage of foreign-born workers than does the City s private sector overall. Defining IT: Industries and Occupations For the purpose of this report, the definition of IT industries is adapted to the conditions of the local economy from TechAmerica Foundation s Cyberstates 2013 TM. IT industries include data processing, hosting, and related; other information services; software publishers; computer systems design and related services; scientific research & development; and electronic shopping. Removed from the Cyberstates definition are the manufacturing and telecommunications industries. IT also exists as an occupational specialization in these and other industries. IT occupations are defined in this report as all computer occupations (SOC ), plus computer and information systems managers, and computer hardware engineers. All figures in this report are for industries or occupations in Brooklyn unless otherwise noted. like San Francisco and Boston have set up offices in New York City. Unlike the tech boom in other places, New York City s flourishing IT economy supplements existing industries and further diversifies the City s economy. To top off the trend, the influence of IT activity on other industries is rapidly expanding. A majority of Brooklyn IT workers in or out of the IT industries live in Brooklyn. Introduction New York City has experienced substantial growth in information technology (IT) industries over the past several years. Now home to over 6,500 firms, New York City had 5,000 just seven years ago. Start-ups focusing on the Internet, mobile technologies, and electronic retail trade are on the rise. In addition to new companies, existing and established firms from other well-established tech hubs IT Grows in Brooklyn 2 2


3 Brooklyn s IT Growth Drivers Of all the boroughs, Brooklyn is experiencing the strongest growth in IT firms and employment, even though the majority of the industry activity is still in Manhattan. Brooklyn s IT growth drivers include: Lower cost of space relative to Manhattan. Newer start-ups and established companies alike are attracted to the borough because of its relative affordability. According to the New York City Department of City Planning, office Convenience and accessibility. Brooklyn is a short ride on multiple subway lines and by car and bicycle to lower Manhattan. Some locations in Central Brooklyn that were comparatively difficult to reach by public transportation in the early 2000s are now served by bus route extensions. Cachet. Brooklyn has become a destination for culture, food and entertainment, and as a place to live for a young, educated population who have migrated from all over the country. space in Brooklyn is estimated to cost $30 per Rezoning. Large parts of the borough previ- square foot on average, compared to $72 per ously zoned for manufacturing have been square for in Manhattan. rezoned for or converted to commercial space, allowing for spillover from Manhattan SOURCE National Establishment Time Series database.tm IT Grows in Brooklyn 3 3


4 as office space grows increasingly restricted there. The rezoning of Downtown Brooklyn and Williamsburg played a major role in bringing the tech sector to Brooklyn and creating the Tech Triangle. Approved by the City Planning Commission under the Bloomberg Administration in 2004, The Downtown Brooklyn Plan allowed for construction of 4.5 million square feet of office space and 1 million square feet of retail, ushering in a new era of commercial growth in the borough. In 2005, the rezoning of Williamsburg transformed previously industrial swaths into residential areas, bringing a large influx of new residents into the borough. Many of these newcomers brought with them technical skills that led to the creation of new businesses in the area. Other economic development initiatives. Three tech incubators have been established in the past six years and more are under way. NYU Poly and Two Trees Management establish an incubator at 20 Jay Street with a $250,000 grant from the New York City Economic Development Corporation (NYCEDC). NYCEDC partnered with SUNY Downstate Medical Center to create a biotech park adjacent to the hospital. The City invested $12 million to establish BioBat at the Brooklyn Army Terminal in Sunset Park, also in partnership with SUNY Downstate. State Senator Golden and the partners raised an additional $48 million from New York State. The site includes 500,000 square feet of commercial biotech space. in Crown Heights and East Williamsburg/ Bedford Stuyvesant. Employment Trends Firms. Brooklyn is home to 18 percent of all IT firms in New York City. There were 1,176 IT firms in Brooklyn in 2012, up 44 percent from Data from proprietary business lists suggest that 90 percent of Brooklyn s IT firms have 10 or fewer employees and 37 percent have just one employee. In addition, 38 percent of the firms are in the computer systems design and related services industry; 13 percent in scientific research and development; and about 10 percent each are in software publishing, data processing and hosting, and e-commerce. IT firms are especially concentrated in the Tech Triangle the Navy Yard, DUMBO and Downtown Brooklyn, including Metrotech. Some of the largest most well-known firms in this area include Etsy, Huge, and Makerbot. Employment. Brooklyn represents about seven percent of the City s employment in IT industries, suggesting that firms in the borough are comparatively small. Employment in the borough grew dramatically between 2005 and 2012, from 4,773 to 7,432, up an astounding 56 percent over the seven-year period despite losses during the Although not targeted to grow IT industries, other economic development initiatives have contributed to their growth in Brooklyn. In 2013, NYU Poly and NYCEDC announced they would be establishing the NYC Clean Technology Entrepreneur Center in 15 MetroTech. Former factories at 1000 Dean Street and 630 Flushing are opening office hubs in what were under-utilized manufacturing neighborhoods IT Grows in Brooklyn 4 4
5 recession (Figure 3). IT employment citywide grew by 49 percent in comparison. As suggested by the location of IT firms in Brooklyn, employment is densest in the Tech Triangle, as well as in Williamsburg, Greenpoint and Prospect Lefferts Gardens. Several small firms dot Manhattan Beach, Marine Park and Midwood too (Figure 3). Wages. Wages in Brooklyn s IT industries are higher than in the private sector overall. Moreover, while wages in other industries have decreased or stagnated over the past several years, wages in Brooklyn IT firms have grown considerably. In 2012, the average wage in Brooklyn s IT industries was $60,604 up nearly $15,000 in 2012 dollars or 32 percent in since In comparison, Brooklyn s average wage was $39,842, down six percent over the same period in real terms. Citywide, real wages remained stable at just over $80,500 between 2005 and In 2012, Brooklyn s total payroll in the IT industries was just over $450 million, making up about four percent of the city s total IT payroll. IT Occupations IT occupations exist in and out of the IT industries; and the IT industries employ people in both IT and non-it occupations. The analysis below highlights IT occupations both in and out of Brooklyn s IT industries and the non-it occupations in the IT industries. Occupations in the IT industries. Forty-two percent of the jobs in Brooklyn s IT industries were in IT occupations (American Community Survey). The top IT occupations were systems analysts, computer programmers, network systems and data communications analysts, computer scientists, information security analysts, and software developers. These occupations account for four out of five IT jobs. The median income earned by IT occupations in Brooklyn s IT industries was $55,556. There are about 85 non-it occupations employed in the Brooklyn s IT industries. Among the most common are office managers, office clerks, secretaries, office machine repairers, salespeople, and marketing managers. The median wage income earned by non-it workers in the industry in 2011 was $38,880. IT Occupations in Other Industries. More than two-thirds of all IT workers in Brooklyn work in non-it industries. Leading the list are finance, health care, and education. Within finance IT workers are concentrated in investment banks, commercial banks, credit card companies, and insurance carriers. Within healthcare, they are concentrated in hospitals. IT jobs are found in equal numbers in the K- 12 schools and postsecondary institutions. The median wage income earned by Brooklyn IT workers outside of the IT industries was $67,500. IT Grows in Brooklyn 5 5
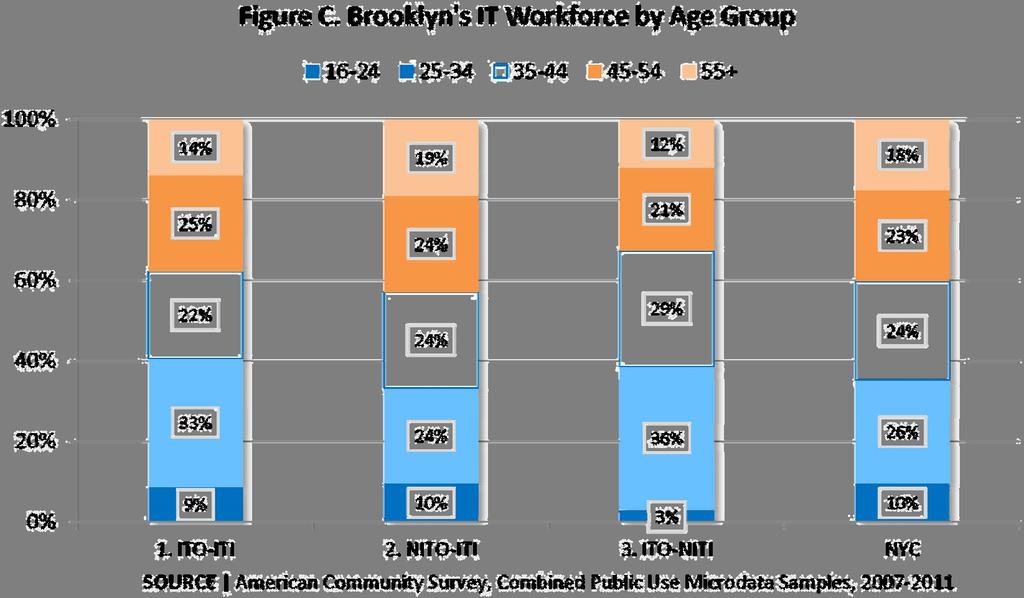
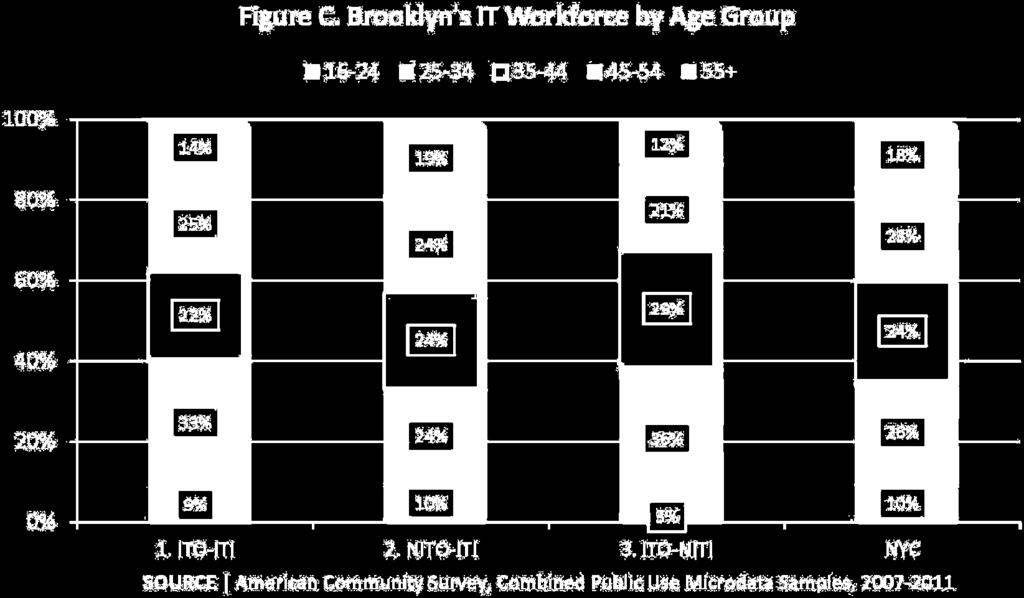
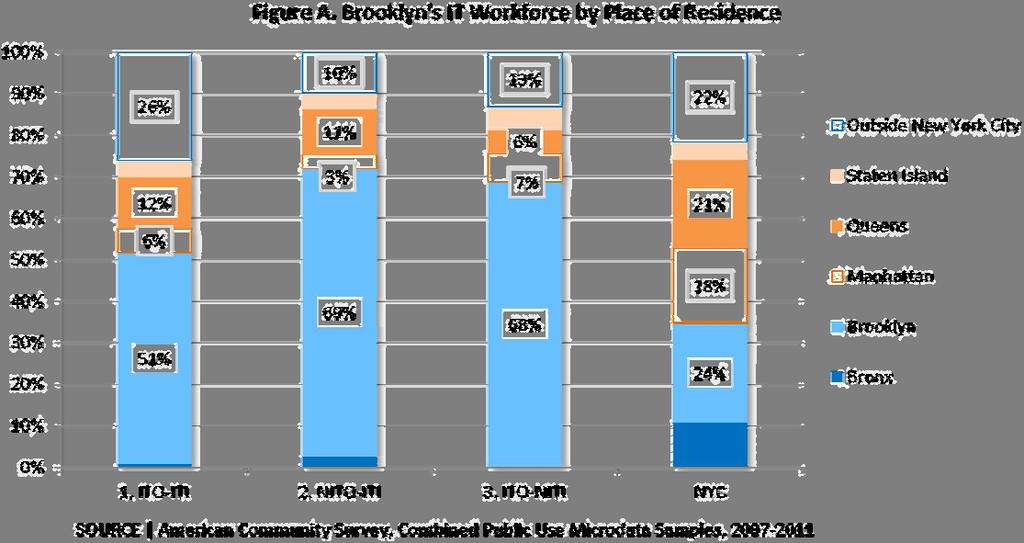
 IT occupations in IT industries (ITO- ITI), 2) non-it occupations in IT industries (NITO-ITI), and 3) IT occupations in")
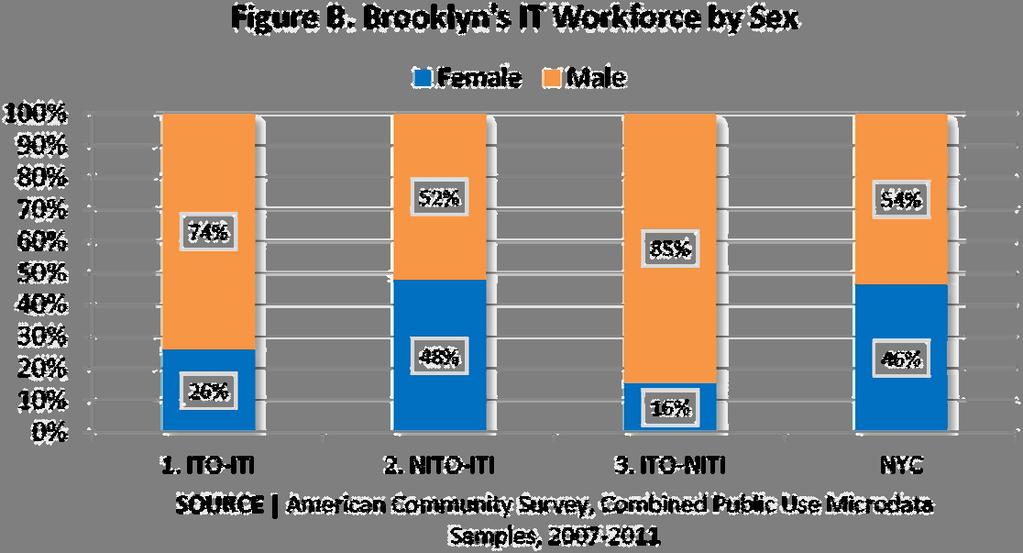
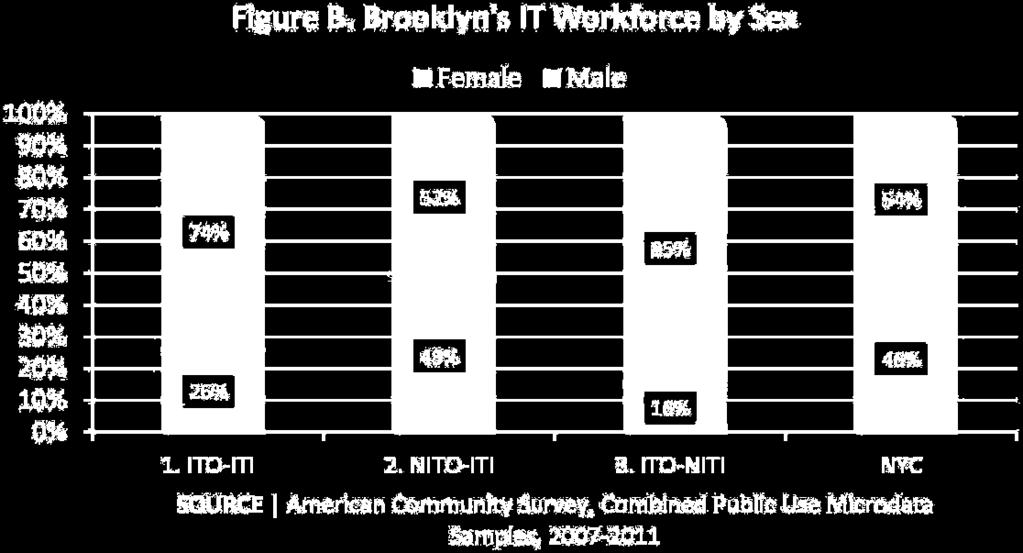
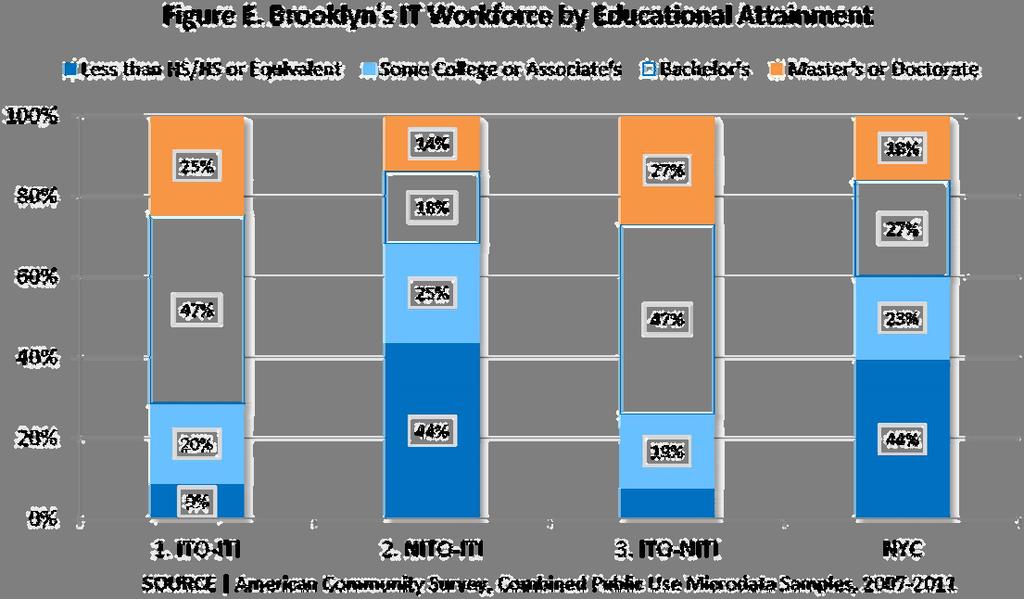
6 Labor Force Characteristics Appendix Figures A through F show the demographic characteristics of Brooklyn s IT workforce as compared to the New York City workforce as a whole. As discussed above, Brooklyn s IT workforce is divided into three parts: 1) IT occupations in IT industries (ITO- ITI), 2) non-it occupations in IT industries (NITO-ITI), and 3) IT occupations in non-it industries (ITO-NITI). Place of Residence. Compared to the New York City workforce as a whole, Brooklyn s IT workforce is a great deal more likely to live in Brooklyn (Figure A). A little more than half of the people working in IT occupations in IT industries (51%) live in Brooklyn as do more than two thirds (69%) of all IT workers in non- IT industries. Sex. Three out of four (74%) of those working in Brooklyn s IT industries are male as are 85 percent of the IT workers in other industries (Figure B). New York City s workforce in general is more balanced by sex at 54 percent male. Age Group. Brooklyn s IT workers in or out of the IT industries are slightly younger than the New York City workforce overall (Figure C). The age distribution of people in non-it occupations working in the IT industries nearly mirrors the New York City workforce, however. Place of Birth. The workforce of Brooklyn s IT industries is more likely to be foreign-born than the City s workforce overall (Figure D). IT workers in other industries are less likely to be foreign-born. Education. When seen through an occupational lens, the IT workforce is highly educated (Figure E). Nearly three out of four IT workers graduated from college or attained a postgraduate degree, compared to 45 percent in the general workforce and 32 percent of non-it workers in Brooklyn s IT industries. Race and Ethnicity. The racial/ethnic profile of the IT workforce in the IT industries differs from the IT workforce in other industries (Figure F). Half of all IT workers in Brooklyn s IT industries are white and about one in five are black, compared to 65 percent white and 10 percent black in other industries. Hispanic workers are under-represented in Brooklyn s IT industries: one in nine IT workers is Hispanic, compared to one in four in the New York City workforce overall. IT Grows in Brooklyn 6 6


7 In sum, tech workers in the IT industry in Brooklyn are highly educated, slightly younger, less diverse, and more likely to live in Brooklyn than the City s workforce overall. On the other hand, the non-it workers in Brooklyn s IT industries are similar to the overall workforce in almost every respect: by age, sex, race and educational attainment. Just over half live in Brooklyn, one quarter commute to Brooklyn from outside NYC, and the remaining come to Brooklyn from other boroughs. IT and the Future of Brooklyn s Economic Vitality The opportunities for Brooklyn to continue its tech growth are good. Some, though very few, challenges confront Brooklyn as it makes its bid. Expanding upon the success of the past several years into new Brooklyn neighborhoods will require focused effort. Early, praiseworthy examples include the new office developments in Crown Heights and East Williamsburg/Bed Stuyvesant. Continued rezoning and investment in new neighborhoods should lead to additional IT growth in the coming years. tech base in these industries. For example, the borough can further capitalize on the presence of Steiner Studios and Brooklyn College s new post-production program to attract additional tech jobs in this field. Brooklyn must continue to nurture its cultural institutions and maintain its diverse leisure offerings. They lend cachet and play an important role in attracting educated visitors and residents to the borough. Regardless, Brooklyn s tech growth will surely continue, supporting New York City s attempt to become the nation s next tech hub. The forces behind Brooklyn s IT growth of the last several years remain in place. Ample and comparatively low-cost office space, convenience to Manhattan, and the ability to attract educated visitors and workers all work together to suggest that IT will, indeed, continue to grow in Brooklyn. Endnote 2005 is the base year for analyses that appear in this report for two reasons: 1) it is after the trough of the dot com bust and ensuing recession; and 2) it is the year in which both relevant Brooklyn rezonings went into effect. Looking at the educational attainment of the current IT workforce, it appears that opportunities for employment in IT occupations are fairly limited for people with less than a college degree. The IT industries offer a variety of opportunities in other types of occupations, however. Given the positive outlook for Brooklyn s IT sector, public workforce providers should not overlook Brooklyn s IT industries as possible employers for their constituents who have attained fewer years of education. Many IT jobs outside of Brooklyn s IT industries are concentrated in healthcare and education, countercyclical sectors that are of tremendous value to the borough. As well, technological change is revolutionizing advertising, design, engineering, and television and movie production. Some amount of private investment can ensure that Brooklyn attracts a more diverse This report was written by Lesley Hirsch and Lena Afridi of the New York City Labor Market Information Service (NYCLMIS) at the CUNY Graduate Center for the Brooklyn Chamber of Commerce. The Brooklyn Labor Market Review is supported by the generous contributions from the Brooklyn Delegation of the New York City Council, and the Brooklyn Delegations of the New York State Assembly and Senate. Please nyclmis@gc.cuny.edu with questions about the report. For more information about the NYCLMIS, please see IT Grows in Brooklyn 7 7


8 Appendix Figures IT Grows in Brooklyn 8 8
9
CLACLS. A Profile of Latino Citizenship in the United States: Demographic, Educational and Economic Trends between 1990 and 2013
 CLACLS Center for Latin American, Caribbean & Latino Studies A Profile of Latino Citizenship in the United States: Demographic, Educational and Economic Trends between 1990 and 2013 Karen Okigbo Sociology
San Francisco Economic Strategy Update: Phase I Findings
 San Francisco Economic Strategy Update: Phase I Findings Ted Egan, Ph.D., Chief Economist Controller's Office of Economic Analysis May 21 th, 2012 1 City and County of San Francisco Introduction Proposition
LEFT BEHIND: WORKERS AND THEIR FAMILIES IN A CHANGING LOS ANGELES. Revised September 27, A Publication of the California Budget Project
 S P E C I A L R E P O R T LEFT BEHIND: WORKERS AND THEIR FAMILIES IN A CHANGING LOS ANGELES Revised September 27, 2006 A Publication of the Budget Project Acknowledgments Alissa Anderson Garcia prepared
Asian Americans in New York City. A Decade of Dynamic Change Presented on April 20, 2012 Report from
 Asian Americans in New York City A Decade of Dynamic Change 2000-2010 Presented on April 20, 2012 Report from Asian Americans in New York City: A Decade of Dynamic Change Demographic Changes from 2000-2010
Demographic, Economic, and Social Transformations in Queens Community District 3: East Elmhurst, Jackson Heights, and North Corona,
 Demographic, Economic, and Social Transformations in Queens Community District 3: East Elmhurst, Jackson Heights, and North Corona, 1990-2006 Astrid S. Rodríguez Fellow, Center for Latin American, Caribbean
Appendix A: Economic Development and Culture Trends in Toronto Data Analysis
 Appendix A: Economic Development and Culture Trends in Toronto Data Analysis Introduction The proposed lenses presented in the EDC Divisional Strategy Conversation Guide are based in part on a data review.
Part 1: Focus on Income. Inequality. EMBARGOED until 5/28/14. indicator definitions and Rankings
 Part 1: Focus on Income indicator definitions and Rankings Inequality STATE OF NEW YORK CITY S HOUSING & NEIGHBORHOODS IN 2013 7 Focus on Income Inequality New York City has seen rising levels of income
2. Challenges and Opportunities for Sheffield to 2034
 2. T he future presents many opportunities for Sheffield, yet there are also a number of challenges our city is facing. Sheffield is widely connected to the rest of the country and the world and, therefore,
Dominicans in New York City
 Center for Latin American, Caribbean & Latino Studies Graduate Center City University of New York 365 Fifth Avenue Room 5419 New York, New York 10016 212-817-8438 clacls@gc.cuny.edu http://web.gc.cuny.edu/lastudies
Philadelphia 2019: What Should Our Priorities Be for the New Year?
 Philadelphia 2019: What Should Our Priorities Be for the New Year? Set the context for our panel discussion Then, pose a series of questions for our panelists Last 2 decades, built a vibrant mixed-use
Le Sueur County Demographic & Economic Profile Prepared on 7/12/2018
 Le Sueur County Demographic & Economic Profile Prepared on 7/12/2018 Prepared by: Mark Schultz Regional Labor Market Analyst Southeast and South Central Minnesota Minnesota Department of Employment and
Post-Secondary Education, Training and Labour September Profile of the New Brunswick Labour Force
 Post-Secondary Education, Training and Labour September 2018 Profile of the New Brunswick Labour Force Contents Population Trends... 2 Key Labour Force Statistics... 5 New Brunswick Overview... 5 Sub-Regional
Demographics. Chapter 2 - Table of contents. Environmental Scan 2008
 Environmental Scan 2008 2 Ontario s population, and consequently its labour force, is aging rapidly. The province faces many challenges related to a falling birth rate, an aging population and a large
WILLIAMSON STATE OF THE COUNTY Capital Area Council of Governments
 WILLIAMSON STATE OF THE COUNTY 2011 Capital Area Council of Governments POPULATION Capital Area Council of Governments POPULATION THE RISE OF TEXAS During the past decade, the State of Texas has proved
Gone to Texas: Migration Vital to Growth in the Lone Star State. Pia Orrenius Federal Reserve Bank of Dallas June 27, 2018
 Gone to Texas: Migration Vital to Growth in the Lone Star State Pia Orrenius Federal Reserve Bank of Dallas June 27, 2018 Roadmap History/Trends in migration to Texas Role in economic growth Domestic migration
Labor Supply Factors and Labor Availability for the Fillmore County, Nebraska Labor Area
 Labor Supply Factors and Labor Availability for the Fillmore County, Nebraska Labor Area September 2018 Prepared by: Kenneth M. Lemke, Ph.D. Economist Nebraska Public Power District 1414 15 th Street -
Demographic, Economic, and Social Transformations in Brooklyn Community District 4: Bushwick,
 Demographic, Economic, and Social Transformations in Brooklyn Community District 4: Bushwick, 1990-2007 Astrid S. Rodríguez Ph.D. Candidate, Educational Psychology Center for Latin American, Caribbean
8AMBER WAVES VOLUME 2 ISSUE 3
 8AMBER WAVES VOLUME 2 ISSUE 3 F E A T U R E William Kandel, USDA/ERS ECONOMIC RESEARCH SERVICE/USDA Rural s Employment and Residential Trends William Kandel wkandel@ers.usda.gov Constance Newman cnewman@ers.usda.gov
Patrick Adler and Chris Tilly Institute for Research on Labor and Employment, UCLA. Ben Zipperer University of Massachusetts, Amherst
 THE STATE OF THE UNIONS IN 2013 A PROFILE OF UNION MEMBERSHIP IN LOS ANGELES, CALIFORNIA AND THE NATION 1 Patrick Adler and Chris Tilly Institute for Research on Labor and Employment, UCLA Ben Zipperer
BLS Spotlight on Statistics: Union Membership In The United States
 Cornell University ILR School DigitalCommons@ILR Federal Publications Key Workplace Documents 9-2016 BLS : Union Membership In The United States Megan Dunn Bureau of Labor Statistics James Walker Bureau
Immigrants and the Restructuring of the Boston Metropolitan Workforce,
 Institute for Immigration Research Immigrants and the Restructuring of the Boston Metropolitan Workforce, 1970-2010 Erin M. Stephens, Justin P. Lowry and James C. Witte JUNE 2015 1 Immigrants and the Restructuring
STRENGTHENING RURAL CANADA: Fewer & Older: The Coming Demographic Crisis in Rural Ontario
 STRENGTHENING RURAL CANADA: Fewer & Older: The Coming Demographic Crisis in Rural Ontario An Executive Summary 1 This paper has been prepared for the Strengthening Rural Canada initiative by: Dr. Bakhtiar
The Brookings Institution Metropolitan Policy Program Bruce Katz, Director
 The Brookings Institution Metropolitan Policy Program Bruce Katz, Director Redefining Urban and Suburban America National Trust for Historic Preservation September 30, 2004 Redefining Urban and Suburban
Demographic, Economic and Social Transformations in Bronx Community District 4: High Bridge, Concourse and Mount Eden,
 Center for Latin American, Caribbean & Latino Studies Graduate Center City University of New York 365 Fifth Avenue Room 5419 New York, New York 10016 Demographic, Economic and Social Transformations in
THE BRAIN GAIN: 2015 UPDATE. How the Region s Shifting Demographics Favor the Lower Manhattan Business District
 THE BRAIN GAIN: 2015 UPDATE How the Region s Shifting Demographics Favor the Lower Manhattan Business District 2015 UPDATE THE BRAIN GAIN: How the Region s Shifting Demographics Favor the Lower Manhattan
LATINO DATA PROJECT. Astrid S. Rodríguez Ph.D. Candidate, Educational Psychology. Center for Latin American, Caribbean, and Latino Studies
 LATINO DATA PROJECT Demographic, Economic, and Social Transformations in the South Bronx: Changes in the NYC Community Districts Comprising Mott Haven, Port Morris, Melrose, Longwood, and Hunts Point,
Release of 2006 Census results Labour Force, Education, Place of Work and Mode of Transportation
 Backgrounder Release of 2006 Census results Labour Force, Education, Place of Work and Mode of Transportation On March 4, 2008 Statistics Canada released further results from the 2006 census focusing on
CLACLS. Demographic, Economic, and Social Transformations in Bronx Community District 5:
 CLACLS Center for Latin American, Caribbean & Latino Stud- Demographic, Economic, and Social Transformations in Bronx Community District 5: Fordham, University Heights, Morris Heights and Mount Hope, 1990
Over the past three decades, the share of middle-skill jobs in the
 The Vanishing Middle: Job Polarization and Workers Response to the Decline in Middle-Skill Jobs By Didem Tüzemen and Jonathan Willis Over the past three decades, the share of middle-skill jobs in the United
Is the recession over in New York?
 By James A. Parrott May 10, 2010 Job numbers are up, unemployment is down. Consumer confidence is up. Gross domestic product has increased for three quarters. It sounds like the is behind us and we re
The Economy of Gunnison County
 THE ENTERPRISE RESEARCH INSTITUTE The Economy of Gunnison County A Report Prepared for Gunnison Valley Futures by Paul Holden Version F3 ERI 601 North Taylor Street Gunnison, CO 81230 T Work Phone 970
REGIONAL. San Joaquin County Employment Landscape
 Lodi 12 EBERHARDT SCHOOL OF BUSINESS Business Forecasting Center in partnership with San Joaquin Council of Governments 99 26 5 25 Tracy 4 Lathrop Stockton 12 Manteca Ripon Escalon REGIONAL analyst june
Riverside Labor Analysis. November 2018
 November 2018 The City of Labor Market Dynamics and Local Cost of Living Analysis Executive Summary The City of is located in one of the fastest growing parts of California. Over the period 2005-2016,
Community Economic Impact Study of the Proposed Kenosha-Racine-Milwaukee (KRM) Commuter Rail
 Commuter Rail") Institute for Survey and Policy Research P. O. Box 413 Milwaukee, WI 53201 Community Economic Impact Study of the Proposed Kenosha-Racine-Milwaukee (KRM) Commuter Rail Prepared by the Institute for Survey
Institute for Survey and Policy Research P. O. Box 413 Milwaukee, WI 53201 Community Economic Impact Study of the Proposed Kenosha-Racine-Milwaukee (KRM) Commuter Rail Prepared by the Institute for Survey
STRENGTHENING RURAL CANADA: Fewer & Older: Population and Demographic Crossroads in Rural Saskatchewan. An Executive Summary
 STRENGTHENING RURAL CANADA: Fewer & Older: Population and Demographic Crossroads in Rural Saskatchewan An Executive Summary This paper has been prepared for the Strengthening Rural Canada initiative by:
GROWTH AMID DYSFUNCTION An Analysis of Trends in Housing, Migration, and Employment SOLD
 GROWTH AMID DYSFUNCTION An Analysis of Trends in Housing, Migration, and Employment SOLD PRODUCED BY Next 10 F. Noel Perry Colleen Kredell Marcia E. Perry Stephanie Leonard PREPARED BY Beacon Economics
Our Shared Future: U N D E R S T A N D I N G B O S T O N. #SharedFuture. Charting a Path for Immigrant Advancement in a New Political Landscape
 U N D E R S T A N D I N G B O S T O N Our Shared Future: Charting a Path for Immigrant Advancement in a New Political Landscape Wednesday, April 19 th, 2017 8:30-10:30 a.m. #SharedFuture U N D E R S T
Astrid S. Rodríguez Fellow, Center for Latin American, Caribbean & Latino Studies. Center for Latin American, Caribbean & Latino Studies
 Demographic, Economic, and Social Transformations in Bronx Community District 9: Parkchester, Unionport, Soundview, Castle Hill, and Clason Point, 1990-2006 Center for Latin American, Caribbean & Latino
The Brookings Institution
 The Brookings Institution Metropolitan Policy Program Bruce Katz, Director Understanding Regional Dynamics: Implications for Social and Economic Justice Understanding Regional Dynamics: Implications for
Labor Supply Factors and Labor Availability for the Geneva (Fillmore County) Labor Area
 Labor Area") Labor Supply Factors and Labor Availability for the Geneva (Fillmore County) Labor Area June 2015 Prepared by: Kenneth M. Lemke, Ph.D. Economist Nebraska Public Power District 1414 15 th Street - P.O.
Labor Supply Factors and Labor Availability for the Geneva (Fillmore County) Labor Area June 2015 Prepared by: Kenneth M. Lemke, Ph.D. Economist Nebraska Public Power District 1414 15 th Street - P.O.
THE STATE OF THE UNIONS IN 2011: A PROFILE OF UNION MEMBERSHIP IN LOS ANGELES, CALIFORNIA AND THE NATION 1
 THE STATE OF THE UNIONS IN 2011: A PROFILE OF UNION MEMBERSHIP IN LOS ANGELES, CALIFORNIA AND THE NATION 1 Lauren D. Appelbaum UCLA Institute for Research on Labor and Employment 2 Ben Zipperer University
Profile of New York City s Chinese Americans: 2013 Edition
 Profile of New York City s Chinese Americans: 2013 Edition Asian American Federation Census Information Center Introduction Using data from the Census Bureau s 2006-2008 and 2009-2011 American Community
Q 23,992. New Americans in Champaign County 11.6% 11.8%
 New Americans in Champaign County A Snapshot of the Demographic and Economic Contributions of Immigrants in the County 1 POPULATION 23,992 Number of immigrants living in Champaign County in 2016, making
FISCAL POLICY INSTITUTE
 FISCAL POLICY INSTITUTE Learning from the 90s How poor public choices contributed to income erosion in New York City, and what we can do to chart an effective course out of the current downturn Labor Day,
Washington Area Economy: Performance and Outlook
 Washington Area Economy: Performance and Outlook Presentation to: Arlington Economic Development Commission Mark C. White, Ph.D. Deputy Director Center for Regional Analysis Schar School of Policy and
Investing in Disruptive Change: The Great U.S. Wealth Migration
 Investing in Disruptive Change: The Great U.S. Wealth Migration As thematic investors, we look for phenomena that are transforming economic prospects across multiple industries. Then, we seek to identify
3 SOCIOECONOMIC ANALYSIS
 3 SOCIOECONOMIC ANALYSIS A. INTRODUCTION Cumberland, Maryland has historically been the center for manufacturing and industry within Western Maryland with multimodal (rail, auto, and recreation) transportation
Welcome! Dr. Lewis Gale Dean, Eberhardt School of Business University of the Pacific. Todd E. Heintz Senior Vice President, JP Morgan Chase Bank
 Follow on Twitter at: #stateofnsjv2015 Welcome! Dr. Lewis Gale Dean, Eberhardt School of Business University of the Pacific Todd E. Heintz Senior Vice President, JP Morgan Chase Bank #stateofnsjv2015 What
Immigrants are playing an increasingly
 Trends in the Low-Wage Immigrant Labor Force, 2000 2005 THE URBAN INSTITUTE March 2007 Randy Capps, Karina Fortuny The Urban Institute Immigrants are playing an increasingly important role in the U.S.
Rural America At A Glance
 Rural America At A Glance 7 Edition Between July 5 and July 6, the population of nonmetro America grew.6 percent. Net domestic migration from metro areas accounted for nearly half of this growth. Gains
Profile of New York City s Bangladeshi Americans
 Profile of New York City s Bangladeshi Americans Introduction Using data from 2006-2010 and 2011-2015 American Community Survey (ACS) Selected Population Tables and the 2010 U.S. census, this profile outlines
Table A2-1. Civilian Labor Force, Sanford/Springvale Labor Force Unemployed Unemployment Rate 5.8% 5.
 APPENDIX A2 THE LOCAL ECONOMY (September 10, 2002) From the mid 19 th Century, the Town of Sanford s economic importance in the region has been as a manufacturing community. In the late 19 th Century,
New Americans in Long Beach POPULATION GROWTH 3.3% 14.3 % Total population 481, % Immigrant population 128, % 26.1% 47.
 New Americans in Long Beach A Snapshot of the Demographic and Economic Contributions of Immigrants in the Long Beach Area 1 POPULATION GROWTH 7+7R 6.6% Immigrant share of the population, 016 Between 011
THE STATE OF THE UNIONS IN 2007: A PROFILE OF UNION MEMBERSHIP IN LOS ANGELES, CALIFORNIA AND THE NATION 1
 THE STATE OF THE UNIONS IN 2007: A PROFILE OF UNION MEMBERSHIP IN LOS ANGELES, CALIFORNIA AND THE NATION 1 Ruth Milkman and Bongoh Kye UCLA Institute for Research on Labor and Employment September 2007
Berkeley Review of Latin American Studies, Fall 2013
 Home Share to: Berkeley Review of Latin American Studies, Fall 2013 An American flag featuring the faces of immigrants on display at Ellis Island. (Photo by Ludovic Bertron.) IMMIGRATION The Economic Benefits
STATE GOAL INTRODUCTION
 STATE GOAL There is no specific state goal that addresses population; however, all other goals depend on an understanding of population and demographic data for the municipality and region. INTRODUCTION
As Figure 1 below shows, unemployment levels jumped significantly during the
 June 2012 Like all American cities, San Diego suffered from the 2008 financial crisis and ensuing recession. Gradual and positive trends in unemployment, real estate, tourism and production indicate that
The State of. Working Wisconsin. Update September Center on Wisconsin Strategy
 The State of Working Wisconsin Update 2005 September 2005 Center on Wisconsin Strategy About COWS The Center on Wisconsin Strategy (COWS), based at the University of Wisconsin-Madison, is a research center
We know that the Latinx community still faces many challenges, in particular the unresolved immigration status of so many in our community.
 1 Ten years ago United Way issued a groundbreaking report on the state of the growing Latinx Community in Dane County. At that time Latinos were the fastest growing racial/ethnic group not only in Dane
R 4.5% 28,228. New Americans in Fort Wayne and Northeast Indiana. Immigrant share of the population, 2016
 New Americans in Fort Wayne and Northeast Indiana A Snapshot of the Demographic and Economic Contributions of Immigrants in the Region 1 POPULATION GROWTH +9R.% Immigrant share of the population, 016 Between
The Latino Population of New York City, 2008
 The Latino Population of New York City, 2008 Center for Latin American, Caribbean & Latino Studies Graduate Center City University of New York 365 Fifth Avenue Room 5419 New York, New York 10016 Laird
Poverty in New York City, 2005: More Families Working, More Working Families Poor
 : More Families Working, More Working Families Poor A CSS Annual Report September 2006 Mark Levitan, Senior Policy Analyst After four consecutive increases, the nation s poverty rate has stabilized at
Louisville: Immigration Rebirth Matt Ruther, Department of Urban and Public Affairs, University of Louisville
 Louisville: Immigration Rebirth Matt Ruther, Department of Urban and Public Affairs, University of Louisville Germantown. Schnitzelburg. Irish Hill. The names of neighborhoods within Louisville s urban
Influence of Consumer Culture and Race on Travel Behavior
 PAPER Influence of Consumer Culture and Race on Travel Behavior JOHANNA P. ZMUD CARLOS H. ARCE NuStats International ABSTRACT In this paper, data from the National Personal Transportation Survey (NPTS),
The Dynamics of Low Wage Work in Metropolitan America. October 10, For Discussion only
 The Dynamics of Low Wage Work in Metropolitan America October 10, 2008 For Discussion only Joseph Pereira, CUNY Data Service Peter Frase, Center for Urban Research John Mollenkopf, Center for Urban Research
The Americans (Survey)
") The Americans (Survey) Chapter 34: TELESCOPING THE TIMES The United States in Today s World CHAPTER OVERVIEW President Bill Clinton locks horns with a Republican Congress, reflecting the heated national
The Americans (Survey) Chapter 34: TELESCOPING THE TIMES The United States in Today s World CHAPTER OVERVIEW President Bill Clinton locks horns with a Republican Congress, reflecting the heated national
GMU Center for Regional Analysis Lokesh Dani January 15, 2016 Albuquerque, NM Metropolitan Statistical Area
 Entrepreneurial Ecosystem Metrics: Summary Albuquerque, NM Metropolitan Statistical Area We apply metrics from publicly available data sources to the entrepreneurial ecosystems indicators suggested by
Demographic Data. Comprehensive Plan
 Comprehensive Plan 2010-2030 4 Demographic Data Population and demographics have changed over the past several decades in the City of Elwood. It is important to incorporate these shifts into the planning
Chapter One: people & demographics
 Chapter One: people & demographics The composition of Alberta s population is the foundation for its post-secondary enrolment growth. The population s demographic profile determines the pressure points
Immigrants strengthen Colorado s economy, generating $42 billion of activity in 2011
 Immigrants strengthen Colorado s economy, generating $42 billion of activity in 2011 February 14, 2013 By Christopher Stiffler Economist Executive Summary The foreign-born population is a growing presence
Characteristics of the underemployed in New Zealand
 Characteristics of the underemployed in New Zealand focuses on the proportion of underemployment for part-time workers. It brings in underemployment rates and levels to provide context. We explore personal,
R 799, % New Americans in San Diego A Snapshot of the Demographic and Economic Contributions of Immigrants in the County 1
 New Americans in San Diego A Snapshot of the Demographic and Economic Contributions of Immigrants in the County 1 POPULATION GROWTH 24+76R Immigrant share of the population, 2016 Number of immigrants living
Talent Advantage Series. Cameron Macht DEED Labor Market Information Office Regional Analysis & Outreach April 11, 2018
 Talent Advantage Series Cameron Macht DEED Labor Market Information Office Regional Analysis & Outreach www.mn.gov/deed/data/ April 11, 2018 Labor Force Constraints From 1976 to 2001, Minnesota gained
R Eagleton Institute of Politics Center for Public Interest Polling
 2002 SURVEY OF NEW BRUNSWICK RESIDENTS Conducted for: Conducted by: R Eagleton Institute of Politics Center for Public Interest Polling Data Collection: May 2002 02-02 EXECUTIVE SUMMARY TABLE OF CONTENTS
REGIONAL. San Joaquin County Population Projection
 Lodi 12 EBERHARDT SCHOOL OF BUSINESS Business Forecasting Center in partnership with San Joaquin Council of Governments 99 26 5 205 Tracy 4 Lathrop Stockton 120 Manteca Ripon Escalon REGIONAL analyst june
History of Immigration to Texas
 History of Immigration to Texas For most of its history, Texas has attracted settlers from the rest of the nation rather than abroad Mexican immigrants did not begin to settle permanently until late 1970s
The Graying of the Empire State: Parts of NY Grow Older Faster
 Research Bulletin No. 7.2 August 2012 EMPIRE The Graying of the Empire State: Parts of NY Grow Older Faster By E.J. McMahon and Robert Scardamalia CENTER FOR NEW YORK STATE POLICY A project of the Manhattan
The Brookings Institution Metropolitan Policy Program Bruce Katz, Director
 The Brookings Institution Metropolitan Policy Program Bruce Katz, Director State of the World s Cities: The American Experience Delivering Sustainable Communities Summit February 1st, 2005 State of the
Community Social Profile Cambridge and North Dumfries
 Community Trends for 2013 in Cambridge, North Dumfries, Wellesley, Wilmot and Woolwich Community Social Profile - Cambridge and North Dumfries Published December 2014 Community Social Profile Cambridge
NOVEMBER visioning survey results
 NOVEMBER 2016 visioning survey results 2 Denveright SECTION 1 SURVEY INTRODUCTION OVERVIEW Our community is undertaking an effort that builds upon our successes and proud traditions to design the future
This analysis confirms other recent research showing a dramatic increase in the education level of newly
 CENTER FOR IMMIGRATION STUDIES April 2018 Better Educated, but Not Better Off A look at the education level and socioeconomic success of recent immigrants, to By Steven A. Camarota and Karen Zeigler This
o n e c i t y d i v e r s e p l a c e s
 City of Swan our Swan 2030 discussion paper our vibrant economy o n e c i t y d i v e r s e p l a c e s 2 our Swan 2030 our vibrant economy Contents 1. Background 4 2. Trends 5 3. Key Considerations 6
We Need More Nova Scotians
 We Need More Nova Scotians Nova Scotia s population at the end of 2009 is the same as it was five years ago about 938,000 and only 4,000 greater than it was 10 years ago. Some might feel that a stable
Population Outlook for the Portland-Vancouver Metropolitan Region
 Portland State University PDXScholar Institute of Portland Metropolitan Studies Publications Institute of Portland Metropolitan Studies 2007 Population Outlook for the Portland-Vancouver Metropolitan Region
FOR IMMEDIATE RELEASE
 ! FOR IMMEDIATE RELEASE May 3, 2018 Contact: Sage Welch 415.453.0430 New studies track low-wage earners fleeing California, even as the number of low-paying jobs increase High-wage earners continue to
9+91S 21+79Q 8.8% New Americans in the Siouxland Tri-State Region 20.8% The immigrant population increased 12.3%.
 New Americans in the Siouxland Tri-State Region A Snapshot of the Demographic and Economic Contributions of Immigrants 1 POPULATION GROWTH 9+91S 8.8% Immigrant share of the population in metro Sioux City
VIETNAM FOCUS. The Next Growth Story In Asia?
 The Next Growth Story In Asia? Vietnam s economic policy has dramatically transformed the nation since 9, spurring fast economic and social development. Consequently, Vietnam s economy took off booming
The Community Progress Report
 Imagine Inform Invest Inspire Working together to build a stronger community now and forever The Community Progress Report MEASURING THE WELLBEING OF GREATER 641,472 residents live in The Community Foundation
The Effects of Immigration on Age Structure and Fertility in the United States
 The Effects of Immigration on Age Structure and Fertility in the United States David Pieper Department of Geography University of California, Berkeley davidpieper@berkeley.edu 31 January 2010 I. Introduction
Statistics Update For County Cavan
 Social Inclusion Unit November 2013 Key Figures for Cavan Population 73,183 Population change 14.3% Statistics Update For County Cavan Census 2011 Shows How Cavan is Changing Population living in 70% rural
Immigrant Employment by Field of Study. In Waterloo Region
 Immigrant Employment by Field of Study In Waterloo Region Table of Contents Executive Summary..........................................................1 Waterloo Region - Part 1 Immigrant Educational Attainment
City of Miami. FIU Digital Commons. Florida International University
 Florida International University FIU Digital Commons Miami Dade County MPO Community Background Reports 1-1-2011 City of Miami Follow this and additional works at: http://digitalcommons.fiu.edu/mpo_dade
Recent immigrant outcomes employment earnings
 Recent immigrant outcomes - 2005 employment earnings Stan Kustec Li Xue January 2009 Re s e a r c h a n d E v a l u a t i o n Ci4-49/1-2010E-PDF 978-1-100-16664-3 Table of contents Executive summary...
THE STATE OF THE UNIONS IN 2009: A PROFILE OF UNION MEMBERSHIP IN LOS ANGELES, CALIFORNIA AND THE NATION 1
 THE STATE OF THE UNIONS IN 2009: A PROFILE OF UNION MEMBERSHIP IN LOS ANGELES, CALIFORNIA AND THE NATION 1 Lauren D. Appelbaum UCLA Institute for Research on Labor and Employment Ben Zipperer University
ECONOMY MICROCLIMATES IN THE PORTLAND-VANCOUVER REGIONAL ECONOMY
 MICROCLIMATES IN THE PORTLAND-VANCOUVER REGIONAL by Sheila Martin, Director of the Institute of Portland Metropolitan Studies, Portland State University 1 Introduction The Regional Labor Market Portland-Vancouver
Changes in Wage Inequality in Canada: An Interprovincial Perspective
 s u m m a r y Changes in Wage Inequality in Canada: An Interprovincial Perspective Nicole M. Fortin and Thomas Lemieux t the national level, Canada, like many industrialized countries, has Aexperienced
Nebraska s Foreign-Born and Hispanic/Latino Population
 January 2011 Nebraska s Foreign-Born and Hispanic/Latino Population Socio-Economic Trends, 2009 OLLAS Office of Latino/Latin American Studies (OLLAS) University of Nebraska - Omaha Off i c e o f La t i
Cross Border Commuters Map - Persons commuting from Ireland to Northern Ireland to work or study by electoral division/ward, 2016
 Cross Border Commuters 2016 Map - Persons commuting from Ireland to Northern Ireland to work or study by electoral division/ward, 2016 Census 2016 recorded 9,336 people who crossed the border for work
A Regional Comparison Minneapolis Saint Paul Regional Economic Development Partnership
 Greater MSP Baltimore A Regional Comparison Minneapolis Saint Paul Regional Economic Development Partnership TOP EMPLOYERS IN AND MSA GREATER MSP EMPLOYER EMPLOYEES EMPLOYER EMPLOYEES Target Corp. 26,694
TESTIMONY OF PAUL K. SONN NATIONAL EMPLOYMENT LAW PROJECT ON THE PITTSBURGH SERVICE WORKER PREVAILING WAGE ORDINANCE
 TESTIMONY OF PAUL K. SONN NATIONAL EMPLOYMENT LAW PROJECT ON THE PITTSBURGH SERVICE WORKER PREVAILING WAGE ORDINANCE BEFORE THE PITTSBURGH CITY COUNCIL DECEMBER 10, 2009 PITTSBURGH, PA National Office