Cities of opportunity
|
|
|
- Madlyn Lucas
- 5 years ago
- Views:
Transcription

1 Cities of opportunity
2 0 PricewaterhouseCoopers LLP. All rights reserved. PricewaterhouseCoopers refers to PricewaterhouseCoopers LLP or, as the context requires, the PricewaterhouseCoopers global network or other member firms of the network, each of which is a separate and independent legal entity. The information contained in this document is provided as is, for general guidance on matters of interest only. PricewaterhouseCoopers is not herein engaged in rendering legal, accounting, tax, or other professional advice and services. NY The Partnership for New York City, Inc. All rights reserved. Cover photo: Dubai
3 An open letter on cities in an interdependent world... What makes a city thrive? It s a fascinating question. Today it s also an urgent one. This is especially true in the face of a pressing financial crisis. Cities offer the strength and resilience to lead our recovery through short-term stress and rebuild toward long-term growth. Challenges do exist: Over half the world s people live in cities, and by mid-century the share is expected to reach 0 percent. Large population centers face intense risk from climate change, pandemics and shortages of food and water, among other emerging threats. And cities confront problems such as assuring health, safety, and security, and maintaining aging infrastructures. But these challenges are outnumbered by opportunities: Cities will continue to stand at the crossroads of an interdependent world, producing the bulk of commerce, ideas and innovation in the form of financial and intellectual capital. We live in a highly globalized economy where financial, commercial, and social interests flow together in a confluence of markets, travel and communications, cross-border investment and trade. A vital city is a locus of activity in its region. In cities like New York, London, Paris and Tokyo and increasingly others that region is the world. It s plain that the health of cities drives the wellbeing of businesses, people and nations. A shared future Today, as developed and emerging economies navigate a difficult economic period, cities will lead the recovery with long-term strengths that transcend short-term difficulties. It s clear that global solutions are required for global problems. Neither the direction of globalization nor the growth of cities is likely to falter. We are in it together for better or worse, opportunity or risk. It s a rooted and healthy reality at the heart of this study: The world s interests have fused. As such, Cities of Opportunity closely examines cities that serve as hubs of finance, commerce and innovation in their regions and whose stakeholders span the world. Working together, PricewaterhouseCoopers and the Partnership for New York City investigated a robust range of current, credible and unbiased variables to see how cities are advancing in the st century and what actions are helping them to thrive. We particularly sought to look deeper than the obvious front-runners and to learn from successes, not to proclaim winners. Our goal is to provide all cities with ideas on developing their own pathways to improvement.
4 The pulse of urbanism The results, in many cases, confirm that traditional leaders still maintain advantages. New York, London, Paris and Tokyo top a number of overall indicators and individual variables on the strength of their historical achievements, as well as actions now underway. For instance, New York is notable for its base of intellect and innovation, which is likely to prove critical in navigating past current difficulties and creating new growth opportunities. London leads in its openness to business, providing a powerful magnet with its size and welcoming the global economy with its diversity, brand and policies. Cities like these understandably still hold beacons for progress. Visionary people invested tremendous work and energy over many years to build infrastructures of education, health, transportation, public works, buildings and, recently, e-readiness. Today s most powerful cities offer enduring strength and resiliency to bounce back from the current downturn. But emerging cities are making their own investments to challenge the established order. For some, like those in China and India, today s prosperity represents a renaissance, returning to a time when they were the established order, drawing the world to their riches. Already Beijing ranks right behind London and ahead of New York, Paris and Tokyo in transportation and infrastructure. São Paulo, Dubai and Mumbai lead the world in buildings under construction. Shanghai s intellectual capital puts it among the top cities. Shanghai and Beijing lead the list of working age populations per capita, paving the way for the future. Looking deeper Interestingly, the study also finds a number of cities that pound for pound offer more opportunity than meets the eye when considered relative to their qualities and size. These cities are setting new standards and doing things right with forward-looking policies and programs to promote growth in a globalized world. For example, Chicago and Toronto are noteworthy for strong purchasing power, diversity and quality of life, among other things. Frankfurt, the smallest city studied, sets a standard for sustainability. Houston, Chicago and Los Angeles fare particularly well on cost competitiveness. Finally, while the study confirms some perceptions, it also offers new insights. Both emerging and mature cities have been busy in the last few years building and diversifying their infrastructures and economies. The world s great cities will continue to pave the way to a prosperous future. In this light, all these cities of opportunity offer lessons that apply well beyond their borders. Dennis M. Nally Kathryn S. Wylde Chairman and Senior Partner PricewaterhouseCoopers LLP President and CEO Partnership for New York City
5 Contents Cities of Opportunity is presented in three reinforcing sections: Overview provides orientation to understand the methodology and scoring as well as bird s-eye views of the findings. Dynamic measures mines the data to show directions and points to those cities with the most forward-looking policies. Indicator discussions returns to the initial study areas and reviews the findings. A key to the variables can be found on pages 0. A detailed listing of definitions and source documents used to develop Cities of Opportunity can be found at

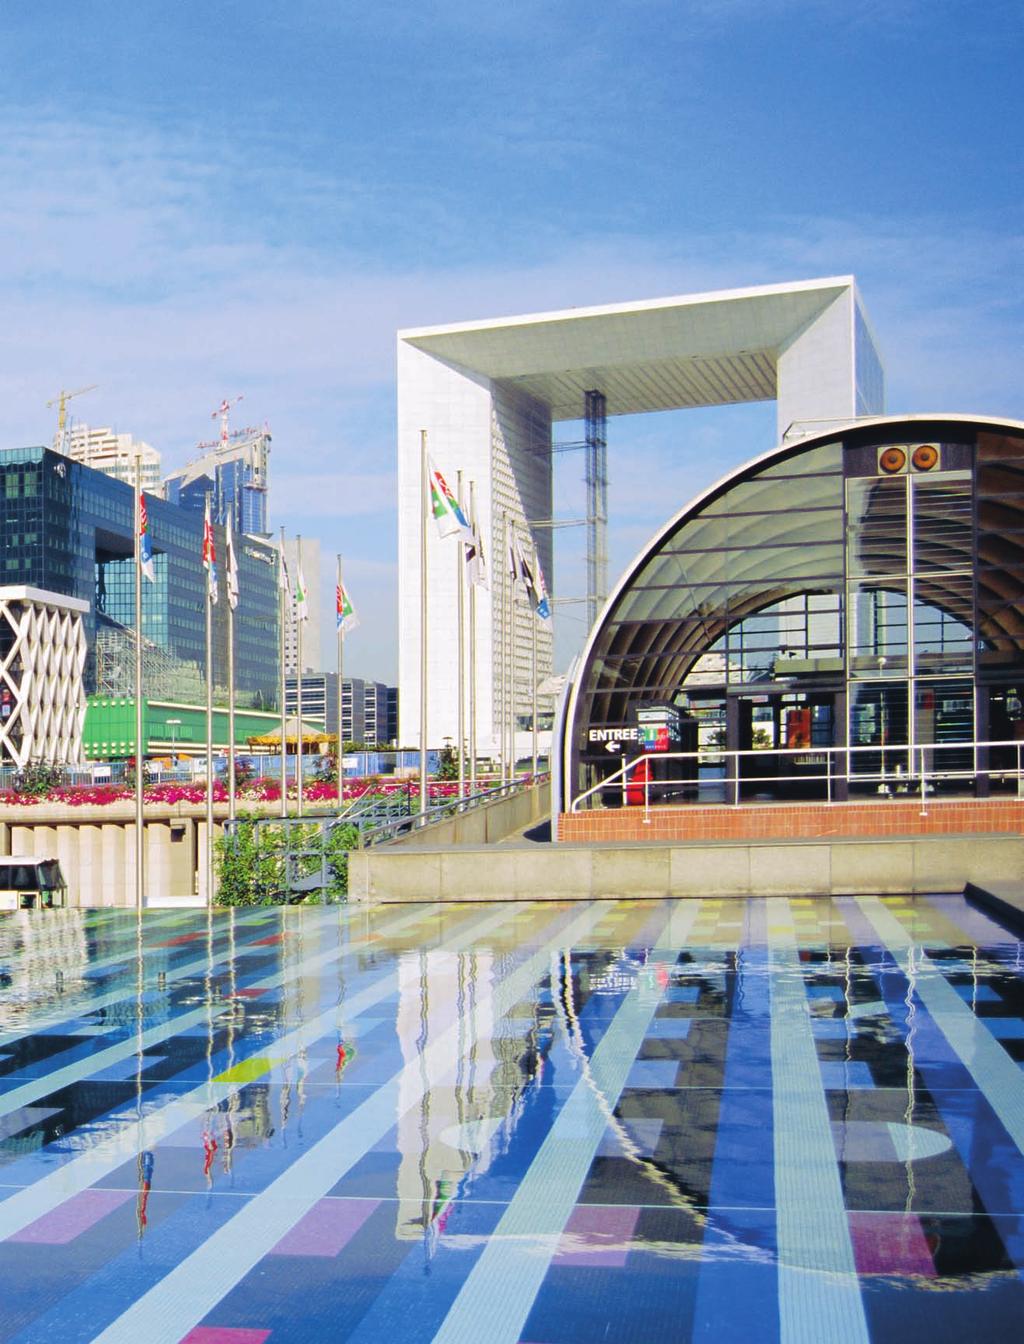
6 Overview Paris
7
8 Cities of Opportunity presents a robust look at the world s hubs of finance and commerce Study context The collaboration between PricewaterhouseCoopers and the Partnership for New York City that developed Cities of Opportunity began seven years ago in the wake of /. The enormous impact of / on companies and citizens caused a reassessment of what needed to be done to keep New York and, by extension, other cities like it vibrant engines of a globalizing economy. What direction will cities go in years to come? What key ingredients will be required to keep them strong? Which cities are actually doing things correctly, and what can be learned? PwC and the Partnership joined to answer these questions. Both organizations hold important stakes in the healthy growth of cities. The Partnership for New York City is a network of business leaders dedicated to enhancing the economy of the five boroughs of New York City and to maintaining the city s position as the center of world commerce, finance and innovation. PricewaterhouseCoopers is a partnership itself but one with a strong presence and mutual self-interest in the health of the 0 cities in which it operates around the world. This second edition of our report is significantly more ambitious than the first, extending from cities and variables in our 0 study to cities and variables now. Three key factors governed the cities we chose: Capital market centers. Many of the cities included are hubs of commerce, communications and culture. But all are financial capitals of their region meaning each plays an important role not only locally but also as a vital part of a globalizing economic fabric. Distributed over a broad geographic sampling. While each city is a center of finance and commerce in its own region and in many cases the world, collectively the cities form a representative international distribution. Balanced between mature and emerging economies. Twelve mature cities and eight newly growing ones are included. While debates may continue to simmer on which established city is the leading financial or cultural capital, the real headlines will be made as the world continues to globalize and new centers rival the prosperity and power of the traditional leaders. Some intuitively compelling cities were left off the list because they failed to meet all three criteria. For instance, Bangalore is a center of technology, Atlanta is a headquarters city, but neither is a true financial capital. In terms of the data indicators selected, we constructed a robust sampling of variables, each of which had to be: relevant; consistent across the sample; publicly available and collectible; current; free of skewing from local nuances; and truly reflective of a city s quality or power. (See pages 0 for a brief key to the variables and www. pwc.com/cities for a detailed listing of definitions and source documents used to develop Cities of Opportunity.) These criteria eliminated cities like Milan and Zurich, which lacked some of the data needed. Some variables, like the number of Wi-Fi zones, that once looked promising as representing the strength of a city s technological infrastructure, are now commonplace. In fact, to measure the variable acurately would have required a count of all wired coffee shops and launderettes in each city. Other promising indicators fail to reflect accurately a city s dynamism. For instance, patent filings do signal intellectual capital. But the innovations themselves may have been generated far from the city in which the paperwork was registered. The study s result is an unbiased, quality controlled and rich look at the pulse of key cities at the heart of the interconnected financial and commercial world. We investigated basic questions: What direction will cities go in years to come? What key ingredients will be required to keep them strong? Which cities are actually doing things correctly, and what can be learned? PricewaterhouseCoopers
9 Understanding the scoring: Seeking transparency and simplicity Because Cities of Opportunity is based on publicly available data supported by extensive research, three main sources were used to collect the relevant data: Global statistical organizations such as the World Bank and the International Monetary Fund (IMF); National statistics organizations such as National Statistics in the UK and the US Census Bureau in the US; and Commercial data providers. The data was collected during the second and third quarters of 0. In the majority of cases, the data used in the study refers to 0 and 0. In some cases, national data was used as a proxy for city data. For example, the data on ease of hiring is national data. However, it is based on the largest business city in each country, which in the bulk of cases is one of the cities included in this report. Care has been taken to ensure that, where used, national data closely reflects the city. Some of the finance data used in the research relates to market conditions before the credit crisis. For example, the data on domestic market capitalization relates to the end of 0. Unfortunately, up-todate data was not available across some of our finance variables. The city scoring methodology was developed to ensure transparency and simplicity for readers, as well as comparability across cities. The output makes for a robust set of results and a strong foundation for analysis and discussion. Taking the data for each individual variable, the cities were sorted from the best performing to the worst. The cities were then assigned a score from (the best performing) to (the worst performing). In the case of a tie, the cities were assigned the same score. Scoring ensures transparency and simplicity, as well as comparability across cities. A rich set of results offers a strong foundation for analysis and discussion. In some cases a city was not included in the ranking and, therefore, was not assigned a score (ranking at zero). For example, both Dubai and Johannesburg lack any top 00 global corporate headquarters. In these cases, the remaining cities were ranked and assigned a score from (reflecting the reduced number of cities in the ranking) to. Once each of the variables had been ranked and scored, they were placed into their indicators (for example, financial clout, demographic advantages and cost). Within each individual group, the variable scores were summed to produce an overall indicator score for that topic. This produces indicator league tables that display the relative performance of our cities (see Indicator Discussions, pages ). In attempting to score cities based on relative performance, we decided at the outset of our process that for maximum transparency and simplicity we would avoid applying overly complicated weights to the variables, and in so doing treat each variable with equal importance. This approach makes the study easily understandable and usable by business leaders, academics, policy makers and laypersons alike. Partnership for New York City
10 Summary of indicator rankings The maps below show city rankings in each of the study s overall indicators. Detailed results on variables and analyses are presented on pages to. In addition, a brief key to understanding the variables is available on pages 0. Detailed listings of definitions and source documents used to develop Cities of Opportunity are offered at High Medium Low The cities are sorted from the best to the worst performing, with each receiving a score from for best to for worst. In ties, cities are assigned the same score. Intellectual capital Toronto Chicago Los Angeles New York Houston Mexico City São Paulo London Frankfurt Paris Dubai Johannesburg Beijing Seoul Shanghai Tokyo Hong Kong Mumbai Singapore Sydney Technology IQ and innovation Transportation and infrastructure assets Toronto Chicago Los Angeles New York Houston Mexico City São Paulo London Frankfurt Paris Dubai Johannesburg Beijing Seoul Shanghai Tokyo Hong Kong Mumbai Singapore Sydney Toronto Chicago Los Angeles New York Houston Mexico City São Paulo London Frankfurt Paris Dubai Johannesburg Beijing Seoul Shanghai Tokyo Hong Kong Mumbai Singapore Sydney Demographic advantages Cost Toronto Chicago Los Angeles New York Houston Mexico City São Paulo London Frankfurt Paris Dubai Johannesburg Beijing Seoul Shanghai Tokyo Hong Kong Mumbai Singapore Sydney Toronto Chicago Los Angeles New York Houston Mexico City São Paulo London Frankfurt Beijing Seoul Paris Dubai Shanghai Tokyo Hong Kong Mumbai Singapore Johannesburg Sydney PricewaterhouseCoopers
11 Financial clout Lifestyle assets Toronto Chicago Los Angeles New York Houston Mexico City São Paulo London Frankfurt Paris Dubai Johannesburg Beijing Seoul Shanghai Tokyo Hong Kong Mumbai Singapore Sydney Toronto Chicago Los Angeles New York Houston Mexico City São Paulo London Frankfurt Paris Dubai Johannesburg Beijing Seoul Shanghai Tokyo Hong Kong Mumbai Singapore Sydney Health, safety and security Ease of doing business Toronto Chicago Los Angeles New York Houston Mexico City São Paulo London Frankfurt Paris Dubai Johannesburg Beijing Seoul Shanghai Tokyo Hong Kong Mumbai Singapore Sydney Toronto Chicago Los Angeles New York Houston Mexico City São Paulo London Frankfurt Beijing Seoul Paris Dubai Shanghai Tokyo Hong Kong Mumbai Singapore Johannesburg Sydney Sustainability Toronto Chicago Los Angeles New York Houston Mexico City São Paulo London Frankfurt Paris Dubai Johannesburg Beijing Seoul Shanghai Tokyo Hong Kong Mumbai Singapore Sydney The cities are sorted from the best to the worst performing, with each receiving a score from for best to for worst. In ties, cities are assigned the same score. High Medium Low Partnership for New York City

12 Dynamic measures London

13
14 The pulse of tomorrow The power of the world s capitals of finance and commerce radiates from their names: New York s grandeur; London s innovative edge; the buoyancy and light of Paris; Tokyo s driving vitality. Each maintains a history of energy and achievement. But when gauging the direction of these and other cities, the story is less plain. The subtext of where cities are headed, particularly, requires deeper digging. Which cities are rising above others? Which are moving actively to prosper in the interdependent st-century world? Which are encouraging the healthiest futures? To answer these questions, we investigated the study s variables along six axes of advancing urbanism: Quality versus power separating those areas where size and strength mainly matter from those where less may actually generate more Cost competitiveness dividing cities among the best values, fairly priced and most expensive Openness for business gauging the welcome not only for finance and commerce but talent as well Intellect and innovation investing in the fundamental building blocks of global economies Sustainability management testing the holistic thinking of big cities living on a small planet Physical momentum taking the pulse of construction and foreign investment While no individual city of opportunity surfaces as the winner, many cities do show where and how they are moving to take advantage of the opportunities offered by an interconnected world. (See Indicator Discussions, pages for a more detailed discussion of each.) Balancing quality and power: Chicago and Toronto share more than Great Lakes glimmer Dividing the variables into indicators of either a city s raw power or its per capita characteristics, a few cities show greater potential than the collective comparison reveals. Not surprisingly, the historically dominant cities of New York, London and Paris dominate when power indicators alone are investigated. But pound for pound, Chicago and Toronto display strong business readiness for the st century on per capita indicators alone, with gauges of power removed. Power variables show absolute size, which ties to historical strength for instance, a city s share of top 00 universities. (See Chart on page.) Quality variables normalize cities by population, showing the intensity of a given characteristic. Quality variables are typically per capita ratios that neutralize size as a comparative factor, such as the percent of a city s population with higher education. Many of them, like the higher education ratio, may also portray an element of a city s quality in the everyday sense of the word. (See Chart on page.) Chicago, America s traditional second city, stands tall in many areas its role in finance and business; mass transit and congestion management; diversity; purchasing power; and in many of the gauges of quality of life. For a city once known for its broad shoulders and industrial grit, greenness flourishes through a well-kept legacy of parks and architecture. And the Chicago Climate Exchange has introduced the first active carbon emissions trading platform in the US. Toronto ranks as a city with high quality of life and health, advanced education and great diversity. It has benefited from a national immigration policy aimed at attracting highly skilled workers. These strengths should help Toronto continue to prosper in a globalizing world. This section presents a different look at the individual variables that comprise our ten indicators (see pages ). Our goal is to plumb the data for stories within it that are not readily apparent. PricewaterhouseCoopers
15 New York and London, the world s two most powerful cities, also rate highly on quality variables. This shows both are taking active steps to stay at the forefront of a changing world economy and neither is resting on past achievements. In other interesting results, Sydney s natural strengths and forwardlooking policies pull it up from the lowest third in power to the highest grouping when size is removed as a factor. Houston fares better than some more intuitively global cities like Los Angeles, Paris and Tokyo. Two smaller cities, Frankfurt and Johannesburg, that lie at the bottom of power rankings, rise markedly in quality standings when results are normalized by population. Chart. Power: Cities where historical size matters Absolute measure Overall score Share of top 00 universities Share of top 0 MBA universities Number of medical schools Biomedical technology transfer Number of aircraft movements Incoming/outgoing passenger flows Cost of public transport Building: Approved and under construction Number of Global 00 HQs Domestic market capitalization Entertainment Hotel rooms Skyline impact Number of international tourists Number of hospitals Attracting FDI: Number of greenfield projects NEW YORK LONDON TOKYO PARIS HONG KONG CHICAGO BEIJING SHANGHAI HOUSTON SINGAPORE TORONTO SEOUL LOS ANGELES MEXICO CITY SÃO PAULO SYDNEY MUMBAI DUBAI FRANKFURT JOHANNESBURG Power variables show absolute size tied to historical strength. High Medium Low Partnership for New York City
16 Chart. Quality: Cities where less may generate more Intensity measure Overall score Percent of population with higher education Employment in high-tech services per,000 inhabitants E-readiness Registered taxis per,000 of population Miles of mass transit track per 0,000 of population Congestion management Electricity consumed per,000 of population Density of population Working-age population as a percent of total population Diversity of city population Percent of employment in financial and business services Level of shareholder protection Inflation Strength of currency: SDRs per currency unit Cost of business occupancy Cost of living Purchasing power Total tax take Entertainment Housing City brand Commute time Crime Healthy Living Expectancy Infant survival rate Natural disaster risk Political and social environment Ease of hiring Rigidity of hours Difficulty of firing Ease of entry: Number of countries with visa waiver Flexibility of visa travel Green cities Air quality Recycled waste percent diverted Green space as a percent of city s area CHICAGO TORONTO NEW YORK LONDON SINGAPORE HOUSTON SYDNEY LOS ANGELES FRANKFURT PARIS HONG KONG TOKYO SEOUL BEIJING DUBAI JOHANNESBURG MEXICO CITY SÃO PAULO SHANGHAI MUMBAI Quality variables are normalized by population. These are typically per capita ratios that remove size as a comparative factor. High Medium Low PricewaterhouseCoopers
17 Cost competitiveness: A fair pricing index shows Houston, Chicago and LA deliver urban value Relative cost values of each city also differentiate their attraction to finance and commerce. To compare each city, we determined average cost by creating a factor of costs of living and business occupancy. This is weighted in inverse proportion to purchasing power, and a competitive difference comes forward showing the best and worst values. (See Chart, right.) The ranking is a broad indicator that reveals most by comparing results at the poles rather than analyzing nuances between adjacent numbers. Its purpose is to gauge general cost levels relative to what might be expected according to basic economic theory: that is, a city in a rich country with high purchasing power would be expected to be more costly on a relative scale. Divergences from what might be expected determine competitiveness. Chart. A fair pricing index: Cost versus purchasing power HOUSTON CHICAGO LOS ANGELES JOHANNESBURG DUBAI TORONTO SYDNEY NEW YORK MEXICO CITY Competitive advantage Dubai proves among the better deals, tempering its glittering highrise image with the fact that the city s infrastructure and economy are still emerging even as it pursues ambitious plans and attracts capital. Many of the basics are still being built in this desert oasis. FRANKFURT SÃO PAULO TOKYO SINGAPORE Houston, Chicago and Los Angeles offer notably good values as major American cities. Toronto also scores well. For Chicago and Toronto this underscores the strength each showed in the quality comparison. SHANGHAI SEOUL LONDON BEIJING -. PARIS -. MUMBAI -. HONG KONG -. Competitive disadvantage Average cost is determined as a factor of costs of living and business occupancy. This is compared in inverse ranking to a purchasing power scale in which high numbers signal the greatest purchasing power. A difference emerges in which the highest positive numbers indicate competitive advantage, and the cities scoring on the other end of the spectrum show a competitive disadvantage. Partnership for New York City
18 Openness for business: London bridges old and new economies Our variables that reflect how open a city is for business how powerful it is now as a magnet for finance and commerce and how welcoming it is to an interconnected, realigning world offer the most insight on direction when separated into indicators of either quality or power. A window on the future is opened in the way the cities welcome the world. Visa waivers and travel, diversity, the political environment and, ultimately, their international brand overseas show the active ways they are rolling out the red carpet to talented newcomers. (See Chart below.) Notably, London tops both rankings, showing it is engineering for future growth on the strength of its rich legacy as well as forwardlooking actions. Toronto moves up meaningfully relative to its power position, buoyed by immigration policies that encourage focused economic development. On the power variables, London, Paris, New York and Tokyo lead. Their historical dominance surfaces in the ease and volume of travel, the number of international headquarters and the attraction of foreign tourists and investments that create new employment. (See Chart below.) As an interesting note, Beijing and Shanghai are closing ranks in the power comparison on Tokyo, the long-standing Japanese capital of finance. Frankfurt performs well for a small city. Chart. Power: Showing the strength to attract business Absolute measure LONDON PARIS NEW YORK TOKYO BEIJING SHANGHAI CHICAGO FRANKFURT LOS ANGELES TORONTO SEOUL HOUSTON SINGAPORE HONG KONG DUBAI MEXICO CITY SYDNEY MUMBAI SÃO PAULO JOHANNESBURG Overall score Number of aircraft movements Incoming/outgoing passenger flows Number of Global 00 HQs Number of international tourists Attracting FDI: Number of greenfield projects 0 0 Chart. Quality: Rolling out the welcome mat for a global economy Intensity measure Overall score LONDON TORONTO SYDNEY NEW YORK TOKYO FRANKFURT SINGAPORE HONG KONG CHICAGO PARIS LOS ANGELES SEOUL HOUSTON JOHANNESBURG MEXICO CITY DUBAI SÃO PAULO BEIJING SHANGHAI MUMBAI Diversity of population City brand Political and social environment Ease of entry: Number of countries with visa waiver Flexibility of visa travel These variables portray a city s openness to global business. High Medium Low PricewaterhouseCoopers
19 Intellect and innovation: A creative dynamo still hums in New York Universities lay down a solid foundation that, balanced with the intensity of a population s knowledge readiness, offers a rounded view of a city s intellectual base and its potential for innovation. As the world demands increasingly complex and sophisticated products and services, cities at the top of both rankings will continue to prosper. (See Charts and below.) New York does particularly well on both measures, showing not just its historical investment in education but also the large equity stake the city is taking in a future that continues to generate ideas and innovations. New York edges out other traditional powers with its strong academic base. But New York also leads in per capita quality variables of higher education, high-tech employment and e-readiness, offering one reason that New York stays at the top of the global rankings over time. Chicago rises markedly from its power ranking in the quality standings, finishing close behind New York and again benefiting when its impressive intellectual resources are normalized relative to population. Houston moves up notably as well. Chart. Power: The brain trust that stands today Absolute measure Overall score NEW YORK TOKYO LONDON PARIS SEOUL HONG KONG CHICAGO SHANGHAI HOUSTON LOS ANGELES BEIJING SINGAPORE SYDNEY MEXICO CITY SÃO PAULO TORONTO MUMBAI FRANKFURT DUBAI JOHANNESBURG Share of top 00 universities Share of top 0 MBA universities Number of medical schools Biomedical technology transfer Chart. Quality: Characteristics to build tomorrow Intensity measure Overall score NEW YORK CHICAGO HOUSTON LOS ANGELES PARIS SYDNEY LONDON TORONTO TOKYO SINGAPORE FRANKFURT HONG KONG BEIJING SEOUL SHANGHAI DUBAI SÃO PAULO JOHANNESBURG MEXICO CITY MUMBAI 0 Percent of population with higher education Employment in high-tech services per,000 inhabitants E-readiness As the demands for products and services grow more complex, cities where universities are entrenched in the social fabric are better situated to prosper. The financial centers in our study are particularly likely to grow when they possess highly educated populations and strong high-technology sectors that generate innovation and counterbalance their financial services economies with complementary job opportunities. High Medium Low Partnership for New York City
20 Sustainability management: Thinking ahead holistically, Frankfurt looks very green Some cities begin with natural beauty or inviting climates. But all cities share an increasingly crowded planet and a challenge to give their citizens healthy environments in which to thrive and grow. Open space, congestion management, ease of mass transit and healthful policies collectively paint a picture of the most forward looking green cities offering the best quality of life now and for the future. Among the smallest cities in the study, Frankfurt fields the most dynamic green outlook in actions like recycling. Big, traditional powers Paris, London and New York follow closely behind perhaps surprising residents in each, who may grumble at their commute or wonder about the air quality. But industrial-age planners often had the foresight to build extensive transportation systems and provide generous green spaces. These, with continuing vision and investment, can transport and refresh harried knowledge workers as they did hard-working factory hands in the past. Chart. Sustainability management: A cross section of forwardlooking indicators Overall score FRANKFURT PARIS LONDON NEW YORK CHICAGO SYDNEY SEOUL TORONTO SINGAPORE HONG KONG LOS ANGELES HOUSTON BEIJING JOHANNESBURG TOKYO SÃO PAULO MEXICO CITY SHANGHAI MUMBAI DUBAI Miles of mass transit track per 0,000 of population Congestion management Commute time Green cities Air quality Recycled waste percent diverted Green space as a percent of city s area Electricity consumed per,000 of population 0 0 Eight variables create a picture of what cities are doing or have done to promote sustainability in the future. Green cities itself is a composite index that tracks elements including health policies and vehicles per capita. High Medium Low PricewaterhouseCoopers
21 Physical growth: New and mature cities vie in brick-and-mortar momentum Physical growth signals city vitality by measuring the pace of new construction as well as job creation funded by foreign direct investment (FDI). Here, cities like Dubai and Shanghai show how quickly the emerging economies are moving. Both are growing at a rate about that of London and ahead of New York. However, emerging economies are more often seeing construction of new buildings and infrastructure, while mature economies often find themselves retrofitting existing offices and factories. London leads the overall ranking of mature economies. But that somewhat reflects the city s unrivaled dominance in UK business. Comparatively in the US, New York ranks as only one strong choice among major centers of finance and commerce including Chicago, Houston and Los Angeles, among others. Place chart here. Chart. Brick-and-mortar momentum DUBAI LONDON SHANGHAI MUMBAI SINGAPORE NEW YORK SÃO PAULO TORONTO BEIJING TOKYO SYDNEY CHICAGO MEXICO CITY PARIS HONG KONG FRANKFURT HOUSTON LOS ANGELES SEOUL JOHANNESBURG Overall score Building: Approved and under construction Attracting FDI: Number of greenfield projects Emerging economies spark new construction, while the traditional centers give themselves a face-lift. High Medium Low Partnership for New York City

22 Indicator discussions Shanghai

23
24 Intellectual capital A globalizing economy depends on expanding intellectual capital. It is the foundation of a knowledge-based world. And the wealth of a city s educational opportunities and brain trust represents the key to attracting the best businesses and the brightest talent. Renowned universities and a highly educated population act to attract those seeking high-quality educations and promising career opportunities. The percentage of a population with advanced degrees signals both a city s potential for finance, commerce and innovation as well as its energetic, thinking atmosphere. The cities ranking highest in this indicator hold no surprises. It is interesting to note, however, that while ranking relatively poorly in all other variables, emerging economies such as Mumbai, Beijing and Mexico City have the greatest number of medical schools. Higher education institutions are profitable investments, and this may be particularly true in medicine, with timeless demand, an aging population and advances in medical science. Shanghai performs notably. Ranking just under Tokyo and above all North American cities except New York, the Chinese center of finance and trade performs well across the board. No other emerging city approaches its consistently high ranking. However, the overall indicator rankings give a sense that emerging cities do understand the significance that establishing centers of learning and idea generation as well as building and attracting pools of skilled workers is a key to success in today s economy. Share of top 00 universities Percent of population with higher education Share of top 0 MBA universities Number of medical schools New York Paris London Tokyo 0 Shanghai Chicago Los Angeles Toronto Seoul 0 Houston 0 Sydney Hong Kong Beijing 0 Singapore São Paulo 0 0 Mexico City Mumbai 0 0 Frankfurt 0 Dubai 0 0 Johannesburg 0 Each city s score (here to ) is the sum of its rankings across variables. The city order from to is based on this score. See maps on pages for an overall indicator comparison. High Medium Low Highest rank in each variable PricewaterhouseCoopers
25 Technology IQ and innovation Technology and innovation have helped the world expand at an exceptionally fast rate, creating unprecedented opportunities and challenges. Today, as a globalizing world deals with an economic slowdown, the most resilient cities will be those best able to draw on their concentrations of cutting-edge technology, higher learning and market access to continue reinventing themselves through innovation. Further, cities where finance and commerce are bolstered by diversified employment in such areas as technology, will gain the balance required for long-term health and growth. Employment in high-tech services is greatest in Asian cities as well as mature economies with large populations and high-quality educational institutions. This is no surprise. Tokyo and Beijing are known as technology and innovation hubs providing steady and skilled employment opportunities. Sydney, London and Toronto benefit from strong higher education and firmly established economies. The ability to successfully and repeatedly transfer knowledge creation in biomedical technology to early-stage commercialization marks a city s innovative edge. Seoul, Hong Kong and Tokyo shine here due to the strong presence of technology industries supported by good universities. Mature cities like New York and Chicago benefit from their excellent universities as well, which help to concentrate pools of knowledge and innovation. E-readiness reveals the state of a country s information and communications technology infrastructure. This variable also assesses: the ability of a city s consumers, businesses and government to usefully access technology; the transparency of business and legal systems; and the extent to which governments encourage use of digital technologies. During an era of increasing interdependence, it is clear that economically well-balanced cities are able to weather storms more soundly and prosper faster than those dependent on a single sector. Investment in developing a technology sector and in supporting entrepreneurial innovation is instrumental in the diversification of a city s economy. Employment in high-tech services per,000 inhabitants Biomedical technology transfer E-readiness New York Chicago Tokyo Houston London Los Angeles Paris Hong Kong 0 Sydney 0 Singapore Frankfurt Seoul Toronto 0 Beijing Dubai Johannesburg Mexico City Shanghai São Paulo Mumbai Each city s score (here to ) is the sum of its rankings across variables. The city order from to is based on this score. See maps on pages for an overall indicator comparison. High Medium Low Highest rank in each variable Partnership for New York City
26 Transportation and infrastructure assets Transportation systems and infrastructure assets take a city s pulse at the physical heart showing the body s actual strength and movement. Workers commute and visitors fly in and out. Buildings rise. Electricity flows to residents, revealing the robustness of energy infrastructures. Congestion is managed, or at least tolerated. London Beijing 0 New York Registered taxis per,000 of population Miles of mass transit track per 0,000 of population Larger cities inherently outperform smaller ones on variables that measure raw power for instance, aircraft movements and incoming and outgoing passenger flows. However, other variables gauged in proportion to population such as the number of registered taxis, miles of underground track, congestion management and the cost of public transport show findings normalized, or placed in relative ratios among the cities. In a sense, this indicates a quality a city possesses versus the power it holds. Going forward, civic leaders and policy makers hold the most leverage to make a real difference in these qualities. Paris Chicago Tokyo Singapore Mexico City 0 Hong Kong Mumbai Frankfurt São Paulo The Buildings: Approved and under construction variable takes a snapshot of a city s growth trajectory. Although many developing cities such as São Paulo, Dubai and Mumbai currently lead here, as might be expected, Toronto and London follow close behind in the top five, suggesting that both are investing actively to retain their competitive edge. Seoul 0 Dubai Shanghai Los Angeles Houston Toronto 0 Overall, London tops the table, followed by Beijing, reflecting the latter s considerable investment and focus on transport and infrastructure in recent years. Olympic efforts likely figure in both capitals. Hosting the Olympics in 0 is likely to have had lasting benefits to Beijing s transport and infrastructure. London has already started to prepare for the Olympics. Johannesburg Sydney 0 Meantime, mature cities like New York, Paris and Chicago follow close behind, showing not only the power of their established infrastructure, but also actions to keep abreast with newly globalizing, growing cities. Given the current rates of growth in some emerging cities, particularly, it is likely that the ranks in the middle and bottom of the table will change in the next few years. For example, Dubai currently lacks mass transit track, but is in the process of building the world s largest automated, driverless metro system. PricewaterhouseCoopers
27 Aircraft movements Incoming/outgoing passenger flows Congestion management¹ Cost of public transport² Building: Approved and under construction Electricity consumed per,000 of population Each city s score (here to ) is the sum of its rankings across variables. The city order from to is based on this score. See maps on pages for an overall indicator comparison. High Medium Low Highest rank in each variable Congestion management is taken from the 0 Mercer reports. This reflects not only traffic congestion but also the modernity, reliability and efficiency of public transport measures of a city s active management of the issue. Cost of public transport data refers to the cost for the longest mass transit rail trip within the city boundaries. However, bus trips were used when rail systems were absent. Partnership for New York City
28 Demographic advantages The availability of labor to a city s economy complements the skills and education of a city s population (discussed in intellectual capital). Larger cities again have inherent advantages over smaller ones. Therefore, all the variables are presented on a ratio basis to standardize results. The inclusion of the density of population (the number of people per square kilometer divided by city population) captures the relative concentration of individuals within city boundaries. This reflects the domestic demand on the city s economy, along with the current and future available labor. In addition, the working-age population as a percent of total reveals the proportion of individuals that businesses can currently draw on to contribute to the city s economy. The study defines diversity according to the number of nationalities represented in each city, each of which accounts for at least 0. percent of the total foreign-born population. This reflects the openness and attractiveness a city offers to foreign labor assuming that a truly global city today draws workers from around the world. New York and London are obvious international magnets. Relatively smaller cities Toronto and Chicago as well as São Paulo and Sydney are all notable for drawing foreign workers. Rapidly developing cities like Shanghai, Beijing, Dubai and Seoul top the list with their proportions of working-age populations. Density of population Working age population as a percent of total population Diversity of population Seoul Beijing New York London 0 Toronto 0 São Paulo Chicago Tokyo Hong Kong Singapore Los Angeles 0 Shanghai 0 Frankfurt Mumbai Paris Sydney Dubai Houston Mexico City Johannesburg Each city s score (here to ) is the sum of its rankings across variables. The city order from to is based on this score. See maps on pages for an overall indicator comparison. High Medium Low Highest rank in each variable PricewaterhouseCoopers
29 Cost Although our research focuses in greatest depth on the emerging st-century variables that affect globalizing cities such as intellectual capital, innovation and sustainability cost remains an important factor when it comes to businesses investing in an area and people deciding to live and work there. This indicator has been designed to reflect not only the costs to business and to individuals but the area s purchasing power as well. Cost of business occupancy measures accommodation costs on a per workstation basis. The measure reflects the way organizations occupy and use the space as well as the cost of space on a unit-area basis. The cost indicator also includes total tax take as a percent of profits that is, the total amount of taxes and mandatory contributions payable by the business as a percent of profits. Cost-of-living data is derived from Mercer s cost-of-living databases, which includes housing and cost of a basket of common household items. The purchasing-power data provides a link between prices and earnings. As expected, developing cities tend to outperform more mature economies when it comes to cost. The reverse holds true when looking at purchasing power and tax take. Houston, Johannesburg and Chicago top the indicator. While Johannesburg is the cheapest city, Houston and Chicago perform strongly across all the variables. Cost of business occupancy Cost of living Purchasing power Total tax take Houston Johannesburg Chicago Dubai 0 Los Angeles 0 Toronto Mexico City Singapore New York Sydney Frankfurt Sao Paulo Seoul London Hong Kong 0 Tokyo 0 Shanghai Beijing Mumbai Paris Each city s score (here to ) is the sum of its rankings across variables. The city order from to is based on this score. See maps on pages for an overall indicator comparison. High Medium Low Highest rank in each variable Partnership for New York City
30 Financial clout Financial clout analysis offers particular interest to the study, since all cities represent financial hubs in their region or beyond. The indicator captures each city s success as a global business and financial center, ability to attract financial resources and stability and security of investments. London New York Number of Global 00 HQs Percent of employment in financial and business services The indicator mixes variables capturing the size and quality of each city. For example, the number of Global 00 headquarters and domestic market capitalization reflect a city s power. The percent of employment in financial and business services reflects the concentration of activity in these high value-added sectors. Paris Toronto Chicago Frankfurt Hong Kong The level of minority shareholder protection measures the strength of safeguards against the misuse of corporate assets by directors for their personal gain. This is a key component in a successful financial center. Even though an area may have considerable growth, investments will not be maximized unless investors feel adequately protected. Tokyo Houston 0 Los Angeles Sydney Singapore Seoul Inflation and strength of currency reflect economic prosperity. The strength-of-currency measure is derived from the IMF s Special Drawing Right (SDR) per currency unit. It measures the ability of specific currencies to buy amounts of a basket of major currencies (the US dollar, the euro, the Japanese yen and pound sterling). Shanghai Beijing São Paulo Mumbai Johannesburg 0 Not surprisingly London, New York and Paris top this indicator, and developing cities sit at the bottom of the table. Mexico City Dubai 0 Although some of the financial data used in the research predates the credit crisis (such as that on domestic market capitalization which relates to the end of 0), the overall relationship among cities in this indicator is likely to have remained much the same taking into account post-crisis data. The market capitalization of a stock exchange is the total number of issued shares of domestic companies, including their respective prices at a given time. This figure reflects the comprehensive value of the market at that time. Level of shareholder protection index is the average of transparency of transactions, liability for self-dealing and shareholders ability to sue officers and directors for misconduct. 0 PricewaterhouseCoopers
31 Domestic market capitalization¹ Level of shareholder protection² Inflation Strength of currency (SDRs per currency unit) Each city s score (here to ) is the sum of its rankings across variables. The city order from to is based on this score. See maps on pages for an overall indicator comparison. High Medium Low Highest rank in each variable Partnership for New York City
32 Lifestyle assets Lifestyle assets add to the quality of life and well-being potential each city offers its residents and visitors. Entertainment Hotel rooms Numbers of international tourists and the City Brand Index were used as proxies to gauge how a city is viewed on the world stage. Paris, New York and London share perceptions of distinction. Singapore and Hong Kong show their increasing allure. New York Hong Kong London Paris City Brand measures the overall perception of the city, impacting decisions ranging from which ones are good vacation destinations to which ones are sensible business locations. Paris, London and New York fare well again. Interestingly, Sydney ranks highest in city brand and entertainment as well as quality and availability of housing. Yet it ranks very low in international tourism, reflecting Australia s geographic distance from most of the world s population. Singapore Sydney Toronto Los Angeles Tokyo Houston The power of a skyline, such as Hong Kong s, can create awe and play a part in the unconscious, instinctive decisions we make to revisit or locate to a city. Honorable mentions include New York, Seoul and Chicago. The housing variable measures the quality, availability and affordability of housing, household appliances and furniture, as well as household maintenance and repair. Sydney, Toronto and Houston lead in this variable, while more expensive cities like Paris do not rank as highly. Mature cities such as Sydney, London, Los Angeles and Paris generally fare best in entertainment, as might be expected. Also unsurprisingly, hotel room rankings parallel heavily visited cities excluding Beijing, whose ranking in hotel rooms was influenced by the 0 Olympics. Chicago Dubai Beijing Seoul Frankfurt São Paulo Shanghai Mexico City Johannesburg Mumbai Favorable commute-time of course adds to quality of life. A mix of cities Beijing, Seoul and Houston lead in this ranking that considers all modes of transportation. Overall, most of the mature city economies achieved quality lifestyle assets long ago. A number of emerging economies are currently struggling with meeting basic needs for their people in the wake of poverty and population growth. A continually globalizing world will put a rising premium on cities that offer the best lifestyles to skilled workers and relocating companies. PricewaterhouseCoopers
33 Housing City brand Skyline impact Number of international tourists Commute time Each city s score (here to ) is the sum of its rankings across variables. The city order from to is based on this score. See maps on pages for an overall indicator comparison. High Medium Low Highest rank in each variable Partnership for New York City
34 Health, safety and security A number of factors from government action to cultural norms contribute to a city s overall success in providing its citizens with the basic human rights of health, safety and security. Crime Number of hospitals Personal safety is reflected by the number of crimes in a city, from petty to violent, committed against citizens, visitors and their property. Singapore, Dubai and Hong Kong share the lowest levels of crime. Severity of punishments, strength of law enforcement, cultural norms and social structures all play roles in the frequency of crime. Toronto 0 Singapore Tokyo Chicago Frankfurt Paris Hospital availability, infant survival rates and healthy longevity all reflect a city s ability to provide residents with good healthcare and well-being. Singapore, Tokyo, Paris and Frankfurt possess excellent rates of infants surviving at least their first year. Rates in emerging economies lie at the bottom of the list. Tokyo tops the list for healthy living expectancy the average number of healthy years that a person can expect to live. This data measures the effectiveness of health systems in reducing the burden of illness. Sydney, Toronto and Frankfurt also rank high in healthy longevity. Houston New York Sydney London Los Angeles Dubai Hong Kong Seoul Beijing Mexico City Toronto stands as the safest city for natural disaster as measured by statistics from the Center for International Earth Science Information Network s ranking of the frequency of six types of natural disaster: cyclone, drought, earthquake, flood, landslide and volcano. With more and more business activity concentrated in urban centers, an increasingly important factor for a city is its ability to manage disasters by supporting business continuity and minimizing economic effects. Mumbai Shanghai Johannesburg 0 São Paulo 0 The effects of a nation s and city s political and social environment cross all aspects of business and personal life. For instance, the strength of government relationships with other nations, domestic stability and good law enforcement all contribute to security. Limits on freedom and censorship stand in the way of good business conduct in an interconnected world. Frankfurt, Toronto, Tokyo, Paris and Sydney top the list in achieving personal freedoms. Taking a step back, as the world economy continues to globalize, emerging cities can be expected to enjoy increasingly improved healthcare, safety and security as more prosperous citizens demand more advanced quality of life. PricewaterhouseCoopers
35 Healthy Living Expectancy Infant survival rate Natural disaster risk Political and social environment Place chart here. Each city s score (here 0 to 0) is the sum of its rankings across variables. The city order from to is based on this score. See maps on pages for an overall indicator comparison. High Medium Low Highest rank in each variable Partnership for New York City
36 Ease of doing business The extent to which a city makes it easy for businesses to operate complements cost, labor, transport, financial clout, lifestyle and security in determining which cities offer the most well-rounded opportunities in a globalizing world. Singapore Ease of hiring¹ Rigidity of hours² This indicator measures the ease of hiring, the rigidity of hours (including scheduling of nonstandard work hours and annual paid leave), and the difficulty of firing (including notification and approval requirements for termination of a redundant worker, obligation to reassign or retrain and priority rules for redundancy and reemployment). These three variables are taken from national data. However, the national estimates are based on the most populous city in the country (in most cases the city included in our research). This national data accurately reflects the business environment in our cities (for example, the same legislation and labor laws are imposed in parts of the UK, including London). Only the US cities included in the analysis may differ marginally from this national data, as state law may result in subtle differences in labor laws. The ease of doing business internationally is measured by the number of countries from which a resident can enter the specific city without a visa and by the flexibility of visa travel (which ranked cities according to the number of visa waivers available and the duration of visas granted). Finally, the number of greenfield (new job creating) projects in a city that are funded by foreign direct investment gauges current success at attracting globalized businesses, an indicator of both ease of doing business and growth. Hong Kong London New York Chicago Los Angeles Houston Toronto Dubai Sydney 0 Tokyo Seoul Frankfurt Shanghai Johannesburg 0 Beijing Paris Mumbai Mexico City Sao Paulo Singapore outperformed all cities, leading in the ease of hiring and the number of countries with visa waivers. Expectedly, it also finished strongly in the remaining indicators. Interestingly, although Shanghai attracted the most greenfield foreign direct investment, the mature economies of London, Paris and Singapore were also successful in this variable. PricewaterhouseCoopers
37 Difficulty of firing³ Ease of entry: Number of countries with visa waiver Flexibility of visa travel Attracting FDI: Number of greenfield projects Each city s score (here to ) is the sum of its rankings across variables. The city order from to is based on this score. See maps on pages for an overall indicator comparison. High Medium Low Highest rank in each variable Three variables have several components and all take values between 0 and 0, with higher values indicating more rigid regulation. For example, the ease of hiring index measures whether fixed term contracts are prohibited for permanent tasks; the maximum cumulative duration of fixed term contracts and the ratio of the minimum wage for a trainee or first time employee to the average value added per worker. An economy is assigned a score of if fixed term contracts are prohibited for permanent tasks and a score of 0 if they can be used for any task. A score of is assigned if the maximum cumulative duration of fixed term contracts is less than years; 0. if it is years or more but less than years; and 0 if fixed term contracts can last years or more. Finally, a score of is assigned if the ratio of the minimum wage to the average value added per worker is 0. or more; 0. for a ratio of 0.0 or more but less than 0.; 0. for a ratio of 0. or more but less than 0.0; and 0 for a ratio of less than 0.. Averaging the scores and scaling the result to 0 gives a final index. The rigidity of hours index has components: (i) whether night work is unrestricted; (ii) whether weekend work is unrestricted; (iii) whether the work week can consist of. days; (iv) whether the workweek can extend to 0 hours or more (including overtime) for months a year to respond to a seasonal increase in production; and (v) whether paid annual vacation is working days or fewer. For each of these questions, if the answer is no, the economy is assigned a score of ; otherwise a score of 0 is assigned. Averaging the scores and scaling the result to 0 gives a final index. The difficulty of firing index has components: (i) whether redundancy is disallowed as a basis for terminating workers; (ii) whether the employer needs to notify a third party (such as a government agency) to terminate redundant worker; (iii) whether the employer needs to notify a third party to terminate a group of redundant workers; (iv) whether the employer needs approval from a third party to terminate redundant worker; (v) whether the employer needs approval from a third party to terminate a group of redundant workers; (vi) whether the law requires the employer to reassign or retrain a worker before making the worker redundant; (vii) whether priority rules apply for redundancies; and (viii) whether priority rules apply for reemployment. For the first question an answer of yes for workers of any income level gives a score of and means that the rest of the questions do not apply. An answer of yes to question (iv) gives a score of. For every other question, if the answer is yes, a score of is assigned; otherwise a score of 0 is given. Questions (i) and (iv), as the most restrictive regulations, have greater weight in the construction of the index. Averaging the scores and scaling the result to 0 gives a final index. Partnership for New York City
38 Sustainability With half the world s people living in cities and that share projected by the UN Population Fund to hit 0 percent by mid-century, public policies focused on sustainability will make tremendous advances in creating a healthier and more vibrant environment for both urban populations and the world. Cities of Opportunity weighs air quality, recycling rates, recreational space and a green cities index to compare efforts toward sustainability. To be sure, sustainability is on the planning agenda of most cities today, albeit at different stages. Cost-benefit analyses indicate that open space often offers greater benefit to citizens than do revenuegenerating properties in terms of the ability to make a city more attractive to a globalizing world. Our analysis shows emerging cities rank lowest in sustainability not surprising as they rush to catch up with their long-industrialized peers. Yet they also possess a real opportunity: planning is easier as a city grows, and emerging economies can learn from the earlier missteps of the mature economies to further sustainable innovation. In terms of the variables we chose, the green cities index is based on a variety of raw measurements and subjective assessments to capture a city s greenness and good citizenry. Components include garbage production per capita, gasoline and electricity prices, private vehicles per capita, public transit s share of energy consumption and smoking laws. Air quality is a common gauge of sustainable practices. Mature cities tend to have the best levels, with a few exceptions, such as Houston and Los Angeles faring relatively poorly. In fast-growing cities like Mumbai and Dubai, the rapid pace of development is reflected by the high level of air pollutants. Looking at recycling rates, Frankfurt s lead in diverting garbage from landfills illustrates an interesting chicken-and-egg question that urban policy makers face in promoting sustainable behaviors. That is, what drives the greenest actions public policies, or community environmental stewardship and conscientious economic development? In the case of Frankfurt, residents pay fees based on weight for the amount of their non-recycled refuse. Nothing is charged for waste that is recycled. Implementing sustainable practices requires both strong municipal policy actions and support by a city s residents. While cities are at different stages of developing innovative policies, all are facing the same questions of whether to make sustainability a central goal and if so, how to move most effectively by regulating, engaging and energizing residents, or some combination of all three. PricewaterhouseCoopers
39 Green cities Air quality Recycled waste percent diverted Green space as a percent of city area Frankfurt New York Paris Sydney Toronto 0 London Chicago Singapore Hong Kong Seoul Houston Los Angeles 0 Tokyo Johannesburg Beijing Mexico City Shanghai Sao Paulo Mumbai Dubai Each city s score (here to ) is the sum of its rankings across variables. The city order from to is based on this score. See maps on pages for an overall indicator comparison. High Medium Low Highest rank in each variable Partnership for New York City
40 Key to the variables Air quality: Indicated by the average annual concentrations of particulate matter measured in micrograms per cubic meter in residential areas away from air pollution hot spots, such as transport corridors. Aircraft movements: Air traffic movements include civil international passenger, cargo and non-revenue flights, but exclude military and local flights. Attracting FDI number of greenfield projects: The number of greenfield (new job creating projects) in the destination city funded by foreign direct investment. Biomedical technology transfer: The value of biotechnology transfer at the university level in each city, from knowledge creation to technology transfer and early-stage commercialization. The scores are based on total composite scores for all schools in each city. Building approved and under construction: The number includes building projects either approved or under construction in each city. City brand: The Anholt City Brands Index SM is based on how a city is perceived, impacting decisions ranging from vacation destinations to business relocation. Rankings include such criteria as international status, physical assets, economic and educational opportunities, image, friendliness of citizens and basic public amenities. Commute time: The commute time assesses the average commute time across all modes, measured in minutes. Congestion management: The management-oftraffic-congestion score for each city is included from the 0 Mercer Quality of Life Reports. The reports include the level of traffic congestion in addition to modernity, reliability and efficiency of public transport. Cost of business occupancy: The cost of business occupancy is measured by the annual total occupancy cost per workstation in USD within a city s central business district. Cost of living: The Cost of Living Indexes are based on Mercer s cost of living database and are modified to include housing and to reflect constant weighting and basket items. Cost of public transport: Data for the cost of public transport for the longest mass transit rail trip within the city boundaries are included; bus trips were used when rail systems were absent. Crime: Includes figures of petty and property crimes, violent crimes and street crimes. Density of population: The density of each city is calculated by dividing the city population by the land area of the city in square kilometers. Difficulty of firing: Represents notification and approval requirements for termination of a redundant worker or a group of redundant workers, obligation to reassign or retrain and priority rules for redundancy and reemployment. Diversity of city population: The number of countries represented in each city for which there is more than 0. percent of the foreign-born population. Domestic market capitalization: The market capitalization of a stock exchange is the total number of issued shares of domestic companies multiplied by their respective prices at a given time. Ease of entry: Number of countries with visa waiver: The number of countries whose citizens may enter the city without a visa is quantified. Ease of hiring: Includes data on restrictions and regulations employers must follow when taking on new staff. Electricity: Total electricity consumption in megawatt hours is divided by the city population and multiplied by,000. Employment in high-tech services: The number of people employed in high-tech services per,000 inhabitants. Entertainment: Includes the quality and variety of restaurants, theatrical and musical performances, cinemas, and sport and leisure activities within each city. E-readiness: Measures the ability of a country s consumers, businesses and government to use information and communications technology to their benefit. Also assesses citizens ability to utilize technology skillfully and the transparency of the business and legal systems and the extent to which governments encourage the use of digital technologies. Flexibility of visa travel: Countries were ranked taking into account both the number of visa waivers available and the time the visa would be granted for. Any additional restrictions were counted as negatives. Green cities: The Green Cities Index from Reader s Digest is based on variables to capture a city s local greenness, and good citizenry. Variables include raw data as well as qualitative analysis such as garbage production per capita, gasoline price, price of electricity, recycling laws, private vehicles per capita, public transit s share of energy consumption and smoking laws. Green space as a percentage of city s area: A city s land areas designated as recreational and green spaces out of the total land area. Healthy Living Expectancy: The Healthy Living Expectancy is the average number of years that a person can expect to live in full health by taking into account years lived in less than full health due to disease and/or injury. Hotel rooms: A count of all hotel rooms within each city. Housing: The term housing includes measures of availability, diversity, cost and quality of housing; household appliances and furniture; and household maintenance and repair. 0 PricewaterhouseCoopers
41 Incoming/outgoing passenger flows: The total number of incoming and outgoing passengers includes originating, terminating, transfer and transit passengers in each of the airports located within each city. Transfer and transit passengers are counted twice. Infant survival rate: The probability of a child living until at least age one. Inflation: Inflation reflects the rise in price of goods and services, or the Consumer Price Index (CPI). Level of shareholder protection: A measurement of minority shareholder protections against misuse of corporate assets by directors for their personal gain. The Strength of Investor Protection Index is the average of transparency of transactions, liability for self-dealing and shareholders ability to sue officers and directors for misconduct. Miles of mass transit track per 0,000 of population: The miles of metro, tram and light rail track within the city is divided by the city population and then multiplied by 0,000. Natural disaster risk: The risk of natural disasters occurring in a region, including hurricane, drought, earthquake, flood, landslide and volcano hazards. Number of Global 00 HQs: The number includes the Global 00 headquarters located in each city. Number of hospitals: The number includes a count of all hospitals within each city. Number of international tourists: Includes international tourist arrivals for each city in 0. Number of medical schools: The number includes medical schools located in each city. Percent of employment in financial and business services: Ratio of employees in this sector to the total city workforce. Percent of population with higher education: The percent of the population with a higher education is derived from the number of people with a university-level education or higher, then divided by the total population. Political and social environment: Governments relationship with other countries, internal stability, law enforcement, and the sociocultural environment limitations on personal freedom and media censorship. Purchasing power: A measure that establishes a link between prices and earnings. Recycled waste percent diverted: The percent of waste recycled in each city (diverted from landfills). Registered taxis per,000 of population: The number of registered taxis in each city is divided by the city population and then multiplied by,000. Rigidity of hours: Reflects the flexibility in scheduling of nonstandard work hours and annual paid leave for a business. Skyline impact: A ranking of cities by the visual impact of completed high-rise buildings on their skylines. Strength of currency (SDRs per currency unit): The IMF variable is designed to measure the strength of currencies. It is essentially the amount of a basket of major currencies that can be bought by a given currency unit (measured in dollars). To access the official definition please refer to: external/np/fin/data/rms_sdrv.aspx. Top 0 MBA universities: Each city s share of the world s top 0 MBA universities. Top 00 universities: Each city s share of the world s top 00 universities. Total tax take: The total tax take includes the total amount of taxes and mandatory contributions payable by the business as a percent of the profit. Working-age population: A city s working-age population includes all residents aged years to years within the city, divided by the total city population expressed as a percentage. Partnership for New York City
42 Contributors Strategic Direction PricewaterhouseCoopers: Tom Craren Brendan Dougher Partnership for New York City: Kathryn Wylde Study Team PricewaterhouseCoopers: Lindsey Brown Sabrina McColgan Neil McCullough Colin McIlheney Managing Editor William Sand Design Tatiana Pechenik Penny Timmerman Online Joe Breen Partnership for New York City: Brook Jackson Merrill Pond Diana Torres Macroeconomic analysis Per Berglund For a detailed listing of definitions and source documents for Cities of Opportunity, please visit our web site:
43 Business-readiness indicators for the st century

44
Cities of Opportunity: A New Zealand perspective
 September 2016 Cities of Opportunity: A New Zealand perspective pwc.co.nz A New Zealand lens on Cities of Opportunity 2 PwC The latest global Cities of Opportunity research continues to focus on two basic
Expat Explorer. Achieving ambitions abroad. Global Report
 Expat Explorer Achieving ambitions abroad Global Report 2 Expat Explorer Achieving ambitions abroad 4 Foreword 3 Foreword Expat life can be an exciting and challenging experience, often involving a leap
Understanding Welcome
 Understanding Welcome Foresight issue 159 VisitBritain Research February 2018 1 Contents Introduction Welcome summary Market summary UK NBI welcome Elements of welcome UK results Market summary heat map
An Equity Profile of the Southeast Florida Region. Summary. Foreword
 An Equity Profile of the Southeast Florida Region PolicyLink and PERE An Equity Profile of the Southeast Florida Region Summary Communities of color are driving Southeast Florida s population growth, and
SECTION THREE BENEFITS OF THE JSEPA
 SECTION THREE BENEFITS OF THE JSEPA 1. Section Two described the possible scope of the JSEPA and elaborated on the benefits that could be derived from the proposed initiatives under the JSEPA. This section
Risk and Return. Foreign Direct Investment and the Rule of Law. Briefing Note
 Risk and Return Foreign Direct Investment and the Rule of Law Briefing Note Risk and Return Foreign Direct Investment and the Rule of Law 3 Briefing Note Background and objectives The Economist Intelligence
GLOBALIZATION S CHALLENGES FOR THE DEVELOPED COUNTRIES
 GLOBALIZATION S CHALLENGES FOR THE DEVELOPED COUNTRIES Shreekant G. Joag St. John s University New York INTRODUCTION By the end of the World War II, US and Europe, having experienced the disastrous consequences
The Senior Consumer. The Institute of Food, Medicine and Nutrition October David Donnan. A.T. Kearney October
 The Senior Consumer The Institute of Food, Medicine and Nutrition October 2015 David Donnan A.T. Kearney October 2015 1 We are facing an Agequake THE SUPER-AGING OVERHANG (Countries with >65 segments over
Who can create jobs in america? The American Worker Perspective on U.S. Job Creation
 Who can create jobs in america? The American Worker Perspective on U.S. Job Creation Who can create jobs in america? The perspectives of a CFO master class The American Worker Perspective on U.S. Job Creation
International Investor Perceptions and the Nation Brand - Views from Germany. Brand South Africa Research Note. By:
 Research Note International Investor Perceptions and the Nation Brand - Views from Germany By: Dr. Judy Smith-Höhn, Ms. Leigh-Gail Petersen, Mr. Thabelo Mbedzi Contents 1. Introduction 1 2. Country Brand
2018 Greater Vancouver Economic Scorecard. Dr. Daniel F. Muzyka Immediate Past President and Chief Executive Officer The Conference Board of Canada
 2018 Greater Vancouver Economic Scorecard Dr. Daniel F. Muzyka Immediate Past President and Chief Executive Officer The Conference Board of Canada Agenda Regional scorecard purpose Scorecard results Greater
HSBC Expat. Expat Explorer Survey Survey Report
 HSBC Expat Expat Explorer Survey 2011 Survey Report THE EXPAT EXPLORER SURVEY 2011 PAGE 1 Expat Explorer Survey Commissioned by HSBC Expat, Expat Explorer is the world s largest global survey of expats.
General Assembly Twenty-second session Chengdu, China, September 2017 Provisional agenda item 4
 General Assembly Twenty-second session Chengdu, China, 11-16 September 2017 Provisional agenda item 4 A/22/4 Madrid, 9 September 2017 Original: English Statement by the Secretary-General I. Tourism at
FORESIGHT - Issue 75: January 2010
 FORESIGHT - Issue 75: January 21 Market Focus The BRIC markets Brazil, Russia, India and China between them account for 42% of the world s population, have a combined landmass equivalent to 28% of all
A COMPARISON OF ARIZONA TO NATIONS OF COMPARABLE SIZE
 A COMPARISON OF ARIZONA TO NATIONS OF COMPARABLE SIZE A Report from the Office of the University Economist July 2009 Dennis Hoffman, Ph.D. Professor of Economics, University Economist, and Director, L.
ECONOMY MICROCLIMATES IN THE PORTLAND-VANCOUVER REGIONAL ECONOMY
 MICROCLIMATES IN THE PORTLAND-VANCOUVER REGIONAL by Sheila Martin, Director of the Institute of Portland Metropolitan Studies, Portland State University 1 Introduction The Regional Labor Market Portland-Vancouver
The Airbnb Community in Ontario
 The Airbnb Community in Ontario September 2016 Summary / 2 Appendix A / 5 Appendix B / 11 With more than two million listings in 34,000 cities and 192 countries, Airbnb is proud of the positive impact
THE CPA AUSTRALIA ASIA-PACIFIC SMALL BUSINESS SURVEY 2015 VIETNAM REPORT
 THE CPA AUSTRALIA ASIA-PACIFIC SMALL BUSINESS SURVEY 2015 VIETNAM REPORT 2 THE CPA AUSTRALIA ASIA-PACIFIC SMALL BUSINESS SURVEY 2015 VIETNAM REPORT LEGAL NOTICE CPA Australia Ltd ( CPA Australia ) is one
Monthly Inbound Update June th August 2017
 Monthly Inbound Update June 217 17 th August 217 1 Contents 1. About this data 2. Headlines 3. Journey Purpose: June, last 3 months, year to date and rolling twelve months by journey purpose 4. Global
International Investor Perceptions and the Nation Brand - Views from Brazil. Brand South Africa Research Note. By: Brand South Africa Research
 Research Note International Investor Perceptions and the Nation Brand - Views from Brazil By: Brand South Africa Research Contents 1. Introduction 1 2. Country Brand Health Funnel 2 2.1. Familiarity 2
How s Life in the United States?
 How s Life in the United States? November 2017 Relative to other OECD countries, the United States performs well in terms of material living conditions: the average household net adjusted disposable income
Brand South Africa Research Report
 Brand South Africa Research Report The Nation Brands Index 2017 - South Africa s global reputation By: Dr Petrus de Kock General Manager - Research Contents 1. Introduction 3 2. Highlights from the 2017
Prosperity in Central and Eastern Europe A Legatum Institute Prosperity Report
 Prosperity in Central and Eastern Europe 2016 A Legatum Institute Prosperity Report The Legatum Institute The Legatum Institute is an international think tank and educational charity focused on understanding
HOW ECONOMIES GROW AND DEVELOP Macroeconomics In Context (Goodwin, et al.)
") Chapter 17 HOW ECONOMIES GROW AND DEVELOP Macroeconomics In Context (Goodwin, et al.) Chapter Overview This chapter presents material on economic growth, such as the theory behind it, how it is calculated,
Chapter 17 HOW ECONOMIES GROW AND DEVELOP Macroeconomics In Context (Goodwin, et al.) Chapter Overview This chapter presents material on economic growth, such as the theory behind it, how it is calculated,
HUMAN CAPITAL LAW AND POLICY
 VOLUME 7, ISSUE 1, MARCH 17 IMMIGRATION IN BC: A COMPLEX TAPESTRY HIGHLIGHTS Immigration remains a key element in building a skilled workforce in BC and will play an even more significant role in the coming
Ambitious for Edinburgh
 EDINBURGH LIBERAL DEMOCRATS Ambitious for Edinburgh We will make your council work better for you. www.edinburghlibdems.org/election2017 Ambitious for Edinburgh Edinburgh s Liberal Democrats will make
Using the Index of Economic Freedom
 Using the Index of Economic Freedom A Practical Guide for Citizens and Leaders The Center for International Trade and Economics at The Heritage Foundation Ryan Olson For two decades, the Index of Economic
AmCham Hong Kong 2018 Business Sentiment Survey
 AmCham Hong Kong 2018 Business Sentiment Survey This is the first in a new annual series to gauge the major concerns, hopes and expectations of Hong Kong s international business community. The survey
Andhra Pradesh: Vision 2020
 OVERVIEW Andhra Pradesh: Vision 2020 Andhra Pradesh has set itself an ambitious vision. By 2020, the State will have achieved a level of development that will provide its people tremendous opportunities
AirPlus International Travel Management Study 2015 Part 1 A comparison of global trends and costs in business travel management.
 AirPlus International Travel Management Study 2015 Part 1 A comparison of global trends and costs in business travel management. SWITZERLAND Introduction Welcome to the tenth annual AirPlus International
A Barometer of the Economic Recovery in Our State
 THE WELL-BEING OF NORTH CAROLINA S WORKERS IN 2012: A Barometer of the Economic Recovery in Our State By ALEXANDRA FORTER SIROTA Director, BUDGET & TAX CENTER. a project of the NORTH CAROLINA JUSTICE CENTER
Keynote Speech by H.E. Le Luong Minh Secretary-General of ASEAN at the ASEAN Insights Conference 11 September 2014, London
 Keynote Speech by H.E. Le Luong Minh Secretary-General of ASEAN at the ASEAN Insights Conference 11 September 2014, London Mr Michael Lawrence, Chief Executive, Asia House Excellencies, Distinguished Guests,
The Nation Brand Index perspectives on South Africa s global reputation. Brand South Africa Research Note. By: Dr Petrus de Kock
 Brand South Africa Research Note The Nation Brand Index perspectives on South Africa s global reputation By: Dr Petrus de Kock 18 November 2015 Contents Introduction Findings from the 2015 Nation Brand
SMART STRATEGIES TO INCREASE PROSPERITY AND LIMIT BRAIN DRAIN IN CENTRAL EUROPE 1
 Summary of the Expert Conference: SMART STRATEGIES TO INCREASE PROSPERITY AND LIMIT BRAIN DRAIN IN CENTRAL EUROPE 1 6 November 2018 STATE OF PLAY AND CHALLENGES Citizens of new EU member states are increasingly
An Overview of the Chinese Economy Foundation Part: Macro-economy of the Mainland
 Core Module 15 An Overview of the Chinese Economy Foundation Part: Macro-economy of the Mainland The Chinese economy has been growing rapidly for years. Has it reached the level of the developed countries?
Meeting of APEC Ministers Responsible for Trade Sapporo, Japan 5-6 June Statement of the Chair
 Meeting of APEC Ministers Responsible for Trade Sapporo, Japan 5-6 June 2010 Statement of the Chair Introduction 1. We, the APEC Ministers Responsible for Trade, met in Sapporo, Japan from 5 to 6 June,
HSBC Bank International
 HSBC Bank International Expat Explorer Survey 2009 Report two: Expat Experience PAGE 2 I EXPAT EXPLORER SURVEY 2009 About the Expat Explorer Survey Expat Experience Commissioned by HSBC Bank International,
GROW WITH POLAND. 25 years. 10th Inhabitants 6 th in EU. without recession. The only such country in the EU
 The City of Warsaw GROW WITH POLAND 38.4 MLN 4.5% 25 years 8 th largest 10th Inhabitants 6 th in EU GDP growth forecast in 2018 without recession economy in EU most attractive destination for international
Mapping migrants: Australians wide-ranging experiences of immigration
 No. 13 December 2018 Mapping migrants: Australians wide-ranging experiences of immigration Charles Jacobs Mapping migrants: Australians wide-ranging experiences of immigration Charles Jacobs POLICY Paper
Creating a 21 st Century Workforce
 WHITE PAPER Creating a 21 st Century Workforce Immigration Reform JULY 2017 Table of Contents 3 Overview 4 The Technology Workforce 5 The U.S. Technology Industry and Global Competitiveness 6 The Skills
How s Life in Estonia?
 How s Life in Estonia? November 2017 Relative to other OECD countries, Estonia s average performance across the different well-being dimensions is mixed. While it falls in the bottom tier of OECD countries
LEFT BEHIND: WORKERS AND THEIR FAMILIES IN A CHANGING LOS ANGELES. Revised September 27, A Publication of the California Budget Project
 S P E C I A L R E P O R T LEFT BEHIND: WORKERS AND THEIR FAMILIES IN A CHANGING LOS ANGELES Revised September 27, 2006 A Publication of the Budget Project Acknowledgments Alissa Anderson Garcia prepared
Hong Kong 1997: Practical Aspects
 Case Western Reserve Journal of International Law Volume 20 Issue 1 1988 Hong Kong 1997: Practical Aspects Benjamin P. Fishburne III Follow this and additional works at: http://scholarlycommons.law.case.edu/jil
A POLICY FRAMEWORK FOR COASTAL AUSTRALIA
 A POLICY FRAMEWORK FOR COASTAL AUSTRALIA Author: Alan Stokes, Executive Director, National Sea Change Taskforce Introduction This proposed Coastal Policy Framework has been developed by the National Sea
2019 GUCDC. Global University Career Development (China) Conference. Beijing Qingdao Invitation & Agenda
 Conference. Beijing Qingdao Invitation & Agenda") 2019 GUCDC Global University Career Development (China) Conference Beijing Qingdao Invitation & Agenda 2019 GLOBAL UNIVERSITY CAREER DEVELOPMENT CONFERENCE (GUCDC) Contents Preface Introduction of 2019
2019 GUCDC Global University Career Development (China) Conference Beijing Qingdao Invitation & Agenda 2019 GLOBAL UNIVERSITY CAREER DEVELOPMENT CONFERENCE (GUCDC) Contents Preface Introduction of 2019
How the world views Britain 2017
 How the world views Britain 2017 Foresight issue 158 VisitBritain Research November 2017 1 Contents 1. Introduction and study details 2. Headline findings 3. Tourism, Culture and Welcome rankings 4. Tourism
Hearing on the U.S. Rebalance to Asia
 March 30, 2016 Prepared statement by Sheila A. Smith Senior Fellow for Japan Studies, Council on Foreign Relations Before the U.S.-China Economic and Security Review Commission Hearing on the U.S. Rebalance
epp european people s party
 The Future of European Trade: Traditional values in tomorrow s economy ADOPTED AT THE EPP CONGRESS - MALTA, 29ST AND 30ND MARCH 2017 01 The Future of European Trade: Traditional values in tomorrow s economy
1/24/2018 Prime Minister s address at Asian Ministerial Conference on Disaster Risk Reduction
 Press Information Bureau Government of India Prime Minister's Office 03-November-2016 11:47 IST Prime Minister s address at Asian Ministerial Conference on Disaster Risk Reduction Distinguished dignitaries
DRIVERS OF DEMOGRAPHIC CHANGE AND HOW THEY AFFECT THE PROVISION OF EDUCATION
 DRIVERS OF DEMOGRAPHIC CHANGE AND HOW THEY AFFECT THE PROVISION OF EDUCATION This paper provides an overview of the different demographic drivers that determine population trends. It explains how the demographic
Influence of Consumer Culture and Race on Travel Behavior
 PAPER Influence of Consumer Culture and Race on Travel Behavior JOHANNA P. ZMUD CARLOS H. ARCE NuStats International ABSTRACT In this paper, data from the National Personal Transportation Survey (NPTS),
How s Life in Austria?
 How s Life in Austria? November 2017 Austria performs close to the OECD average in many well-being dimensions, and exceeds it in several cases. For example, in 2015, household net adjusted disposable income
Area of study 2: Dynamic Places
 Area of study 2: Dynamic Places Topic 3: Globalisation Overview Globalisation and global interdependence continue to accelerate, resulting in changing opportunities for businesses and people. Inequalities
Visi n. Imperative 6: A Prosperous Economy
 Imperative 6: A Prosperous Economy North Carolina 20/20: Report of the North Carolina Progress Board 6.1 2 2 Visi n North Carolina s growing, diversified economy is competitive in the global marketplace.
How s Life in Mexico?
 How s Life in Mexico? November 2017 Relative to other OECD countries, Mexico has a mixed performance across the different well-being dimensions. At 61% in 2016, Mexico s employment rate was below the OECD
Design and Construction of the Asian Urban-Wellbeing Indicators Survey HKU-USC-IPPA Conference on Public Policy
 Design and Construction of the Asian Urban-Wellbeing Indicators Survey HKU-USC-IPPA Conference on Public Policy 9-10 June 2016 Civic Exchange Since 2000 An independent Hong Kong-based public policy think
Immigration and Multiculturalism
 A New Progressive Agenda Jean Chrétien Immigration and Multiculturalism Jean Chrétien Lessons from Canada vol 2.2 progressive politics 23 A New Progressive Agenda Jean Chrétien Canada s cultural, ethnic
Speech by President Barroso: "A new era of good feelings"
 EUROPEAN COMMISSION José Manuel Durão Barroso President of the European Commission Speech by President Barroso: "A new era of good feelings" Bloomberg & European American Chamber of Commerce Conversation
As Prepared for Delivery. Partners in Progress: Expanding Economic Opportunity Across the Americas. AmCham Panama
 As Prepared for Delivery Partners in Progress: Expanding Economic Opportunity Across the Americas AmCham Panama Address by THOMAS J. DONOHUE President and CEO, U.S. Chamber of Commerce April 8, 2015 Panama
Land Use, Job Accessibility and Commuting Efficiency under the Hukou System in Urban China: A Case Study in Guangzhou
 Land Use, Job Accessibility and Commuting Efficiency under the Hukou System in Urban China: A Case Study in Guangzhou ( 论文概要 ) LIU Yi Hong Kong Baptist University I Introduction To investigate the job-housing
How s Life in the Netherlands?
 How s Life in the Netherlands? November 2017 In general, the Netherlands performs well across the OECD s headline well-being indicators relative to the other OECD countries. Household net wealth was about
City Crime Rankings
 City Crime Rankings 2008-2009 Methodology The crimes tracked by the UCR Program include violent crimes of murder, rape, robbery, and aggravated assault and property crimes of burglary, larceny-theft, and
APEC ECONOMIC LEADERS' DECLARATION: MEETING NEW CHALLENGES IN THE NEW CENTURY. Shanghai, China 21 October 2001
 APEC ECONOMIC LEADERS' DECLARATION: MEETING NEW CHALLENGES IN THE NEW CENTURY Shanghai, China 21 October 2001 1. We, the Economic Leaders of APEC, gathered today in Shanghai for the first time in the twentyfirst
darwininnovationhub.com.au
 Creating pathways to the future MIGRANT INNOVATION NORTHERN TERRITORY PROGRAM A unique opportunity for you to migrate to Darwin, Northern Territory Australia darwininnovationhub.com.au New Delhi Rizhao,
staying Put for Work
 Chinese Residents are staying Put for Work By Rainer Strack, Mike Booker, Orsolya Kovacs-Ondrejkovic, Pierre Antebi, and Fang Ruan This article is part of the series Decoding Global Talent 2018. The series
strategic asia asia s rising power Ashley J. Tellis, Andrew Marble, and Travis Tanner Economic Performance
 strategic asia 2010 11 asia s rising power and America s Continued Purpose Edited by Ashley J. Tellis, Andrew Marble, and Travis Tanner Economic Performance Asia and the World Economy in 2030: Growth,
Achim Steiner, UNDP Administrator and Chair UN Development Group, remarks on The Sustainable Development Goals: Building a better future in Myanmar
 Achim Steiner, UNDP Administrator and Chair UN Development Group, remarks on The Sustainable Development Goals: Building a better future in Myanmar Yangon University, Myanmar 2:00pm, August 7, 2017 [Suggested
COMMUNICATION FROM THE COMMISSION TO THE EUROPEAN PARLIAMENT, THE COUNCIL, THE EUROPEAN ECONOMIC AND SOCIAL COMMITTEE AND THE COMMITTEE OF THE REGIONS
 EUROPEAN COMMISSION Brussels, 13.9.2017 COM(2017) 492 final COMMUNICATION FROM THE COMMISSION TO THE EUROPEAN PARLIAMENT, THE COUNCIL, THE EUROPEAN ECONOMIC AND SOCIAL COMMITTEE AND THE COMMITTEE OF THE
September 23-25, 1997
 BOARDS OF GOVERNORS 1997 ANNUAL MEETINGS HONG KONG, CHINA WORLD BANK GROUP INTERNATIONAL BANK FOR RECONSTRUCTION AND DEVELOPMENT INTERNATIONAL FINANCE CORPORATION INTERNATIONAL DEVELOPMENT ASSOCIATION
How s Life in France?
 How s Life in France? November 2017 Relative to other OECD countries, France s average performance across the different well-being dimensions is mixed. While household net adjusted disposable income stands
How s Life in Switzerland?
 How s Life in Switzerland? November 2017 On average, Switzerland performs well across the OECD s headline well-being indicators relative to other OECD countries. Average household net adjusted disposable
Opening remarks. Dr Victor K. Fung. Chairman of International Chamber of Commerce. ICC World Business Summit In Hong Kong
 Opening remarks by Dr Victor K. Fung as Chairman of International Chamber of Commerce at ICC World Business Summit 2010 In Hong Kong Distinguished guests, it gives me great pleasure to welcome you to the
โอกาสและความท าทายของประเทศไทยในอนาคต
 โอกาสและความท าทายของประเทศไทยในอนาคต Thailand 22 Apirak Kosayodhin Apirak Kosayodhin Advisor to Prime Minister of Thailand Thailand has significantly changed in the past 2 years Improved quality of life
How s Life in Australia?
 How s Life in Australia? November 2017 In general, Australia performs well across the different well-being dimensions relative to other OECD countries. Air quality is among the best in the OECD, and average
Korea s average level of current well-being: Comparative strengths and weaknesses
 How s Life in Korea? November 2017 Relative to other OECD countries, Korea s average performance across the different well-being dimensions is mixed. Although income and wealth stand below the OECD average,
The Director of Economic Development in consultation with the City Manager, recommends that:
 COMMITTEE OF THE WHOLE MAY 15, 2012 INTERNATIONAL BUSINESS DEVELOPMENT CHINA CITY-TO-CITY BUSINESS AGREEMENT WITH YIWU, CHINA AND INTERNATIONAL BUSINESS TRAVEL TO TAIPEI, TAIWAN TO COINCIDE WITH THE 2012
Brand South Africa Research Report
 South Africa In(c) Series Brand South Africa Research Report African market entry strategy Can the Nation Brand bridge the familiarity gap in Asia? learning to listen and listening to learn By: Dr. Petrus
How s Life in Finland?
 How s Life in Finland? November 2017 In general, Finland performs well across the different well-being dimensions relative to other OECD countries. Despite levels of household net adjusted disposable income
VIETNAM FOCUS. The Next Growth Story In Asia?
 The Next Growth Story In Asia? Vietnam s economic policy has dramatically transformed the nation since 9, spurring fast economic and social development. Consequently, Vietnam s economy took off booming
Survey on International Operations of Japanese Firms (FY2007)
") on International Operations of Japanese Firms () March 26 (JETRO) Contents I. outline; profile of respondent firms 3 China now the top site for overseas R&D bases 4 5 (1) More plan overseas than domestic
on International Operations of Japanese Firms () March 26 (JETRO) Contents I. outline; profile of respondent firms 3 China now the top site for overseas R&D bases 4 5 (1) More plan overseas than domestic
The Emerging Powerhouse: Opportunities, Trends & Risks of the African Economic Climate
 The Emerging Powerhouse: Opportunities, Trends & Risks of the African Economic Climate Written by (Based on EY s Africa Attractiveness Reports) 1 EXECUTIVE SUMMARY There has been impressive and sustained
Rewriting the Rules of the Market Economy to Achieve Shared Prosperity. Joseph E. Stiglitz New York June 2016
 Rewriting the Rules of the Market Economy to Achieve Shared Prosperity Joseph E. Stiglitz New York June 2016 Enormous growth in inequality Especially in US, and countries that have followed US model Multiple
NOVEMBER visioning survey results
 NOVEMBER 2016 visioning survey results 2 Denveright SECTION 1 SURVEY INTRODUCTION OVERVIEW Our community is undertaking an effort that builds upon our successes and proud traditions to design the future
Annual Report Fiscal Year 2016 TRANSFORM ENGAGE INNOVATE
 Annual Report Fiscal Year 2016 TRANSFORM ENGAGE INNOVATE Our Impact 25 PROGRAMS SERVED ANGELENOS THIS YEAR $12 MILLION RAISED IN 2016 1 A Note from Our President and Chairman Dear Angelenos, Partners,
Chile s average level of current well-being: Comparative strengths and weaknesses
 How s Life in Chile? November 2017 Relative to other OECD countries, Chile has a mixed performance across the different well-being dimensions. Although performing well in terms of housing affordability
o n e c i t y d i v e r s e p l a c e s
 City of Swan our Swan 2030 discussion paper our vibrant economy o n e c i t y d i v e r s e p l a c e s 2 our Swan 2030 our vibrant economy Contents 1. Background 4 2. Trends 5 3. Key Considerations 6
HSBC Bank International
 HSBC Bank International The Expat Explorer Survey 2010 Report one: Expat Economics PAGE 2 I EXPAT EXPLORER SURVEY 2010 The Expat Explorer Survey Expat Economics Commissioned by HSBC Bank International,
News Release Issued: Thursday 27 July, 2017
 News Release Issued: Thursday 7 July, 07 US Cities, Metro and Counties Outlook 07 0 America s burbs boosted as millennials take flight from high-cost coastal cities and retirees head for exurbs and rural
State of the World by United Nations Indicators. Audrey Matthews, Elizabeth Curtis, Wes Biddle, Valery Bonar
 State of the World by United Nations Indicators Audrey Matthews, Elizabeth Curtis, Wes Biddle, Valery Bonar Background The main objective of this project was to develop a system to determine the status
TRENDS IN GLOBAL RELOCATION BIGGEST CHALLENGES
 TRENDS IN GLOBAL RELOCATION BIGGEST CHALLENGES 2014 Survey EXECUTIVE SUMMARY SM For a full copy of the Trends in Global Relocation: 2014 Biggest Challenges survey report, please contact your Cartus representative
How s Life in Slovenia?
 How s Life in Slovenia? November 2017 Slovenia s average performance across the different well-being dimensions is mixed when assessed relative to other OECD countries. The average household net adjusted
Britain, the EU & Tourism
 Written evidence submitted by VisitBritain (IOB0027) Britain, the EU & Tourism About VisitBritain and VisitEngland Tourism is currently worth 126.9 billion to Britain s economy. It is Britain s third largest
The Human Dimension of Globalizing Mid-Caps - as Seen by their Leaders. Welcome to the Flight Deck»
 Welcome to the Flight Deck A Global C-Suite Study The Human Dimension of Globalizing Mid-Caps - as Seen by their Leaders Chapter 6 Becoming the Carrier of Choice A Culture of Innovation Introduction This
How s Life in Poland?
 How s Life in Poland? November 2017 Relative to other OECD countries, Poland s average performance across the different well-being dimensions is mixed. Material conditions are an area of comparative weakness:
WEF GLOBAL COMPETITIVENESS REPORT: GEORGIA
 2011-2012 WEF GLOBAL COMPETITIVENESS REPORT: GEORGIA FINAL Tuesday, July 03, 2012 This publication was produced for review by the United States Agency for International Development. It was prepared by
Building a Fast and Flexible Immigration System. Canada-China Human Capital Dialogue November 28, 2012
 Building a Fast and Flexible Immigration System Canada-China Human Capital Dialogue November 28, 2012 Overview of the Presentation 1. Immigration, the Government s agenda and Canada s future 2. An overview
How s Life in New Zealand?
 How s Life in New Zealand? November 2017 On average, New Zealand performs well across the different well-being indicators and dimensions relative to other OECD countries. It has higher employment and lower
Moving Goods Faster and Better
 Moving Goods Faster and Better Central Asia Regional Economic Cooperation Program s Transport and Trade Facilitation in Tajikistan Foreword We are delighted to celebrate the 10th anniversary of the Central
Ladies and gentlemen, thank you for inviting me to speak today and to chair this panel discussion.
 Ladies and gentlemen, thank you for inviting me to speak today and to chair this panel discussion. As you have just heard my name is Anthony Harbinson and my career has seen me working in the public sector
Table of Contents. List of Figures 2. Executive Summary 3. 1 Introduction 4
 Table of Contents List of Figures 2 Executive Summary 3 1 Introduction 4 2 Innovating Contributions 5 2.1 Americans 5 2.2 Australia, New Zealand and Pacific 6 2.3 Europe, Africa and Middle East 7 2.4 Japan