BUILD A BETTER SOUTH CONSTRUCTION WORKING CONDITIONS IN THE SOUTHERN U.S. DR. NIK THEODORE BETHANY BOGGESS JACKIE CORNEJO EMILY TIMM
|
|
|
- Elwin Little
- 5 years ago
- Views:
Transcription


1 BUILD A BETTER SOUTH CONSTRUCTION WORKING CONDITIONS IN THE SOUTHERN U.S. DR. NIK THEODORE BETHANY BOGGESS JACKIE CORNEJO EMILY TIMM
2 This work is licensed under the Creative Commons Attribution 4.0 International License. To view a copy of this license, visit or send a letter to Creative Commons, PO Box 1866, Mountain View, CA 94042, USA Copyright Workers Defense Project, Partnership for Working Families, Dr. Nik Theodore
3 CONTENTS FOREWORD... i ACKNOWLEDGEMENTS... vii EXECUTIVE SUMMARY... ix INTRODUCTION... 1 Construction in the South... 1 Socioeconomic Conditions in the South... 2 Working Conditions for Construction Workers... 2 About the Study... 5 METHODOLOGY... 7 Survey Methods... 7 Interview Methods... 9 RESEARCH FINDINGS: UNSTABLE WORK Employment and Wages Living Wages Wage Theft Financial Hardships Payroll Fraud Employment Benefits Job Training and Career Advancement RESEARCH FINDINGS: DANGEROUS WORK Injuries on Construction Sites The Social Costs of Workplace Injuries...20 Health and Safety Training Heat Stress and Access to Water in the Workplace...22 WORKING CONDITIONS IN MAJOR SOUTHERN CONSTRUCTION MARKETS Atlanta, Georgia Charlotte, North Carolina...27 Dallas, Texas...30 Houston, Texas Miami, Florida...35 Nashville, Tennessee RECOMMENDATIONS REFERENCES...43 GLOSSARY...49 DEMOGRAPHICS TABLE...5
4
5 F O R E W O R D Our cities, in the South and Southwest, and across the country, are thriving. Young people are flocking to live in revitalized urban areas, and our cities are the motor powering the creation of so many of the nation s new jobs. However, when you visit a corporate headquarters in Houston, a town house development in Nashville, or a condominium in Miami, it is easy to forget that it was construction workers who built these buildings with their hands, their sweat, and their blood. Working or living in these new buildings, or gazing at their beautiful facades, you can no longer sense the presence of those construction workers and the challenges they faced, toiling long, hard hours to support their families. The evidence of pervasive wage theft, and of widespread employment misclassification, disappears once the buildings are finished and the crews go home. There is no more blood on the rebar where workers fell, and no signs of the back injuries that came from lifting too heavy loads or the gasping for air that comes from breathing silica dust day after day. Build a Better South reminds us that far too often construction workers across the South face working conditions that should not exist in the twentyfirst century in the richest country in the world. This important report documents the alarming prevalence of jobs with wages too low to feed a family. It captures the impact of disabling work injuries on workers and their families that are made even more devastating when the employer does not carry workers compensation insurance, or misclassifies a wage worker as an independent contractor ineligible for compensation payments. Build a Better South tells the powerful stories of thousands of men and women building a region. Readers of this report will be justifiably angry. The outrage of this report is not only that our construction workers are treated so poorly, that they receive too little pay and too many injuries. The outrage is that dangerous, unjust employment occurs in plain sight, in our downtowns and suburban malls and office parks, abetted by owners and builders who participate in this system without complaint. There is no excuse for acquiescence: the construction jobs in Dallas or Atlanta or Charlotte will not move to China or Vietnam like the textile and garment factories that left the South over the last decades. This report is a call to action. We can no longer be silent knowing that our homes and commercial centers, our universities and hospitals, are built by men and women who work long hours but who can barely feed their families, who face dangerous working conditions daily with no recourse or compensation if they are injured, and whose labor rights are too often violated. With Build a Better South, Workers Defense Project, Partnership for Working Families, and the University of Illinois define a challenge facing our country: how can we ensure that the workers who build our vibrant cities earn living wages and without sacrificing their health? This report is an important step in starting to meet that challenge. David Michaels, PHD, MPH Professor, Department of Environmental and Occupational Health Milken Institute School of Public Health The George Washington University Assistant Secretary of Labor for the Occupational Safety and Health Administration ( ) BUILD A BETTER SOUTH i
6


7 BUILD A BETTER SOUTH CONSTRUCTION WORKING CONDITIONS IN THE SOUTHERN U.S. A COLLABORATION BY THE WORKERS DEFENSE PROJECT, PARTNERSHIP FOR WORKING FAMILIES, & THE UNIVERSITY OF ILLINOIS AT CHICAGO DR. NIK THEODORE BETHANY BOGGESS JACKIE CORNEJO EMILY TIMM BUILD A BETTER SOUTH iii
8
9 O R G A N I Z AT I O N A L B I O G R A P H I E S WORKERS DEFENSE PROJECT (WDP) is a leader in the movement for good, safe jobs in Texas. WDP is a worker center, and a source of hope for thousands of lowwage workers across Texas. With offices in Austin, Dallas, and Houston, WDP organizes construction workers and fights for safe and dignified working conditions that allow working families in Texas to escape the cycle of dangerous and dead-end jobs. Workers Defense has won policies to create hundreds of thousands of good jobs in Texas, and has authored two previous studies detailing working conditions in the construction industry in Texas. WDP has received national acclaim from media outlets like The New York Times, which in 2013 named it one of the most creative organizations for immigrants in the United States. PARTNERSHIP FOR WORKING FAMILIES is a national network of 17 powerful city and regional affiliate groups based in major urban areas across the country. We advocate for and support policies and movements that help build more just and sustainable communities where we live and work. We strive to take lessons learned at the local level and apply them to the national conversation to build a framework for addressing climate change, inequality, racial and social injustice. NIK THEODORE is Professor of Urban Planning and Policy at the University of Illinois at Chicago, and Associate Dean for Faculty Affairs and Research in the College of Urban Planning and Public Affairs. His current research focuses on economic restructuring and labor standards, and he has been a lead researcher on large-scale projects examining conditions in low-wage labor markets, including day labor, domestic work, temporary staffing, and the state of workplace protections in in low-wage industries. BUILD A BETTER SOUTH v
10
11 A C K N O W L E D G E M E N T S We owe a tremendous amount of gratitude to many people who helped form, implement, and guide this study. First and foremost, we would like to acknowledge the hundreds of men and women who participated in Build a Better South. Thank you for sharing your time, your experiences, and your expertise with us. We would also like to thank the Comité de Trabajadores en Acción of the Workers Defense Project, which provided invaluable advice and feedback during the design of the survey instrument and in discussions about participant recruitment. Our local research partners were invaluable to the success of this project. Their knowledge of the construction industry and the local environment was absolutely critical to the implementation of this research, and they worked many hours to ensure its success. We are very grateful for the work of Jessica Jarrett of Georgia Stand Up, Jeanette Smith of Southwest Florida Interfaith Worker Justice, Pat McCoy of Action NC, and Jack Willey of Workers Dignity. Julio Fernandez, Will Cardenas, and Juan Wences also provided incredibly valuable local advice and assisted our researchers greatly with their knowledge of the local construction industry. Additionally, the National Building Trades Unions Organizing Committee and local Building Trades councils in the survey cities provided valuable insight in the project. An incredible team of researchers provided us with assistance in survey design and analysis and in reviewing drafts of this report. Dr. Hester Lipscomb and Dr. George Delclos provided us with their survey instruments regarding worksite safety climate and workplace heat stress during the pilot phase of our study. Dr. Annette Bernhardt volunteered hours of her time and her statistical expertise to guide us in developing the survey response weighting methodology. Dr. Hester Lipscomb, Dr. Cora Roelofs, Kevin Reilly, Ed Navarro, and Dr. Jennifer Scott shared their expertise and provided invaluable feedback on earlier versions of this report. Lastly, we would like to thank our funders. This project was made possible with generous funding from the Kellogg Foundation, the Ford Foundation, the Sociological Initiatives Foundation, the General Service Foundation, the Laborers International Union of North America, the International Brotherhood of Electrical Workers, International Union of Painters and Allied Trades, and the International Association of Bridge, Structural, Ornamental, Reinforcing Ironworkers, Public Welfare Foundation and Union Labor Life Insurance Company. BUILD A BETTER SOUTH vii
12
13 E X E C U T I V E S U M M A R Y Build a Better South examines the working conditions of 1,435 construction workers in six major cities in the southern U.S.: Atlanta, Georgia Charlotte, North Carolina Dallas, Texas Houston, Texas Miami, Florida Nashville, Tennessee These cities are the engines of growth in the South and are home to some of the largest and most important construction markets in the U.S. Nearly 1 million construction workers were employed in these six cities in 2013, accounting for 43% of all construction workers employed in the five states. 1 Furthermore, more than one in four construction workers who are employed in the South are located in one of these six cities, and nationally one in ten workers labor these six southern cities. a This research provides information about the employment experiences of the people most imperative to the industry s success: the men and women who work on construction sites each day. Construction activity in the southern United States is booming. In Texas and Tennessee, construction now generates more dollars annually than it did before the Great Recession, and in Florida, Georgia, and North Carolina construction spending is rapidly approaching pre-recession levels. 2 In these five states alone, construction spending topped $175 billion in 2015, accounting for about one in four dollars generated by the industry nationally. 2 The increased demand for construction has led to higher sales volumes for all construction sectors, and higher profit margins for the residential building sector of the industry. 3 a The South is defined according the U.S. Census Bureau, which is a region comprised of 17 states: Alabama, Arkansas, Delaware, the District of Columbia, Florida, Georgia, Louisiana, Kentucky, Maryland, Mississippi, Oklahoma, North Carolina, South Carolina, Tennessee, Texas, Virginia, and West Virginia. Calculations based on 2013 Bureau of Economic Analysis data on full-time and parttime employment in construction (NAICS code 23). Unfortunately economic hardships, few or no opportunities for career advancement, unstable work, injuries and even death on the job are commonplace for construction workers in the South. Health and safety on the job is of particular concern, as the industry has seen the number of injuries and deaths rise with industry growth. According to the Bureau of Labor Statistics, the number of fatalities in the construction industry in 2015 was the highest since More than 900 construction workers were killed on the job in the U.S. in 2015, equating to the death of a construction worker every nine hours. 4 As the construction industry continues to grow in the South, now is the time for policymakers few construction workers earn wages high enough to live in the homes and apartments they build. and industry leaders to ensure that all construction jobs offer family-supporting wages, benefits, and safe working conditions to the essential labor the industry receives. Build a Better South seeks to document the most critical issues facing construction workers in major construction markets and provide information to guide possible solutions. METHODOLOGY Build a Better South researchers surveyed 1,435 construction workers in the six cities, with workers surveyed in each city. Participants were recruited on randomly selected commercial building, residential building, and heavy construction sites. We also conducted in-depth interviews with construction workers and employers to further understand the challenges and opportunities in the southern construction market. Our research findings are presented in the following sections to describe southern construction workers working conditions: their wages, hours, and benefits; employment rights violations such as wage theft and employee misclassification; and health and safety issues, including workplace injuries and heat stress. After regional findings are presented, research findings for each city are presented in greater detail, focusing on topics that emerged as key issues for BUILD A BETTER SOUTH ix
14 each city. The last section offers recommendations for creating good construction jobs for the southern region. SUMMARY OF FINDINGS Workplace injuries are common, and are an economic burden to workers and their communities. One in seven workers have been injured during their construction career, and more than one in three of these workers has suffered an injury in the past 12 months. Just 5% of workers who were injured in the past 12 months had workers compensation insurance to cover their medical expenses. Non-fatal injuries among construction workers in the six cities cost an estimated $1.47 billion annually in medical expenses, lost wages, lost productivity, lawsuits, and the cost of caring for injured workers while they recover. Workers may not even receive the most basic safety protections like rest breaks or access to drinking water. One-third of workers do not have drinking water provided on their worksite, a basic necessity that employers are required to provide under federal law. Few construction workers have access to basic employment benefits. Less than half (43%) of construction workers are offered medical insurance by their employer. The problem of access to medical insurance is exacerbated by the fact that only 45% have an employer that has workers compensation insurance. Approximately three out of four workers lack paid personal time (73%) or paid sick time (78%), which means that workers lose wages if they become ill or have to take time off work to deal with family needs. Eight out of ten workers lack a retirement or pension plan. Economic hardships are experienced by many construction workers despite working long hours. More than half (57%) of workers surveyed earn less than $15 per hour despite high average levels of experience in the industry. Thirty-six percent of workers struggle to pay for basic necessities such as rent or food even though 82% of workers reported working overtime with their current employer. Violations of basic labor rights are widespread in the South. More than one in ten (11%) workers have experienced wage theft at some point in their construction career. Among workers who have not been paid for their labor in the past year, the median amount of wages stolen was $800 (57 hours of labor for the average construction worker). Only 23% of workers have managed to recover their lost wages. The estimated amount of money lost to wage theft in the six cities is $29.8 million annually. One in three (32%) workers is misclassified as an independent contractor, denying their rights to minimum wage and overtime payments and burdening working families with the employer s share of payroll taxes. SUMMARY OF RECOMMENDATIONS Based on the findings from Build a Better South, few construction workers have a good job in the industry. A good construction job should ensure that workers (1) are paid at least $15 per hour, (2) receive at least 10 hours of OSHA safety training, and (3) are covered by either medical insurance or workers compensation insurance policies. Yet, even by these minimal standards, four out of five construction workers in the South do not have a good job. Policymakers and employers can do more to ensure that the men and women who build our cities can support their families and come home safely at the end of each workday. Policymakers should focus on the following areas to ensure good job creation: Guarantee safe working conditions Employers and policymakers must do more to address the disproportionately high fatality and injury rates in the construction industry..policymakers should enact legislation guaranteeing rest breaks, workers compensation, safety training, and medical care for construction workers. Ensure honest pay for honest work Wage theft, payroll tax fraud, and low wages threaten the construction industry by hurting The estimated amount of money lost to wage theft in the six cities is $29.8 MILLION annually. x BUILD A BETTER SOUTH

15 working families and undercutting construction businesses that play by the rules. In addition to strong enforcement of existing wage and hour laws, policymakers can take important steps to reward good business practices. Investigative agencies should enforce employment laws governing wages and the payment of payroll taxes, as well as provide protection from retaliation for workers who report violations. Create good jobs with a career pathway Most construction jobs lack employment benefits or opportunities for advancement, and today, few young people see the industry as desirable place to seek employment. A basic benefits package should be offered to the vast majority of construction workers rather than to a small minority. Improve enforcement of existing policies Most of the employment rights issues, as well as the health and safety issues faced by construction workers are already addressed by existing laws, but enforcement is often weak or non-existent. State and federal policymakers should increase funding and improve the efficiency of local agencies to enforce laws that protect workers from wage theft, employee misclassification, hazardous conditions, and retaliation for raising concerns about workplace issues. Local municipalities should have the ability to raise standards above federal or state requirements to improve the lives of residents and to respond to regional needs. Policymakers should also partner with community organizations to improve the efficiency and effectiveness of existing enforcement efforts. Business leaders in the construction industry have the opportunity to create good construction jobs by ensuring safe and fair working conditions for the workforce, often in partnership with public entities: Prioritize safety Employers should provide at least OSHA 10-hour safety training for all employees and provide ongoing health and safety training throughout the year. Contractors must also ensure that all workers receive proper safety equipment, rest breaks, and workers compensation. Workers should also have anonymous system to address safety concerns with their direct employer, or with the general contractor and developer, without fear of retaliation. Invest in training Employers must see training as a necessary investment that helps ensure workers are able to produce a quality finished product, prevent accidents, and provide opportunities to advance in the industry. Collaborations and partnerships among construction employers and associations, education providers, and local governments can help create training pipelines where jobseekers learn the skills they need to fill labor shortages in the industry. Formal training can play a key role in improving the quality of construction jobs, and help offset the severe construction labor shortages experienced by construction employers throughout the South. Subcontract for quality Developers and general contractors should take into account working conditions, including worksite safety, rest breaks, wages, training, and benefits when hiring subcontractors. Rather than simply considering price, developers should give preferential status to bidders that demonstrate a track record in providing fair pay and benefits along with a strong safety program. BUILD A BETTER SOUTH xi

16
17 I N T R O D U C T I O N CONSTRUCTION IN THE SOUTH Construction activity in the southern United States is booming. In Texas and Tennessee, construction now generates more dollars annually than it did before the recession, and in Florida, Georgia, and North Carolina construction spending is rapidly approaching pre-recession levels. 2 In these five states, construction spending topped $175 billion in 2015, accounting for about one in four dollars generated by the industry nationally. 2 The increased demand for construction has led to higher sales volumes for all construction sectors, and higher profit margins for the residential building sector of the industry. 3 In a 2016 study, the National Association of Home Builders found that homebuilders had an average profit margin of 18.9% after accounting for land and building costs. 5 Clearly, this is a time of economic growth for many construction companies in the South. However, Build a Better South data reveal that for the majority of workers in the industry, wages are low, employment benefits are not provided, and health and safety risks on the job are common. Build a Better South examines the working conditions of 1,435 construction workers in six major southern cities: Atlanta, Georgia Charlotte, North Carolina Dallas, Texas Houston, Texas Miami, Florida Nashville, Tennessee These cities are the engines of growth in the South and are home to some of the largest and most important construction markets in the U.S. Nearly 1 million construction workers were employed in these six cities in 2013, accounting for 43% of all construction workers employed in the five states. 6 Furthermore, more than one in four construction workers who are employed in the South b are located in one of these six cities, and one in ten workers nationally labor in these six southern cities. 6 This study provides information about the employment experiences of the people most imperative to the industry s success: the men and women who work on construction sites each day. The construction industry is an important source of income for many workers, but good jobs in the industry are rare. This study defines a good job as one that meets the following basic criteria: Workers earn at least $15 per hour Workers receive safety training, including participating in at least ten hours of OSHA safety training Workers are offered medical insurance or are covered by workers compensation insurance These are considered to be essential components of a good job, but a high-quality construction job would also include a retirement plan and career pathways with formal training opportunities, and ensure that workers voices are heard and that their rights are respected. However, this study finds that four out of five workers have construction jobs that are substandard, lacking at least one of the three most basic provisions. The implications for workers are significant they face economic hardships, have few if any opportunities for career advancement, and must cope with unstable work and heightened risks of injury on the job. Health and safety on the job is of particular concern for construction workers, as the industry has seen the numbers of injuries and deaths rise with industry growth. According to the Bureau of Labor Statistics, the number of fatalities in the construction industry during 2015 has been the highest since More than 900 construction workers were b The South is defined according the U.S. Census Bureau, which is a region comprised of 17 states: Alabama, Arkansas, Delaware, the District of Columbia, Florida, Georgia, Louisiana, Kentucky, Maryland, Mississippi, Oklahoma, North Carolina, South Carolina, Tennessee, Texas, Virginia, and West Virginia. Calculations based on 2013 Bureau of Economic Analysis data on full-time and parttime employment in construction (NAICS code 23). BUILD A BETTER SOUTH 1
18 killed on the job during 2015, equating to the death of a construction worker every nine hours. 7 As the construction industry continues to grow in the South and labor shortages become increasingly pressing, now is the time for policymakers and industry leaders to ensure that all construction jobs offer family-supporting wages, benefits, and safe workplaces to the essential workers employed in the industry. SOCIOECONOMIC CONDITIONS IN THE SOUTH THE WIDENING INCOME GAP Economic inequality is on the rise across the South. 8,9 The percentage of households with incomes below the poverty line is above the national average in all six of the cities included in this study. 10 Nearly one in three Miami residents is impoverished, one in four is impoverished in Atlanta, and approximately one in five residents in Charlotte, Dallas, Houston, and Nashville earns an income that falls below the poverty line. 8 Recently Atlanta was deemed the most economically unequal city in the U.S. due to its large and widening income gap between the wealthiest 5% of residents and the poorest 20% of residents. 9 This trend has largely been driven by a decline in middleclass employment opportunities. Over the past 30 years, the number of middle-income jobs has decreased, while the number of high-skill, high-wage jobs and low-skill, low-wage jobs has increased. 11,12 The result is a polarized economy in which a few benefit greatly while others struggle to meet their basic needs. Many workers in the U.S. experience constantly fluctuating work schedules, and increasing numbers work multiple jobs in different industries due to the seasonality and instability of many low-wage positions Construction workers in the South are no stranger to such instability. All outdoor workers are subject to lost wages when rain or other weather events stop work, but construction workers must also deal with work stoppages due to construction permitting, financing issues, or poor management, as well as delays caused by other contractors when work is not completed on schedule. 16 Construction workers, especially those employed by small companies with fewer contracts, may frequently experience layoffs when work is slow. The irregular nature of many construction jobs most deeply impacts the lowest-paid workers in the industry, who may have to go days or weeks without work. DEVELOPMENT AND RISING HOUSING COSTS The development of luxury housing and the process of gentrification, which is the conversion of lowincome urban neighborhoods into middle- and highincome neighborhoods, are also deeply affecting many urban communities in the South. 17,18 Development and the resulting construction work enable these processes to occur, and construction workers themselves are impacted by the rising housing costs often accompanied by such development. Atlanta, Miami, Houston, and Nashville are some of the fastest-gentrifying cities in the U.S., and low-income communities of color are being displaced at an extremely rapid rate due to higher housing costs. 19,20 Exponential increases in rent and other housing costs result in soaring rent burdens for low- and moderateincome households. 21 Construction workers residing in Miami, for example, face a median rents of $1,900 a month for a one bedroom apartment, even though the median annual salary for a construction worker is just $34,000, or approximately $2,800 a month before taxes are deducted. 22,23 Responses to the Build a Better South survey demonstrate that few construction workers earn wages high enough to live in the homes and apartments they build. Few construction workers earn wages high enough to live in the homes and apartments they build. WORKING CONDITIONS FOR CONSTRUCTION WORKERS IN THE SOUTH WAGES, BENEFITS, AND EMPLOYMENT RIGHTS ISSUES Relatively little research about working conditions in construction has focused on workers employed in the southern U.S. Research has tended to focus on workers in the northeastern and western United States, where construction trade unions have facilitated researcher access to the workforce. Other research examines the workforce on a national level and does not make regional distinctions. However, some data exist about construction workers in the South. A brief review 2 BUILD A BETTER SOUTH

19 of available government data and existing research about workers in the South is provided below. Average wages for construction workers vary greatly based on occupation and location. According to the Bureau of Labor Statistics, a general laborer in New York City averages nearly $51,000 annually, while in Chicago this worker earns nearly $59,000 annually. 24 General laborers in the South earn significantly less. In Dallas and Miami, for example, the average annual salary for a general laborer is approximately $28,000, less than half of what Chicago laborers earn. 24,25 The disparity persists for workers in trades that require higher levels of skills, such as carpentry. Carpenters in New York City and Chicago earn, on average, approximately $68,000 per year; on the other hand, in Houston carpenters earn an average of $40,000 annually and Miami carpenters earn just $35,000, even though all four of these cities are ranked as some of most expensive cities in the U.S Access to employment benefits is limited for the majority of construction workers nationally. Research by the Center for Construction Research and Training found that fewer than four in 10 (38%) construction workers nationally were offered a retirement plan. 28 Older workers aged 50 and over were more likely to have a retirement plan compared to younger workers (47% versus 24%, respectively). Workers in construction trade unions were far more likely to have access to Carpenters in New York City and Chicago earn an average salary of $68,000 per year, while Miami carpenters average just $35,000 per year. a retirement plan compared to non-union workers (78% versus 28%, respectively). 28 Prior to the passage of the Affordable Care Act, construction workers nationally had some of the lowest insurance participation rates compared to other industries, and just 47% of construction workers in the U.S. had access to health insurance coverage through their employer or union. 29 Only 22% of Latino construction workers were offered health insurance coverage through their employer or union. Data specific to construction workers in the South are not available. Research about employment rights violations in the construction workforce in the southern U.S. is also limited, although there has been research published about employee misclassification, wage theft, and health and safety issues. Research conducted among day laborers in New Orleans, Louisiana found that 78% of the 304 day laborers interviewed had not been paid for work done within the past year. 30 In Texas, research with 1,192 construction workers found that 20% had experienced stolen wages at some point in their construction career. 31 Researchers in Tennessee found that the practice of misclassifying employees as independent contractors was common in the state, and estimated that there were between 21,900 and 38,680 misclassified construction workers in 2006, or 10-18% of the construction workforce. 32 A year-long investigation into construction companies that had received 2009 stimulus funding found that 38% of Texas construction BUILD A BETTER SOUTH 3
20 FIGURE 1. Construction Fatality Rate, TN NC TX GA 10.4 U.S. TOTAL FL Source: Bureau of Labor Statistics, Census of Fatal Occupational Injuries workers, 35% of North Carolina construction workers, and 15% of Florida construction workers had been misclassified as independent contractors. 33 HEALTH AND SAFETY Construction workers face some of the most dangerous working conditions in the U.S. 34 Along with workers in agriculture, fishing, forestry, and transportation, construction workers have a much higher risk or being injured or killed on the job than workers in most other industries. 7 In 2015, the construction industry had the highest number of workers killed on the job (937), and after adjusting for the size of the workforce, the construction and extraction industries had the 3rd highest fatality rate 1 in 3 construction workers killed on the job in the U.S. were killed in five southern states of all industries. 7 Four of the five southern states included in this study had construction fatality rates above the national rate (see Figure 1). In the five southern states, 274 construction workers were killed on the job in 2015, which means that nearly one in three (29%) construction workers killed on the job in the U.S. was in one of these five states. The causes of high injury and fatality rates in construction are numerous. Construction workers face multiple hazards on the job, such as working at heights without fall protection, use of power tools, and exposure to intense outdoor heat. 35,36 Job sites frequently change, and workers must constantly adapt to different work environments and site hazards. 37 Pressure from employers to work quickly or for long hours may also contribute to construction injuries as workers become fatigued. Workers may not bring safety concerns to the attention of their supervisors out of fear of being fired or reported to immigration authorities. 38,39 A lack of safety or occupational training can prevent workers from avoiding worksite hazards, although trained workers are limited in their ability to prevent injuries by the practices of management and by their ability to report site safety hazards without fear of retaliation. 38,40 ABOUT THE STUDY Build a Better South documents working conditions in construction in the southern U.S., an industry where many workers lack benefits, stability, and even drinking water on their job sites. We 4 BUILD A BETTER SOUTH

21 examine issues such as irregular work, limited opportunities for formal training, workplace injuries, and economic hardship among construction workers in some of the South s largest cities. Build a Better South researchers surveyed 1,435 construction workers in the six cities, with workers surveyed in each city. We also conducted in-depth interviews with construction workers and employers to further understand the challenges and opportunities in the southern construction market. Findings from the interviews have been presented along with survey findings in the relevant sections. Our research findings are presented in the following sections to describe southern construction workers working conditions: wages, hours, and benefits; employment rights violations such as wage theft and employee misclassification; and health and safety issues, including workplace injuries and heat stress. Recommendations for creating good construction jobs are offered for the southern region, and the last section examines the research findings for each city in greater detail, focusing on topics that emerged as key issues for each city. BUILD A BETTER SOUTH 5


22
23 M E T H O D O L O G Y SURVEY METHODS SURVEY INSTRUMENT The quantitative data collected for this research was done with a cross-sectional survey, which was available in English and Spanish. The survey was largely based on previous surveys done by the Workers Defense Project. The research partners revised previous surveys, and included new questions, some of which were based on the Unregulated Work survey, the National Agricultural Workers Survey, and the Central American Survey of Working Conditions and Health Research partners piloted the survey with more than 40 English- and Spanish-speaking workers in the industry. The survey was revised and used in a focus group of construction workers who provided feedback both about question content and about Spanish translations. The survey was revised again, and was reviewed a final time by the research partners. The research was reviewed and approved by the University of Illinois at Chicago s Institutional Review Board # SAMPLING METHODS The construction industry is highly seasonal and its workforce is highly mobile, which makes workplace research in this industry particularly challenging. In order to conduct cross-sectional research with construction workers in the South, we opted to randomly select construction sites in some of the South s largest construction markets: Atlanta, Georgia; Charlotte, North Carolina; Dallas and Houston, Texas; Miami, Florida; and Nashville, Tennessee. We obtained a database of active construction projects, and limited our sampling universe to active new construction projects with a minimum value of $250,000. From this database, we selected a stratified random sample of commercial, residential, and heavy construction projects through the assignment of identification numbers to each site, and then using a random number table to randomly select sites within each sector stratum. We defined commercial construction projects as buildings for non-residential purposes or residential buildings with four stories or more; residential projects as dwellings with three or fewer stories; and heavy projects as roadways, bridges, sidewalks, ports, utility line installation, etc. We did not include industrial construction projects, such as the construction of oil rigs or power plants. Our goal was to include approximately 40% commercial construction workers, 40% residential construction workers, and 20% heavy construction workers in the dataset. Of the surveys we collected, 45% were from commercial workers, 40% were from residential workers, and 15% were from heavy construction workers. Field staff were provided with the addresses of selected sites each day, and visited these sites during normal lunch hours and at the end of the workday. In a few instances, field staff visited sites prior to the start of the workday. If listed sites were inactive, field staff could approach nearby worksites to invite workers to participate in the survey. Surveys were collected from a total of 632 different construction sites in the six cities. Field staff were instructed to collect surveys from between 1 and 10 workers per site, with more surveys being collected from larger construction sites. FIELD STAFF TRAINING More than 50 full-time and part-time staff participated in the collection of surveys. A research team lead who had experience in management, research, and working with diverse populations of workers was hired in each city. The research team leads underwent an intensive 40-hour training prior to survey implementation, and received training in industry characteristics, such as bidding processes, differences among subsectors, and occupational profiles. They also received training in human subjects protection, data quality assurance, and team management. Field interviewer teams were trained in their home city by the team leads and by the principal investigators. They received 24 hours of training, including time conducting practice surveys with construction workers (the results of which were not BUILD A BETTER SOUTH 7


24 included in our final dataset). The majority of field staff was bilingual in English and Spanish, and many had experience in the construction industry. SURVEY IMPLEMENTATION Workers were invited to participate in the survey during their lunch break or at the end of the workday, and those who participated were given a $10 gift card. Each worker who agreed to participate was first asked two screening questions: are you at least 18 years of age? and do you own your own construction company? If they were under 18 or if they owned their own construction company, they were not permitted to participate in the survey. If the worker satisfied the screening criteria, field staff reviewed a two-page consent form with the worker before proceeding with the survey. The survey took approximately minutes to complete. During July and August 2016, we surveyed a total of 1,435 construction workers in the six cities. Between 200 and 300 workers were surveyed in each city (200 in Charlotte, Dallas, and Nashville, 250 in Atlanta and Miami, and 300 in Houston). The response rate was not fully collected in all six cities, but among those that were collected, approximately 50% of workers who were invited to participate in the survey agreed to participate. Workers were from 27 countries, and spoke 16 languages in addition to English or Spanish. Field staff were encouraged to interview to workers from a variety of racial and ethnic backgrounds, as well as occupations and management levels. A diverse sample of the workforce was largely achieved, but we corrected for discrepancies by weighting survey responses based on race and occupation (see following section). SURVEY WEIGHTING In order to correct for over- or under-sampling of certain races or occupations, all survey responses have been weighted. We utilized a two-step weighting procedure. For the first weight, we calculated the percent of workers who were Black, Latino, or White in two occupational categories (general labor or skilled trade) based on data for each metropolitan area from the American Community Survey (ACS) public use data file (Weight 1). Workers of other races or multiple races were placed into one of the three existing categories based on how similar their responses were to (1) wages, (2) injury rates, and (3) employee misclassification. Each individual survey response received a weight based on these data. The second weight was based on the size of the construction labor force in each city, according to the ACS estimates (Weight 2). The percentages of workers in each city based on the ACS were compared to the percentages of workers in each city in our sample, and six different weights were calculated to correct for underand over-sampling of workers in each city. Lastly, the two weight variables were combined to create a composite variable (Weight 3). All 8 BUILD A BETTER SOUTH
. All city findings are reported using Weight 1 (adjusted for race and occupation).")
 or Weight 1 (city data) for the analysis. In the Dangerous Work section, some comparisons between sub-populations of workers were made.")

25 weights were cross-checked to make sure survey responses matched the ACS estimates for race and occupation, as well as labor force size. All regional findings are reported using Weight 3 (adjusted for race, occupation, and size of labor force). All city findings are reported using Weight 1 (adjusted for race and occupation). SURVEY ANALYSIS To describe the findings, descriptive statistics (percentages, medians, and means) were utilized. All data were weighted using Weight 3 (regional data) or Weight 1 (city data) for the analysis. In the Dangerous Work section, some comparisons between sub-populations of workers were made. In these instances, contingency tables using weighted count data were utilized to calculate relative risk ratios. The p value is reported with the relative risk ratios to determine statistical significance. The rate of injuries was calculated using the number of workers, rather than the number of full-time equivalents. The injury rate was calculated using a 12-month period of time. INTERVIEW METHODS Qualitative interviews were conducted with both construction workers and construction business owners. A semi-structured format was used in all interviews, and interviews were conducted in English or Spanish, according to the preference of the participant. Interviews generally lasted between 30 and 90 minutes, and were conducted in a location of the participant s choosing. Interviews were recorded and transcribed into either English or Spanish. Seventeen interviews were conducted with construction workers, and four were conducted with construction business owners. Construction employers included a range of company sizes, and included small subcontractors who employed a few employees to business owners who employed more than 700 employees. Two participants were union signatory contractors and two were not. Three out of four employers worked on both public-sector and private-sector projects. One worked only on privatesector projects, primarily in residential construction. Stories or quotes used in this report do not include the participant s real name. A pseudonym is used in place of the participant s name. BUILD A BETTER SOUTH 9


26
27 R E S E A R C H F I N D I N G S : U N S TA B L E W O R K Honest work merits honest pay. For too many construction workers in the South, however, wages are low, work is unstable, and opportunities for career advancement are limited. This section presents survey findings detailing the terms of employment for workers in the southern construction sector. EMPLOYMENT AND WAGES Very few survey respondents are newcomers to the construction industry (Table 1). Just 8% have worked in the industry for less than one year, 21% have been employed in the industry for one to three years, 33% have been employed for four to 10 years, and 39% have been employed for 11 years or more. Despite the long employment tenure of most workers in the construction industry, hourly wage rates tend to be low. for work directly at the construction site, 69% and 19% respectively. Therefore, the results below reflect the primary means of employment within the construction industry and the pay rates documented here are not greatly influenced by unionization (which likely would raise wages) or by informal, day labor employment (which could depress wages). 44 Average hourly wages across the construction industry in the South are lower than those in other regions of the country, and responses to our survey reveal a pattern of low wages across the industry. The average hourly wage of construction workers surveyed is $ The lowest average wages are found in the residential segment of the industry ($14.00), while in commercial segment they are $14.87 and in heavy construction they are $15.91 (Table 2). TA B L E 1 Employment tenure in the construction industry EMPLOYMENT TENURE PERCENT OF WORKERS Less than 1 year 8% 1 to 3 years 21% 4 to 10 years 32% 11 years or more 39% Source: Build a Better South survey, 2016 Survey respondents were asked a series of questions to document their trade, hours worked, pay received, and work breaks taken for each day in the previous week. This approach yields a unique dataset of 6,624 workdays that can be used to analyze hourly wage rates and other aspects of employment. Because just 3% of survey respondents indicated that they are members of a labor union and less than 1% reported that their current job was accessed through a union, the results below primarily present a profile of the wages paid by non-union employers. In addition, a total of just 1% of respondents secured their current job through a day labor center, informal hiring site or immigration visa program (though 6% did secure their current job through a temporary staffing agency). Instead, the most common pathways into their current construction industry job were personal connections (such as family or friends) and applying TA B L E 2 Wage profile of construction jobs in the South INDUSTRY SEGMENT AVERAGE WAGE MEDIAN WAGE PERCENT BELOW $15 PER HOUR Residential $14.00 $ % Commercial $14.87 $ % Heavy $15.91 $ % All segments $14.69 $ % Source: Build a Better South survey, 2016 For some workers in the industry, the problem of low wages is compounded by the instability of employment. More than one-third (36%) reported that they had two or more construction employers in the previous 12 months, and of those with more than one employer, 17% reported having at least four employers. Over the same time period, 12% reported using a temporary staffing agency to find work in the industry. The average hourly wage of construction jobs filled by temporary staffing agencies is just $ Wages also vary according to immigration status. At $13.68, the average hourly wage of undocumented immigrants is lower than the average for all workers, although the difference is not dramatic. The lower average wage of undocumented immigrants is likely due to several factors, including their concentration BUILD A BETTER SOUTH 11
28 It s very hard to make a living here. They make us go all over the city for jobs, and the jobs change every day or every week. The pay isn t enough, not with the rent and gas being so expensive. LIVING WAGES Jose, MASONRY WORKER, Miami When interviewed, he was working on an apartment complex with a starting price of $1.65 million for a one-bedroom apartment. in the residential segment of the industry (more than half indicated that they are employed in residential construction) and the downward pressures that one s status as an undocumented immigrant can place on wage rates. 45 Undocumented immigrants may find that changing jobs is difficult or risky. For this reason, workers may stay in low-paying jobs for extended periods with little or no wage progression. Very few (1%) of the workers surveyed 32% of the are day laborers who found total of respondents employment at informal hiring in Build a Better sites. Therefore, the undocumented South reported that immigrants surveyed should they lacked legal documentation to be regarded as members of the work in the U.S. core workforce in the southern construction industry. A total of 32% of respondents in Build a Better South reported that they lacked legal documentation to work in the U.S. The wages of construction workers too often do not allow them to adequately meet their basic needs. In order to determine the cost of living in the six cities where the surveys were conducted, we used the Living Wage Calculator developed by researchers at the Massachusetts Institute of Technology, a database that estimates the cost of basic family necessities for counties and metropolitan areas across the U.S. 46 It establishes a benchmark for determining the wage rates required for meeting minimum standards of living, and thus can be used to assess the adequacy of hourly wages with respect to local living costs. 46 Using just the living wage standard for a single adult with no dependents, the proportion of construction jobs paying hourly wages that are too low to meet this standard ranges from 7% in Charlotte to 20% in Miami (Table 3). WAGE THEFT Wage theft, the nonpayment of wages to workers for hours worked, is a significant problem for workers in low-wage industries. 30,47,48 Wage theft can take several forms, including the nonpayment of overtime wages and failure to pay employees for work completed. In addition to being against the law, wage theft exacerbates the financial difficulties facing low-wage workers and their families. Survey responses revealed that 30% of construction workers who qualified for overtime pay with their current employer (because they worked more than 40 hours in a week) reported that they did not receive that pay. When questioned about instances of wage theft, workers typically use a much narrower definition, where wage nonpayment is taken to refer only to instances in which an employer fails to pay the employee for work completed. Eleven percent of all survey respondents reported that they have been victims of wage theft while employed in the TABLE 3 Living wage calculation: construction jobs, 2016 CITY METRO AREA LIVING WAGE FOR 1 ADULT PERCENT EARNING BELOW LIVING WAGE FOR 1 ADULT Atlanta Atlanta-Sandy Springs-Roswell $ % Charlotte Charlotte-Concord-Gastonia $ % Dallas Dallas-Fort Worth-Arlington $ % Houston Houston-The Woodlands-Sugar Land $ % Miami Miami-Fort Lauderdale-West Palm Beach $ % Nashville Nashville-Davidson-Murfreesboro-Franklin $ % Source: Glasmeier, Amy K Living Wage Calculator. Cambridge, MA: Massachusetts Institute of Technology, access at: Note: analysis of 2016 construction worker wages compared to 2015 living wage rate for each metropolitan area. 12 BUILD A BETTER SOUTH
29 All my bills were late, and I had to pay extra because they were late. My wife told me I should fight it, that I should go to Workers Defense Project to try and get my money back. Fernando, CONSTRUCTION WORKER, Dallas Fernando, a construction worker in Dallas, explained how his employer failed to pay him $400 a week s wages after a job was completed. Fernando supports his wife and three small children on this modest income. The employer paid him with a check, but when the check was deposited it bounced due to insufficient funds. Several of his co-workers also were not paid by their employer. He s done it before too, to other people. I knew he had the money, because I saw him get paid, he got cash, after every job. He just didn t want to pay us. Understandably, the wage theft caused financial hardships for Fernando s family. Fernando had to turn to the local worker center for assistance in recovering his wages and at the time of the interview the case was progressing through small claims court. construction industry. The amounts owed for the most recent instance of wage theft occurring in the previous 12 months range from $20 to $7,500, with an average nonpayment amount of $1,604 and a median amount of $800 (more than a week of wages for the average worker). In more than half of the cases, workers reported that they spoke to the employer or site supervisor in an effort to recover their wages. A small percentage contacted an attorney, while pursuing the case through government wage enforcement agencies was, by and large, not done. Once wage theft occurred, it is rare for workers to recover their unpaid wages. In 62% of the instances of wage theft, workers reported that they never received their unpaid wages. For workers living paycheck to paycheck, the unexpected hardship of wage theft could be devastating for their families. Based on responses from survey respondents who experienced wage theft in the previous 12 months, we calculated the estimated annual lost income from wage theft for the construction workforces in the six cities. Four percent of construction workers reported that they had not been paid for work in the past 12 months, and the median amount reported stolen from the most recent incident of wage theft is $800. The estimated annual amount of income lost to wage theft in the six metropolitan areas is $29.8 million (see Table 4). This is a conservative estimate since it only includes the most recent wage theft amount, and some workers experienced more than one instance of wage theft in the past 12 months. Workers who do fight back against wage theft typically must confront many obstacles. Court proceedings can be lengthy and costly. In many cases, even when workers receive a judgment in their favor, they face further difficulties in actually collecting unpaid wages. Employers also may take action to dissuade or punish employees who attempt to redress wage theft. Several workers reported that employers retaliated against those who pursued wage claims by firing or reassigning them or by calling immigration authorities. FINANCIAL HARDSHIPS $29.8 MILLION The estimated annual amount of income lost to wage theft in the six metropolitan areas. Low wages, wage theft, violations of overtime laws, and unstable work creates financial hardships for construction workers and their families. More than one in five (21%) construction workers reported that at some point in the previous year working in the construction industry they did not have enough money for groceries or bills, 19% stated that they did not have enough TABLE 4 Estimated annual income lost to wage theft in the Atlanta, Charlotte, Dallas, Houston, Miami, and Nashville metropolitan areas NUMBER OF CONSTRUCTION WORKERS IN SIX METRO AREAS PERCENT OF WORKERS WHO REPORTED WAGE THEFT IN PAST 12 MONTHS NUMBER OF WORKERS WHO EXPERIENCE WAGE THEFT IN SIX METRO AREAS MEDIAN REPORTED AMOUNT OF INCOME LOST TO WAGE THEFT ANNUAL INCOME LOST TO WAGE THEFT IN SIX METRO AREAS 980, % 37,268 $800 $29,814,400 Sources: Bureau of Economic Analysis, 2013; Build a Better South survey, 2016 BUILD A BETTER SOUTH 13
30 Around the time [the injury] happened, I had a power bill due and I had to skip the power bill. Power got cut off and we had to pay a fee to get it back on, so the next two checks went to bills. Michael, COMMERCIAL CONSTRUCTION WORKER, Charlotte, NC Michael, a commercial construction worker based in Charlotte, North Carolina lost wages after experiencing a workplace injury. This happened in the winter, and Michael said his family had to go out by the fire pit and make a fire to use as a heat source during the time his power was cut off. Relatively small wage losses can have a profound impact for construction workers who do not earn enough for household expenses. money to cover medical expenses, 19% were unable to pay their rent or mortgage, and 15% did not have enough money to support their families (Table 5). The two reasons given most often for these financial difficulties are the irregularity of work in the construction industry and low earnings from construction work. TABLE 5 Financial hardships faced by construction workers and their families in the previous year, 2016 HARDSHIP PERCENT OF WORKERS REPORTING Not enough money for groceries or 21% Not enough money for medical care 19% Not enough money for rent or 19% Not enough money to support family 15% Source: Build a Better South survey, 2016 EMPLOYMENT BENEFITS Four of the five states included in Build a Better South require workers compensation coverage for construction workers, but just 45% of construction workers reported that their employer pays into the workers compensation system, which provides insurance to cover medical costs and replacement wages when a worker is injured on the job (see Table 6). An additional 12% of workers were unsure if their employer has a workers compensation insurance policy. The lack of employer participation in the workers compensation system is especially troubling given the high rates of injury at construction worksites, as discussed in the Dangerous Work section of this report. In addition to the inadequate coverage of employees through workers compensation insurance, more than half (53%) of workers reported that the company they work for does not offer employer-provided health insurance. The lack of employer-provided health insurance is especially troubling for workers with low incomes, as none of the five states expanded Medicaid to cover households with incomes at or below poverty level following the passage of the Affordable Care Act. 54 Other types of employment benefits also are rarely provided to construction workers in the South. Respondents indicated that just 23% have employerprovided life insurance policies, 27% receive paid vacation or personal time, 22% receive paid sick days, and 20% are offered enrollment in a retirement or pension plan. PAYROLL FRAUD Payroll fraud occurs when employers misclassify employees as independent contractors. Misclassified workers often lose the basic protections of employees, such as the right to minimum wage and time and half for overtime hours, and they must pay their employer s share of payroll taxes. One in three (32%) survey respondents is misclassified as an independent contractor. c 1 in 3 survey respondents is misclassified as an independent contractor. Misclassifying employees as independent contractors is advantageous to the employer because the business evades the responsibility of paying employment taxes, which enables the employer to keep costs low and be more competitive when bidding for construction projects. These employers generally do not provide benefits, c Build a Better South respondents only included participants who stated that they did not own their own construction company prior to beginning the survey. Thus they were either an employee or believed that they were an employee of another company. Respondents who reported that they never filled out a tax document or filled out a 1099 tax form for contractors were defined as misclassified since all participants were or should have been classified as employees based on the preliminary question. 14 BUILD A BETTER SOUTH
31 A major threat [to the industry] is people who misclassify the workforce. They are absolutely devastating the good contractors and subcontractors in construction. And they are artificially lowering the wage rate for the worker. They re actually harming the workforce. LARGE MASONRY SUBCONTRACTOR based in Texas workers compensation insurance, or unemployment insurance, and they do not pay time and a half for overtime hours, all of which further lowers their labor costs. Construction contractors who misclassify their employees are able to submit much lower bids on projects and therefore harm employers who properly pay for benefits, employment taxes, and overtime. In order to compete, employers who are committed to correctly classifying their employees must look for other ways to cut costs. Based on our interviews with construction contractors, this usually means that they are forced to keep wages low in order to be competitive. JOB TRAINING AND CAREER ADVANCEMENT Jobs in the construction industry have long been regarded as good blue-collar jobs that provide a pathway into the middle class through familysupporting wages, opportunities for advancement, and the prospects of a comfortable retirement at the end of a career. Formal training programs played a crucial role in providing employers and workers with the necessary skills to ensure a well-trained and safe workforce. But over the years, the system of worker training and advancement has broken down, in part because of the proliferation of small firms in the construction industry where there is little room for upward mobility and in part because there is limited access to training programs. Four out of five (81%) construction 4 out of 5 construction workers reported that they have never participated in a formal construction training program in the U.S. workers reported that they have never participated in a formal construction training program in the U.S., and 93% have never participated in a union apprenticeship program. Of the respondents who reported completing a formal training program, the employer provided training for 61% of these workers. For those receiving training that was not provided by the employer, most received this training at a vocational school or community college, followed by training though an employer association and then by training through a labor union. TABLE 6 Workers compensation requirements by state and the percentage of workers who reported that their employer had workers compensation insurance policies, by city PERCENT OF CONSTRUCTION CITY STATE REQUIREMENTS WORKFORCE WHO REPORT HAVING WORKERS COMPENSATION Atlanta, GA Required for businesses with three or more persons. Contractors are responsible for coverage for subcontractors 68% if the subcontractor has 3 or more persons. 49 Charlotte, NC Required for businesses with three or more persons. Contractors are responsible for coverage for subcontractors if the subcontractor has 3 or 60% more persons. 50 Dallas, TX Not required for any construction employer % Houston, TX Not required for any construction employer % Miami, FL Required for construction businesses with 1 or more employees % Nashville, TN Anyone engaged in construction must have workers compensation. 58% Source: Build a Better South survey, 2016 BUILD A BETTER SOUTH 15

32 LACK OF FORMAL TRAINING OPPORTUNITIES AND SKILLS SHORTAGES The breakdown of the training and advancement system in the construction industry of southern cities has had negative consequences, both for workers and for the industry as a whole. Because most workers have not participated in a formal training program, they rarely benefit from the types of systematic skills assessments and performance measurements conducted by formal training providers. Furthermore, the absence of the credentials provided by formal training programs hinders upward mobility in the industry. Increasingly, in the absence of training programs, skills development is occurring informally on the job. The vast majority (91%) of workers who reported that they had not participated in a formal training program indicated that they developed their skills informally on the job. Because of the informal nature of skills development, it is difficult to assess the quality of the learning or its effectiveness. Research has found that this on-thejob training may consist of nothing more than supervisor instructions to observe a co-worker and just copy what he does or observe his technique. 55 For the industry as a whole, there is evidence that the reduced role of formal training programs has contributed to the creation of skills shortages. A 2016 study by the Associated General Contractors of 74% of contractors in the South reported that they are experiencing difficulty filling craft positions. America (AGC) found that three-quarters of the nearly 1,500 contractors responding to a survey rated the existing training pipeline as poor or fair, and 69% reported that they are having difficulties filling positions in crafts such as carpenters, roofers, plumbers, and concrete workers. 56 In the South, 74% of contractors reported that they are experiencing difficulty filling craft positions. GOOD EMPLOYER PROFILE Researchers interviewed a large subcontractor who operates in Texas whose treatment of employees is exemplary, and provides an example of how construction companies can thrive and prosper while providing a living wage, benefits, and opportunities for advancement to their employees. The company had grown from a small business with a handful of employees to a multi-million dollar company with more than 700 employees in just a little more than a decade. Employees are provided with a full benefits package, OSHA safety training, and regular wage increases, but perhaps the most beneficial company practice is the provision of training and the opportunity for advancement. Interested employees can obtain further training in their trade, or in different trade specialties, allowing them to deepen their skills, earn promotions, and craft a stable, life-long career in construction. 16 BUILD A BETTER SOUTH
33 SKILLS SHORTAGES AND INTERNATIONAL IMMIGRATION One way that the construction industry has coped with the shortage of skilled workers is through immigration. An analysis of 2013 American Community Survey data by the National Association of Home Builders finds that 28% of workers in the construction trades are foreign born. 57 Moreover, immigrants comprise 59% of plasterers and stucco masons; approximately half of all drywall/ceiling tile installers and tapers; and more than 40% of all roofers, carpet/floor/tile installers, painters and paperhangers, and hazardous materials removal workers. 57 The majority of immigrants employed in the construction industry are from Mexico and 31% come from regions such as Central and South America. Several southern states are among those with the highest proportion of immigrant workers, including Georgia, North Carolina, South Carolina, Florida, and Texas. Research has shown that the work teams assembled by Latino immigrants have implemented a range of strategies to overcome gaps in skills formation, including frequent job rotation, cross-training, and active mentoring systems. 58 These arrangements certainly have benefited employers by ameliorating some of the negative effects of the breakdown of skills training systems in the construction industry. However, it is of little surprise that the types of informal training highlighted above have not been capable of reversing the systemic decline of formalized workforce training in the industry or the ongoing skills shortages that the AGC warns are a threat to the nation s economic growth. 56 BUILD A BETTER SOUTH 17

34
35 R E S E A R C H F I N D I N G S : D A N G E R O U S W O R K Health and safety issues among construction workers have been well documented, and despite improvements in recent years, construction workers continue to experience high injury and fatality rates. The section explores findings from our survey that add to existing research about workplace injuries, and presents new findings about exposure to heat stress among construction workers that has not been documented in other research. INJURIES ON CONSTRUCTION SITES Injuries on construction sites were a key issue among participants in Build a Better South. One in seven (14%) participants reported experiencing an injury at some point in their construction career, and 38% of those workers reported a worksite injury in the past 12 months. Injury rates reported by respondents were consistently higher than injury rates reported in government data sources for states in the South (Figure 2). The non-fatal injury rates found among construction workers in the Build a Better South are two to nearly five times higher than injury rates reported by the Bureau of Labor Statistics (BLS), which relies on employer-reported data. 59 It got to the point where they made [him] bust his arm. He tore his bicep and when it happened they just thought it was a game. They just laughed at it. Michael and Benjamin, CONSTRUCTION WORKERS, Charlotte, NC Construction workers Michael and Benjamin described intense pressure to work as hard and as fast as possible from supervisors on their worksite in Charlotte, North Carolina. It is critical for construction employers to not only provide safety equipment and training, but to also ensure that a culture of safety exists on their worksites. Michael and Benjamin described a time when a new worker arrived on the site and was harassed by supervisors and other workers to do more labor at a faster pace. The survey question about injuries was structured according to the definition of injuries used by the BLS, but it is important to note that the BLS rate also includes illnesses. Thus the gap between our rate and the rate reported by BLS could potentially be even greater. Furthermore, Build a Better South injury rates are calculated based on the number of FIGURE 2 Under-reporting of injuries Build a Better South annual non-fatal injury rate per 100 workers (1) Bureau of Labor Statistics state annual non-fatal injury/illness rate per 100 full-time equivalents (2) ATLANTA, GA CHARL0TTE, NC DALLAS, TX HOUSTON, TX MIAMI, FL (3) NASHVILLE, TN 1. Includes injuries that required first aid or medical care and occurred in the corresponding state during the previous 12 months (July 2015 July 2016). Rates are calculated based on self-report by workers. 2. Includes injuries and illnesses that required first aid or medical care and occurred in the corresponding state during the course of January December Rates are calculated based on employer records of injuries and illnesses. 3. Florida does not participate in the Survey of Occupational Injuries & Illnesses. BUILD A BETTER SOUTH 19
36 No, we re not going to file that. You got to come back to work or you re fired. Michael, an ironworker from Charlotte, North Carolina experienced a serious injury in January of He had felt pain in his chest for several weeks, but Michael could not take time off work to seek medical care because he would lose wages and was concerned about being fired for taking time off. After several weeks, Michael was at work when he began to experience severe pain, numbness in his face, and a heart rate of 110. The general contractor on the site called an ambulance, and Michael was diagnosed to a chest wall strain, likely due to daily work tasks of moving loads rebar and steel weighing hundreds of pounds. Michael took off work the rest of the week to recover. When he inquired about workers compensation coverage, his employer told him No, we re not going to file that. You got to come back to work or you re fired. Michael believed that his employer had workers compensation coverage, and only found out that they did not after his injury. Michael lost wages, which caused him to skip a utility bill and lose power, and all of the medical bills fell to him and his family. The hospital bill was $3,000. The ambulance ride is $800. There s little bills coming in for different stuff. Thousands of dollars it s ruining my credit because I can t afford to pay it. workers, not on the number of full-time equivalents, which could further exacerbate the disparity between our findings and rates reported by the BLS since some of the respondents did not work full-time. This suggests that injuries may be substantially underreported to government agencies, a problem which may worsen given recent changes that greatly restrict the ability of OSHA to fine employers for poor record-keeping of injuries and illnesses. 60 The injuries reported by respondents were severe, requiring medical care or first aid and frequently necessitating time away from work. 52% of workers injured in the last year reported also experiencing an economic hardship in that year. Among workers injured during the past 12 months, two-thirds (67%) required medical care beyond first aid for their most recent injury, and over one-third (36%) received care in a hospital emergency room. Sixty percent of workers had an injury severe enough to lose at least one day of work, but only half of them received some or all of their wages that were lost during their recovery time. More than half of workers (52%) injured in the last year reported also experiencing an economic hardship in that year as they faced difficulties paying for food, housing costs, or medical care. Lost time from work due to injury undoubtedly has an impact on workers and their families, as 80% of injured workers were supporting at least one other person with their construction wages. THE SOCIAL COSTS OF WORKPLACE INJURIES Construction injuries and fatalities are expensive, both financially for workers and for society as a whole. Serious injuries mean much more than high medical bills: the worker also loses wages as they recover, family members may have to stop working to care for them, and many are left with a permanent impairment that diminishes their ability to earn wages in the future. Research conducted by Waehrer et al. found that fatal and non-fatal injuries in the construction industry cost $11.5 billion in 2002, with non-fatal injuries costing employers, workers, and taxpayers an average of $42,000 for each incident and fatal injuries SIZE OF WORKFORCE IN 6 CITIES* (1) TABLE 7 Estimated number and cost of construction injuries in six research cities RATE OF INJURIES REQUIRING 1 OR MORE DAYS AWAY FROM WORK (DFW) (2) ESTIMATED NUMBER OF ANNUAL INJURIES IN 6 CITIES (2) ESTIMATED COST OF EACH DFW INJURY** (3) ESTIMATED ANNUAL COST OF INJURIES TO 6 CITIES 980, per 100 workers 26,087 $56, $1.47 billion Sources: (1) Bureau of Economic Analysis, full-time and part-time employment in the 6 metro areas, 2013; (2) Build a Better South survey, 2016; (3) Waehrer et al., Cost of construction injuries. *Includes both full-time and part-time employees. **Adjusted to 2016 dollars. 20 BUILD A BETTER SOUTH
37 Workplace injuries on construction sites in the six cities cost an estimated $1.47 BILLION annually, after adjusting for inflation has workers compensation coverage. 45% of workers reported that their employer has workers compensation coverage. each costing an estimated $4 million. 61 Workplace injuries on construction sites in the six cities cost an estimated $1.63 billion annually, after adjusting for inflation (Table 7). The financial burdens of construction injuries emerged as an especially alarming finding in this study, as only 45% of workers reported that their employer has workers compensation coverage. Among those who were injured in the last year, just 5% reported that workers compensation insurance paid for their medical bills. An additional 41% of injured workers reported that their employer paid for their medical care, which could have been with cash, through a different form of insurance, or by some other means. Participants reported that approximately one-third (32%) of injured workers employers did not pay for any of the medical care: 27% of workers reported paying for their own medical bills, 3% used their own personal insurance, and 3% received Medicaid or assistance through another publicly funded medical insurance program. HEALTH AND SAFETY TRAINING Health and safety on the job is affected by numerous factors, including the presence of safety managers, the company/worksite culture regarding worker protections, and the type of training available to workers. Site-specific safety training is a commonsense activity to reduce injuries on the job and is required for many construction tasks, such as working at heights. Forty-four percent of survey respondents reported that they have not received OSHA-certified safety training at any point in their employment in the construction industry (Table 8). Best practices in the industry call for workers to receive a 10-hour OSHA-certified safety training and on-site training relevant to each job site. The OSHA 10 Hour Construction Industry Outreach Training Program is designed to raise the awareness of entry-level construction workers so that they can recognize and prevent hazards on the job and know their rights to a safe workplace. 62 A critical component of the OSHA 10-hour training is informing workers of how to report workplace hazards to OSHA, enabling workers to seek independent assistance with workplace hazards. 63 The OSHA 30-hour Construction Industry Outreach Training course is a comprehensive safety program aimed at construction supervisors. Just over half (53%) of construction workers in southern cities reported that they have received OSHA 10 training, and 20% reported that they have received OSHA 30 training. Only 35% of workers reported that they had received CPR training. TABLE 8 Workers who have received basic workplace safety training Workers with OSHA 10 safety training 53% Workers with OSHA 30 safety training 20% Workers with CPR training 35% Source: Build a Better South survey data, ATLANTA WORKER SUFFERS FROM INJURY & IS FIRED Even when workers do receive workers compensation, many still face retaliation from employers and barriers to accessing care. In Atlanta, Alejandro was severely injured while working on a large commercial construction project in the city s center. A foreman was driving a piece of construction equipment that he was not trained to operate, and Alejandro was struck on the head by the equipment. He was bleeding profusely and was taken to see a supervisor employed by the site s general contractor. Before he was allowed to receive medical care the supervisor demanded that Alejandro sign the company s legal paperwork regarding workplace injuries. I just kept asking for my brother, because I knew I couldn t read that paper when I was like that. My brother was there on the site, but they wouldn t go get him. His employer did provide workers compensation, but more than six hours passed before he received care for his injury. Alejandro was taken to a clinic of his employer s choosing, but then he was required to take a drug test before clinic staff sent him to a hospital emergency room since they were unable to provide the care he needed. Shortly after the injury, Alejandro was laid off. BUILD A BETTER SOUTH 21
38 HEAT STRESS AND ACCESS TO WATER IN THE WORKPLACE HEAT STRESS The hot, humid temperatures across the South pose a great risk to construction workers. Construction workers who work outdoors are exposed to summer heat indices that generally range from 96 degrees Fahrenheit in Charlotte to 109 degrees Fahrenheit in Dallas. 64 The temperature is approximately 15 degrees hotter for workers who labor in direct sunlight, such as roofers, rebar workers, and foundation pourers, making exposure to high temperatures a key concern for workers in certain occupations. 65 When the heat index is over 91 degrees, OSHA recommends that employers schedule frequent rest breaks in the shade and allow workers to acclimate to the heat. 65 Once the heat index reaches 103 degrees, OSHA recommends that enforcing scheduled rest breaks, limiting physically demanding activities, and rescheduling work for cooler times of the day, when possible. If the heat index is 115 degrees or higher, OSHA recommends that all non-essential work be rescheduled and that strenuous activities should not be conducted. No matter what the temperature is, all employers are required to provide drinking water to their workers. 66 Build a Better South participants were asked a series of questions about how the heat affected them during the workday. Workers were surveyed during July and August, when daily maximum heat indices (based on the temperature and the humidity level) averaged between 99 and 106 degrees in the six cities Workers laboring in direct sunlight were experiencing heat indices ranging from approximately 119 to 126 degrees at the time of the survey. Eighty-nine percent of workers described their workplace as hot or very hot and 61% described their workplace as very humid. Over half (59%) of workers reported doing five hours or more of heavy labor every day, and nearly three-fourths (71%) of workers reported that the heat affected their ability to do their job. For 16% of workers, the heat had been so severe at some point in the last month that they had to stop working because they felt ill. The extreme summer heat of the South was a risk faced by nearly all survey respondents and their risk of developing heatrelated illnesses was often moderate to high (Table 9), especially when their workloads and time spent in direct sunlight are factored into their risk assessments. CITY TABLE 9 Heat index and heat stress risk levels AVERAGE AND MAXIMUM DAILY HEAT INDEX DURING JULY 2016 OSHA HEAT STRESS RISK LEVEL* Atlanta, GA F Lower moderate Charlotte, NC F Lower moderate Dallas, TX F Moderate high Houston, TX F Moderate high Miami, FL F Moderate Nashville, TN F Lower moderate Sources: Weather Underground historical data, OSHA Guide to Using the Heat Index for Employers * Workers laboring in direct sunlight, such as roofers and foundation workers, would be exposed to temperatures 15 F higher than the ambient temperature. Thus, workers laboring in direct sunlight in heat indices of 100 F or greater would all be in the extreme-risk category for heat stress. NASHVILLE WORKERS STRIKE FOR DRINKING WATER In July 2016, a group of rebar workers at a hotel site in Nashville went on strike because they were not provided drinking water. Moises and Gabriel stated that they had experienced a series of employment violations, including being misclassified as independent contractors, not being provided with safety equipment, and experiencing racial discrimination. They were also paid relatively low wages, and had unstable work schedules that sometimes dropped to just twenty hours a week. However, the final straw for Moises and Gabriel was when the temperature started to climb and they asked their employer for drinking water. They didn t give us water they ignored us, Gabriel told us. Moises asked about a water cooler on the site and was told, the water belongs to another company. He wasn t allowed to access the water. Moises continued: That was when I made my decision I was fed up. The people are thirsty in this heat, and lifting rebar weakens you. That s why we are going to push them to make changes. So that all workers who do this heavy work can be treated well. 22 BUILD A BETTER SOUTH
39 Even in the South s high summer temperatures, heatrelated illnesses are easily prevented. Basic steps such as providing rest, shade, and water: allowing workers to gradually become acclimatized: and training workers and supervisors on watching for signs of heatrelated illnesses can help prevent the severe health effects of heat. Unfortunately, many workers in the study did not benefit from any of these basic prevention measures, including one of the most basic and effective tools in preventing heat-related illnesses: water. LACK OF ACCESS TO DRINKING WATER Over one-third of workers (36%) reported that water was not provided on their worksite, even though the provision of drinking water is required by law for all employers. 66 Nearly all of these workers said that they brought their own water, but these workers experienced greater effects from the heat and drank less water than workers who had water 36% of workers reported that water was not provided on their worksite. provided on their worksite. Workers who had to bring their own water reported drinking water much less often than their peers who had water provided by their employer, often going two or more hours without drinking water. A lack of water on the worksite was also associated with a greater impact on workers abilities to do their job in the heat. Among those who brought their own water to work, 81% reported that the heat had affected their ability to do their job during the past week, compared to 65% of those who had employers that provided water. Workers who had to supply their own water has 1.3 times higher risk (p = 0.04) of reporting that they had to stop working in the past month because they felt ill from the heat, compared to workers who had water provided on their worksite. LACK OF REST BREAKS A lack of rest breaks, which are also essential in preventing heat-related illnesses, was an even more common problem. Sixty-four percent of workers missed one or more afternoon rest breaks during the regular workweek (Monday through Friday) prior to being surveyed, and 44% missed one or more morning breaks. Thirty-three percent of workers reported receiving no rest breaks in the morning during the previous workweek, and 50% percent reported receiving no rest breaks in the afternoon when heat indices are typically highest. Tragically, a lack of rest breaks and water in the intense summer heat leads to numerous deaths of construction workers every year in the South. One such death was 25-yearold Roendy Granillo, who collapsed and died on a residential construction site near Dallas in 2015 (see box below). More than one in four (27%) workers had no rest breaks at all during the previous workweek. Workers who received no rest breaks had a 1.4 times higher risk (p = 0.05) of reporting that they had to stop working because of the heat compared to the 22% of workers who received morning and afternoon rest breaks each day. Findings from the Build a Better South survey indicate that the provision of drinking water and short rest breaks can potentially have a positive effect on the health of workers during summer months. Far too many workers lacked these most basic safety measures on their worksites. HEAT STROKE DEATH OF 25-YEAR-OLD ROENDY GRANILLO Many construction workers throughout the South must work long hours in very high temperatures without the most basic of safety provisions: rest breaks and water. Roendy Granillo was one such worker, laboring for 14 hours per day without rest or meal breaks to build new homes in the Dallas suburbs. Throughout the day the 25-year-old repeatedly asked his employer to be taken to the hospital because he felt ill but was repeatedly denied medical care. It was not until Mr. Granillo collapsed on the construction site around 5 p.m. that he finally received medical attention, but by then it was too late. His body temperature had risen to 110 degrees, leading to multi-organ system failure which occurs in severe cases of heat stroke. Mr. Granillo left behind a family, including his mother and father, three siblings, and a five-year-old daughter. BUILD A BETTER SOUTH 23

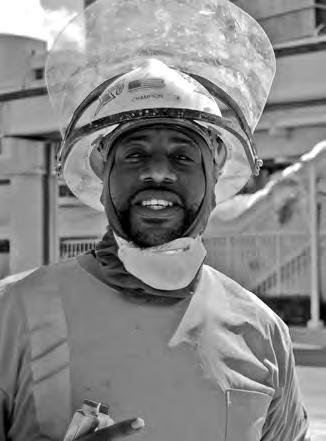

40
41 W O R K I N G C O N D I T I O N S I N M A J O R S O U T H E R N C O N S T R U C T I O N M A R K E T S ATLANTA, GEORGIA Atlanta is a key economic driver of the South, as it has the 10 th largest economy in the U.S. and generates more than two-thirds of all gross domestic product (GDP) in the state of Georgia. 74 The majority of Atlanta residents live outside city limits in the surrounding suburban areas, with approximately 650,000 residing in Atlanta and 5.4 million in the metro area. 75 More than half (54%) of Atlanta residents are African-American, 36% are White, and 5% are Latino. 75 Atlanta s African-American population has formed the city s history and culture, making it home to numerous museums and important historical icons in Black history, and the city has been hailed as the nation s center for Black culture. 76,77 ATLANTA CONSTRUCTION INDUSTRY Prior to the recession, the Atlanta metro area employed approximately 224,000 construction workers. 1 This number fell to just 155,000 in 2011, but has since been increasing steadily. The recovery of Atlanta s construction industry has occurred primarily in nonresidential construction, and large, high-profile projects have created demand for more workers. The largest projects underway in Atlanta are roadway projects, such as the $1 billion Northwest Corridors project, and large sports stadiums and mixed-use projects. 78 Two of the largest construction projects are SunTrust Park, which will be the new home of the major league baseball team, a $1.1 billion construction project, and the Mercedes-Benz Stadium, a $1.5 billion project that will host the major league football and soccer teams. 78,79 In November 2016, Atlanta voters approved a half-cent sales tax to support the expansion of MARTA, its transit system, expected to raise $2.5 billion for infrastructure over 40 years, along with additional sales tax increases in Fulton County for improving roads and sidewalks. 80 The Mercedes-Benz Stadium is notable, both as the city s largest project and as one of the city s largest construction controversies. The construction of the stadium relies on at least $200 million in taxpayer dollars, although it is estimated that city funds that will go towards maintenance of the stadium in future years could exceed $700 million. 81 Further controversies have plagued the project as costs continually increased, lawsuits from workers injured while working on the stadium became public, and promises of hiring minority-owned firms were broken. 79,82,83 The stadium is located next door to one of Atlanta s most impoverished neighborhoods, and hundreds of men and women in the surrounding area were eager to find work on the project. However, a 2014 investigation found that out of 500 local unemployed workers who were promised a job on the project, none had yet been employed to construct the stadium. 83 SOCIOECONOMIC ISSUES Despite Atlanta s economic growth and fame as a mecca for Black culture, many of Atlanta s African American residents see little benefit. Unemployment for African Americans in Atlanta is 22%, far higher than the unemployment rate of 6% for the city s White population. 84 Unemployment among African American households has been linked to racial discrimination in hiring, poor access to high-quality secondary education, and high incarceration rates 92% of those incarcerated in Atlanta are African American. 84 White households in Atlanta earn a median income of $85,000 compared to just $27,000 for African American households, and the city remains deeply segregated by race and by income. 84 Eight out of ten of Atlanta s African American children reside in high-poverty neighborhoods, and poverty is increasingly being pushed out of the city s limits and into the surrounding suburbs. 84,85 Racial discrimination towards African Americans has been well-documented in Atlanta, and has been linked to higher job stress and higher rates of hypertension for African Americans in the metropolitan area. 86 Latinos in Atlanta also face high poverty rates and discrimination. The median household income for Latinos is half that of White households, and only half of Latino students in Atlanta graduate from high school. 84 Discrimination against Latinos has been documented in multiple circumstances in Atlanta, and Georgia s strict immigration law, House Bill BUILD A BETTER SOUTH 25
42 (HB) 87, has had a profound impact on the state s Latino population, and especially on undocumented immigrants in Georgia. HB 87 required businesses to use E-Verify, which checks the validity of employees social security numbers. Although it appears that some undocumented workers have now returned to the state, a major outmigration from Georgia occurred after the bill was initially passed, causing more than $140 million in losses to Georgia s agricultural industry and effects in many other industries. 87,88 Atlanta s construction industry, an industry that relies heavily on African American and Latino workers, is embedded in the city s complex social and political environment. The Associated General Contractors in Georgia created a campaign to coordinate statewide efforts to attract and train new workers for the industry because labor shortages had reached crisis levels, despite high unemployment in communities of color. 84,89 An enormous opportunity exists in Atlanta for the construction industry to improve conditions and alleviate unemployment and provide middle-class incomes to the city s African American and Latino workers. LOW WAGES, STOLEN WAGES Wages for the majority of construction workers in Atlanta are low based on participant responses. The median wage of an Atlanta construction worker in all occupations was just $14 per hour, and one in four workers earned $12 an hour or less. Of the 33% of Atlanta construction workers who reported experiencing economic difficulties in the past year, 44% said that they were due to insufficient wages. Workers who are legal permanent residents or are working with temporary guest worker visas are the most likely to earn very low wages (under $12 per hour), as well as those who lack a high school diploma or GED. General laborers and workers who install drywall or do concrete work disproportionately earn very low wages. Workers employed by temporary staffing agencies are also more likely to earn low wages, as 24% of very lowwage jobs are held by temporary workers, even though they comprise just 10% of the construction workforce. Low wages are not the only issue experienced by Atlanta construction workers. One in six Atlanta workers have had wages stolen at some point during their construction career. Of the workers who reported wage theft, 40% had their wages stolen B U I L D A B E T T E R S O U T H S U R V E Y F I N D I N G S : ATLANTA, GA OVERVIEW OF ATLANTA PARTICIPANTS: MEDIAN AGE: 34 GENDER: 94% MALE, 6% FEMALE RACE/ETHNICITY: 31% BLACK, 37% LATINO, 31% WHITE, 2% MULTIPLE RACES HIGH SCHOOL OR ABOVE: 70% COUNTRY OF ORIGIN: 67% U.S., 27% MEXICO, 5% CENTRAL AMERICA, 1% CANADA, <1% SOUTH AMERICA INDUSTRY SECTOR BREAKDOWN: 48% COMMERCIAL BUILDINGS 28% RESIDENTIAL BUILDINGS 24% HEAVY CONSTRUCTION during the past year. A median of $800 was stolen from workers who have experienced wage theft during the last year, equating to approximately 57 hours of labor for the average Atlanta construction worker. Eighty-eight percent of these workers tried to recover their wages, often by speaking with their employer (44%) or another supervisor on the construction site (16%), but only 24% of workers were able to recover some or all of their unpaid wages. OPPORTUNITIES FOR AFRICAN AMERICAN WORKERS IN ATLANTA Because African Americans comprise the majority of Atlanta s population and because of the high unemployment rate for African Americans in the city, this section examines the experiences of African American workers in Atlanta s construction industry. Nearly one-third (31%) of construction workers in Atlanta are African American, a figure disproportionately low considering that more than half of Atlanta residents are African American, indicating that opportunities exist for the industry to improve outreach to and hiring of African American communities in training programs and outreach events. 26 BUILD A BETTER SOUTH
43 It s all about the benefits,... As you get old, you want to make sure your social security will be sufficient. It would be good to have some kind of insurance eventually you re going to slow down. Trevor, CONSTRUCTION WORKER, Atlanta, GA Trevor, a middle-aged worker from Atlanta, has worked for more than 20 years as a construction worker in the city. Trevor is one of the few African Americans in the city who primarily works as a day laborer, finding work in commercial construction and residential remodeling by arriving at a local hardware store early in the morning to find potential employers. Trevor s work life is precarious, often experiencing being paid late and was injured working on a residential remodeling project. Trevor recalled a time when he met two older workers on a construction site who belonged to a local construction union. One of the men told Trevor that he never would have stayed [in construction] if it wasn t for the union. Trevor is not a union member himself, but wishes for the opportunity. Retirement or pension plans are critical for enabling older workers to retire from a physically demanding industry, but fewer than one in three African American construction workers in Atlanta are offered some type of retirement plan. The majority of African American workers are employed in commercial or heavy construction, and make up just under a fifth of workers in the residential sector. African American workers are employed in occupations similar to other workers in the industry, with more than a third (35%) working as general laborers, with other key occupations being concrete work (7%), rebar work (6%) and electrical work (5%). A small number of African Americans worked in management or supervisory positions (3%). The ways in which African American workers obtain jobs in construction differed substantially from those of other workers. While Atlanta construction workers generally rely heavily on personal connections (62%) to obtain work, less than half (45%) of African American workers use personal connections. It is unknown from survey data why this disparity exists, but fewer personal connections in the construction industry, along with racial discrimination, may play a role in why a relatively low proportion of African Americans are employed in the industry. African American workers are more likely to directly apply at the construction site (32% vs. 23%), use temporary staffing agencies (17% vs. 10%), or find work through their union (3% vs. 1%) compared to the city s workforce as a whole. Union membership was significantly higher among African American construction workers, as nearly one in ten are current union members compared to just one in twenty among all Atlanta workers. CHARLOTTE, NORTH CAROLINA Charlotte is a rapidly changing city in the South. North Carolina is currently experiencing a largescale migration from rural to urban areas while at the same time it is witnessing high rates of international and domestic immigration. 90 Charlotte ranked 10th in the U.S. for the most new residents added in 2015, and the city now has a population of 827, Charlotte s economy relies heavily on its finance sector, manufacturing, retail trade, accommodation and food services, and construction. 1 Latinos are responsible for much of the population growth in both Charlotte and throughout the state. From 1990 to 2004, North Carolina saw its Latino population grow rapidly from just 76,000 to 600, Between 2000 and 2010 alone, the Latino population more than doubled. 93 Latino labor market participation has increased as well, and the low median age of Latinos in the state (24 years) combined with the high share of births to Latina women will increase the importance of Latinos to the state s economy in the coming years. 94 CHARLOTTE S CONSTRUCTION INDUSTRY Construction has been one of the fastest-growing industry in terms of employment in Charlotte, growing by 24% from 2010 to Dozens of major construction projects are planned, including luxury apartments, mixed-use projects, and office buildings. 95 High-end housing drives a large share of construction in Charlotte, making residential construction an important sub-sector in the local industry. Construction growth has put a strain on the industry, as 84% of contractors in Charlotte report that they have difficulty finding enough skilled workers in a range of crafts. 96 The workforce demographics of Charlotte s construction industry are shifting in order to meet the high demand for workers, and the industry is increasingly relying on Latino immigrants to complete construction projects. According to the American Community Survey, from BUILD A BETTER SOUTH 27
44 , Latinos comprised approximately 17% of the construction workforce in North Carolina. Estimates for Charlotte differ significantly. An estimated 44,759 workers were employed in Mecklenburg County (the county where Charlotte is located) on construction projects during The Migration Policy Institute estimates that 13,000 undocumented Latino workers labor in Mecklenburg County s construction industry, which means that they account for roughly one-third of the county s construction workforce, a figure that does not include Latino visa holders, legal permanent residents, or U.S.-born Latinos. 97 Immigrant workers are absolutely essential to the city s construction industry, and industry leaders and policymakers should ensure that construction workers earn living wages, receive benefits, and are well-trained. SOCIOECONOMIC ISSUES Income inequality and racial/ethnic disparities in wealth are some of the most pressing issues facing Charlotte, like many other cities across the South. Asian and White families in Mecklenburg County earn median household incomes of more than $70,000 a year, nearly double the $37,000 a year earned by Latino and Black households. 98 One out of every four Latino families lives in poverty, compared to one out of thirty White families. 98 Historically, Latinos in North Carolina largely resided in rural areas and were employed at large tobacco farms. The state s agricultural industry still relies heavily on immigrants, hiring nearly 20,000 guest workers every year from Mexico and Central America, but increasingly immigrants are moving into urban employment sectors. 99 Although construction jobs often pay more and offer greater stability than agricultural jobs, the city s higher cost of living keeps many immigrant Latino families mired in poverty. A family of three needs an estimated $48,000 a year to afford to live in Charlotte, yet Latino families earn approximately $12,000 less than this figure. 98 Survey responses collected from Charlotte construction workers found that the workforce is dominated by Latino workers, and 39% of respondents are undocumented immigrants, a proportion similar to the construction workforce of Texas. Charlotte construction workers, and in particular immigrant construction workers, have little access to employment B U I L D A B E T T E R S O U T H S U R V E Y F I N D I N G S : CHARLOTTE, NC OVERVIEW OF CHARLOTTE PARTICIPANTS: MEDIAN AGE: 36 GENDER: 98% MALE, 2% FEMALE RACE/ETHNICITY: 14% BLACK, 68% LATINO, 17% WHITE, 2% ASIAN HIGH SCHOOL OR ABOVE: 62% COUNTRY OF ORIGIN: 36% U.S., 34% MEXICO, 29% CENTRAL AMERICAN COUNTRIES, <1% SOUTH AMERICAN COUNTRIES INDUSTRY SECTOR BREAKDOWN: 40% COMMERCIAL BUILDINGS 40% RESIDENTIAL BUILDINGS 20% HEAVY CONSTRUCTION benefits or formal training, which can affect the lifetime earnings of workers and their ability to retire. FEW BENEFITS FOR CHARLOTTE S CONSTRUCTION WORKERS The lack of employment benefits is one of the most pressing issues reported by construction workers in Charlotte. Forty-four percent of construction workers have no benefit of any kind offered by their employer, d and 38% lack workers compensation coverage. The lack of benefits affects workers with an employee status as well as employees who are misclassified as independent contractors. The lack of benefits offered to workers in Charlotte was somewhat surprising, given that the percentage of misclassified workers (17%) was lowest in Charlotte compared to the other five cities. Less than a third of all workers have health insurance coverage through their employer, and less than onequarter have paid sick days or retirement plans. The majority of workers without any employment benefits are Latino (88%) and foreign-born (86%). d Employment benefits include medical insurance, life insurance, paid vacation or personal days, paid sick days, or some form of a retirement or pension plan. Workers who did not have any benefits said that their employer did not offer any of the stated benefits. 28 BUILD A BETTER SOUTH
45 The only thing they can do is stand up. Every single one of them. Stand up, and if [the employer s] out of workers, he sees that all his workers are fed up with getting mistreated, then he ll fix something. Benjamin, REBAR WORKER, Charlotte, NC Benjamin, a rebar worker in his twenties from Charlotte, North Carolina, has experienced a host of labor rights violations in his short construction career: illegal wage deductions totaling hundreds of dollars, not being paid for hours worked, and multiple forms of retaliation from his employer when he tried to address the wage theft issues. He has no benefits: no medical insurance, no paid time off, or any workers compensation insurance. He has not received any formal training from his employer; even basic safety training was not provided. When asked what workers could do to make conditions in the construction industry better, Benjamin responded The only thing they can do is stand up. Every single one of them. Stand up, and if [the employer s] out of workers, he sees that all his workers are fed up with getting mistreated, then he ll fix something. TABLE 10 Prevalence of benefits among employees and misclassified contractors in Charlotte TYPE OF BENEFIT MEDICAL INSURANCE Offered insurance Participates in plan LIFE INSURANCE Offered insurance Participates in plan RETIREMENT/ PENSION Offered insurance Participates in plan Paid vacation or personal days PERCENT OF EMPLOYEES OFFERED BENEFITS (78% OF WORKFORCE)* 59% 36% 35% 21% 26% 18% PERCENT OF MISCLASSIFIED EMPLOYEES OFFERED BENEFITS (17% OF WORKFORCE) 13% 10% 10% 4% 4% 4% 36% 10% Paid sick days 24% 8% *Five percent of Charlotte workers were unsure if taxes were withdrawn from their wages, so it was not possible to determine their classification status. ACCESS TO FORMAL TRAINING AND CAREER ADVANCEMENT Charlotte s construction workforce has largely been informally trained. Only 11% of Charlotte construction workers reported that they have received formal construction training, the lowest percentage reported among the six cities. A lack of access to formal training in the U.S. was an acute issue among the city s large undocumented workforce, as just 5% of undocumented workers have received formal construction training compared to 11% of all workers. Among the 11% of Charlotte workers who received formal training, fewer than half (44%) had the training costs covered by their employer, indicating that the majority of Charlotte construction workers must pay for formal training out of their personal funds. The most common sources of formal training are vocational schools and community colleges. Just 3% of Charlotte construction workers have participated in a union apprenticeship program. A third of workers (34%) said they have never even heard of an apprenticeship program. However, interest in joining a union was relatively high (52% said they would or might be interested in joining a union) and 77% of workers have received the ten-hour OSHA construction safety course, by far the highest percentage of workers with this training in the region. Responses from Charlotte workers indicate that opportunities for career advancement are few, and that tenure in the industry does little to improve conditions. No significant differences in terms of benefits or wages are found in the percentage of workers between workers with less than 10 years of experience and those with 10 years of experience or more in the industry. The median hourly wage for workers with 10 or more years of experience are only $1.52 higher ($15.62) than that for workers with fewer than 10 years of experience ($14.00). BUILD A BETTER SOUTH 29
46 DALLAS, TEXAS Dallas is home to more than 1.2 million residents, and is one of the largest hubs of construction activity in the nation. Dallas is part of the larger Dallas- Fort Worth (DFW) metropolitan area, which has a population of more than 6 million. The DFW metro is the second fastest-growing metro in the country, just behind Houston. 100 Dallas is a highly diverse city, and a Dallas zip code was named the most diverse zip code in the U.S., as approximately one-fourth of its residents are Asian-American, one-fourth are African-American, one-fourth are Latino, and one-fourth are White. 101 Nearly one in five Dallas residents are immigrants, who contribute greatly to Dallas cultural and ethnic diversity. DALLAS CONSTRUCTION INDUSTRY Everything is under construction in Dallas. DFW has more residential construction than the Los Angeles metro area, even though Los Angeles has a population more than twice as large as DFW. 102 The DFW metro had over 57,000 new housing starts under construction in 2015, second only to New York City. 102 Numerous large commercial construction projects are also underway in DFW, including the 4 million square-foot corporate campus for Toyota s North American headquarters and the $2 billion, 7.6 million square-foot Wade Park mixed use project. 103,104 Dallas construction projects rely on large numbers of construction workers to clear land, pour foundations, erect frames, and lay roadways. Nearly a quarter of a million (245,796) construction workers are employed in the DFW metro area, the majority of whom are Latino. 1 According to the American Community Survey, at least half of DFW s construction workforce is Latino, and 89% of Dallas immigrant construction workers are of Mexican 245,796 construction workers are employed in the DFW metro area. origin. 23 DFW s massive construction growth and high demand for labor makes the nationwide labor shortage in the construction industry even more acute, and construction costs in Dallas have risen in recent years partly due to the labor shortage. 105 In order to keep up with demand, many construction workers are required to work overtime, a fact that was reflected in the findings of the Building a Better South survey: 86% of Dallas construction workers B U I L D A B E T T E R S O U T H S U R V E Y F I N D I N G S : DALLAS, TX OVERVIEW OF DALLAS PARTICIPANTS: MEDIAN AGE: 38 GENDER: 98% MALE, 2% FEMALE RACE/ETHNICITY: 6% BLACK, 77% LATINO, 9% WHITE, 1% AMERICAN INDIAN/ALASKAN NATIVE, 1% ASIAN, 1% HAWAIIAN/PACIFIC ISLANDER, 5% MULTIPLE RACES HIGH SCHOOL OR ABOVE: 67% COUNTRY OF ORIGIN: 37% U.S., 52% MEXICO, 8% CENTRAL AMERICAN COUNTRIES, 1% ASIAN COUNTRIES, 1% CARIBBEAN COUNTRIES, 1% EUROPEAN COUNTRIES INDUSTRY SECTOR BREAKDOWN: 39% COMMERCIAL BUILDINGS 43% RESIDENTIAL BUILDINGS 18% HEAVY CONSTRUCTION reported working overtime hours with their current employer. In order for the industry to succeed in a time of unprecedented growth, construction industry leaders must ensure that well-trained workers are entering into and staying in construction jobs. SOCIOECONOMIC ISSUES IN DALLAS The benefits of Dallas rapid growth has not benefited all of its residents. Dallas has the highest child poverty rate among the ten largest cities in the nation, with over a third of Dallas children living in poverty. 106 One in five Dallas households have incomes below poverty line, and Dallas families now make approximately $10,000 less than they did in The percentage of Dallas residents earning middle-class incomes (between $25,000 and $149,000) has dropped substantially over the past decade, while the percentage of families earning poverty-level wages (less than $25,000) has steadily increased. Poverty among working families in DFW has become a critical issue, as the cost of living has risen as wages have stagnated. 30 BUILD A BETTER SOUTH
47 Construction workers in Dallas are some of Dallas poorest residents, earning a median income of just $19,000 a year according in the American Community Survey. 23 These men and women have been crucial to Dallas growth and prosperity, yet many earn low wages, lack employment benefits, and face frequent violations of their rights as workers. In Build a Better South, we found that two of the most critical issues facing Dallas construction workers were the lack of basic employment benefits, such as medical insurance or paid sick days, and various forms of wage theft, including not being paid time and a half for overtime hours, being paid less than minimum wage, or simply not being paid at all. HEAVY WORKLOAD WITH FEW BENEFITS Dallas construction workers who participated in Build a Better South often reported struggling with a heavy workload and high pressure from employers, yet many did not receive the most basic of employment benefits. Nearly half (42%) of Dallas construction workers report doing heavy labor for eight or more hours a day, and 86% of workers report working overtime hours. Heavy pressure to do high volumes of work at a fast pace was a recurring theme in the interviews we conducted with Dallas construction workers. A Dallas area foreman said during an interview that employees were not allowed to take days off when they were sick because of the intensity of the workload. This company put a lot of pressure on everybody, he said. It was bad...i got really sick and they didn t even give me a chance to go to the doctor. I asked for a day off...i got the flu and I couldn t think right. I called my supervisor and he was like I don t care if you have a temperature of he didn t let me take my vacation. Many Dallas construction employers have high demands of their employees but offer little in return. More than a third (38%) of Dallas construction workers report that their employer does not offer any benefits. This figure masks the experiences of people who are offered benefits but cannot utilize them, as seen in the story of the Dallas foreman. Even six years after the passage of the Affordable Care Act, less than half of Dallas construction workers are offered health insurance coverage by their employer, and only one in four are actually covered by their employer s health insurance plan. Less than a third of workers (30%) have paid personal days, and just one in five workers have paid sick days. Retirement benefits are relatively rare, with just 18% of workers reporting that their current employer offered some type of retirement or pension benefit. 1 in 4 are actually covered by their employer s health insurance plan. The heavy workload and lack of employment benefits for Dallas construction workers are problematic for many reasons. Dallas is facing a poverty crisis, one that will only be exacerbated if low- and middleincome working families lack access to retirement benefits or basic health care. The industry will also continue to suffer from worsening labor shortages if employees are not offered benefits but are asked to produce high volumes of work at a rapid pace. STOLEN LABOR: WAGE THEFT IN THE LONE STAR STATE Wage theft is another major issue found among Dallas construction workers. Wage theft comes in various forms, and can include not being paid time and a half when an employee works more than 40 hours in a week, not being paid the federal or state minimum wage, having money deducted from their paycheck illegally, or simply not being paid at all. In Dallas, all of these forms of wage theft are found among construction workers. Not being paid at all is perhaps the most severe and most devastating form of wage theft. Employers may disappear, they may fire the employee, or they may write bad checks in order to avoid paying an employee his or her wages. Thirteen percent of Dallas construction workers have experienced not being paid by an employer at some point in their construction career; half of these cases had occurred in the past 12 months. Less than a third (27%) of wage theft victims have received the money that they were owed. In an interview with a Dallas area construction worker who had suffered from multiple forms of wage theft, the worker described his thoughts after experiencing wage theft: I had always heard of bosses who treated employees badly, but I had never experienced it myself...they treat you as if you were a slave. Feelings associated with slavery were a common theme among wage theft victims throughout the South, because they had provided their labor and were not paid for it. Other forms of wage theft are common among Dallas construction workers. More than one in four BUILD A BETTER SOUTH 31
48 workers (28%) who worked overtime were not paid time and a half for their overtime hours. Fifteen percent of workers reported that a construction employer had deducted money from their paycheck for transportation to the job site, safety equipment, or uniforms, which are potential cases of wage theft. e Minimum wage violations are uncommon among survey respondents in Dallas, with only one possible case of a minimum wage violation reported. Thirty percent of Dallas construction workers in Build a Better South report suffering 30% of from either not being paid Dallas construction overtime, not being paid at all, workers in Build a or both. Wage theft is a critical Better South report issue in the Dallas construction suffering from either not being paid industry, as it robs employees overtime, not being of their earned wages and robs paid at all, or both. Texas of payroll tax dollars. HOUSTON, TEXAS Houston is the fourth largest city in the U.S., with 2.3 million people residing within city limits. 108 The sprawling Houston metro area is home to 6.6 million residents and covers a geographic area larger than the entire state of New Jersey. Houston is an enormous economic engine in the South: if the Houston metro area were a country, its economy would be the 23rd largest economy in the world. 109 In 2015, Houston was the fastest growing large metro in the U.S., adding nearly three-quarters of a million new residents during Nearly half of all Houston residents are Latino, and two out of every five new Houston residents are immigrants. 110,111 Over 145 languages are spoken in Houston, making it one of the most linguistically diverse cities nationwide. 112 The state demographer of Texas predicts that Texas and its metro areas will grow much more rapidly than many other states in the U.S., largely due to its young Latino population. The steady population growth of one of America s largest cities has fueled demand for infrastructure and buildings throughout the Houston metro area, which is reflected in the growth of the city s construction industry. e Under the Texas Payday Law Section , deducting wages from an employee s paycheck is illegal without the express permission of the employee. B U I L D A B E T T E R S O U T H S U R V E Y F I N D I N G S : HOUSTON, TX OVERVIEW OF HOUSTON PARTICIPANTS: MEDIAN AGE: 36 GENDER: 97% MALE, 3% FEMALE RACE/ETHNICITY: 6% BLACK, 84% LATINO, 8% WHITE, 1% AMERICAN INDIAN/ALASKAN NATIVE, 1% ASIAN, 1% MULTIPLE RACES HIGH SCHOOL OR ABOVE: 60% COUNTRY OF ORIGIN: 23% U.S., 50% MEXICO, 26% CENTRAL AMERICAN COUNTRIES, 1% SOUTH AMERICAN COUNTRIES, 1% ASIAN COUNTRIES, 1% CARIBBEAN COUNTRIES INDUSTRY SECTOR BREAKDOWN: 51% COMMERCIAL BUILDINGS 41% RESIDENTIAL BUILDINGS 8% HEAVY CONSTRUCTION HOUSTON CONSTRUCTION INDUSTRY Houston s construction industry is vast, and only a recent plunge in oil prices during 2016 slowed Houston s ceaseless construction growth during the past five years. 113 More than a quarter-million construction workers labor in Houston, and approximately one in four construction workers in Texas are employed in the Houston metro area. 1 Unlike some construction markets where construction is largely driven by a single type of construction, such as single-family homes, Houston s construction industry is diverse. Massive roadway and bridge projects have been underway since economic stimulus packages were dispersed, and east Houston alone had more than $50 million of industrial construction in Although residential construction has slowed since the recession, more than 56,000 housing units were under construction in Like many Texas cities, Houston s construction industry also has a severe labor shortage. Many Texas 32 BUILD A BETTER SOUTH
49 workers left the construction industry for work in the oil and gas industry when the 2008 recession brought many construction projects to a halt, and few new, young workers are choosing to enter the industry. 116 In 2014, some property developers reported hiring guards to prevent worker poaching, which is when workers are offered higher wages or other benefits by a recruiter to work for a different company. 117 Even with the recent slowdown in construction in Houston from a drop in oil and gas prices, more than threefourths of construction companies surveyed in Houston during 2016 reported that they had difficulty finding enough craft workers to fill hourly positions. 118 The National Association of Homebuilders estimates that nearly a third of construction workers left residential construction after the Great Recession, squeezing an already tight labor market. 119 In 2016, there were an estimated 200,000 unfilled construction jobs nationwide, a figure nearly double that of ISSUES IN THE HOUSTON CONSTRUCTION INDUSTRY Despite the middle-class wages offered by many craft jobs in construction, few American workers are taking advantage of the opportunities available to workers in the industry. The reasons for labor shortages in the industry are numerous, and most attribute it to public perception of manual labor and the construction industry itself. Few high schools offer shop classes or vocational training, and far more students are pushed towards higher education rather than towards careers involving manual labor. 120,121 Workers cite construction s irregularity as a major reason for staying out of the industry. The shortage of U.S.-born workers has meant that construction in Texas continues solely because of large numbers of immigrant workers willing and able to fill the vacant positions. According to the National Association of Homebuilders, 40% of Texas construction workers are foreign-born, and many of the most in-demand positions, such as carpenters, are filled by immigrants. 57 Many of these immigrant workers lack formal work authorization, and an estimated 25% of Houston s 260,000 undocumented adults in the labor force are employed in construction. 122 The lack of work authorization has forced many to work in the informal economy, where they are paid in cash and classified as contractors rather than employees. The issue of immigration is so critical to the construction industry that the Associated General Contractors of America has repeatedly called for national immigration reform that would allow undocumented workers to gain legal status and create a visa program that would enable construction employers to temporarily hire foreign workers. 123 This issue has fundamentally shaped Houston s construction industry. Among the Houston respondents in Build a Better South, characteristics of informal work were widespread. Informal work is characterized by a lack of legal or social protection for workers, and is generally unmonitored, unregulated, and untaxed. In construction, evidence of informal work is often seen when workers are misclassified as independent contractors in order for employers to avoid checking work authorization or paying payroll taxes. Informal work is also found when workers are paid in cash, experience wage theft, lack basic training, or experience job instability and irregularity. WORK IN THE SHADOWS More than a third of Houston s construction workers labor in the shadows, according to responses from participants in Build a Better South. Thirty-eight percent of Houston workers are misclassified as independent contractors. This figure closely matches previous research conducted about misclassification in Texas construction industry, which estimated that 37% of workers are misclassified, costing the state $1.2 billion in payroll taxes annually. 33 Employee misclassification was identified as the biggest threat in the construction industry by a large Houstonarea construction company employer, claiming that misclassification undercuts businesses that offer benefits and training to their employees and drive local wages downward. The employer said that contractors who misclassify employees are absolutely devastating the good contractors and subcontractors in construction. Employers who misclassify their employees can place much lower bids on available projects since they do not pay for payroll taxes, workers compensation premiums, training, or employment benefits, setting the bar so low that companies who follow the rules cannot compete on project bids. Widespread misclassification of employees as contractors can have a tremendous effect on the availability of benefits, trainings, and workers compensation. This effect was evident among BUILD A BETTER SOUTH 33
50 all Houston construction workers: only 38% have workers compensation coverage and just 35% are offered medical insurance. Forty percent of Houston workers have no employment benefits of any kind. Other evidence of informal work was found in the Houston labor force. One in five workers are paid cash or in debit cards. Eighty-two percent of Houston s construction workers lack any kind of formal craft training and many workers lack even the most basic of safety equipment: one in four workers report that their employer does not provide hard hats or gloves. Informal workers in Houston have little to no social or legal protection in the event of sudden layoffs, a workplace injury, or nonpayment of wages. These workers fill essential roles in Houston s economy, but they labor on a social cliff - a relatively minor event, such as a broken arm, could send them downwards into poverty and debt for months or years. Interviews with Houston construction workers who labor in the informal economy described the devastating effects of workplace injuries on informal workers. Israel, a Nicaraguan residential construction worker we interviewed described a time when he broke his leg after several sheets of drywall fell on his lower body. He had to receive medical care in the emergency room, and later needed expensive care from specialists. He later learned that the company he worked for did not have workers compensation, and all of the costs of medical care fell on him and his family. After he sought out a lawyer to help him recover some of these costs, he learned that he had been misclassified as an independent contractor, and the company was shirking itself of all responsibility for his injury. How could I be a subcontractor? he asked the lawyer. How can I be a subcontractor if I work for another person and they pay me by the hour. I don t have any tools, they provide all the tools. They provide everything. Two years after his injury, Israel continues to struggle with medical debt and has repeatedly tried to a find lawyer to take his case without success. The entire financial, emotional, and legal burdens from the workplace injury were placed solely on him and his family. HEAT STRESS IN THE TEXAS TROPICS Many Houston construction workers labor in poor working conditions in temperatures over 100 degrees, another major issue that emerged among research participants in Houston. Heat-related illnesses in the workplace are an issue throughout the South, but Houston s humid subtropical climate places construction workers in Houston at particularly high risk. Heat indices in August average 107 degrees Fahrenheit, and workers who labor in direct sunlight experience temperatures 15 degrees hotter than the ambient temperature. 65 In 2015, five Houston workers died from heat-related illnesses, a disproportionately high number given that the U.S. Occupational Safety and Health Administration (OSHA) only investigates approximately heatrelated deaths per in workplaces nationwide. 36,124 Construction workers in Houston frequently labor in OSHA s high and extreme risk levels for heat-related illnesses. When the heat index is between degrees Fahrenheit, OSHA recommends training workers, modifying work schedules, increasing rest times, and physically checking workers for signs and symptoms of heat-related illnesses. 125 When the heat index is over 115 degrees, OSHA recommends rescheduling all non-essential work for times when the temperature is cooler, such as early in the morning. Strenuous labor, heavy workloads, and laboring in direct sunlight all add to the risk of developing a heatrelated illness, even in lower temperatures. Deaths from heat stress are some of the most preventable, as workers simply need time to acclimate to the environment, and regular rest breaks with shade and water. No high-tech expensive equipment is required, and it does not require extensive knowledge for the employer. The basic prevention measures of rest, shade, and water are so simple, yet many workers in the Build a Better South reported that they lacked these basic prevention measures in their workplaces. A lack of short rest breaks is common in Houston, as more than a third (35%) reported that they did not receive any rest breaks during the past work week. Thirty-two percent of Houston construction workers have to provide their own drinking water, and an additional 2% report that no water was available at all on their worksite. Among the workers who had no breaks during the past week, 33% have to provide their own water and an additional 4% said that water is not available at their worksite. Houston construction workers report physical effects from the heat as well. Workers were surveyed during July and August, two of the hottest months of the year. During this time, 17% of workers had to stop working at some point in the past month because they felt sick from the heat. Sixty percent 34 BUILD A BETTER SOUTH
51 of workers describe their work environment as very hot and very humid. Sixty-one percent of workers do five or more hours of heavy physical labor each day, increasing their risk for heat-related illnesses. Houston construction workers have the highest risk of heat stress based on a six-point scale in the Build a Better South survey, making access to drinking water, shade, and rest extremely critical to the health and well-being of construction workers in this city. MIAMI, FLORIDA Miami is an iconic Southern city that is well known for its climate and its culture. Much of Miami s unique culture has been shaped by immigrants: Miami has the highest percentage of foreign-born residents than any other major city in America, as more than half of its residents are foreign-born. 10 Half a million people reside in Miami proper, and more than 6 million live in its metro area. Miami s Latino population is primarily Cuban, as well as Central American, compared to the predominately Mexican communities found in Texas, Arizona, or Southern California. 126 Large numbers of Colombians, Nicaraguans, Venezuelans, and Hondurans also call Miami home, and the diversity of the Latino population has been increasing in recent years. 127 MIAMI CONSTRUCTION INDUSTRY Construction is one of Miami s largest and most valuable industries, but it has also proved to be one of the least stable. Prior to the recession, Miami s housing market was booming, with over 45,000 housing units under construction in Ten years later, the construction of single family homes was down by 68% and the construction of all residential units was down by 49%. 128 Even though Miami s construction industry has not yet recovered to prerecession levels, the industry is showing signs of strong recovery, and retail and commercial projects are increasing rapidly. 129 Miami s population is growing, and urban renewal projects are underway throughout Miami s urban core. More than 1.4 million square feet of retail construction projects are planned through 2018, and Florida s largest construction project in history recently broke ground in Miami. 130 New construction projects are, in many ways, good news for Miami construction workers. Yet Miami construction workers rarely earn a living wage to match the city s cost of living. Miami workers surveyed in Build a Better South frequently reported that economic hardships were commonplace, and many had difficulty paying rent or buying food. Miami s rental market is one of the least affordable in the country, and the condos and apartments Miami construction workers build are largely out of reach for the workers and their families. A recent New York Times article on Miami s housing market claimed that while there is evidence of saturation in the market for high-end condominiums, developers see profit in redirecting their sights toward buyers in lower income brackets and then provided the example of a project underway that would provide 860 square foot apartments for $400,000, a price far out of reach for working class residents. 129 Miami s construction workers are unlikely to enjoy the fruits of their labor. SOCIOECONOMIC ISSUES IN MIAMI Poverty is a pervasive issue in Miami, and Miami s poverty stands out even in the largely impoverished southeastern U.S. Nearly a third of Miami households earn less than $25,000 a year, and Black and Latino households earn about half of what non-latino White households earn. 131 The median household income for all Miamians is one of the lowest in the Nation at $41,900 a year, even though the median rent in Miami-Dade County is one of the highest in the nation at $1,800 a month for a one-bedroom apartment 131,132 Miami s economy, which relies heavily on tourism and housing, suffered a huge blow during the Great Recession and thousands of jobs that paid a living wage disappeared. Unemployment is now much lower than it was in 2008, but the majority of the middle-income jobs lost were replaced by lowwage positions. Even though unemployment is down, the poverty rate in Miami is still as high as it was in the middle of the recession. 133 Despite a high cost of living, many of Miami s low-wage workers earn lower than the average wage in the U.S. The maids and housekeepers who service Miami s hotels earn $10.30 an hour compared to the average wage of $11.05 an hour of housekeepers nationally. 134 Construction laborers, who build Miami s condominiums and luxury apartments, earn an average of just $14.11 an hour compared to the national average of $17.57 an hour. 134 BUILD A BETTER SOUTH 35
52 MIAMI S WORKING POOR IN THE CONSTRUCTION INDUSTRY Miami construction workers have not escaped the city s widespread problems with poverty. Nearly half (44%) of Miami construction workers in Build a Better South said they had trouble paying rent, paying for medical care, buying food, paying for utilities, or supporting their families in the last 12 months. Nearly one in ten workers had difficulty affording all of the above, and a third of workers had trouble with affording more than one basic necessity. Difficulty with purchasing food and paying for utility bills was the most commonly-cited economic issue, followed closely by difficulty in paying for medical care. Economic hardships are disproportionately experienced by Black and Latino workers, and by workers employed on commercial construction projects (as compared to those on residential or heavy construction projects). Undocumented workers and workers with temporary work visas also disproportionately experience economic hardships. The most common reasons cited for experiencing an economic hardship were insufficient wages (30%) and irregular work (26%). Insufficient wages were frequently found in the wage information reported by Miami construction workers. Miami workers earn a median of $14.00 per hour (mean of $14.77), and earn median weekly earnings of $ These wages are better than the wages found in housekeeping or food service, but pale in comparison to the cost of living in Miami. 134 Miami construction workers support a median of two dependents in their household in addition to themselves, and according to the Massachusetts Institute of Technology, a living wage for a Miami worker with two dependents ranges from $22.72 per hour to $28.92 an hour. 135 To live comfortably, some estimate that a family would need an income of more than $77,000 in Miami, or approximately $37 per hour. 22 Irregular work is also commonplace among Miami construction workers, as 23% of workers had missed a day of work in the past week. Less than a third of Miami workers have paid time off, meaning that anytime a worker is sick or needed time off, the majority of workers would lose wages for the day. Paying for medical care was a commonly reported financial burden, an unsurprising finding given that only half (50%) of Miami construction workers are offered health insurance by their employer, and less than a third (31%) are actually enrolled in their employer s health insurance plan. B U I L D A B E T T E R S O U T H S U R V E Y F I N D I N G S : MIAMI, FL OVERVIEW OF MIAMI PARTICIPANTS: MEDIAN AGE: 37 GENDER: 99% MALE, 1% FEMALE RACE/ETHNICITY: 12% BLACK, 65% LATINO, 7% WHITE, 1% AMERICAN INDIAN/ALASKAN NATIVE, 1% ASIAN, 16% MULTIPLE RACES HIGH SCHOOL OR ABOVE: 77% COUNTRY OF ORIGIN: 25% U.S., 7% MEXICO, 33% CARIBBEAN COUNTRIES, 28% CENTRAL AMERICAN COUNTRIES, 6% SOUTH AMERICAN COUNTRIES INDUSTRY SECTOR BREAKDOWN: 41% COMMERCIAL BUILDINGS 37% RESIDENTIAL BUILDINGS 22% HEAVY CONSTRUCTION Political and economic leaders in Miami have often looked to the city s construction industry to lead job growth and power the local economy, but there is little evidence that the industry is investing in its workforce in significant ways. If Miami is going to combat its pressing poverty issues, leaders and policy makers must begin by ensuring that the city s construction workers earn a living wage. Miami s living wage ordinance of a minimum of $12.83 per hour plus health benefits or $14.69 without benefits for businesses contracted by the city is an excellent start, but these wages fail to meet the guidelines for a living wage for many workers in Miami and only apply to a small fraction of the construction workforce. 136 CHEATING WORKING FAMILIES: PAYROLL FRAUD IN MIAMI To live comfortably, some estimate that a family would need an income of more than $77,000 in Miami, or approximately $37 PER HOUR. Misclassifying workers as independent contractors instead of employees is a common practice in many low-wage industries, including construction. 36 BUILD A BETTER SOUTH
53 Misclassified workers do not have control over their schedules or tools as true contractors do, but they are often paid in cash and must pay their own payroll taxes like contractors. One in four (26%) construction workers in Miami are misclassified as contractors, a figure based on the percentage of employees who report that they were given a 1099 tax form by their employer or do not have taxes taken out of their wages. Misclassified workers experience far more labor rights violations than correctly classified workers. Twice as many misclassified workers had experienced wage theft than correctly classified workers (11% v. 6%). Only 40% of misclassified workers are paid time and a half for overtime hours compared to 89% of correctly classified workers in Miami. Misclassified workers lack even basic protections, such as the provision of drinking water. Sixty-eight percent of misclassified workers have to bring their own water to work, compared to just 31% of correctly classified workers. Misclassification hurts both employees and their communities. Employee misclassification is often referred to as payroll fraud, because employers have the same control over their employees without the financial burden of payroll taxes or workers compensation. A recent investigation of federal housing construction projects in Florida found that 15% of construction workers were misclassified and that the state of Florida was losing $400 million a year in lost payroll taxes, assuming the rest of the industry had a similar misclassification rate. 137 Responses in the Build a Better South survey suggested these figures could be much higher. NASHVILLE, TENNESSEE Nashville, also known as Music City, is experiencing a significant economic boom drawing new residents at the rate of 85 people a day, due to the growth of the tourism and hospitality, construction, healthcare and technology industries. 138 An estimated 650,000 people reside in the Nashville metro area, 28% of whom are African American, 56% are White, 10% are Latino and 3% are Asian. 139 Nashville is also home to a growing immigrant and refugee population, who are reshaping the culture of a city located in a predominantly Anglo state. The county seat of Nashville (Davidson County) receives more than half of all of Tennessee s refugees, the majority of whom originate from Iraq, Somalia, Bhutan, and Burma. 140 NASHVILLE CONSTRUCTION INDUSTRY Nashville s construction growth has drawn national attention. Numerous large hotel and residential projects totaling more than $2 billion were underway in 2015, largely driven by increased tourism and younger singles and couples moving to the city. 141 Tennessee s building boom has caused severe labor shortages as in many other cities in the South, driving up labor costs and contributing to increasing rent rates in Nashville. 5 The state is experiencing a large disparity between the number of workers retiring out of construction and the number of workers entering the industry. The disparity is so severe that industry associations launched a campaign to attempt to attract new workers to the industry. 142 The tight labor market has caused Tennessee contractors to respond in many different ways, some of which are reflected in the Build a Better South findings for Nashville. According to the Associated General Contractors of America (AGC), 90% of Tennessee contractors reported having difficulty in finding enough skilled workers. 143 Increasing use of temporary workers or subcontractors and hiring workers from other states were commonly reported in the AGC survey. In November 2015, voters in Nashville- Davidson County approved Charter Amendment 3, requiring contractors to hire local residents and address the local industry s labor shortages, however it was preempted by the state legislature shortly after. 144 Data from the Tennessee Department of Labor indicates that the spike in construction has led to increased injuries and fatalities on construction sites throughout the state. In past years, only about 8% of workplace deaths in Tennessee have occurred on construction sites, but during the first half of 2016 more than 50% of fatalities at work happened on a construction site. 145 The majority of these construction deaths occurred in the Nashville and its surrounding area. 146 The increased prosperity experienced by the construction industry has not translated into safer conditions for workers. SOCIOECONOMIC ISSUES IN NASHVILLE One of the most pressing issues facing Nashville residents is access to affordable housing. Despite the growing housing supply, rents and housing prices are increasing rapidly, forcing lower-income families out BUILD A BETTER SOUTH 37
54 of Nashville and into suburban or rural areas. A recent study by Vanderbilt University found that the burdens of housing costs were extremely high for low- and moderate-income renters, and rapid gentrification of low-income neighborhoods was decreasing the racial diversity of Nashville. 147 Nashville home prices soared by 14% in just one year, from 2016 to 2017, a trend that has been occurring for several years. 148 Part of Nashville s housing crisis is that supply is not keeping up with demand, especially for lower-priced homes and apartments, but a larger issue is that investors are able to purchase large numbers of properties that are then rented out for either long-term or short-term rentals. 149 This limits the number of units available to people who want to live in the home, which worsens Nashville s supply problems. Furthermore, city council members in Nashville cannot enact rent control ordinances due to state laws that preempt them from doing so. 149 LABOR SHORTAGES AND THE USE OF TEMPORARY WORKERS The effects of the labor shortages reported by the AGC were found in multiple responses to Build a Better South survey questions in Nashville. One of the most evident was the widespread use of workers from temporary staffing agencies, which provide construction employers with a more formalized day labor workforce. Nearly one in five (18%) of Nashville workers obtained their current job through a temporary staffing agency, and 24% of workers have used a temporary agency for construction work in the past 12 months. The large percentage of temporary workers on Nashville construction sites is alarming due to the multiple labor rights issues that have been documented extensively in the temporary staffing industry, ranging from racial discrimination to low wages to increased injury rates. Health and safety is a key concern for temporary workers, who often lack training for each industry they work in. Temporary workers experience higher injury rates due to constantly changing work environments and poor access to training, an issue that is particularly concerning in an industry like construction that already has elevated injury rates. Research has found that temporary workers experience injuries at twice the rate or more of permanent employees. 150 Discrimination based on race and sex has also been found to be widespread in the temporary staffing industry. B U I L D A B E T T E R S O U T H S U R V E Y F I N D I N G S : NASHVILLE, TN OVERVIEW OF NASHVILLE PARTICIPANTS: MEDIAN AGE: 36 GENDER: 93% MALE, 6% FEMALE RACE/ETHNICITY: 12% BLACK, 48% LATINO, 34% WHITE, 4% AMERICAN INDIAN/ALASKAN NATIVE, 2% MULTIPLE RACES HIGH SCHOOL OR ABOVE: 70% COUNTRY OF ORIGIN: 50% U.S., 26% MEXICO, 22% CENTRAL AMERICAN COUNTRIES, 1% EUROPEAN COUNTRIES, <1% CARIBBEAN COUNTRIES, <1% SOUTH AMERICAN COUNTRIES INDUSTRY SECTOR BREAKDOWN: 48% COMMERCIAL BUILDINGS 40% RESIDENTIAL BUILDINGS 10% HEAVY CONSTRUCTION An investigation into the practices of temporary staffing agencies in six southern states found that businesses would request workers of a particular sex or a particular race, requests that temporary agencies readily complied with. 151 African American workers were frequently discriminated against, and were often excluded from job opportunities because of their race. SAFETY OPTIONAL: NASHVILLE S INJURED WORKERS Construction is one of the most dangerous industries for workers, and Nashville s construction industry is no exception. Injury rates in all six research cities were significantly higher than the rates reported by OSHA for the construction industry, but Nashville s injury rate was alarmingly high. According to responses collected in Nashville for 18% of Nashville workers obtained their current job through a temporary staffing agency, and 24% of workers have used a temporary agency for construction work in the past 12 months. 38 BUILD A BETTER SOUTH
55 If I wasn t wearing a hard hart, I m sure I would have been killed Most of that day is still fuzzy to me, but what I do remember is no ambulance was called, the accident was not reported to OSHA, and the foreman told me the next day to get back to work, which I did because I couldn t afford not to work. Stephon Eckles, REBAR WORKER, Nashville, TN Stephon Eckles, a rebar worker in Nashville, publicly told his story of a serious workplace injury that occurred in He was struck on the head by a metal jack that plummeted more than two stories. Used with permission from the Ironworkers Local #492 the Build a Better South survey, nearly one in four workers (24%) have experienced a workplace injury at some point in their career, making workplace injuries a common occurrence during a worker s career. Ten percent of workers have been injured on a Tennessee construction site just in the past year. Some workers had been injured multiple times in the past year, equating to an injury rate of 12.7 injuries for every 100 workers, a figure four times higher than the injury rate reported by OSHA. 152 Nearly 1 in 4 workers have experienced a workplace injury at some point in their career, making workplace injuries a common occurrence during a worker s career. Among workers who had been injured during the past year, just 19% reported that workers compensation covered the medical bills for their injury. An additional 38% said that their employer paid for at least part of the medical bills through some other mechanism, but 19% of injured workers paid for the medical bills out of their own pocket. The fact that fewer than one in five injured workers in Tennessee had their medical bills covered by workers compensation is troubling given the fact that all construction employers with one or more employees in the state are legally required to be covered by a workers compensation insurance policy. 53 Access to safety training and safety equipment in good condition are some of the key factors in preventing injuries or fatalities on construction sites, but almost 26% of workers reported never having a safety meeting on the job, and many reported that their employers do not provide basic safety equipment. The provision of safety equipment is required by law when the equipment is required for the task (i.e., fall protection for working at heights). 153 In Nashville, a significant portion of the workforce report that they are not provided with the following basic safety equipment when it is required by the task: Protective Eyewear (36%) Harness or other fall protection (36%) Hardhats (32%) Gloves (29%) Fewer than 1 in 5 injured workers in Tennessee had their medical bills covered by workers compensation BUILD A BETTER SOUTH 39

56
57 R E C O M M E N D AT I O N S Based on the findings from Build a Better South, action is urgently needed from policymakers and construction industry leaders to address persistent workplace problems in the industry and to ensure that existing labor shortages do not worsen as the demand for construction grows. Industry leaders and policymakers can improve the long-term prosperity of the construction industry by ensuring that workers are paid fairly, receive benefits, have safe worksites, and receive the training they need to fulfill their job duties. Build a Better South indicates that good jobs are attainable in the construction industry, and that one in five workers earns a decent wage, receives safety training, and is offered medical insurance or a workers compensation policy. But four out of five jobs are substandard. We offer a set of recommendations for policymakers and best practices for industry leaders to improve working conditions and ensure that all construction workers prosper as the industry grows. ROLE OF GOVERNMENT IN INVESTING IN A HIGH-ROAD CONSTRUCTION INDUSTRY Policymakers at the local, state, and federal levels are positioned to ensure safe, fair, and equitable working conditions for construction workers by enacting policies to improve working conditions, reward good business practices, and enforce employment laws. Government bodies at the state and local levels also have the opportunity to ensure the creation of good jobs in exchange for tax incentives and other subsidies to companies. Policymakers should focus on the following areas to ensure the creation of good jobs: Guarantee safe working conditions. More must be done to address the disproportionately high fatality and injury rates in the southern construction industry. Government agencies can partner with workers rights organizations, unions, and responsible businesses to conduct targeted safety sweeps at construction sites to ensure safe worksites. Furthermore, policymakers should enact policies guaranteeing rest breaks, workers compensation, basic safety training, and medical care for construction workers. Ensure honest pay for honest work. Wage theft, payroll tax fraud, and low wages threaten the construction industry by hurting working families and undercutting construction businesses that play by the rules. In addition to strong enforcement of existing wage and hour laws, policymakers can take important steps to reward good business practices. Employers who pay a living wage, provide medical insurance, offer opportunities for career advancement, and provide retirement benefits for their workers should be rewarded for their smart business strategies by weighting these elements when comparing bids on public projects, rather than just contracting with the lowest bidder. Investigative agencies should enforce employment laws governing wages and payroll tax fraud and provide protection from retaliation for workers who report violations. Create good jobs with career pathways. Most construction jobs lack employment benefits and opportunities for advancement, and today, few young people see the industry as desirable place to seek employment. For the South s long-term economic prosperity, policymakers must ensure that these blue-collar jobs are a gateway into the middle class. A basic benefits package should be offered to the vast majority of construction workers rather than to just a small minority. The basic benefits package should include paid time off or paid sick time and access to a retirement or pension plan. All workers should be covered by a workers compensation insurance policy. Additionally, we must do more to invest in workforce development and bilingual training programs to ensure a well-trained workforce and avoid a shortage of skilled workers in a sector that is vital to the region s economy. Investing in pre-apprenticeship and apprenticeship programs that have a proven track record of training skilled workers and are designed to provide both classroom instruction and on-the-job training can prepare workers for lifelong careers. BUILD A BETTER SOUTH 41
58 Improve enforcement of existing policies. Most of the employment rights issues, as well as the health and safety issues faced by construction workers are already addressed by existing laws, but enforcement is often weak or non-existent. State and federal policymakers should increase funding and improve the efficiency of local agencies to enforce laws that protect workers from wage theft, employee misclassification, hazardous conditions, and retaliation for raising concerns about workplace issues. Local municipalities should have the ability to raise standards above federal or state requirements to improve the lives of residents and to respond to regional needs. Policymakers should also partner with community organizations to improve the efficiency and effectiveness of existing enforcement efforts. INDUSTRY LEADERS: ENSURING A SUSTAINABLE WORKFORCE FOR THE FUTURE Business leaders in construction have the opportunity to create good construction jobs by ensuring safe and fair working conditions. Industry leaders can also develop profitable business models that invest in their workforces and local communities, taking corporate responsibility to the next level. Additionally, real estate developers are uniquely positioned to set standards for all contractors and subcontractors operating on their worksites. Prioritize safety. Construction supervisors play a critical role in creating safe conditions on construction sites. Contractors should require supervisors to take the OSHA 30 training course and empower them to make safety a priority. Contractors must also create safer conditions on their sites through safety planning that is integrated into construction planning, including scheduled rest times during periods of extreme heat. All workers need safety training, proper equipment, rest breaks, and access to workers compensation insurance. Employers should provide at least the OSHA 10-hour safety training for all employees and provide ongoing site-specific health and safety training throughout the year. Workers should also be able to report hazards without fear of retaliation. Invest in training. Employers must see training as a necessary investment that helps ensure workers are able to produce a quality finished product, prevent accidents, and provide opportunities to advance in the industry. Construction is skilled work, and employers must ensure that their employees have access to training programs that couple classroom instruction with on-the-job training. Additionally, developers can set targets to promote training and reward employers that invest in workforce development. Partnerships among construction employers and associations, education agencies, and local governments can help create training pipelines where jobseekers learn the skills they need to fill labor shortages in the industry. Formal training can play a key role in improving the quality of construction jobs, and help offset the construction labor shortages experienced by construction employers throughout the South. Subcontract for quality. Developers and general contractors should take into account subcontractor reputation and experience with regard to safety, rest breaks, wages, training, and benefits when establishing contracting relationships. Contractors can prequalify sub-contractors to bid based on these positive factors before taking the lowest bid. Additionally, the cost of safety items, such as fall-protection equipment, can be taken out of the bid and paid for separately, which will help encourage companies who have not yet invested in safety equipment to do so. General contractors have a responsibility to ensure safe and dignified working conditions on their sites and address whatever employment violations that arise. For developers, the bottom line must also include the human costs associated with working in the construction industry. 42 BUILD A BETTER SOUTH
59 R E F E R E N C E S 1. US Department of Commerce, B. E. A. Bureau of Economic Analysis total full time and part time employment by industry. Available at: cs&7025=4&7026=06007,06011,06021,06101,06115&7027=2015&7001=711&7028=-1&7031=06000&7040=- 1&7083=levels&7029=33&7090=70 (Accessed: 18th January 2017) 2. US Department of Commerce, B. of E. A. GDP in current dollars [table]. Available at: =70&step=1#reqid=70&step=10&isuri=1&7003=800&7035=-1&7004=nai cs&7005=1,11&7006=00000,12000,13000,37000,47000,48000&7036=1&7001=1800&7002=1&7090=70&7007=2015,2014,2013,201 2,2011,2010,2009,2008,2007&7093=levels. (Accessed: 14th October 2016) 3. What Is the Normal Profit Margin in Construction? Sapling.com Available at: (Accessed: 6th February 2017) 4. U.S. Department of Labor & Bureau of Labor Statistics. Fatal occupational injuries in Quint, R. What s the Average Profit Margin of Single-family Builders? Eye On Housing (2016). Available at: eyeonhousing.org/2016/03/whats-the-average-profit-margin-of-single-family-builders/. (Accessed: 6th February 2017) 6. US Department of Commerce, B. of E. A. Total full-time and part-time employment by industry. Available at: &7024=naics&7033=-1&7025=4&7026=37119&7027=2015&7001=711&7028=-1&7031=37000&7040=-1&70-83=levels&7029=33&7090=70. (Accessed: 11th January 2017) 7. U.S. Department of Labor & Bureau of Labor Statistics. Census of Fatal Occupational Injuries, Available at: (Accessed: 6th February 2017) 8. Interactive: The Unequal States of America. Economic Policy Institute 9. Some cities are still more unequal than others an update Brookings Institution. Brookings (2015). 10. Population estimates, July 1, 2016, (V2016). Available at: // (Accessed: 15th March 2017) 11. Autor, D. & others. The polarization of job opportunities in the US labor market: Implications for employment and earnings. Cent. Am. Prog. Hamilt. Proj. (2010). 12. Goldin, C. & Katz, L. F. Long-Run Changes in the U.S. Wage Structure: Narrowing, Widening, Polarizing. (National Bureau of Economic Research, 2007). 13. Irregular Work Scheduling and Its Consequences. Economic Policy Institute 14. Autor, D. H., Dorn, D., Hanson, G. H. & Song, J. Trade Adjustment: Worker-Level Evidence. Q. J. Econ. 129, (2014). 15. Autor, D. H. & Houseman, S. N. Do Temporary-Help Jobs Improve Labor Market Outcomes for Low- Skilled Workers? Evidence from Work First. Am. Econ. J. Appl. Econ. 2, (2010). 16. Odeh, A. M. & Battaineh, H. T. Causes of construction delay: traditional contracts. Int. J. Proj. Manag. 20, (2002). 17. Kirkham, C. Luxury Home Sales in U.S. Continue to Rise. Wall Street Journal (2016). 18. What, Exactly, Is Gentrification? Available at: gov-gentrification-definition-series.html. (Accessed: 7th February 2017) 19. Gentrification in America Report. Available at: gentrification-in-cities-governing-report.html. (Accessed: 6th February 2017) 20. Nashville Gentrification Maps and Data. Available at: nashville-gentrification-maps-demographic-data.html. (Accessed: 6th February 2017) 21. Director, M. W. T. P. C. T. Household Expenditures and Income. Available at: (Accessed: 6th February 2017) 22. Munzenrieder, K. To Live Comfortably in Miami, You Need to Make $77,057 ($46K More Than the Median Income). Miami New Times (2016). Available at: (Accessed: 9th January 2017) 23. American Community Survey, estimates [analysis conducted by Workers Defense Project]. (2016). 24. Construction Laborers. Available at: (Accessed: 31st March 2017) 25. Miami-Miami Beach-Kendall, FL Metropolitan Division - May 2015 OES Metropolitan and Nonmetropolitan Area Occupational BUILD A BETTER SOUTH 43
60 Employment and Wage Estimates. Available at: (Accessed: 31st March 2017) 26. Houston-The Woodlands-Sugar Land, TX - May 2016 OES Metropolitan and Nonmetropolitan Area Occupational Employment and Wage Estimates. Available at: (Accessed: 31st March 2017) 27.!important;}}, {#pmad-byline-frame{width:620px!important; Height:120px. The 11 most expensive cities in America. Business Insider Available at: (Accessed: 31st March 2017) 28. The Center for Construction Research and Training. Retirement plans in construction and other industries In The construction chart book. 29. The Center for Construction Research and Training. Health insurance coverage in construction and other industries In The construction chart book. 30. Waren, W. Wage Theft Among Latino Day Laborers in Post-Katrina New Orleans: Comparing Contractors with Other Employers. J. Int. Migr. Integr. 15, (2014). 31. University of Texas at Austin Division of Diversity and Community Engagement & Workers Defense Project. Build a Better Texas. (2013). 32. Canak, W. Misclassified Construction Employees in Tennessee. EPRN 0, (2015). 33. M, Locke, y & Ordoñez, F. Contract to cheat: Taxpayers, workers hurt by cost-cutting labor violations. mcclatchydc Available at: (Accessed: 9th January 2017) 34. Pinto, A., Nunes, I. L. & Ribeiro, R. A. Occupational risk assessment in construction industry Overview and reflection. Saf. Sci. 49, (2011). 35. Commonly Used Statistics Occupational Safety and Health Administration. Available at: (Accessed: 6th February 2017) 36. OSHA s Campaign to Prevent Heat Illness in Outdoor Workers Heat Fatalities [Map] Occupational Safety and Health Administration. Available at: (Accessed: 8th March 2017) 37. Flynn, M. et al. Overlapping Vulnerabilities: The Occupational Health and Safety of Young Immigrant Workers in Small Construction Firms. (National Institute of Occupational Safety and Health). 38. Roelofs, C., Sprague-Martinez, L., Brunette, M. & Azaroff, L. A qualitative investigation of Hispanic construction worker perspectives on factors impacting worksite safety and risk. Environ. Health 10, 84 (2011). 39. Rebecca Smith, J. d. Immigrant workers and worker s compensation: The need for reform. Am. J. Ind. Med. 55, (2012). 40. Effects of Safety and Health Training on Work-Related Injury... : Journal of Occupational and Environmental Medicine. LWW Available at: (Accessed: 6th February 2017) 41. UCLA Labor Center Broken Laws, Unprotected Workers. 42. The National Agricultural Workers Survey, Employment & Training Administration (ETA) - U.S. Department of Labor. Available at: (Accessed: 2nd January 2017) 43. Benavides, F. G. et al. Working conditions and health in Central America: a survey of 12,024 workers in six countries. Occup. Environ. Med. 71, (2014). 44. Jarrell, S. B. & Stanley, T. D. A Meta-Analysis of the Union-Nonunion Wage Gap. Ind. Labor Relat. Rev. 44, (1990). 45. Rivera-Batiz, F. L. Undocumented Workers in the Labor Market: An Analysis of the Earnings of Legal and Illegal Mexican Immigrants in the United States. J. Popul. Econ. 12, (1999). 46. Living Wage Calculator. Available at: (Accessed: 6th February 2017) 47. Milkman, R. et al. Wage Theft and Workplace Violations in Los Angeles: The Failure of Employment and Labor Law for Low-Wage Workers. ResearchGate (2010). 48. Juravich, T., Ablavsky, E. & Williams, J. The Epidemic of Wage Theft in Residential Construction in Massachusetts1. (2015). 49. Employer Information State Board of Workers Compensation. Available at: sbwc.georgia.gov/employer-information. (Accessed: 10th April 2017) 50. NC Industrial Commission Information for Employers. Available at: (Accessed: 10th April 2017) 51. Insurance, D. of. system-page-title. ( ). Available at: gov/reports/wcreg/attorney.html. (Accessed: 3rd October 2016) 52. Coverage Requirements. Available at: Employer/coverage.htm#.WOv7WvkrK00. (Accessed: 10th April 2017) 53. Who Must Carry Insurance - TN.Gov. Available at: 44 BUILD A BETTER SOUTH
61 topic/wc-who-must-carry-insurance. (Accessed: 16th March 2017) 54. Status of State Action on the Medicaid Expansion Decision. The Henry J. Kaiser Family Foundation (2017). 55. Lowe, N. & Iskander, N. Power Through Problem Solving: Latino Immigrants and the Inconsistencies of Economic Restructuring. Popul. Space Place n/a-n/a (2016). doi: /psp Two-Thirds of Contractors Have a Hard Time Finding Qualified Craft Workers to Hire Amid Growing Construction Demand, National Survey Finds Associated General Contractors. Available at: two-thirds-contractors-have-hard-time-finding-qualified-craft-workers-hire-amid. (Accessed: 6th February 2017) 57. NAHB: Immigrant Workers in the Construction Labor Force. Available at: aspx?sectionid=734&genericcontentid=241345&channelid=311. (Accessed: 10th October 2016) 58. Iskander, N. & Lowe, N. Building Job Quality from the Inside-Out: Mexican Immigrants, Skills, and Jobs in the Construction Industry. ILR Rev. 66, (2013). 59. CHAPTER, I. T.. Occupational Safety and Health Statistics. Public Law 91, Senate Votes to Repeal OSHA Volks Recordkeeping Rule. The National Law Review Available at: natlawreview.com/article/senate-votes-to-repeal-osha-volks-recordkeeping-rule. (Accessed: 6th April 2017) 61. Waehrer, G. M., Dong, X. S., Miller, T., Haile, E. & Men, Y. Costs of occupational injuries in construction in the United States. Accid. Anal. Prev. 39, (2007). 62. Ruttenberg, R. The economic and social benefits of OSHA-10 training in the building and construction trades. Cent. Constr. Res. Train. CPWR Silver Spring MD (2013). 63. Introduction to OSHA: Instructor Guide. Available at: intro_osha/intro_to_osha_guide.html. (Accessed: 6th April 2017) 64. North America Land Data Assimilation System (NLDAS) Daily Air Temperatures and Heat Index ( ) Request. Available at: (Accessed: 7th February 2017) 65. U.S. Department of Labor & Occupational Safety and Health Administration. Using the heat index: A guide for employers. 66. Sanitation Occupational Safety and Health Administration. Available at: oshaweb/owadisp.show_document?p_table=standards&p_id=202. (Accessed: 7th February 2017) 67. Weather History for Atlanta Fulton, GA Weather Underground. Available at: wunderground.com/history/airport/kfty/2016/7/17/monthlyhistory.html?req_city=atlanta&req_ state=ga&reqdb.zip=30301&reqdb.magic=1&reqdb.wmo= (Accessed: 17th January 2017) 68. Weather History for Charlotte, NC Weather Underground. Available at: com/history/airport/kclt/2016/7/17/monthlyhistory.html?req_city=charlotte&req_state=nc&reqdb. zip=28201&reqdb.magic=1&reqdb.wmo= (Accessed: 17th January 2017) 69. Weather History for Dallas Love, TX Weather Underground. Available at: com/history/airport/kdal/2016/7/17/monthlyhistory.html?req_city=dallas&req_state=tx&reqdb. zip=75201&reqdb.magic=1&reqdb.wmo= (Accessed: 17th January 2017) 70. Weather History for Houston / Dunn Helistop, TX Weather Underground. Available at: wunderground.com/history/airport/kmcj/2016/7/17/monthlyhistory.html?req_city=houston&req_ state=tx&reqdb.zip=77001&reqdb.magic=1&reqdb.wmo= (Accessed: 17th January 2017) 71. Weather History for Miami, FL Weather Underground. Available at: com/history/airport/kmia/2016/7/17/monthlyhistory.html?req_city=miami&req_state=fl&reqdb. zip=33101&reqdb.magic=1&reqdb.wmo= (Accessed: 17th January 2017) 72. Weather History for Nashville, TN Weather Underground. Available at: com/history/airport/kbna/2016/7/28/monthlyhistory.html?req_city=nashville&req_state=tn&reqdb. zip=37201&reqdb.magic=1&reqdb.wmo=99999&mr=1. (Accessed: 17th January 2017) 73. Heat Index Calculation. Available at: (Accessed: 30th November 2016) 74. Report: Metro Atlanta s economy bigger than Iran s. Atlanta Business Chronicle Available at: com/atlanta/news/2014/06/23/metro-atlanta-s-economy-among-the-biggest.html. (Accessed: 15th March 2017) 75. Population estimates, July 1, 2015, (V2015). Available at: // table/pst045215/ (Accessed: 15th March 2017) 76. Development, G. D. of E. African American History in Georgia. Official website of the Georgia Department of Economic Development (2017). Available at: (Accessed: 15th March 2017) 77. Severson, K. Atlanta Emerges as a Black Entertainment Mecca. The New York Times (2011). 78. Atlanta Projects. KNOWAtlanta (2016). 79. TEGNA. Rise up: Officials say Falcons stadium cost is up to $1.6 billion. WXIA Available at: BUILD A BETTER SOUTH 45
62 news/local/rise-up-officials-say-falcons-stadium-cost-is-up-to-16-billion/ (Accessed: 15th March 2017) 80. Fulton, Atlanta transportation taxes appear to win; MARTA... myajc Available at: fulton-atlanta-transportation-taxes-appear-win-marta-approved/xdoaajmboa0ozyqfimholl/. (Accessed: 22nd March 2017) 81. Political fortunes pinned to Atlanta stadium deals for Braves, Falcons. myajc Available at: tale-two-atlanta-stadiums-political-fortunes-rise-fall-deals/y41uyn0xhimnxt4vadrioo/. (Accessed: 15th March 2017) 82. TEGNA. Construction company behind Falcons stadium facing lawsuit. WXIA Available at: news/local/construction-company-behind-falcons-stadium-facing-lawsuit/ (Accessed: 15th March 2017) 83. Murphy, A. Falcons new stadium project drops the ball with minority workers. Available at: story/ /falcons-new-stadium-project-drops-the-ball-with-minority-workers. (Accessed: 15th March 2017) 84. Changing the Odds. The Annie E. Casey Foundation Available at: org/resources/changing-the-odds/. (Accessed: 15th March 2017) 85. Sweeney, K. Suburban Poverty: Atlanta's Hidden Epidemic. Available at: org/post/suburban-poverty-atlantas-hidden-epidemic. (Accessed: 15th March 2017) 86. Din-Dzietham, R., Nembhard, W. N., Collins, R. & Davis, S. K. Perceived stress following racebased discrimination at work is associated with hypertension in African Americans. The metro Atlanta heart disease study, Soc. Sci. Med. 58, (2004). 87. Flows, C. The Law Of Unintended Consequences: Georgia s Immigration Law Backfires. Forbes Available at: (Accessed: 16th March 2017) 88. Brumback, K. 2 years after passing tough immigration laws, Ga., Ala., stable. DeseretNews.com (2013). Available at: deseretnews.com/article/ /2-years-after-immigration-laws-ga-ala-stable.html?pg=all. (Accessed: 16th March 2017) 89. Clapp, J. One School, One Instructor, One Student, You: A Workforce Development Campaign Constructor Magazine. 90. Big urban gains, rural losses in the Carolinas UNC Charlotte Urban Institute. Available at: ui.uncc.edu/story/big-urban-gains-rural-losses-carolinas. (Accessed: 16th March 2017) 91. Off, G. & Stradling, R. Are you 1 in a million? Charlotte s getting there. charlotteobserver Available at: (Accessed: 16th March 2017) 92. From rural Mexico to North Carolina. Available at: (Accessed: 11th January 2017) 93. Latino Education and Workforce 50-State Map. Available at: latino-education-and-workforce-50-state-map.aspx. (Accessed: 11th January 2017) 94. Street, 1615 L., NW, Washington, S. 800 & Inquiries, D M F M. Demographic and Economic Profiles of Hispanics by State and County, Pew Research Center s Hispanic Trends Project (2011). 95. Portillo, E. When will that place finally open? A roundup of Charlotte s latest wave of development. CharlotteFive (2016). 96. Needed now and in the next decade: Electricians, roofers, plumbers. mcclatchydc Available at: mcclatchydc.com/news/nation-world/national/article html. (Accessed: 16th March 2017) 97. Profile of the Unauthorized Population - County Data. migrationpolicy.org Available at: org/data/unauthorized-immigrant-population/county/ (Accessed: 16th March 2017) 98. UNC Charlotte Urban Institute. Poverty Snapshot: Mecklenberg County. (2015). 99. NC farmers to Congress: We need foreign workers. charlotteobserver Available at: com/news/state/north-carolina/article html. (Accessed: 16th March 2017) 100. Beyer, S. The Explosive Northern Growth Of Metro Dallas. Forbes Available at: scottbeyer/2016/07/01/the-explosive-northern-growth-of-metro-dallas/. (Accessed: 14th March 2017) 101. Trulia. America s Most Diverse Neighborhoods And Metros. Forbes Available at: com/sites/trulia/2012/11/13/finding-diversity-in-america/. (Accessed: 14th March 2017) 102. U.S. Census Bureau. New privately owned housing units authorized unadjusted units by metropolitan area. (2015). Available at: (Accessed: 14th March 2017) 103. What are the largest DFW construction projects right now? Wade Park and Frisco Station lead the way via Crane Watch. Dallas Business Journal Available at: largest-dfw-construction-projects-crane-watch.html. (Accessed: 14th March 2017) 104. Frisco s $2 billion Wade Park project stuck in slow lane on the tollway Real Estate. Dallas News (2016). Available at: 2-billion-wade-park-project-stuck-slow-lane-tollway. (Accessed: 14th March 2017) 46 BUILD A BETTER SOUTH
63 105. Construction labor shortage not deterring North Texas developers, says CBRE. Dallas Business Journal Available at: bizjournals.com/dallas/news/2016/07/08/cbre-construction-labor-shortage-not-deterring-dfw.html. (Accessed: 14th March 2017) 106. Dallas has the highest child poverty rate among big cities, and city hall isn t sure how to change it Dallas City Hall. Dallas News (2016). Available at: dallas-highest-child-poverty-rate-among-big-cities-city-hall-sure-change. (Accessed: 14th March 2017) 107. Fregonese Associates. Neighborhood Plus: The future of living in our city. (2015) Greater Houston Partnership. Houston metropolitan statistical area profile. (2016) Facts and Figures. Available at: (Accessed: 14th March 2017) 110. Greater Houston Partnership. Population update. (2016) Population estimates, July 1, 2015, (V2015). Available at: // table/pst045215/ (Accessed: 14th March 2017) 112. Wile, R. These Are the 15 Largest U.S. Cities With the Most Foreign Languages Spoken. Fusion 113. Carlyle, E. Building Boom Towns: The Metro Areas With The Most New Construction. Forbes Available at: (Accessed: 14th March 2017) 114. Houston s Outlook for 2017: Is the Worst Behind Us? Available at: uh.edu/centers/irf/houston-updates.php. (Accessed: 14th March 2017) 115. Real Estate Center Building Permits. Available at: (Accessed: 14th March 2017) 116. Ro, S. One Big US Industry Will Be Happy To See Energy Companies Lay Off Workers. Business Insider Available at: (Accessed: 10th April 2017) 117. Sarnoff, N. In building boom, construction workers gain the upper hand. Houston Chronicle Available at: (Accessed: 14th March 2017) 118. Martin, F. Despite Slowdown, Houston Faces Construction Worker Shortage. Houston Public Media (2016). Available at: (Accessed: 14th March 2017) 119. A Construction Worker Shortage Is Weighing on a Hot U.S. Housing Market. Fortune Available at: fortune.com/2016/09/06/housing-construction-worker-shortage/. (Accessed: 14th March 2017) 120. Sixel, L. M. Builders facing labor shortages in Texas, US. Houston Chronicle Available at: com/business/article/builders-facing-labor-shortages-in-texas-us php. (Accessed: 14th March 2017) 121. Tomlinson, C. It s going to take work to end the skilled labor shortage. Houston Chronicle Available at: (Accessed: 14th March 2017) 122. Profile of the Unauthorized Population - County Data. migrationpolicy.org Available at: org/data/unauthorized-immigrant-population/county/ (Accessed: 14th March 2017) 123. Immigration Reform Associated General Contractors. Available at: industry-priorities/labor-hr/immigration-reform. (Accessed: 14th March 2017) 124. Monforton, C., Ojeda, M., Shelton, J. & Perez, C. Worker Memorial Day report 2016: Workplace fatalities in the Houston area. (2016) Occupational Safety and Health Administration & U.S. Department of Labor. Using the heat index: A guide for employers. Available at: (Accessed: 30th September 2016) 126. Brown, A. & Lopez, M. H. Mapping the Latino Population, By State, County and City. Pew Research Center s Hispanic Trends Project (2013) Miami Dade County & Department of Planning and Zoning. Hispanics by country of origin in Miami-Dade. (2011) Real Estate Center Building Permits. Available at: msa/miami-fort_lauderdale-west_palm_beach%2c_fl. (Accessed: 15th March 2017) 129. Madigan, N. Miami Emerges From Gloom Into Residential and Commercial Sunlight. The New York Times (2016) Staff, W. W. Miami Worldcenter, multi-billion dollar development project, breaks ground. WFLA (2016) Miami-Dade County & Department of Regulatory and Economic Resources. Income and poverty in Miami-Dade County: (2015) Miami-Dade s rents are so high, they are quadruple what renters in other cities pay. miamiherald Available at: (Accessed: 15th March 2017) BUILD A BETTER SOUTH 47
64 133. How poor is Miami? The rich earn $40 for every $1 earned by the poor. miamiherald Available at: miamiherald.com/news/local/community/miami-dade/article html. (Accessed: 15th March 2017) 134. U.S. Department of Labor & Bureau of Labor Statistics. Miami area economic summary. (2017) Living Wage Calculator - Living Wage Calculation for Miami-Dade County, Florida. Available at: (Accessed: 15th March 2017) 136. Miami-Dade County. County Code 2-8.9, Living wage for county service contracts. (2016) M, Locke, y & Ordoñez, F. Contract to cheat: Why is worker misclassification a problem? mcclatchydc Available at: mcclatchydc.com/static/features/contract-to-cheat/why-is-misclassification-a-problem.html. (Accessed: 9th January 2017) 138. How many people are really moving to Nashville every day? The Tennessean Available at: opinion/2016/05/01/how-many-people-really-moving-nashville-every-day/ /. (Accessed: 14th March 2017) 139. Population estimates, July 1, 2016, (V2016). Available at: // quickfacts/table/pst045216/47. (Accessed: 14th March 2017) 140. Where are Nashville s international refugees from? The Tennessean Available at: story/news/2014/04/06/nashvilles-international-refugees/ /. (Accessed: 14th March 2017) 141. Schneider, K. Nashville s Skyline Being Reshaped by Building Boom. The New York Times (2015) Nashville s building boom is begging for workers, and this new campaign could fix that. Nashville Business Journal Available at: (Accessed: 14th March 2017) 143. TN construction worker shortage frustrates contractors. The Tennessean Available at: real-estate/2015/09/11/tennessee-construction-worker-shortage-frustrates-contractors/ /. (Accessed: 14th March 2017) 144. Senate passes bill nullifying Nashville local-hire rule. The Tennessean Available at: politics/2016/02/22/senate-passes-bill-nullifying-nashville-local-hire-rule/ /. (Accessed: 22nd March 2017) 145. Tennessee Seeing Spike in Workplace Fatalities - TN.Gov. Available at: (Accessed: 14th March 2017) 146. Sherman, N. Tennessee labor department warns of recent spike in workplace fatalities. WKRN.com (2016) Tennessean), T. G. (The. NashvilleNext Equitable Development study. Available at: org/documents/ nashvillenext-equitable-development-study.html. (Accessed: 14th March 2017) 148. Inc, Z. Nashville TN Home Prices & Home Values. Zillow Available at: zillow.com:443/nashville-tn/home-values/. (Accessed: 14th March 2017) 149. A dilemma for renters in Nashville. The Tennessean Available at: columnists/david-plazas/2017/02/26/dilemma-renters-nashville/ /. (Accessed: 14th March 2017) 150. Larson, M. G., Olga Pierce, Jeff. Temporary Work, Lasting Harm. ProPublica (2013). Available at: (Accessed: 14th March 2017) 151. When companies hire temp workers by race, black applicants lose out. Reveal (2016) State Occupational Injuries, Illnesses, and Fatalities. Available at: bls.gov/iif/oshstate.htm. (Accessed: 6th February 2017) 153. Safety and Health Topics Personal Protective Equipment Occupational Safety and Health Administration. Available at: (Accessed: 16th March 2017) 154. STD Compliance Guidance for Residential Construction Occupational Safety and Health Administration. Available at: (Accessed: 6th April 2017) 48 BUILD A BETTER SOUTH
65 G L O S S A R Y Construction subsectors: The following subsectors are discussed in this report: Commercial building construction: Commercial buildings include those built for non-residential purposes, such as hospitals, stores, restaurants, and schools. Apartment buildings that are four stories or more were also categorized as commercial since these buildings are mid- to highrise structures that likely use steel rather than wood frames. This follows the U.S. Occupational Safety and Health Administration definition that residential buildings are those with frames comprised primarily of wood. 154 Industrial construction projects (power plants, oil and gas structures, etc.) were excluded from this study. Residential building construction: Residential buildings include single-family and multifamily dwellings up to three stories. Heavy construction: Heavy construction projects included horizontal construction, such as roads and bridges, utility lines, sidewalks, internet fiber cable construction, and dock construction. Developer: Designs, creates, and funds commercial construction projects. The developer is the owner of the property. General contractor (GC): Oversees the scheduling and completion of each phase of the construction project. The GC also hires subcontractors for each trade or subspecialty. Homebuilder: Similar to the developer, the homebuilder is the owner of the property on residential construction sites. Homebuilders may also function as the GC. Payroll fraud: Occurs when an employer incorrectly classifies an employee as an independent contractor. The employer does not withhold payroll taxes, and generally does not provide time-and-a-half for overtime hours. Subcontractor: A company that specializes in one construction trade (such as masonry). Subcontractors may directly hire workers to complete the work, or they may hire specialized subcontractors. For example, a masonry subcontractor may hire one company to complete stonework on the exterior of a house and another company to complete tile work on the interior of the house. Trade: The occupation of the construction worker that requires a specialized skill, such as carpentry or roofing. Wage theft: The practice of not paying an employee or subcontractor for their labor. This may occur by simply refusing to pay the worker, or by writing them a bad check. Other forms of wage theft can include not being paid the minimum wage, not paying time-and-a-half for overtime hours, or making illegal deductions of wages. BUILD A BETTER SOUTH 49
66 DEMOGRAPHICS TABLE This table describes demographic characteristics of Build a Better South participants. All results have been weighted by occupation type, race, and city workforce size (see Methodology section for further information). Demographic characteristics of Build a Better South participants (n = 1,435) AGE IN YEARS (MEDIAN, 25TH AND 75TH PERCENTILE) SEX Female Male RACE African American American Indian/Alaskan Native Asian Hawaiian/Pacific Islander Latino White Multiple races LANGUAGE FLUENCY English Spanish Both English and Spanish HIGHEST EDUCATION LEVEL Less than high school High school diploma or GED Associates degree or above Other IMMIGRATION STATUS U.S. citizen Legal permanent resident Visa holder Undocumented Did not report status 36, % 97% 9% 1% 1% <1% 74% 11% 4% 19% 51% 29% 33% 49% 17% 1% 36% 16% 5% 32% 12% Number of dependents in U.S. (median) 2 50 BUILD A BETTER SOUTH
67
68
A Barometer of the Economic Recovery in Our State
 THE WELL-BEING OF NORTH CAROLINA S WORKERS IN 2012: A Barometer of the Economic Recovery in Our State By ALEXANDRA FORTER SIROTA Director, BUDGET & TAX CENTER. a project of the NORTH CAROLINA JUSTICE CENTER
How Have Hispanics Fared in the Jobless Recovery?
 How Have Hispanics Fared in the Jobless Recovery? William M. Rodgers III Heldrich Center for Workforce Development Rutgers University and National Poverty Center and Richard B. Freeman Harvard University
An Equity Profile of the Southeast Florida Region. Summary. Foreword
 An Equity Profile of the Southeast Florida Region PolicyLink and PERE An Equity Profile of the Southeast Florida Region Summary Communities of color are driving Southeast Florida s population growth, and
Representational Bias in the 2012 Electorate
 Representational Bias in the 2012 Electorate by Vanessa Perez, Ph.D. January 2015 Table of Contents 1 Introduction 3 4 2 Methodology 5 3 Continuing Disparities in the and Voting Populations 6-10 4 National
Immigrants and the Direct Care Workforce
 JUNE 2017 RESEARCH BRIEF Immigrants and the Direct Care Workforce BY ROBERT ESPINOZA Immigrants are a significant part of the U.S. economy and the direct care workforce, providing hands-on care to older
STATE OF WORKING FLORIDA
 STATE OF WORKING FLORIDA 2017 The State of Working Florida 2017 analyzes the period from 2005 through 2016 and finds that while Florida s economic and employment levels have recovered from the Great Recession
Children of Immigrants
 L O W - I N C O M E W O R K I N G F A M I L I E S I N I T I A T I V E Children of Immigrants 2013 State Trends Update Tyler Woods, Devlin Hanson, Shane Saxton, and Margaret Simms February 2016 This brief
America is facing an epidemic of the working hungry. Hunger Free America s analysis of federal data has determined:
 Key Findings: America is facing an epidemic of the working hungry. Hunger Free America s analysis of federal data has determined: Approximately 16 million American adults lived in food insecure households
Final Report. Participation of Latino/Hispanic Population in the Food Stamp Program in the South.
 Final Report Participation of Latino/Hispanic Population in the Food Stamp Program in the South. Safdar Muhammad 1 and Fisseha Tegegne Institute of Agricultural and Environmental Research Tennessee State
Hispanic Health Insurance Rates Differ between Established and New Hispanic Destinations
 Population Trends in Post-Recession Rural America A Publication Series of the W3001 Research Project Hispanic Health Insurance Rates Differ between and New Hispanic s Brief No. 02-16 August 2016 Shannon
The National Citizen Survey
 CITY OF SARASOTA, FLORIDA 2008 3005 30th Street 777 North Capitol Street NE, Suite 500 Boulder, CO 80301 Washington, DC 20002 ww.n-r-c.com 303-444-7863 www.icma.org 202-289-ICMA P U B L I C S A F E T Y
Racial Disparities in the Direct Care Workforce: Spotlight on Hispanic/Latino Workers
 FEBRUARY 2018 RESEARCH BRIEF Racial Disparities in the Direct Care Workforce: Spotlight on Hispanic/Latino Workers BY STEPHEN CAMPBELL The second in a three-part series focusing on racial and ethnic disparities
Protecting and Defending Progress in the Old Dominion
 FACT SHEET September 2017 Latinos in Virginia: Protecting and Defending Progress in the Old Dominion Given the Latino community s work ethic and resiliency, they have contributed to Virginia s economic
Part 1: Focus on Income. Inequality. EMBARGOED until 5/28/14. indicator definitions and Rankings
 Part 1: Focus on Income indicator definitions and Rankings Inequality STATE OF NEW YORK CITY S HOUSING & NEIGHBORHOODS IN 2013 7 Focus on Income Inequality New York City has seen rising levels of income
Immigration Policy Brief August 2006
 Immigration Policy Brief August 2006 Last updated August 16, 2006 The Growth and Reach of Immigration New Census Bureau Data Underscore Importance of Immigrants in the U.S. Labor Force Introduction: by
RESEARCH BRIEF: The State of Black Workers before the Great Recession By Sylvia Allegretto and Steven Pitts 1
 July 23, 2010 Introduction RESEARCH BRIEF: The State of Black Workers before the Great Recession By Sylvia Allegretto and Steven Pitts 1 When first inaugurated, President Barack Obama worked to end the
Racial Inequities in Montgomery County
 W A S H I N G T O N A R E A R E S E A R C H I N I T I A T I V E Racial Inequities in Montgomery County Leah Hendey and Lily Posey December 2017 Montgomery County, Maryland, faces a challenge in overcoming
Racial Inequities in Fairfax County
 W A S H I N G T O N A R E A R E S E A R C H I N I T I A T I V E Racial Inequities in Fairfax County Leah Hendey and Lily Posey December 2017 Fairfax County, Virginia, is an affluent jurisdiction, with
Health Disparities (& Health Equity) in the US Workforce
 in the US Workforce") Health Disparities (& Health Equity) in the US Workforce Andrea L Steege National Institute for Occupational Safety and Health Improving Worker Safety and Health among American Indians/Alaska Natives:
Health Disparities (& Health Equity) in the US Workforce Andrea L Steege National Institute for Occupational Safety and Health Improving Worker Safety and Health among American Indians/Alaska Natives:
The New Geography of Immigration and Local Policy Responses
 1 Audrey Singer Senior Fellow The New Geography of Immigration and Local Policy Responses Brookings Mountain West University of Nevada Las Vegas 2 March 9, 2010 The New Geography of Immigration and Policy
The New Geography of Immigration and Local Policy Responses
 1 Audrey Singer Senior Fellow The New Geography of Immigration and Local Policy Responses Brookings Mountain West University of Nevada Las Vegas 2 March 9, 2010 The New Geography of Immigration and Policy
West Virginia Judicial Compensation Commission
 2017 West Virginia Judicial Compensation Commission Gregory Bowman, Chair Dr. Edwin Welch, Member Danny Martin, Member Phillip B. Ben Robertson, Member Virginia King, Member 1900 Kanawha Blvd., East Charleston,
Components of Population Change by State
 IOWA POPULATION REPORTS Components of 2000-2009 Population Change by State April 2010 Liesl Eathington Department of Economics Iowa State University Iowa s Rate of Population Growth Ranks 43rd Among All
Promoting Work in Public Housing
 Promoting Work in Public Housing The Effectiveness of Jobs-Plus Final Report Howard S. Bloom, James A. Riccio, Nandita Verma, with Johanna Walter Can a multicomponent employment initiative that is located
Broken Laws, Workers. etaliation orkers comp. and Labor Laws in America s Cities
 est breaks ff the clock work eal breaks vertime inimum wage ight to organize etaliation Unprotected orkers Workers comp est breaks ff Violations the clock of Employment work eal breaks vertime Broken Laws,
Racial Inequities in the Washington, DC, Region
 W A S H I N G T O N A R E A R E S E A R C H I N I T I A T V E Racial Inequities in the Washington, DC, Region 2011 15 Leah Hendey December 2017 The Washington, DC, region is increasingly diverse and prosperous,
8AMBER WAVES VOLUME 2 ISSUE 3
 8AMBER WAVES VOLUME 2 ISSUE 3 F E A T U R E William Kandel, USDA/ERS ECONOMIC RESEARCH SERVICE/USDA Rural s Employment and Residential Trends William Kandel wkandel@ers.usda.gov Constance Newman cnewman@ers.usda.gov
The Black Labor Force in the Recovery
 Cornell University ILR School DigitalCommons@ILR Federal Publications Key Workplace Documents 7-11-2011 The Black Labor Force in the Recovery United States Department of Labor Follow this and additional
Meanwhile, the foreign-born population accounted for the remaining 39 percent of the decline in household growth in
 3 Demographic Drivers Since the Great Recession, fewer young adults are forming new households and fewer immigrants are coming to the United States. As a result, the pace of household growth is unusually
The Economic Impact of Spending for Operations and Construction by AZA-Accredited Zoos and Aquariums
 The Economic Impact of Spending for Operations and Construction by AZA-Accredited Zoos and Aquariums Prepared for The Association of Zoos and Aquariums Silver Spring, Maryland By Stephen S. Fuller, Ph.D.
Structural Change: Confronting Race and Class
 Structural Change: Confronting Race and Class THE KIRWAN INSTITUTE FOR THE STUDY OF RACE AND ETHNICITY & ISAIAH OHIO ORGANIZING COLLABORATIVE WEEKLONG TRAINING TOLEDO, OH JULY 19, 2010 Presentation Overview
The Economic Impact of Spending for Operations and Construction in 2014 by AZA-Accredited Zoos and Aquariums
 The Economic Impact of Spending for Operations and Construction in 2014 by AZA-Accredited Zoos and Aquariums By Stephen S. Fuller, Ph.D. Dwight Schar Faculty Chair and University Professor Center for Regional
Beyond cities: How Airbnb supports rural America s revitalization
 Beyond cities: How Airbnb supports rural America s revitalization Table of contents Overview 03 Our growth in rural areas 04 Creating opportunity 05 Helping seniors and women 07 State leaders in key categories
Heading in the Wrong Direction: Growing School Segregation on Long Island
 Heading in the Wrong Direction: Growing School Segregation on Long Island January 2015 Heading in the Wrong Direction: Growing School Segregation on Long Island MAIN FINDINGS Based on 2000 and 2010 Census
Annual Flow Report. of persons who became LPRs in the United States during 2007.
 Annual Flow Report MARCH 008 U.S. Legal Permanent Residents: 007 KELLy JEffERyS AND RANDALL MONGER A legal permanent resident (LPR) or green card recipient is defined by immigration law as a person who
The Changing Face of Labor,
 The Changing Face of Labor, 1983-28 John Schmitt and Kris Warner November 29 Center for Economic and Policy Research 1611 Connecticut Avenue, NW, Suite 4 Washington, D.C. 29 22-293-538 www.cepr.net CEPR
STATE OF ENERGY REPORT. An in-depth industry analysis by the Texas Independent Producers & Royalty Owners Association
 STATE OF ENERGY REPORT An in-depth industry analysis by the Texas Independent Producers & Royalty Owners Association About TIPRO The Texas Independent Producers & Royalty Owners Association (TIPRO) is
Refugee Resettlement in Small Cities Reports
 The University of Vermont PR3: Refugee Resettlement Trends in the Southeast REPORT Pablo Bose & Lucas Grigri Photo Credit: L. Grigri Published April 2018 in Burlington, VT Refugee Resettlement in Small
Household Income, Poverty, and Food-Stamp Use in Native-Born and Immigrant Households
 Household, Poverty, and Food-Stamp Use in Native-Born and Immigrant A Case Study in Use of Public Assistance JUDITH GANS Udall Center for Studies in Public Policy The University of Arizona research support
2015 ANNUAL OUTCOME GOAL PLAN (WITH FY 2014 OUTCOMES) Prepared in compliance with Government Performance and Results Act
 Prepared in compliance with Government Performance and Results Act") Administration for Children & Families 370 L Enfant Promenade, S.W. Washington, D.C. 20447 Office of Refugee Resettlement www.acf.hhs.gov 2015 ANNUAL OUTCOME GOAL PLAN (WITH FY 2014 OUTCOMES) Prepared
Administration for Children & Families 370 L Enfant Promenade, S.W. Washington, D.C. 20447 Office of Refugee Resettlement www.acf.hhs.gov 2015 ANNUAL OUTCOME GOAL PLAN (WITH FY 2014 OUTCOMES) Prepared
Illinois low wage laborers working their way into poverty!
 The Problem of Wage Theft and Other Workplace Abuses Illinois low wage laborers working their way into poverty! Chicago Workers Collaborative Latino Union of Chicago Centro de Trabajadores Unidos Working
State of Local and State Government Workers Engagement in the U.S.
 State of Local and State Government Workers Engagement in the U.S. We change the world one client at a time through extraordinary analytics and advice on everything important facing humankind. JIM CLIFTON,
Enforcement of a $15 Minimum Wage in Minneapolis Requires Strategic Community Partnerships
 FACT SHEET AUGUST 2017 Enforcement of a $15 Minimum Wage in Minneapolis Requires Strategic Community Partnerships Approximately 42 percent of workers in America earn under $15 per hour. 1 In Minneapolis,
LEFT BEHIND: WORKERS AND THEIR FAMILIES IN A CHANGING LOS ANGELES. Revised September 27, A Publication of the California Budget Project
 S P E C I A L R E P O R T LEFT BEHIND: WORKERS AND THEIR FAMILIES IN A CHANGING LOS ANGELES Revised September 27, 2006 A Publication of the Budget Project Acknowledgments Alissa Anderson Garcia prepared
Le Sueur County Demographic & Economic Profile Prepared on 7/12/2018
 Le Sueur County Demographic & Economic Profile Prepared on 7/12/2018 Prepared by: Mark Schultz Regional Labor Market Analyst Southeast and South Central Minnesota Minnesota Department of Employment and
Migration Patterns in New Gateways of Texas The Innerburbs
 A resident of Wooten Park, Veronica moved from Ft. Worth to Austin to be close to friends and family. Migration Patterns in New Gateways of Texas The Innerburbs Pamela A. Rogers, Ph.D. Low-Income Housing
STATE OF WORKING FLORIDA
 STATE OF WORKING FLORIDA 2018 The Future Workforce The 15th edition of the State of Working Florida reviews recent changes in Florida s economy and their potential impacts on the future workforce. This
An Equity Assessment of the. St. Louis Region
 An Equity Assessment of the A Snapshot of the Greater St. Louis 15 counties 2.8 million population 19th largest metropolitan region 1.1 million households 1.4 million workforce $132.07 billion economy
Post-Secondary Education, Training and Labour September Profile of the New Brunswick Labour Force
 Post-Secondary Education, Training and Labour September 2018 Profile of the New Brunswick Labour Force Contents Population Trends... 2 Key Labour Force Statistics... 5 New Brunswick Overview... 5 Sub-Regional
The Brookings Institution Metropolitan Policy Program Alan Berube, Fellow
 The Brookings Institution Metropolitan Policy Program Alan Berube, Fellow Confronting Concentrated Poverty in Fresno Fresno Works for Better Health September 6, 2006 Confronting Concentrated Poverty in
THE LOUISIANA SURVEY 2017
 THE LOUISIANA SURVEY 2017 Public Approves of Medicaid Expansion, But Remains Divided on Affordable Care Act Opinion of the ACA Improves Among Democrats and Independents Since 2014 The fifth in a series
Peruvians in the United States
 Peruvians in the United States 1980 2008 Center for Latin American, Caribbean & Latino Studies Graduate Center City University of New York 365 Fifth Avenue Room 5419 New York, New York 10016 212-817-8438
The Economic Impact of Oaklawn Hospital on the Marshall Area
 Reports Upjohn Research home page 2010 The Economic Impact of Oaklawn Hospital on the Marshall Area George A. Erickcek W.E. Upjohn Institute, erickcek@upjohn.org Citation Erickcek, George. 2010. "The Economic
Beyond cities: How Airbnb supports rural America s revitalization
 Beyond cities: How Airbnb supports rural America s revitalization Table of contents Overview 03 Our growth in rural areas 04 Creating opportunity 05 Helping seniors and women 07 State leaders in key categories
WYOMING POPULATION DECLINED SLIGHTLY
 FOR IMMEDIATE RELEASE Wednesday, December 19, 2018 Contact: Dr. Wenlin Liu, Chief Economist WYOMING POPULATION DECLINED SLIGHTLY CHEYENNE -- Wyoming s total resident population contracted to 577,737 in
Explaining the 40 Year Old Wage Differential: Race and Gender in the United States
 Explaining the 40 Year Old Wage Differential: Race and Gender in the United States Karl David Boulware and Jamein Cunningham December 2016 *Preliminary - do not cite without permission* A basic fact of
FUTURE OF GROWTH IN SAN DIEGO: THE ECONOMIC CASE FOR INCLUSION PRODUCED BY
 FUTURE OF GROWTH IN SAN DIEGO: THE ECONOMIC CASE FOR INCLUSION PRODUCED BY SAN DIEGO S ECONOMIC IMPERATIVE FOR INCLUSION The growth of San Diego s innovation economy has made the region better educated
New data from the Census Bureau show that the nation s immigrant population (legal and illegal), also
, also") Backgrounder Center for Immigration Studies October 2011 A Record-Setting Decade of Immigration: 2000 to 2010 By Steven A. Camarota New data from the Census Bureau show that the nation s immigrant population
Backgrounder Center for Immigration Studies October 2011 A Record-Setting Decade of Immigration: 2000 to 2010 By Steven A. Camarota New data from the Census Bureau show that the nation s immigrant population
Growth in the Foreign-Born Workforce and Employment of the Native Born
 Report August 10, 2006 Growth in the Foreign-Born Workforce and Employment of the Native Born Rakesh Kochhar Associate Director for Research, Pew Hispanic Center Rapid increases in the foreign-born population
Are Republicans Sprawlers and Democrats New Urbanists? Comparing 83 Sprawling Regions with the 2004 Presidential Vote
 Are Republicans Sprawlers and Democrats New Urbanists? Comparing 83 Sprawling Regions with the 2004 Presidential Vote Stephen L. Sperry Associate Professor Clemson University College of Architecture, Arts
The Impact of Ebbing Immigration in Los Angeles: New Insights from an Established Gateway
 The Impact of Ebbing Immigration in Los Angeles: New Insights from an Established Gateway Julie Park and Dowell Myers University of Southern California Paper proposed for presentation at the annual meetings
Racial Disparities in Youth Commitments and Arrests
 Racial Disparities in Youth Commitments and Arrests Between 2003 and 2013 (the most recent data available), the rate of youth committed to juvenile facilities after an adjudication of delinquency fell
THE LOUISIANA SURVEY 2018
 THE LOUISIANA SURVEY 2018 Criminal justice reforms and Medicaid expansion remain popular with Louisiana public Popular support for work requirements and copayments for Medicaid The fifth in a series of
U.S. Emerging Markets: The Rise of America s Sunbelt Cities and the Implications for Real Estate
 PUB LI C SECUR I T I E S G R O UP i 3Q 2018 R E AL E S TAT E U.S. Emerging Markets: The Rise of America s Sunbelt Cities and the Implications for Real Estate EXECUTIVE SUMMARY Recent high-profile corporate
Regional Variations in Public Opinion on the Affordable Care Act
 Journal of Health Politics, Policy and Law Advance Publication, published on September 26, 2011 Report from the States Regional Variations in Public Opinion on the Affordable Care Act Mollyann Brodie Claudia
US Undocumented Population Drops Below 11 Million in 2014, with Continued Declines in the Mexican Undocumented Population
 Drops Below 11 Million in 2014, with Continued Declines in the Mexican Undocumented Population Robert Warren Center for Migration Studies Executive Summary Undocumented immigration has been a significant
5A. Wage Structures in the Electronics Industry. Benjamin A. Campbell and Vincent M. Valvano
 5A.1 Introduction 5A. Wage Structures in the Electronics Industry Benjamin A. Campbell and Vincent M. Valvano Over the past 2 years, wage inequality in the U.S. economy has increased rapidly. In this chapter,
Chapter 6 Shaping an Abundant Land. Page 135
 Chapter 6 Shaping an Abundant Land Page 135 Waves of immigrants came to the U.S. in order to find a better life. Push-pull factors were at play. Immigration is not the only movement of people in the U.S.
LOOKING FORWARD: DEMOGRAPHY, ECONOMY, & WORKFORCE FOR THE FUTURE
 LOOKING FORWARD: DEMOGRAPHY, ECONOMY, & WORKFORCE FOR THE FUTURE 05/20/2016 MANUEL PASTOR @Prof_MPastor U.S. Change in Youth (
The State of Working Wisconsin 2017
 The State of Working Wisconsin 2017 Facts & Figures Facts & Figures Laura Dresser and Joel Rogers INTRODUCTION For more than two decades now, annually, on Labor Day, COWS reports on how working people
Gone to Texas: Migration Vital to Growth in the Lone Star State. Pia Orrenius Federal Reserve Bank of Dallas June 27, 2018
 Gone to Texas: Migration Vital to Growth in the Lone Star State Pia Orrenius Federal Reserve Bank of Dallas June 27, 2018 Roadmap History/Trends in migration to Texas Role in economic growth Domestic migration
POPULATION STUDIES RESEARCH BRIEF ISSUE Number
 POPULATION STUDIES RESEARCH BRIEF ISSUE Number 2008021 School for Social and Policy Research 2008 Population Studies Group School for Social and Policy Research Charles Darwin University Northern Territory
INEQUALITY: POVERTY AND WEALTH CHAPTER 2
 INEQUALITY: POVERTY AND WEALTH CHAPTER 2 Defining Economic Inequality Social Stratification- rank individuals based on objective criteria, often wealth, power and/or prestige. Human beings have a tendency
Integrating Latino Immigrants in New Rural Destinations. Movement to Rural Areas
 ISSUE BRIEF T I M E L Y I N F O R M A T I O N F R O M M A T H E M A T I C A Mathematica strives to improve public well-being by bringing the highest standards of quality, objectivity, and excellence to
Demographic, Economic and Social Transformations in Bronx Community District 4: High Bridge, Concourse and Mount Eden,
 Center for Latin American, Caribbean & Latino Studies Graduate Center City University of New York 365 Fifth Avenue Room 5419 New York, New York 10016 Demographic, Economic and Social Transformations in
A PATHWAY TO THE MIDDLE CLASS: MIGRATION AND DEMOGRAPHIC CHANGE IN PRINCE GEORGE S COUNTY
 A PATHWAY TO THE MIDDLE CLASS: MIGRATION AND DEMOGRAPHIC CHANGE IN PRINCE GEORGE S COUNTY Brooke DeRenzis and Alice M. Rivlin The Brookings Greater Washington Research Program April 2007 ACKNOWLEDGEMENTS
IMMIGRANTS. Udall Center for Studies in Public Policy The University of Arizona
 ECONOMIC CONTRIBUTIONS of IMMIGRANTS IN THE UNITED STATES A Regional and State-by-State Analysis JUDITH GANS Udall Center for Studies in Public Policy The University of Arizona research support provided
3Demographic Drivers. The State of the Nation s Housing 2007
 3Demographic Drivers The demographic underpinnings of long-run housing demand remain solid. Net household growth should climb from an average 1.26 million annual pace in 1995 25 to 1.46 million in 25 215.
Turning Missed Opportunities Into Realized Ones The 2014 Hollywood Writers Report
 Turning Missed Opportunities Into Realized Ones The 2014 Hollywood Writers Report Commissioned by the Writers Guild of America, West (WGAW), The 2014 Hollywood Writers Report provides an update on the
Rural America At A Glance
 Rural America At A Glance 7 Edition Between July 5 and July 6, the population of nonmetro America grew.6 percent. Net domestic migration from metro areas accounted for nearly half of this growth. Gains
THE EFFECT OF EARLY VOTING AND THE LENGTH OF EARLY VOTING ON VOTER TURNOUT
 THE EFFECT OF EARLY VOTING AND THE LENGTH OF EARLY VOTING ON VOTER TURNOUT Simona Altshuler University of Florida Email: simonaalt@ufl.edu Advisor: Dr. Lawrence Kenny Abstract This paper explores the effects
Immigrants are playing an increasingly
 Trends in the Low-Wage Immigrant Labor Force, 2000 2005 THE URBAN INSTITUTE March 2007 Randy Capps, Karina Fortuny The Urban Institute Immigrants are playing an increasingly important role in the U.S.
STATE LAWS SUMMARY: CHILD LABOR CERTIFICATION REQUIREMENTS BY STATE
 STATE LAWS SUMMARY: CHILD LABOR CERTIFICATION REQUIREMENTS BY STATE THE PROBLEM: Federal child labor laws limit the kinds of work for which kids under age 18 can be employed. But as with OSHA, federal
Working Overtime: Long Commutes and Rent-burden in the Washington Metropolitan Region
 Working Overtime: Long Commutes and Rent-burden in the Washington Metropolitan Region By Kathryn Howell, PhD Research Associate George Mason University School of Public Policy Center for Regional Analysis
The Great Immigration Turnaround
 The Great Immigration Turnaround New Facts and Old Rhetoric Dowell Myers USC Sol Price School of Public Policy Overview Where is immigration growing fastest? Divided opinion and fears about immigration
Youth labour market overview
 1 Youth labour market overview With 1.35 billion people, China has the largest population in the world and a total working age population of 937 million. For historical and political reasons, full employment
EMBARGOED UNTIL THURSDAY 9/5 AT 12:01 AM
 EMBARGOED UNTIL THURSDAY 9/5 AT 12:01 AM Poverty matters No. 1 It s now 50/50: chicago region poverty growth is A suburban story Nationwide, the number of people in poverty in the suburbs has now surpassed
The Gender Wage Gap in Durham County. Zoe Willingham. Duke University. February 2017
 1 The Gender Wage Gap in Durham County Zoe Willingham Duke University February 2017 2 Research Question This report examines the size and nature of the gender wage gap in Durham County. Using statistical
News Release Issued: Thursday 27 July, 2017
 News Release Issued: Thursday 7 July, 07 US Cities, Metro and Counties Outlook 07 0 America s burbs boosted as millennials take flight from high-cost coastal cities and retirees head for exurbs and rural
State. of the. Cities
 2013 State of the Cities INTRODUCTION When you think of a Florida city, what does it look like? Jacksonville? Miami? Orlando? In reality, Florida is a state of small cities. Nearly half of Florida cities
Poverty data should be a Louisiana wake-up call
 Poverty data should be a Louisiana wake-up call While the national economy continues to gain momentum, far too many families in Louisiana continue to be left behind. Data released this week by the U.S.
TABLE OF CONTENTS. Introduction. Identifying the Importance of ID. Overview. Policy Recommendations. Conclusion. Summary of Findings
 1 TABLE OF CONTENTS Introduction Identifying the Importance of ID Overview Policy Recommendations Conclusion Summary of Findings Quick Reference Guide 3 3 4 6 7 8 8 The National Network for Youth gives
Washington Area Economy: Performance and Outlook
 Washington Area Economy: Performance and Outlook Presentation to: Arlington Economic Development Commission Mark C. White, Ph.D. Deputy Director Center for Regional Analysis Schar School of Policy and
EXECUTIVE SUMMARY: CITY OF BELLINGHAM RESIDENTIAL SURVEY REPORT
 EXECUTIVE SUMMARY: CITY OF BELLINGHAM RESIDENTIAL SURVEY REPORT CENTER FOR ECONOMIC AND BUSINESS RESEARCH February 21, 2017 Prepared for The City of Bellingham Author(s) Isabel Vassiliadis Hart Hodges,
U.S. Immigration Policy
 U.S. Immigration Policy Potential Impact on CRE September 2017 Introduction U.S. Immigration Policy Potential Impact on CRE SIGNIFICANT OVERHAUL OF IMMIGRATION LEGISLATION PROPOSED In early August, the
2010 CENSUS POPULATION REAPPORTIONMENT DATA
 Southern Tier East Census Monograph Series Report 11-1 January 2011 2010 CENSUS POPULATION REAPPORTIONMENT DATA The United States Constitution, Article 1, Section 2, requires a decennial census for the
Riverside Labor Analysis. November 2018
 November 2018 The City of Labor Market Dynamics and Local Cost of Living Analysis Executive Summary The City of is located in one of the fastest growing parts of California. Over the period 2005-2016,
KENAN INSTITUTE WHITE PAPER
 KENAN INSTITUTE WHITE PAPER JANUARY 1, 2018 LEVERAGING NORTH CAROLINA S MIGRATION DIVIDEND UISC01201801 James H. Johnson, Jr., Ph.D Allan M. Parnell, Ph.D Frank Hawkins Kenan Institute of Private Enterprise
STATE OF THE STATE MSFCA Strategic Long Range Plan
 STATE OF THE STATE - 2016 MSFCA Strategic Long Range Plan Background Research What are the current hot issues affecting the Minnesota Fire Service in 2016. Includes numerous reports/references. See appendix
Housing Portland s Families A Background Report for a Workshop in Portland, Oregon, July 26, 2001, Sponsored by the National Housing Conference
 Housing Portland s Families A Background Report for a Workshop in Portland, Oregon, July 26, 2001, Sponsored by the National Housing Conference by Barry Edmonston and Risa Proehl Housing Portland s Families